
Spatial distribution of supraglacial debris thickness on glaciers of the China-Pakistan Economic Corridor and surroundings
2020-03-29 08:06:48YaJieZhengYongZhangJuGuXinWangZongLiJiangJunFengWei
YaJie Zheng,Yong Zhang,Ju Gu,Xin Wang,ZongLi Jiang,JunFeng Wei
School of Resource Environment and Safety Engineering, Hunan University of Science and Technology, Xiangtan, Huan 411201,China
ABSTRACT Debris-covered glaciers, characterized by the presence of supraglacial debris mantles in their ablation zones, are wide‐spread in the China-Pakistan Economic Corridor (CPEC) and surroundings. For these glaciers, thin debris layers acceler‐ate the melting of underlying ice compared to that of bare ice, while thick debris layers retard ice melting, called debriscover effect.Knowledge about the thickness and thermal properties of debris cover on CPEC glaciers is still unclear,mak‐ing it difficult to assess the regional debris-cover effect.In this study,thermal resistance of the debris layer estimated from remotely sensed data reveals that about 54.0%of CPEC glaciers are debris-covered glaciers,on which the total debris-cov‐ered area is about 5,072 km2,accounting for 14.0%of the total glacier area of the study region.We find that marked differ‐ence in the extent and thickness of debris cover is apparent from region to region,as well as the debris-cover effect.53.3%of the total debris-covered area of the study region is concentrated in Karakoram,followed by Pamir with 30.2%of the to‐tal debris-covered area.As revealed by the thermal resistance,the debris thickness is thick in Hindu Kush on average,with the mean thermal resistance of 7.0×10⁻² ((m2?K)/W), followed by Karakoram, while the thickness in western Himalaya is thin with the mean value of 2.0×10⁻²((m2?K)/W).Our findings provide a basis for better assessments of changes in debriscovered glaciers and their associated hydrological impacts in the CPEC and surroundings.
Keywords:debris thickness;debris-cover effect;thermal resistance;ice melting;CPEC
1 Introduction
The China-Pakistan Economic Corridor (CPEC)runs through the confluence of Pamir, Hindu Kush,Karakoram, and western Himalaya, which is the most glacierized area in the middle and low latitudes of the world (Immerzeelet al., 2020). These glaciers are at the headwaters of the Gaizi, Yarkant,Amu Darya, In‐dus and Ganges rivers (Yaoet al., 2012; Immerzeelet al., 2020), making the role of glacier meltwater in these basins very significant (Yaoet al., 2012; Lutzet al., 2014), especially during dry seasons. Therefore,glacier changes in different spatial and temporal scales will affect the water discharge of these glacierfed basins in the CPEC and surroundings, which in turn have an influence on sustainable utilization and management of water resources downstream (Pritchard,2019;Immerzeelet al.,2020).
In the CPEC and surroundings, debris-covered glaciers are widely distributed (M?lget al., 2018;Scherleret al., 2018), which feature the presence of supraglacial debris in their ablation zones. The ice melting process beneath the debris cover is different from those of bare ice and snow due to the unique thermal process of the debris layer(?strem,1959;Na‐kawo and Young, 1981; Mattsonet al., 1993; Kayast‐haet al., 2000). A thin debris layer accelerates ice melting compared to that of bare ice, while thick de‐bris cover suppresses ice melting (?strem, 1959; Na‐kawo and Young, 1981; Mattsonet al., 1993; Kayast‐haet al., 2000), hereafter called the debris-cover ef‐fect. Consequently, the different distribution of debris cover on the glacier largely affects the ice melt rate and its spatial distribution, with important conse‐quences for the formation and changes of runoff in the glacier-fed basins (Zhanget al., 2007; Liu and Liu, 2012; Fujita and Sakai, 2014; Zhanget al., 2015;Mileset al., 2018). Runoff observation on the Baltoro Glacier in the Karakoram Mountains found that due to the difference in the thickness and area distribution of the debris at different altitudes in the ablation area,the runoff depth is larger in the middle part of the gla‐cier,while the depth is smaller in the terminus and up‐per part (Liet al., 1981). In the Trambau Glacier ba‐sin of Nepal Himalaya, although the debris covers on‐ly 15.1% of the total catchment area, meltwater origi‐nating from the debris-covered surface contributes about 55.5% of the total runoff, especially at the low‐er altitude of the debris-covered area (Fujita and Sakai, 2014). Catchment runoff estimation found that 70.0% of the increase in total meltwater comes from the debris-covered surface in the Hailuogou catch‐ment of southeastern Tibetan Plateau over the past 30 years (Zhanget al., 2019). Observations on different glaciers have confirmed that as the glaciers continue to retreat,the extent of debris cover shows an increas‐ing trend (Kirkbride and Deline, 2013; Scherleret al.,2018; Xieet al., 2020). Thus, the impact of debris cover mentioned above is expected to become more significant in the future.
The information on debris extent on glaciers of the CPEC and surroundings has been obtained based on different remote sensing image data (Kraaijenbrinket al., 2017; M?lget al., 2018; Scherleret al., 2018;Xieet al.,2020),but field observation of debris thick‐ness is only conducted on a few glaciers of this region(Mihalceaet al., 2008; Mayeret al., 2010; Collieret al., 2015; Ashraf and Khan, 2017; Gibsonet al.,2017). Several studies attempted to obtain the spatial distribution of debris thickness based on the empirical relationship between observed debris thickness and surface temperature derived from remotely sensed im‐agery (Mihalceaet al., 2008; Gibsonet al., 2017;Grooset al., 2017); however, the method is not suit‐able for the region with a thick debris layer(Racovite‐anuet al., 2009; Zhang and Liu, 2017). Consequently,knowledge about the spatial distribution of debris thickness on CPEC glaciers is still unclear, leading to generally simplify or parameterize the spatial hetero‐geneity of debris thickness and the physical process of its influence in current studies (Immerzeelet al.,2012; Lutzet al., 2014; Kraaijenbrinket al., 2017;Rounceet al., 2020). The existing models of these studies have insufficient ability to describe the physi‐cal process of the debris-cover effect, which is one of the important sources of uncertainties in glacier mass balance and runoff simulations and future projections of debris-covered glaciers (Rounceet al., 2020).Therefore, information on the spatial distribution of debris thickness is an important problem that desider‐ates to be solved to investigate the changes of debriscovered glaciers and their associated hydrological im‐pacts in the CPEC and surroundings.
The main objective of this study is to obtain the spatial distribution of thermal resistance of the debris layer on CPEC glaciers based on remotely sensed im‐agery, in which the thermal resistance is defined as the ratio of debris thickness to its thermal conductivi‐ty (Nakawo and Young, 1981, 1982). The parameter of the thermal resistance has been confirmed to reflect large-scale variations in the extent and thickness of the debris layer (Suzukiet al., 2007; Zhanget al.,2011; Fujita and Sakai, 2014; Zhanget al., 2016).Then, we analyze the spatial characteristics of debris cover throughout the ablation zones of glaciers and as‐sociated influences in the study region. Overall, our study provides a dataset of the spatial distribution of debris thickness at a regional scale, which is a neces‐sary first step toward understanding the changes in de‐bris-covered glaciers and their responses to climate change and associated hydrological impacts in the CPEC and surroundings.
2 Study area
The study area stretches over about 300,000 km2and comprises Pamir, Hindu Kush, Karakoram and western Himalaya (Figure 1). It contains 30,532 gla‐ciers with a total area of 37,004 km2and an elevation range of about 2,300?8,600 m a.s.l., in which 28 gla‐ciers have an area of larger than 100 km2(RGI Con‐sortium, 2017). Compared to other regions in High Mountain Asia, glacier changes are more complex in the study region, where glacier retreat, stability and advance coexist (Hewitt, 2011; Yaoet al., 2012;Bhambriet al., 2013) and the mass balance of some glaciers remains stable or even slightly positive(Gardelleet al., 2012; K??bet al., 2015). In Kara‐koram,more than 50% of glaciers experience advance or stability (Iturrizaga, 2011; Gardelleet al., 2012),which is in sharp contrast to the negative mass bal‐ance of glaciers in Hindu Kush-Himalaya (Cogleyet al., 2011). An important characteristic of some gla‐ciers in the study area is a supraglacial debris cover(M?lget al., 2018; Scherleret al., 2018). The debriscovered area accounts for 9%?11%of the total glacier area in Karakoram and Pamir-Alai, while it represents about 18% in Hindu Kush and western Himalaya(Scherleret al.,2018).
The study area is under the influence of two wind systems: the westerly and the Indian summer mon‐soon. Westerly flow dominates in Pamir and the ma‐jor part of Karakoram throughout the year (Singhet al., 1995; Bookhagen and Burbank, 2010), while the influence of the Indian summer monsoon is continu‐ously stronger from east to south (Archer and Fowler,2004). Precipitation occurs mainly during winter and spring for most of the study area (Archer and Fowler,2004; Bookhagen and Burbank, 2010). Precipitation in the inland and eastern areas of the mountain ranges(eastern Pamir,central Karakoram)becomes less com‐pared to that in the outer western areas (western Pamir, Hindu Kush and southeast Karakoram) (Lutzet al.,2014).
3 Material and methods
3.1 Data description
We use various datasets in this study, including glacier inventory data, debris extent of the study area,field surveys of debris thickness and ablation, Ad‐vanced Spaceborne Thermal Emission and Reflection Radiometer (ASTER) images, solar radiation fluxes,and a digital elevation model (DEM). These datasets are briefly described below.
The Randolph Glacier Inventory Version 6.0(RGI 6.0) (RGI Consortium, 2017) was used to ob‐tain glacier information required for this study, in‐cluding glacier area,glacier outlines,and median ele‐vation. Two existing datasets of debris extent were used to evaluate our results, which are derived from M?lget al.(2018) and Scherleret al.(2018), hereaf‐ter called the M2018 and S2018 datasets. For the M2018 dataset, the debris-cover extent in Kara‐koram and Pamir was obtained through visual inter‐pretation based on Landsat and ALOS1-PALSAR1 images(M?lget al.,2018),whereas the S2018 datas‐et is a global dataset of supraglacial debris-cover ex‐tent, which was obtained using three different algo‐rithms of the red to short-wavelength infrared (SWIR)band ratio, the normalized difference snow index and linear spectral unmixing-derived fractional de‐bris cover based on Landsat 8 and Sentinel-2 images(Scherleret al.,2018).
Field observations of debris thickness and glacier ablation were carried out on the Hinarche (Mayeret al., 2010), Baltoro (Mihalceaet al., 2008; Collieret al., 2015), Biafo, and Barpu glaciers (Ashraf and Khan, 2016, 2017) during different periods (Figure 1). Observations on the Baltoro Glacier were mainly conducted at an elevation range of 2,704?3,169 m a.s.l.(Mihalceaet al.,2008;Collieret al.,2015),where the debris thickness gradually decreases from 0.14 m to 0.02 m with the elevation increasing (Collieret al.,2015) and ablation corresponding to the debris thick‐ness varies from 0.025 m/d to 0.058 m/d (Mihalceaet al., 2008). Observations on the Biafo Glacier were carried out between 3,602 and 4,165 m a.s.l. and its distribution is more discrete (Ashraf and Khan, 2016,2017). The observed points on the Hinarche Glacier are densely concentrated at the terminus, and the ele‐vation varies from 2,704 to 3,169 m a.s.l..For the Bar‐pu Glacier, observations are mainly located at an ele‐vation of 2,947 m a.s.l..
For mapping the spatial distribution of the ther‐mal resistance of the debris cover in the CPEC and surroundings, we combined ASTER images with the solar radiation fluxes.A total of 180 clear-sky ortho‐rectified ASTER images were used, which were ob‐tained from the National Aeronautics and Space Ad‐ministration (NASA). As presented in Figure 2, the acquisition time of these ASTER images is mainly concentrated at the end of the melt season over the period of 2001?2019. ASTER is comprised of three visible and near-infrared bands (VNIR, 0.4?0.9 μm),six shortwave infrared bands (SWIR, 1.0 ?2.5 μm),and five thermal infrared bands (TIR, 3.0 ?12 μm).The ASTER VNIR and TIR bands were used in this study,and their spatial resolutions are 15 m and 90 m,respectively. The solar radiation fluxes were ob‐tained from US National Centers for Environmental Prediction (NCEP)/US National Center for Atmo‐spheric Research (NCAR) reanalysis data with a spa‐tial resolution of 2.5° (Kalnayet al., 1996), which correspond to the nearest time and location of AS‐TER acquisition.
In addition,a DEM was used to retrieve the topo‐graphic information of glaciers and their debris cov‐er areas. The Shuttle Radar Topographic Mission(SRTM) DEM (https://gdex.cr.usgs.gov/gdex/) was used for this purpose.The spatial resolution of SRTM DEM is 30 m.
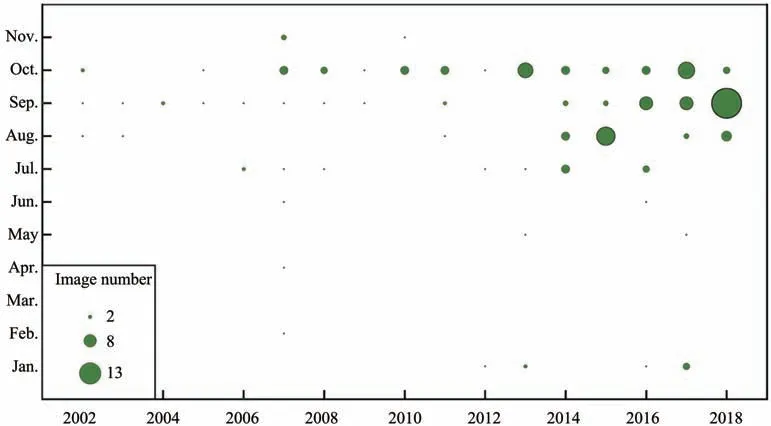
Figure 2 Acquisition time of ASTER images used in this study
3.2 Methods
The thermal resistance of a debris layer is defined as debris thickness divided by thermal conductivity of the debris layer (Nakawo and Young, 1981; Nakawo and Young,1982),which is calculated as
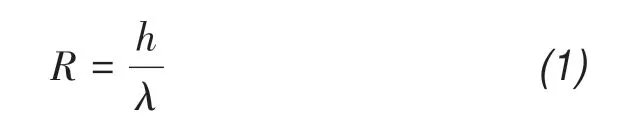
whereR,handλare the thermal resistance((m2?K)/W),debris thickness(m)and thermal conductivity(W/(m?K))of the debris layer,respectively.
The thermal resistance of the debris layer is one of the important parameters for the simulation of the ice melt rate under the debris layer,which has been wide‐ly used on different debris-covered glaciers (Nakawo and Rana, 1999; Suzukiet al., 2007; Zhanget al.,2011; Fujita and Sakai, 2014; Rounce and McKinney,2014; Zhanget al., 2016). Thermal resistance of the debris layer can serve as the proxy for the spatial dis‐tribution of debris thickness at a large scale (Zhanget al., 2011; Fujita and Sakai, 2014; Zhanget al., 2016).The thickness and thermal conductivity of the debris layer are required parameters for calculating the ther‐mal resistance, but field determinations of these pa‐rameters are especially time-consuming and unrealis‐tic at a large scale.
For the debris-covered surface, the conductive heat flux is the only heat flux through the debris layer to reach the glacier ice, based on simplifying assump‐tions of a linear temperature profile within the debris layer and the constant heat flux stored in the debris layer from day to day (Kraus, 1975; Nakawo and Young, 1981; Nicholson and Benn, 2006). Then, the conductive heat flux through the debris layer can be described as a function of surface temperature, tem‐perature at the debris-ice surface and thermal resis‐tance.Also, the conductive heat flux from the surface toward the debris-ice interface can be described as a residual term of the energy balance at the debris-cov‐ered surface. Therefore, the conductive heat flux (QG)can be calculated as
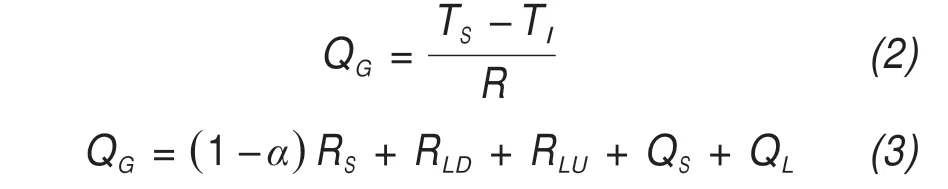
whereRSis the downward short-wave radiation flux(W/m2),RLDandRLUare the downward and upward long-wave radiation fluxes (W/m2), respectively,QSandQLare the net sensible and latent heat fluxes (W/m2),respectively,α is the albedo of the debris-covered sur‐face,TSis the debris surface temperature(°C),andTIis the surface temperature of the debris-ice interface(°C),which is assumed to be the melting point.
Field observations on different debris-covered glaciers in the Tibetan Plateau and surroundings found that the net radiation is generally the dominant heat source and the contribution of the turbulent heat fluxes to the total energy balance is normally small(Mattson and Gardner, 1989; Takeuchiet al., 2000;Nicholson and Benn, 2006; Suzukiet al., 2007;Zhanget al., 2011). This is especially true in clearsky conditions, which is required for remote sensing data utilization. Therefore, assuming the turbulent heat fluxes were zero, thermal resistance of the de‐bris layer at a given point on the glacier can be esti‐mated from solar radiation fluxes, surface albedo,and surface temperature without knowing the thick‐ness and thermal conductivity of the debris layer.Surface temperature is calculated from an average of five TIR bands of ASTER using the formula de‐scribed in Alley and Nilsen (2001).Then, the surface temperature is given as
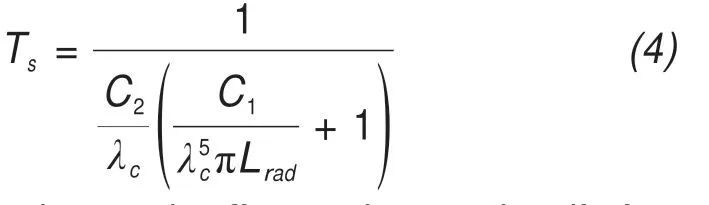
whereC1andC2denote the first and second radiation constants,λcis the wavelength of emitted radiance for a thermal band, andLradis the emitted radiance for a thermal band. Surface albedo is estimated from three VNIR bands of ASTER using the equation proposed by Yükselet al.(2008), in which DN values of the sensor measurement are first converted intoLrad, and then the sensor detected radiance was transferred into the surface albedo.Then,the albedo is calculated as
in whichzis solar zenith angle,dis earth-sun distance(in astronomical units),ESUNiis mean solar exoatmo‐spheric irradiance of each band, which is calculated by convolving the ASTER spectral response func‐tions. Then, combined with surface downward radia‐tion fluxes from NCEP/NCAR reanalysis data at the timing and location closest to ASTER acquisition, we calculated the thermal resistance of the debris layers on the CPEC glaciers. The pixel size of ASTER TIR image is 90 m and the thermal resistance is calculated using this same resolution.
According to the spatial distribution of ASTERderived thermal resistance of the debris cover, gla‐ciers in the CPEC and surroundings are divided as de‐bris-covered (R>0; hereafter called TR dataset) and debris-free(R≤0)surfaces.Then we analyzed the spa‐tial feature of the extent and thickness of the debris layer on the CPEC glaciers. Here we only considered the region below the median elevation of the glacier,which can be an indication of the equilibrium-line alti‐tude (ELA) and climatic differences (Haeberli and H?lzle, 1995; Braithwaite and Raper, 2009; Sakaiet al.,2015).
4 Results
4.1 Comparison of thermal resistance, debris thickness and satellite-derived debris-cover extent
Figure 3 shows the spatial distribution of AS‐TER-derived thermal resistance of the debris layer on the CPEC glaciers. The mean thermal resistance of the debris layer on the CPEC glaciers is about 3.8×10⁻²((m2?K)/W).High values of thermal resistanc‐es are generally observed at glacier termini,while low values are mainly found in the upper reaches of gla‐ciers (Figure 3). This spatial trend is consistent with observed spatial patterns of debris thickness on differ‐ent debris-covered glaciers (Nakawoet al., 1986; Mi‐halceaet al., 2008; Zhanget al., 2011; Rounce and McKinney, 2014),i.e., debris thickness increasing to‐ward downglacier. A comparison of ground-surveyed debris thicknesses and ASTER-derived thermal resis‐tances of debris layers on different glaciers is present‐ed in Figure 4. Our analysis shows that ASTER-de‐rived thermal resistances are highly correlated to ob‐served debris thicknesses on the Baltoro, Hinarche and Biafo glaciers, yielding correlation coefficients of 0.90, 0.86 and 0.79 (significance levelp<0.05), re‐spectively. More importantly, the along-glacier pat‐tern of ASTER-derived thermal resistance corresponds well with the spatial distribution of observed debris thickness (Figure 4). Therefore, our results support that ASTER-derived thermal resistance can be used as a proxy of the spatial distribution of debris thickness on CPEC glaciers.
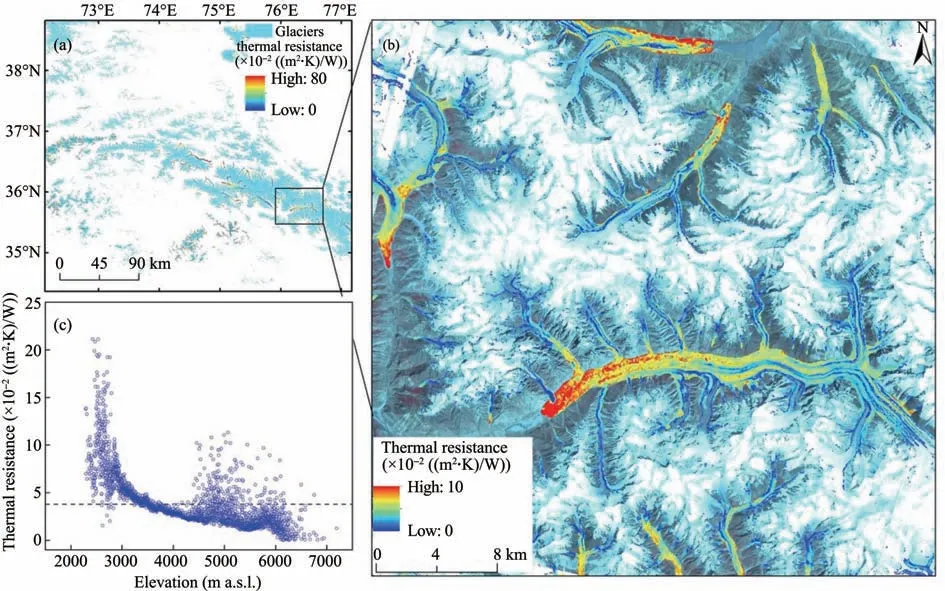
Figure 3 Spatial distribution of ASTER-derived thermal resistances of debris layers on the entire CPEC glaciers(a)and in a typical region(b),and variation in thermal resistance of the entire glaciers with altitude(c).Dash line denotes the average value of the thermal resistance of the debris layer
To evaluate the debris-cover extent revealed by ASTER-derived thermal resistance, we compared the TR dataset with existing M2018 and S2018 datasets.Our results indicate that the total area of debris-cov‐ered surface on the glaciers accounts for 12.0% of the total glacier area in the Karakoram and Pamir regions,which shows a very high agreement with those of M2018 (10.0%) and S2018 (11.0%) datasets. Figure 5a shows the area-altitude distribution of the debriscovered surface in the Karakoram and Pamir regions for three datasets. While the difference between our and two other datasets is slightly large in the area of higher elevation, three datasets show similar area-alti‐tude distributions of the debris-covered surface, espe‐cially the area at lower elevation (Figure 5a). Overall,our TR dataset is acceptable (Figure 5a). Therefore,we analyze the spatial characteristics of the extent and thickness of debris cover on glaciers of the CPEC and surroundings based on our ASTER-derived result.
4.2 Spatial distribution of debris cover in the CPEC and surroundings
According to the spatial distribution of ASTERderived thermal resistance, we find that the study re‐gion has extensive covers of supraglacial debris on the glaciers (Figure 5b), especially on larger gla‐ciers. Overall, debris-covered glaciers account for 54.0% of the total glacier number in the study re‐gion. Supraglacial debris covers an area of about 5,072 km2,representing 23.0%and 14.0%of total ab‐lation and glacier areas.Among these debris-covered glaciers, 653 glaciers have a debris-covered area of more than 1.0 km2with a total area of 3,422 km2, ac‐counting for 18.0% of the total glacier area of this type of glaciers.The study region contains 28 debriscovered glaciers with an area of more than 100 km2,on which the debris-covered percentages vary from 7.0%to 30.0%.
The area?altitude distribution of the debris-cov‐ered surface in the study region is presented in Fig‐ure 5b. The debris-covered surface occurs below 6,000 m a.s.l. in the study region. About 80.1% of the total debris-covered area is mainly distributed at an elevation range of 3,600 ?5,200 m a.s.l.. The mean thermal resistance of the debris layer in this el‐evation range is about 2.7×10?2((m2?K)/W), which is lower than the regional average of the thermal re‐sistance. Although the debris-covered surface be‐low 3,600 m a.s.l. only represents about 8.4% of the total debris-covered area of the region, debris cov‐ers most of the ablation zone (Figure 5b) with a de‐bris-covered percentage of 75.0%. In this region, the mean thermal resistance is about 6.5×10?2((m2?K)/W),which is significantly higher than the regional average.Over an elevation of 5,200 m a.s.l., the debris-covered area is relatively small with a debris-covered percent‐age of 1.8% (Figure 5b), and its mean value is about 2.0×10?2((m2?K)/W).
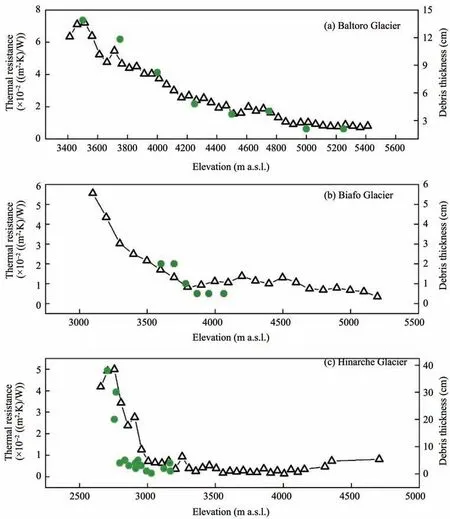
Figure 4 Comparison of ASTER-derived thermal resistance of the debris layer(line-symbol)and observed debris thickness(point)on the Baltoro(a),Biafo(b)and Hinarche(c)glaciers
Significant difference in the spatial distribution of debris cover is apparent from region to region (Table 1). The Pamir contains the largest number of debriscovered glaciers in the study region, followed by Karakoram, Hindu Kush and western Himalaya (Ta‐ble 1), while Karakoram has the largest debris-cov‐ered area, which accounts for 53.3% of the total de‐bris-covered area. Although the total debris-covered area in western Himalaya is smaller compared to oth‐er regions in the study region, the debris-covered pro‐portion is the largest in the study region (Table 1). In contrast, the debris-covered proportion in Karakoram and Pamir Mountains is relatively small in the study region, but the two regions have the larger area of de‐bris-covered surface (Table 1).According to the ther‐mal resistance of the debris layer,the average value in western Himalaya is smaller compared to other re‐gions, while the average value in the Hindu Kush Mountain is larger, which is about 7.2×10?2((m2?K)/W)(Table 1). It is revealed that the mean debris thickness in Hindu Kush is relatively thicker, while that in Hi‐malaya is thinner in the study region.
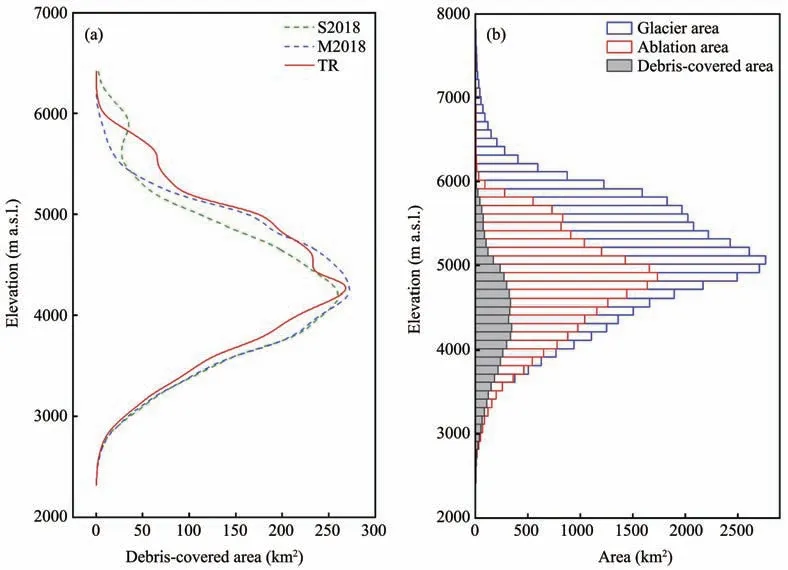
Figure 5 Comparison of the area-altitude distribution of debris-covered area in our TR,M2018 and S2018 datasets(a)and area?altitude distributions of the debris-covered,ablation and glacier areas of the study region(b)

Table1 Basic statistics of debris cover in different mountains of the study region.Glacier information is from RGI 6.0.DC indicates debris-covered,and R is the mean thermal resistance(×10?2((m2?K)/W))
5 Discussions
5.1 Uncertainty in debris-cover mapping by thermal resistance
In the calculation of thermal resistance, we as‐sumed that turbulent heat fluxes in the energy balance of the debris-covered surface were neglected, which may lead to uncertainty for our results.The uncertain‐ty caused by this assumption has been widely dis‐cussed in earlier studies on thermal resistance (Suzukiet al., 2007; Zhanget al., 2011; Fujita and Sakai,2014; Zhanget al., 2016). An experiment about this assumption was carried out on a glacier in Bhutan Hi‐malaya (Suzukiet al., 2007), which confirmed that considering turbulent heat fluxes or not in the energy balance of the debris-covered surface has little influ‐ence on the spatial variation of the thermal resistance based on field measurements. Combined with ASTER data, we utilized solar radiation fluxes from NCEP/NCAR reanalysis data at the timing and location clos‐est to ASTER acquisition to calculate thermal resis‐tance of the debris layer. The datasets used in this study are consistent with those in previous studies(Suzukiet al., 2007; Zhanget al., 2011; Fujita and Sakai, 2014; Zhanget al., 2016). In all previous stud‐ies,NCEP/NCAR solar radiation fluxes were not biascorrected and directly used in the calculation process,although their spatial resolutions are different.Howev‐er, results in previous studies have confirmed that the spatial patterns of thermal resistance of debris layers correspond well with observed patterns of debris thickness (Suzukiet al., 2007; Zhanget al., 2011; Fu‐jita and Sakai,2014;Zhanget al.,2016).In particular,thermal resistance of debris layers estimated from these datasets correlate well with observed debris thicknesses on the Hailuogou Glacier of southeastern Tibetan Plateau(Zhanget al.,2011).Furthermore,Fu‐jita and Sakai (2014) estimated thermal resistance of debris layers in a Himalayan glacier basin using the same approach and datasets, and then systematically evaluated the influences of the uncertainties caused by these factors mentioned above on melt beneath the debris or runoff. They found that uncertainty in thermal resistance of the debris layer together with the albedo contributes 8% of the total uncertainty in the runoff simulation, and especially the total uncer‐tainty caused by albedo is much larger than that caused by thermal resistance (Fujita and Sakai,2014). This implies that although there is the uncer‐tainty of thermal resistance caused by these factors mentioned above,its contribution to overall uncertainty is relatively small.
For mapping debris cover and its thermal proper‐ty, the main challenge we encountered is the correct delineation of debris-covered glacier parts due to the similar reflectance of debris with the surrounding ter‐rain (Racoviteanuet al., 2009). In this study, glacier outlines are derived from RGI 6.0,which is a globally complete dataset of digital polygons of glaciers other than ice sheets (RGI Consortium, 2017). At present,RGI 6.0 is a state-of-the-art glacier inventory based on multi-source remote sensing data and topographic maps, for which glacier inventories that contain de‐bris-covered glaciers depend partly on manual editing(RGI Consortium, 2017). Although inaccurate glacier outlines will lead to unavoidable errors of debris cover maps, as well as mismatches between the time when glacier delineation and debris cover mapping were ob‐tained, we made no effort to modify glacier outlines of RGI 6.0 in this study. Therefore, we did not consider the uncertainty caused by RGI glacier outlines in the debris-cover mapping by thermal resistance.
Two existing datasets of the debris-covered extent are used to evaluate the accuracy of our results de‐rived from the spatial distribution of thermal resis‐tance. Overall, three datasets show high agreement in the debris-covered proportion and the area-altitude distribution of the debris-covered area (Figure 5a).Compared to the S2018 dataset, the difference be‐tween our results and the M2018 dataset is relatively small (Figure 6a), especially for debris-covered gla‐ciers with an area of 1.0?100.0 km2. For debris-cov‐ered glaciers<1.0 km2,the differences between our re‐sults and M2018 and S2018 datasets are 182.0 and 80.0 km2, respectively, while the differences for gla‐ciers >100.0 km2are 239 and 349 km2. Furthermore,the debris-cover extent on glaciers <1.0 km2accounts for <10% of the total debris-cover extent, which may have little influence on our regional assessment. For glaciers >100.0 km2, we compare our results to M2018 and S2018 datasets(Figure 6b).It is found that our re‐sults show high agreement with M2018 and S2018 da‐tasets if the debris-cover extents of the Baltoro and Si‐achen glaciers are not considered(Figure 6b).M?lget al.(2018) found that cloud cover, mountain shadows,and the timing of image acquisition generally affect the accuracy of the results when using satellite imag‐es, and pointed out that it is better to not exceed 662 km2for the uncertainty.Therefore, our results de‐rived from the spatial distribution of thermal resis‐tance can be acceptable for our regional analysis.
5.2 Regional differences in debris thickness
The thermal resistance of the debris layer can ef‐fectively reflect spatial distribution characteristics of the debris thickness at a large scale, which has been widely used on different debris-covered glaciers (e.g.,Nakawoet al.,1999;Suzukiet al.,2007;Zhanget al.,2011; Fujita and Sakai, 2014; Rounce and McKinney,2014; Zhanget al., 2016). Table 2 shows the average thermal resistances of debris layers on different gla‐ciers, which indicates significant differences in ther‐mal resistance from region to region. Among these glaciers, the average thermal resistance of Mount Gongga glaciers (Zhanget al., 2016) and Ngozumba Glacier (Suzukiet al., 2007) are similar to that of glaciers in our study region, implying that the debris thickness of the study region is similar with those glaciers. In contrast, the thermal resistance on gla‐ciers in other regions are significantly larger than those of the above glaciers and our study region (Ta‐ble 2). Therefore, the considerable difference in the thermal resistance between glaciers of our study re‐gion and other regions implies marked differences in debris thickness.
5.3 Debris-cover effect
Field observations and experiments revealed a crit‐ical thickness, which is about 0.02?0.03 m (?strem,1959;Nakawo and Young,1981;Mattsonet al.,1993;Kayasthaet al., 2000). Debris layers with the thick‐ness of less than the critical thickness accelerate the ice melting rate (called acceleration effect), while de‐bris layers thicker than this value suppress the ice melting rate (called insulation effect) (?strem, 1959;Nakawo and Young, 1981; Mattsonet al., 1993; Kay‐asthaet al.,2000).In the study region,only a few gla‐ciers have field observations of debris thickness and ablation (Figure 7) (Mihalceaet al., 2008; Mayeret al.,2010;Collieret al.,2015;Ashraf and Khan,2016,2017;Gibsonet al.,2017).On the Biafo Glacier,field ablation observations indicate that the ice melt rate be‐neath the debris layer with a thickness of 0.01 m in‐creases by about 19.0%compared to that at the debrisfree surface, while the melt rate decreases by 34.0%beneath the debris cover with a thickness of 0.07 m.Observed debris thickness varies from 0.02 to 0.1 m on the Barpu Glacier (Ashraf and Khan, 2017), where field ablation observations find that the presence of debris cover inhibits the ice melting for most ablation observation sites and the mean ice melt rate decreases by 26.0% compared with the debris-free area.In addi‐tion, the insulation effect of the debris cover is domi‐nant on the Baltoro (Mihalceaet al., 2008; Collieret al., 2015) and Hinarche (Mayeret al., 2010) glaciers,and the mean melt rates at the debris-covered surface decrease by 22% and 30% compared to the debrisfree surface (Mihalceaet al., 2008; Mayeret al.,2010), respectively. Overall, the debris-cover effect varies significantly on glaciers in the study region,but the insulation effect is dominant.
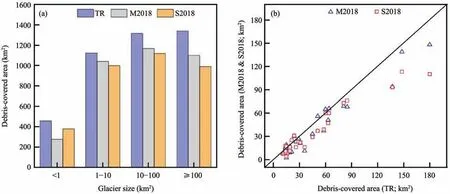
Figure 6 Debris-covered area in different glacier area size classes(a)and comparison of the debris-covered area on glaciers>100.0 km2(b)for TR,M2018 and S2018 datasets
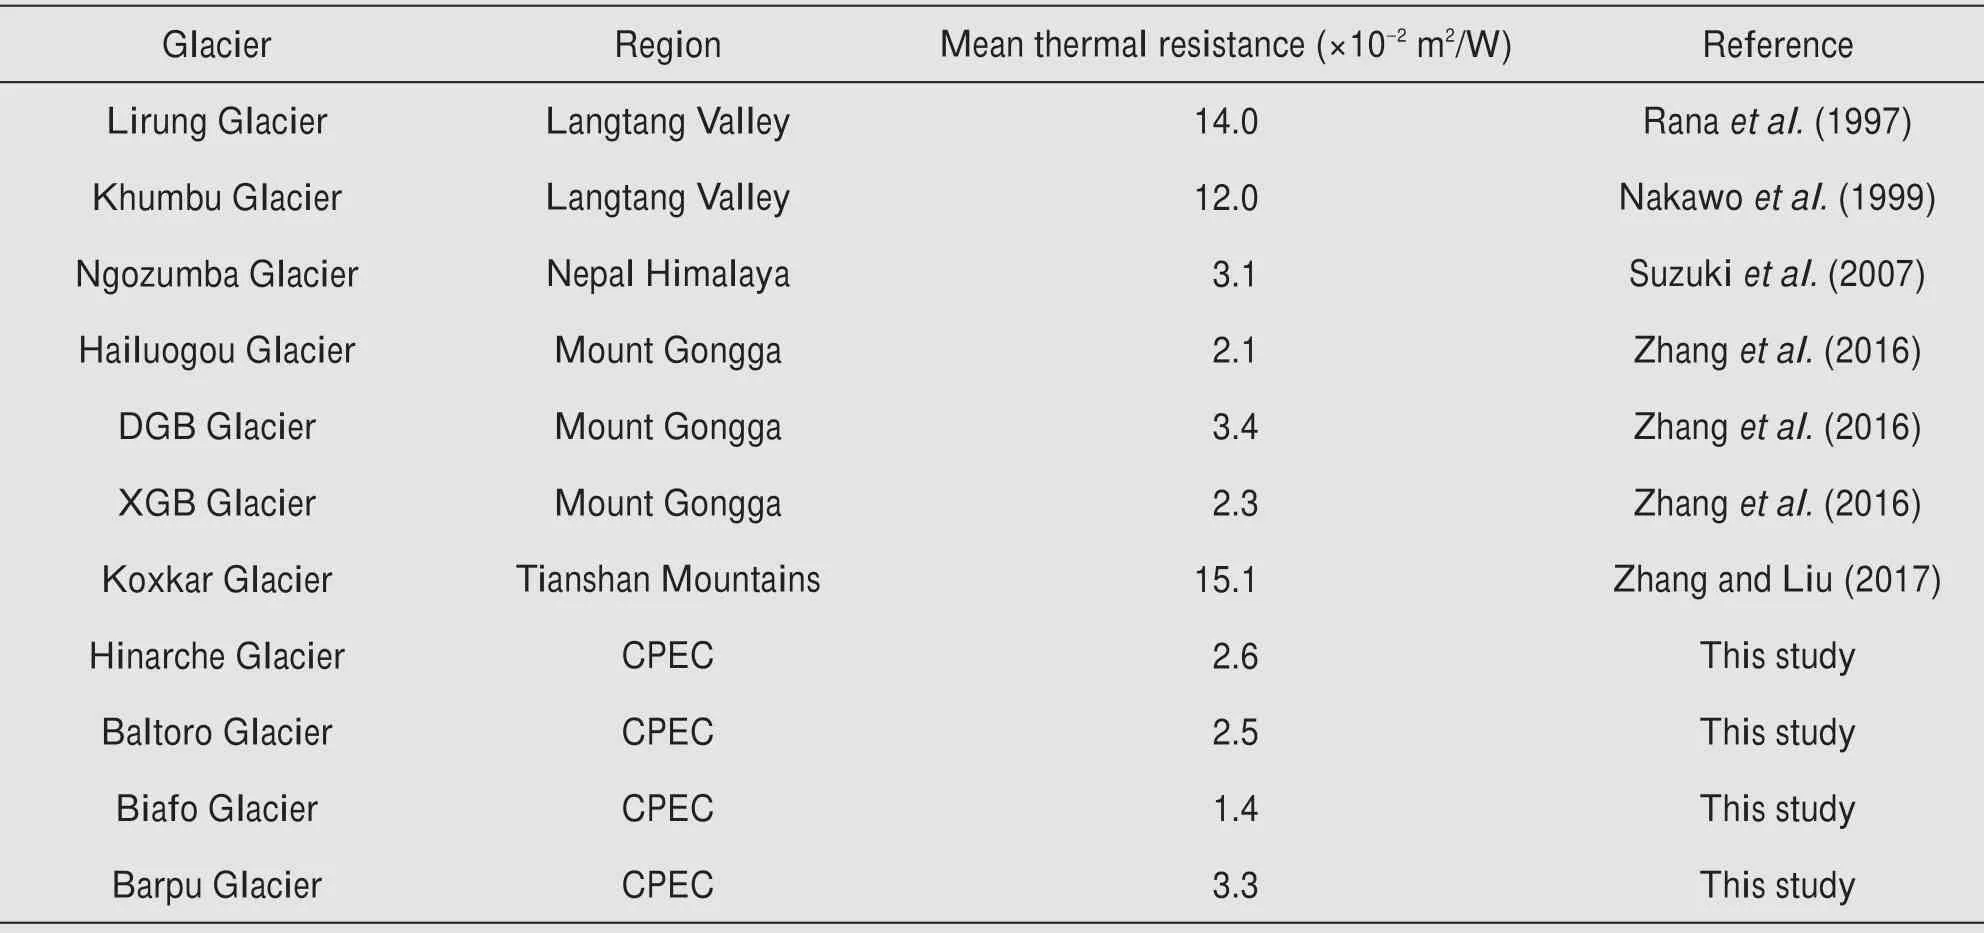
Table 2 Regional differences in thermal resistance of the debris layer
The debris-cover effect on glaciers largely alters the ice melt rate and its spatial pattern, which in turn affects glacier response to climate change and associ‐ated hydrological effect (Bennet al., 2012; Fujita and Sakai,2014;Zhanget al.,2015,2019).In the Hi‐malayas, almost all debris-free glacier termini show a retreating trend,while debris-covered glacier termi‐ni did not show a consistent response to climate change except a strong trend toward negative mass balance and surface thinning (Bennet al., 2012;Bolchet al., 2012; K??bet al., 2012). Termini of some Himalayan debris-covered glaciers show a re‐treating trend,some in a stable state,while others are advancing (Scherleret al., 2011; Bennet al., 2012;Bolchet al., 2012). In addition, recent studies have revealed that the thinning rate of debris-covered sur‐face is similar to that of debris-free surface (Nuimu‐raet al., 2011, 2012; K??bet al., 2012), which is re‐ferred as the "debris-covered glacier anomaly" (Pel‐licciottiet al., 2015; Vincentet al., 2016). Although the mechanism of debris-covered glaciers anomaly is still unclear, the debris-cover effect may be one of the reasons for surface thinning of debris-covered glaciers. This highlights the pressing need to under‐stand the debris-cover effect on glacier response and associated hydrological effect in the CPEC and sur‐roundings. The spatial distribution characteristics of debris cover and its thickness obtained in this study provide a foundation for further study on the charac‐teristics of the mass balance of debris-covered gla‐ciers and its response to climate change and hydro‐logical effect in the CPEC and surroundings.
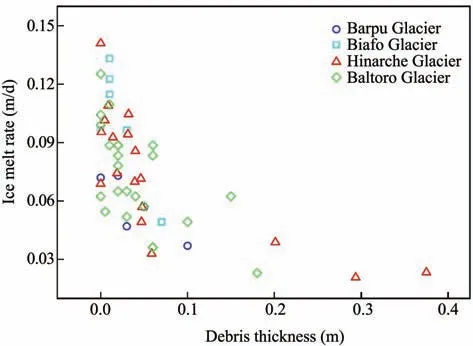
Figure 7 Observed ice melt rate versus debris thickness on different glaciers in the study region
6 Conclusions
We present the thermal resistance of the debris layer derived from ASTER imagery on glaciers in the CPEC and surroundings, and then analyze the spatial distribution characteristics of the extent and thickness of debris cover. The ASTER-derived ther‐mal resistance of the debris layer reveals that about 54.0% of glaciers in the CPEC and surroundings are debris-covered glaciers with a total debris-covered area of 5,072 km2,i.e., 14.0% of the total regional glacier area.The debris-covered surface is mainly dis‐tributed at an elevation range of 3,600?5,200 m a.s.l.,which accounts for 80.1% of the total debris-covered area. Below 3,600 m a.s.l. most of the ablation zone is covered by debris, where the debris-covered pro‐portion is about 75.0%.
Significant difference of debris cover is observed from region to region in the CPEC and surroundings.The Karakoram contains 53.3% of the total debriscovered area of the study region, followed by Pamir with 30.2% of the total debris-covered area. The de‐bris-covered area in western Himalaya and Hindu Kush is relatively small compared to other regions,but the debris-covered proportions of two regions are relatively larger in the study region.The ASTERderived thermal resistance reveals that the mean de‐bris thickness in Hindu Kush is thick, followed by Karakoram, while the thickness in Himalaya is thin in the study region.
Debris-covered glaciers are a prominent feature in the CPEC and surroundings, as well as in other high-relief mountain regions around the world (Scher‐leret al., 2018). Field ablation observations indicate that the debris-cover effect shows apparent differenc‐es on different glaciers, but the insulation effect is dominant. Therefore, it is of vital importance to in‐clude the debris-cover effect in the estimation of gla‐cier change and associated hydrological effect. Infor‐mation on the spatial distribution of debris cover ob‐tained in this study provides an important insight in‐to studying changes in debris-covered glaciers and their associated hydrological effect in the CPEC and surroundings.
Acknowledgments:
This study was supported by the National Natural Sci‐ence Foundation of China (Grant Nos. 41761144075,41671057, and 41771075), and the Research Funds for New Talents of Yunnan University (YJRC3201702).We are grateful to the editor and anonymous referees for their valuable comments which help to improve our manuscript, and thank the U.S. Geological Survey(USGS)for satellite data support.
 Sciences in Cold and Arid Regions2020年6期
- Sciences in Cold and Arid Regions的其它文章
- Guidelines to Authors
- Characteristics and changes of permafrost along the engineering corridor of National Highway 214 in the eastern Qinghai-Tibet Plateau
- Glacier changes in the Qaidam Basin from 1977 to 2018
- Thickness estimation of the Longbasaba Glacier:methods and application
- Zhangmu and Gyirong ports under the threat of glacial lake outburst flood
- Manifestations and mechanisms of mountain glacier-related hazards