
Comparison of Reynolds average Navier-Stokes turbulence models in numerical simulations of the DC arc plasma torch
2020-03-09 13:22:14ZihanPAN潘子晗LeiYE葉雷ShulouQIAN錢樹樓QiangSUN孫強ChengWANG王城TaohongYE葉桃紅andWeidongXIA夏維東
Plasma Science and Technology 2020年2期
Zihan PAN(潘子晗),Lei YE(葉雷),Shulou QIAN(錢樹樓),Qiang SUN(孫強),Cheng WANG (王城), Taohong YE (葉桃紅),3 and Weidong XIA (夏維東),3
1 School of Engineering Science,University of Science and Technology of China,Hefei 230022,People’s Republic of China
2 Hefei Aipuli Plasma Ltd. Company, Hefei 230088, People’s Republic of China
Abstract Five turbulence models of Reynolds average Navier-Stokes (RANS), including the standard k model, the RNG k model taking into account the low Reynolds number effect, the realizablek?εmodel, the SSTk?ωmodel, and the Reynolds stress model (RSM), are employed in the numerical simulations of direct current(DC)arc plasma torches in the range of arc current from 80 A to 240 A and air gas flow rate from 10 m3 h?1 to 50 m3 h?1.The calculated voltage, electric field intensity, and the heat loss in the arc chamber are compared with the experiments. The results indicate that the arc voltage, the electric field, and the heat loss in the arc chamber calculated by using the standardk?εmodel, the RNGk?εmodel taking into account the low Reynolds number effect, and the realizable k ?εmodel are much larger than those in the experiments.The RSM predicts relatively close results to the experiments,but fails in the trend of heat loss varying with the gas flow rate.The calculated results of the SST k?ω model are in the best agreement with the experiments,which may be attributed to the reasonable predictions of the turbulence as well as its distribution.
Keywords: DC arc plasma torch, numerical simulation, turbulence model
1. Introduction
Thermal plasma is widely used in industries such as material processing, spraying, and pollutant treatment due to its high temperature, high enthalpy, and high chemical activity. DC arc plasma torches are widely used as a device for generating thermal plasma with relatively simple apparatus and high thermal efficiency. A systematical study of its physical processes, which involves complex turbulent flow, heat transfer,and the coupling of electric and magnetic fields, is required to improve the performance of the DC arc plasma torch.However, the typically high temperature of arc plasma limits the experimental measurements and research.In this case,the
3 Authors to whom any correspondence should be addressed.numerical simulation has become an economical and effective research method and has been widely used to study the DC arc plasma torches in the last three decades [1-10].
Turbulence enhances the mixing of momentum, energy,and chemical species in thermal plasma, causing dramatic changes in plasma parameters. Therefore, the turbulence effect is considered critical in many applications of thermal plasma [11]. In the case of the DC arc plasma torch with a long arc column in the torch chamber,the arc presents a more complicated state with a noticeable turbulence effect. Consequently, it is necessary to select an appropriate turbulence model for the torches with a long arc column. Earlier simulations of DC arc plasma torches were performed for laminar flow[2,9,12-14].Due to a wide range of Reynolds numbers of working gas flow, the laminar simulations are limited.Some research that considered the turbulence effect used the standard ε?k model [1, 5, 6, 15-17]. However, much research considered that the standard ε?k model exaggerates the turbulence effect [18-20], owing to that its calculation results deviate markedly from the experiments.Nevertheless,the standard ε?k model is still favored by the most researchers in simulations due to its better computational stability and convergency.
In order to obtain more accurate calculation results,some researchers compared the performance of different turbulence models in the numerical simulation of DC arc plasma torch.Zhou et al [21] explored the effects of different turbulence models in the plasma cutting arc and concluded that the predicted voltage and the axial temperature distribution with the‘RNG ε?k model taking into account the low Reynolds number effect’ are in good agreement with the experiments.Since the length of cutting arc is short, the influence of turbulence on the arc in a limited space is tiny, and it cannot fully represent the general DC arc plasma torch.
The numerical simulations of DC arc plasma torches mostly use the above-mentioned Reynolds average Navier-Stokes (RANS) model. On one hand, the RANS models can be used with relatively coarse meshes and small computational cost, on the other hand, the RANS method models eddies of all sizes and neglects the details in the flow, which impedes the further understanding of thermal plasma. Hence,in the past decade large eddy simulation (LES) has been attempted for simulating thermal plasma [22, 23]. Colombo and Shigeta et al studied radio-frequency (RF) inductively coupled plasma with LES [24-26]. Some researchers also studied thermal plasma jet with LES[27-29].However,there are relatively few studies on large eddy simulation in DC arc plasma torches at present.
The turbulence models mentioned above are derived from the normal fluid and did not consider the influence of the Lorentz force to the turbulence, which limited the further application in the numerical simulations of thermal plasma.To solve this problem and consider the multiscale nature of the arc dynamics, Trelles et al developed a variational multiscale method (VMS) for numerical simulations of thermal plasma based on the finite element method [30]. In this way,Trelles et al successfully simulated the characteristics of a direct current non-transferred arc plasma torch [10, 30-32]and plasma jet [33, 34]. The details about the VMS method can be seen in [35]. Although Trelles et al provided many details about the arc flow inside the torch, the information of the turbulence inside the torch was still limited. In [34],Trelles et al showed partial turbulence structures inside and outside the torch,but their effects on the arc have not yet been further analyzed.
Although the RANS method is relatively rough compared with the LES and VMS methods, its advantages are also obvious:high computational efficiency and stable computational convergency.Therefore,in the engineering,the RANS methods are more practical.For numerical simulation of a DC arc plasma torch,engineering applications,arc voltage,jet enthalpy,power,and thermal efficiency are the focus of calculation. It is especially important to choose the appropriate turbulence model to calculate these parameters correctly.At present,the selection of the turbulence models has not reached a consensus in the numerical simulations of DC arc plasma torch.
In this paper, two-dimensional (2D) numerical simulations by the standardε?kmodel, the RNGε?kmodel taking into account the low Reynolds number effect, the realizableε?kmodel, the SSTω?kmodel, and the Reynolds stress model (RSM) are compared with the experiments,including the arc voltage,electric field intensity,and the heat loss. The degree and spatial distribution of turbulence are also analyzed.
2. Simulation model
2.1. Arc model and governing equations
In this paper, the following assumptions of an arc plasma are employed:
(1) The air plasma flow is a two-dimensional axisymmetric,steady, and turbulent state.
(2) The plasma flow is assumed to be in local thermodynamic equilibrium (LTE).
(3) The plasma flow is incompressible, its thermodynamic and transport coefficients are determined only by temperature.
(4) The gravity, viscous dissipation, and pressure work are neglected.
(5) The induced electric field is negligible.
The governing equations of the 2D axisymmetric model for the DC arc plasma torch can be written with the above assumptions as follows:
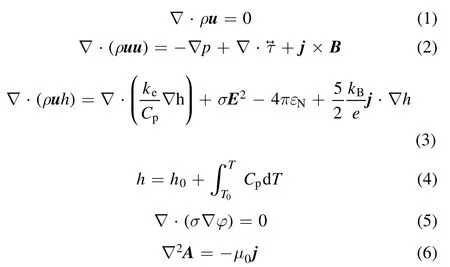

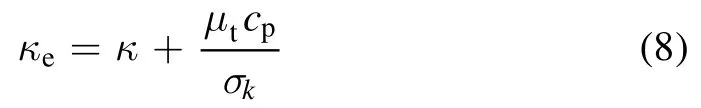
kerepresents the effective thermal conductivity:
In this paper, the 2D axisymmetric model is used in computations, which means the influence of arc-root fluctuation is ignored. Besides, the 2D model ignores some phenomena,which are essentially asymmetric with respect to θ-variations [38].
2.2. Turbulence models
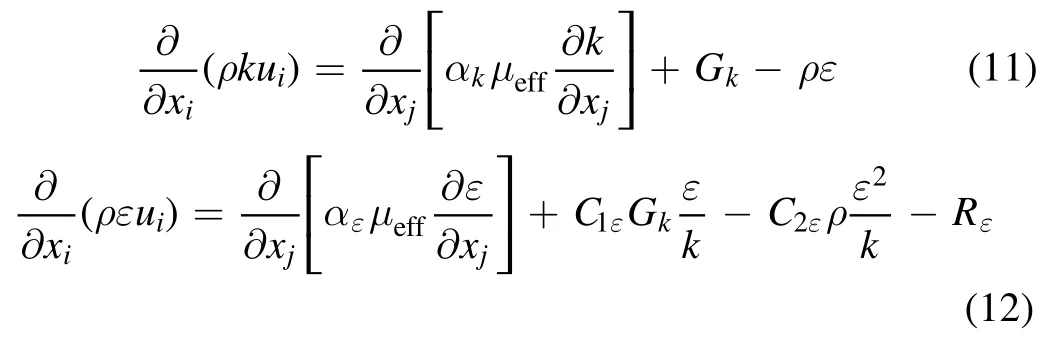
The turbulent transport terms in equations(2)and(3)need to be closed by turbulence models. The standard ε?k model[39], the RNG ε?k model taking into account the low Reynolds number effect[40],the realizable ε?k model[41],the SST ω?k model [42], and the Reynolds stress model(RSM) [43] were employed in this paper.
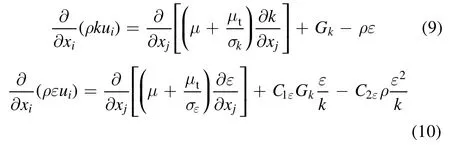
2.2.1. The standard k-ε model. The standard k ?εmodel is a semi-empirical model based on model transport equations for the turbulence kinetic energy (k) and its dissipation rate(ε). The model transport equation fork is derived from the exact equation, while the model transport forε is obtained using physical reasoning and bears little resemblance to its mathematically exact counterpart. In the derivation of themodel,it is assumed that the flow is fully turbulent,and the effects of molecular viscosity are negligible; the standardmodel is therefore valid only for fully turbulent flows.The equations of the turbulence kinetic energy and its dissipation rate are:
where the termGkrepresents the generation of turbulence kinetic energy. This term is modeled as:

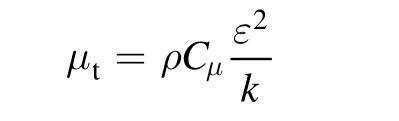
whereS is the modulus of the mean rate of strain tensor.μtis the turbulence viscosity given by:
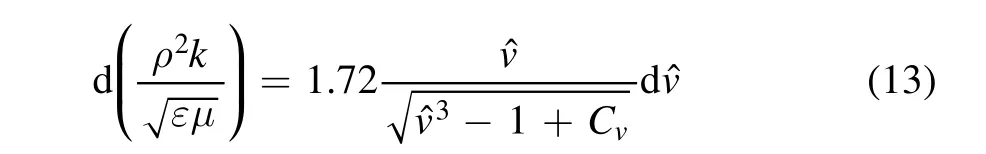
2.2.2. The RNG k-ε model taking into account the low Reynolds number effect. The RNG ε?k turbulence model is derived using a statistical technique called renormalization group theory(RNG)and takes into account the effect of swirl on turbulence.The equations of the turbulence kinetic energy and its dissipation rate are:
where the inverse effective Prandtl numbers αkand αε,are set equal to 1.393;εC1andεC2are set equal to 1.42 and 1.68,respectively. The additional termεR in itsε equation that improves the accuracy for rapidly strained flows.This term is given by:
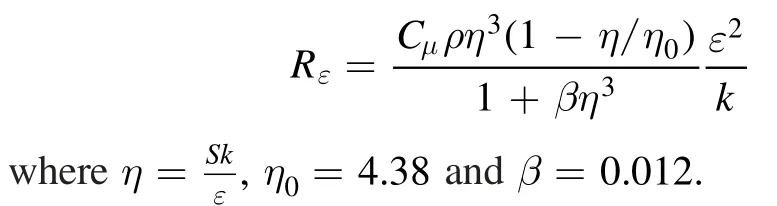
The RNG theory provides an analytically derived differential formula for effective viscosity that accounts for low-Reynolds number effects:
2.2.3. The realizable k-ε model. The term ‘realizable’means that the model satisfies certain mathematical constraints on the Reynolds stresses. A modified transport equation for the dissipation rateε has been derived from an exact equation for the transport of the mean-square vorticity fluctuation. The equations of the turbulence kinetic energy and its dissipation rate are:
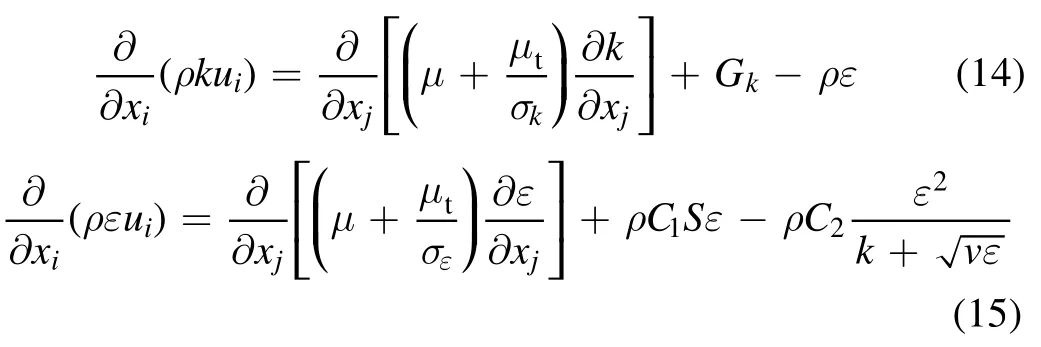
where
μtis the turbulence viscosity given by:
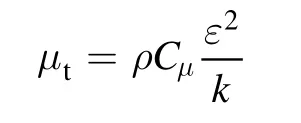
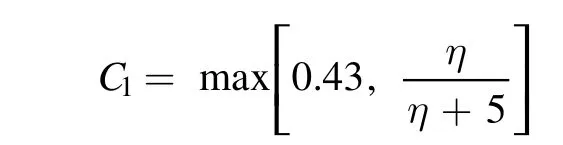
μC is no longer constant, which is computed from:
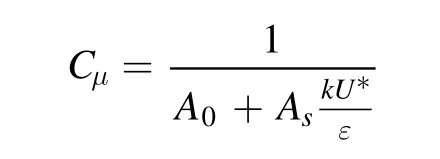
where
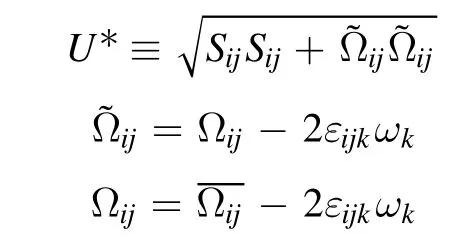
where

2.2.4. The SST k-ω model. The SST k ?ωmodel effectively blends the robust and accurate formulation of the kmodel in the near-wall region with the freestream independence of the ε?k model in the far field. The turbulence kinetic energy k and the specific dissipation rateω are obtained from the following transport equations:
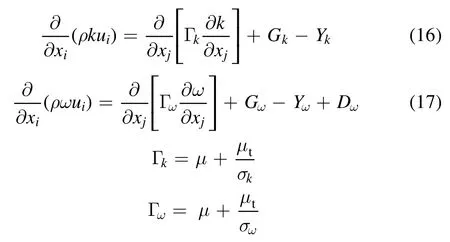
whereGkrepresents the generation of turbulence kinetic energy,ωG represents the generation ofω.Ykand ωY represent the dissipation ofk andω due to turbulence.σkandσωare the turbulent Prandtl numbers fork andω,μtis the turbulent viscosity, they are computed as follows:
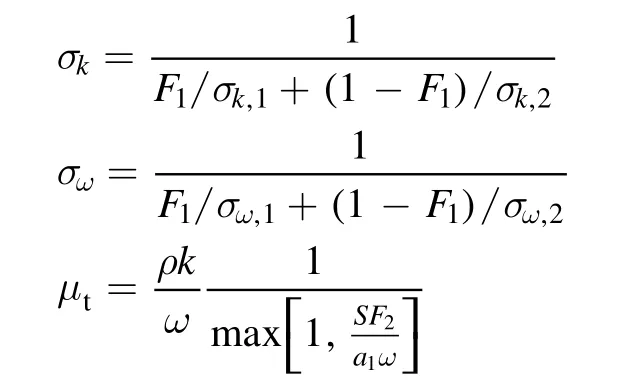
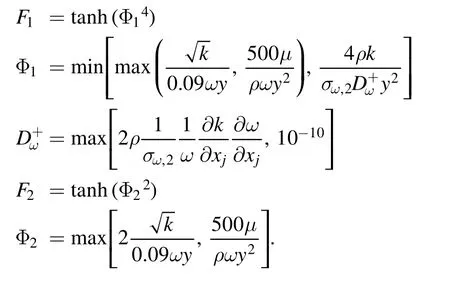
whereσk,1= 1.176,σk,2= 1.0,σω,1=2.0,σω,2=1.168.The blending functions F1and F2are given by:
2.2.5. The Reynolds stress model (RSM). The RSM abandoning the isotropic turbulence viscosity hypothesis,solves transport equations for each of the terms in the Reynolds stress tensor. The exact equations for the transport of the Reynolds stressescan be written as follows:

where theCijis convection, which is computed from:
DijT,is turbulent diffusion, which is computed from:
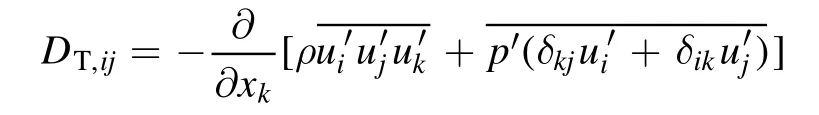
DijT,can be modelled by a scalar turbulent diffusivity as follows:
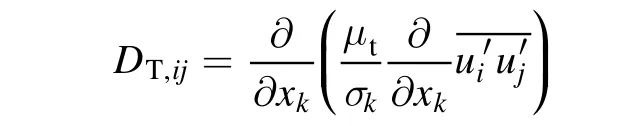
where
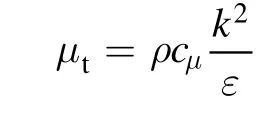
cμ0.09,= 0.82.
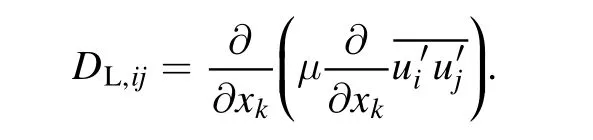
DijL,is molecular diffusions, which is computed from:
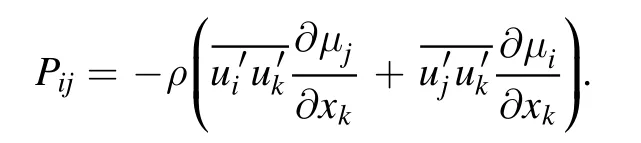
Pijis stress production, which is computed from:
φijis pressure strain, which is computed from:
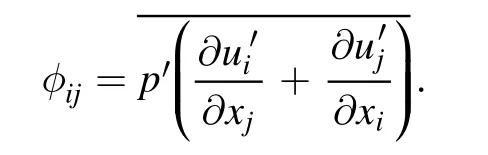
The approach to modelingφijuses the decomposition

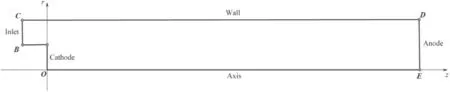
Figure 1.Computational domain.
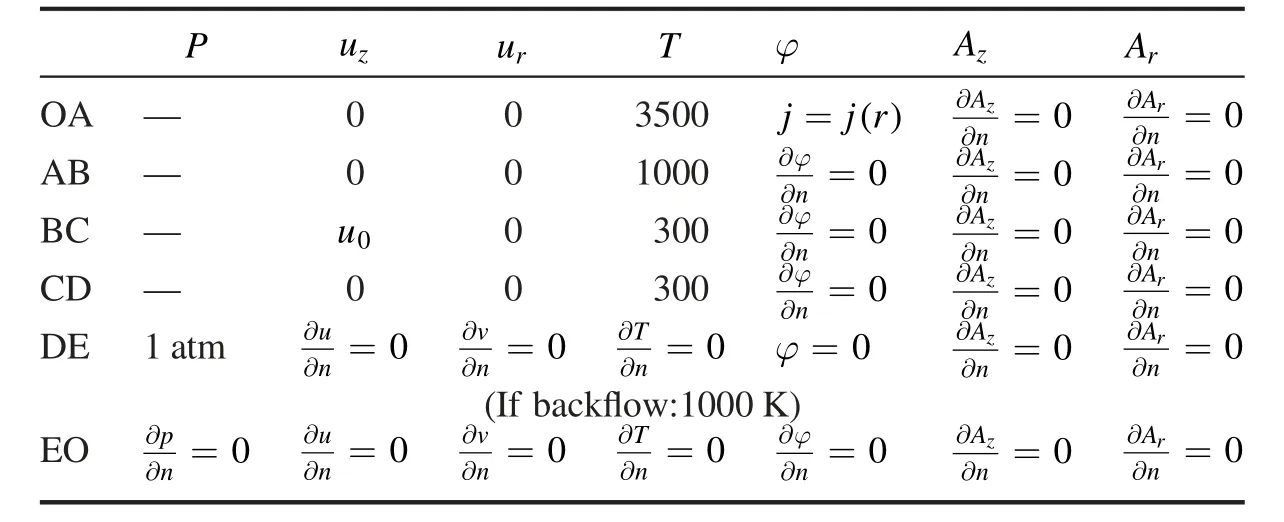
Table 1.Boundary conditions.
where
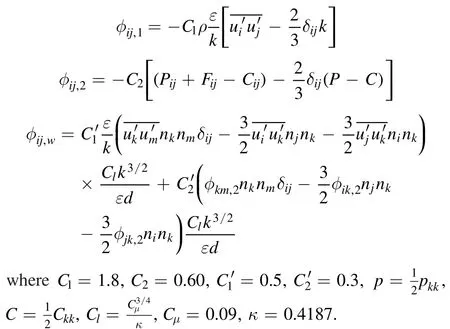
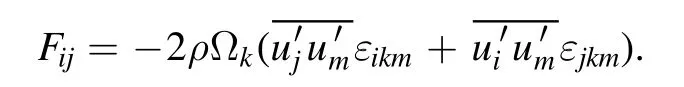
Fijis production by system rotation, which is computed from:
Charlie glowered11() when I asked him to come forward. His gaze burned into mine. I stuck my hand into one pocket. Nothing. I reached into the other pocket. Then I felt it—the familiar outline of the small tin heart. Charlie stared at me for a long time. There were no tears in those big gray eyes, no plea for mercy. He seemed to be waiting for what he’d come to expect from the world. I was about to pull the tin heart out of Charlie’s pocket when I stopped myself. Let him keep it, a voice seemed to whisper.
εijis dissipation, which is computed from:
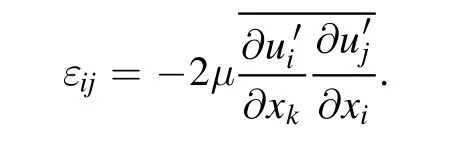
The dissipation tensorεijis modeled as:

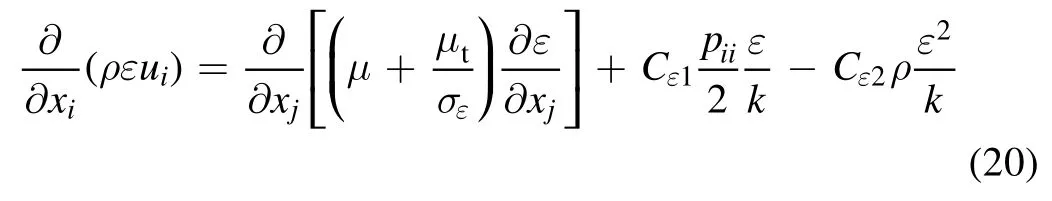
the scalar dissipation rateε computed with the equation:
In our simulation,we used the FLUENT’s default values for the turbulence constants, which were the same as [21].
In the near wall region,the Reynolds number is relatively low, molecular viscosity dominates the turbulent flow due to the low Reynolds number, resulting in rapid damping of turbulence. Except for the SST k ?ωmodel, the turbulence models mentioned above are all derived from the fully turbulent flow,which cannot be used directly in the near wall region. In this paper, the enhanced wall treatment with the two-layer model [44-46] was employed when the standard kmodel, the RNG k ?εmodel taking into account the low Reynolds number effect,the realizable k ?εmodel,and the Reynolds stress model were used in the simulations.
2.3. Boundary conditions and numerical method
Figure 1 shows a computational domain,where OA =5 mm,AB10 mm, BC =5 mm, CD =260 mm, DE =10 mm,OE250 mm.
The boundary conditions are shown in table 1.BC is the inlet of the gas flow with a uniform velocity profile.The inlet turbulence intensity is given by:
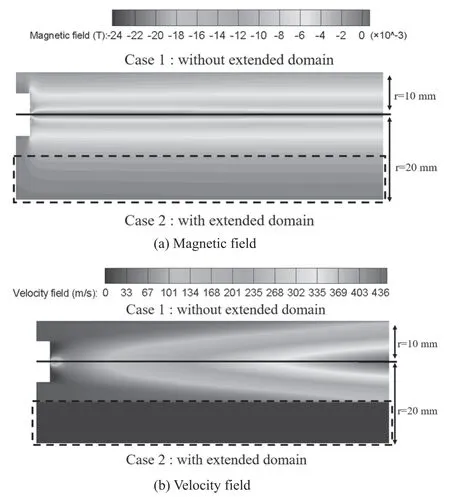
Figure 2.Comparison of the(a)magnetic field and(b)velocity field obtained by not using the extended domain (up) and using the extended domain (down).
CD is a water-cooled wall of the arc chamber with a temperature of 300 K. OA is a cathode, the profile of the current density is given as [17]:
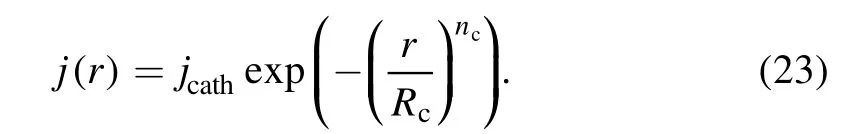
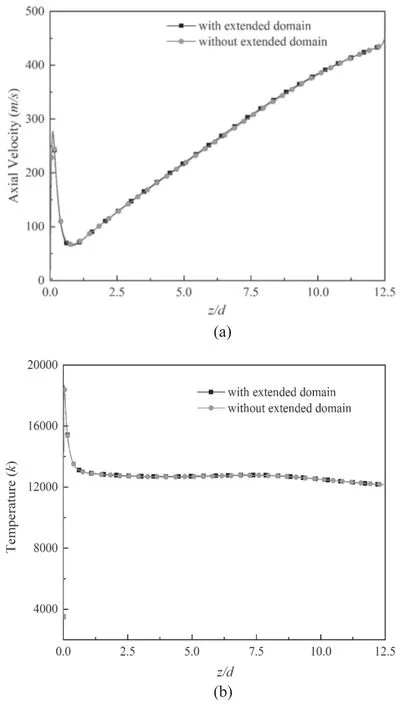
Figure 3.Profiles of (a) velocity and (b) temperature along the axis.
We use the potential vector(PV)approach to estimate the self-induced magnetic field in the DC arc plasma torch with the null flux boundary condition, which is the same as [21].These boundary conditions imposed on the components of the magnetic vector potential are standard, although not mathematically rigorous,and do not violate Ampere’s law[21].But according to [48], this boundary condition provided bad results if applied at the wall. To remedy this problem, an extension of the computational domain beyond the wall was proposed in [48]. Thus, we tested to impose the boundary conditions for the PV in a ‘radially’ extended domain(extended radial distance is 20 mm). For the SST ω?k model case with I = 140 A,G = 17.5 m3h?1,figures 2 and 3 show the comparison of the magnetic field, velocity field,axial velocity and the axial temperature obtained by using the extended domain and not using the extended domain.The results indicate that there is no difference between using and not using the extended domain. It may be caused by the different radius of arc plasma torch.In our simulation,the wall boundary condition of the geometry is far away from the arc core(the radius of the arc plasma torch is 10 mm).In[48],the wall boundary condition of the geometry is close to the arc core (the radius of the arc plasma torch is 3 mm). When the wall boundary condition of the geometry is far away from the arc core,the results obtained by this method are relatively accurate [48]. Hence, the following simulations will not use the extended domain.
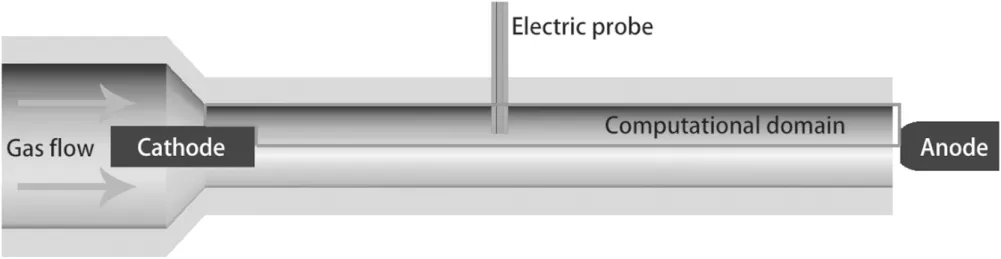
Figure 4.Schematic diagram of the plasma torch.
Figure 5.Experimental setup and CCD image of the arc.
Simulations in this paper were carried out by using the commercial CFD software FLUENT with the SIMPLE algorithm.
3. Experimental setup
Figure 4 presents an experimental DC arc plasma torch.It was designed for the purpose of this study to avoid arc root motion.The computational domain is within the red line.The diameter of the torch is 20 mm, and the distance between the cathode and anode is 250 mm. In the experiments, the range of the current is from 80 A to 240 A, and the range of the air gas flow rate of the inlet is from 10 m3h?1to 50 m3h?1(the corresponding range of Reynolds numbers of the cold gas is from 14 708 to 73 541).To reduce the arc voltage fluctuation due to the motion of the anodic root, the rod anode made of graphite is 5 mm apart from the outlet of the torch, as shown in figure 5.In the experiments,the arc is on the tip of the rod anode, and the position of the anode is adjusted to compensate for the burning of graphite.The voltage was measured by a data acquisition computer card at a maximum sampling frequency of 200 kHz. Figure 6 is the typical current and voltage signals in the experiments.voltage fluctuation may arise from instability of the arc column.
The gas feeding rate is controlled by a mass flow meter.The chamber wall is cooled through the looped-water driven by the pump. The inlet and outlet water temperature is measured so that the heat loss of the arc transferred to the chamber is calculated. The anode of the torch is grounded.
Figure 6.Typical current and voltage signals in the experiments.
Directly measuring the turbulence inside arc plasma torch,especially inside the arc column,is very difficult owing to its extremely high temperature and the physical structure of the torch. Nevertheless, the information on the spatial distribution of turbulence can be obtained from the electric field because of the correlation between electric field intensity and turbulence intensity. Electric field intensity of the arc in correlation to the diameter of the arc columnd*is as follows[49, 50]:
Electric probes 10 mm apart are placed inside the arc chamber to measure the potential distribution so that electric field intensity is calculated.The electric probe is made of copper wires,wrapped by a quartz glass tube.The choice of copper was made because of the ease of fabrication and the electron emissions from copper can be ruled out [51]. The diameter of the copper wire is 0.4 mm.The theory of the probe was presented in[52]. There is a slight difference between the measured and actual plasma electric potential due to the existence voltage drop of the sheath of the probe. The difference of sheathes between the two positions caused by plasma flow could be neglected when they are close enough.
4. Results and discussion
In our simulation, the convergence in all cases is determined based on a drop in normalized residuals by four orders of magnitude(10?4).For all cases,the temperature,velocity and pressure values at monitor positions of interest have reached a steady solution.
To confrim that the computational results are independent to mesh sizes and to select the appropriate number of computational grid, a grid sensitivity study is carried out. For the Reynolds stress model case with I = 140 A, G = 17.5 m3h?1,fgiure 7 shows the comparison of centerline electric feild intensity with three different numbers (coarse 12 234, middle 27 575 and fine 53 467) of computational meshes. As a result,the grid number of 27 575 is adopted in the following simulation.
To capture the turbulent boundary layer on the inner wall of the torch, the computational mesh is refined near the wall with the minimum size of 0.05 mm for y+(the dimensionless distance from the wall,where y is the distance from the wall to the cell center,μ is the molecular viscosity,ρ is the density and τwis the wall shear stress) less than 1.
In the following discussions,model 1,model 2,model 3,model 4, and model 5 refer to the standard ε?k model, the RNG ε?k model taking into account the low Reynolds number effect, the realizableε?kmodel, the SSTω?k model, and the Reynolds stress model (RSM) respectively.
4.1. Arc voltage characteristics
Figure 8 shows that the voltage-ampere characteristics are calculated by the five turbulence models and the experimental data. The five turbulence models all predicted the same descending voltage-ampere characteristics, but a significant difference among them.The results of model 1 show the most significant difference and is almost 1.5 times higher than those of the experiments. The calculated voltage by models 2 and 3 is smaller than model 1 and still higher than that of the experiments. Results by models 4 and 5 approximate the experiments.The results by model 4,which deviates from the experiments less than 10%,are better than all the other models.Furthermore,the results at gas flow rate G = 17.5 m3h?1(figure 8(a)) and at G = 25 m3h?1(figure 8(b)) are similar.
Figure 9 shows the predicted and the experimental results of voltage against the gas flow rate.It can be seen that model 4 presents a consistent agreement with the experiments. The deviation between the calculated voltage of the other four models and the measured voltage is getting larger when the gas flow rate increases. The results of model 1 show the largest deviation from the experiments.
Figure 7.Comparison of centerline electric field intensity for three mesh sizes.
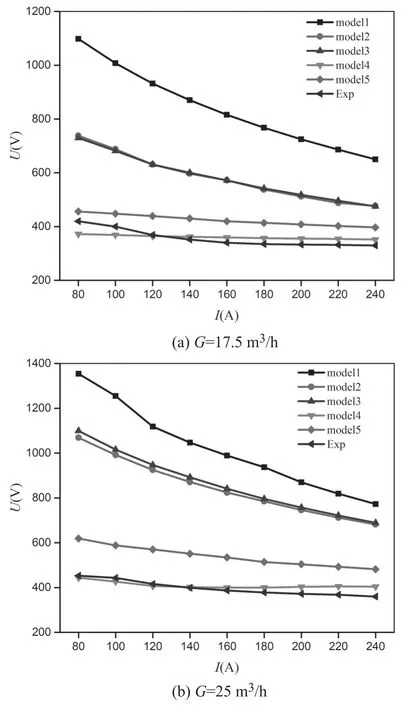
Figure 8.Comparisons of calculated and experimental voltageampere characteristics.
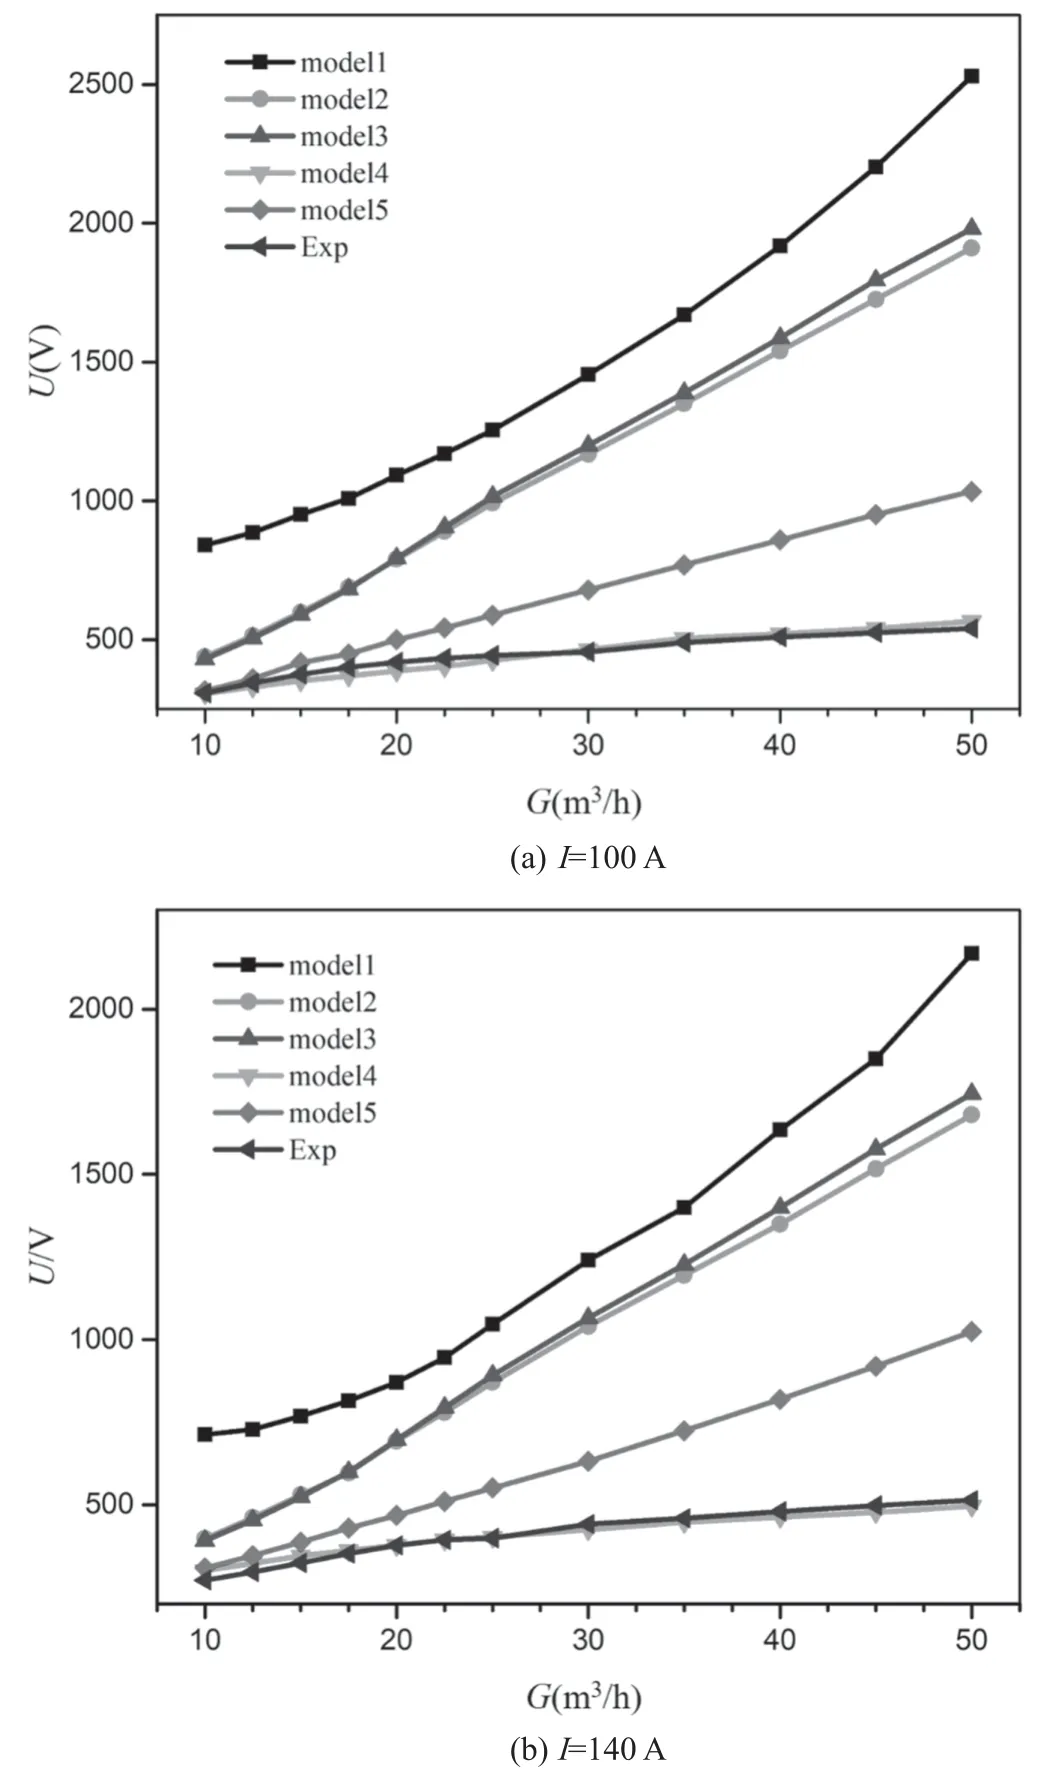
Figure 9.Comparisons of calculated and experimental voltage against gas flow rate.
The facts in figures 8 and 9 show that turbulence models have a significant influence on the calculated results of arc voltage. Model 1 (The standard ε?k model) presents unreasonably high values of arc voltage. The standard ε?k model overestimates the turbulence and the exaggeration makes the predictions of the effective viscosity and the effective thermal conductivity much larger [20], leading to a much higher arc voltage by the overestimation of the heat transfer from the arc to the cold working gas and the arc chamber wall.
Because the voltage deviation by model 1 from those by the other models as well as the experiments is too large,there is no need to compare model 1. The following analyses will not include model 1 anymore.
4.2. Turbulence and electric field distribution in an arc
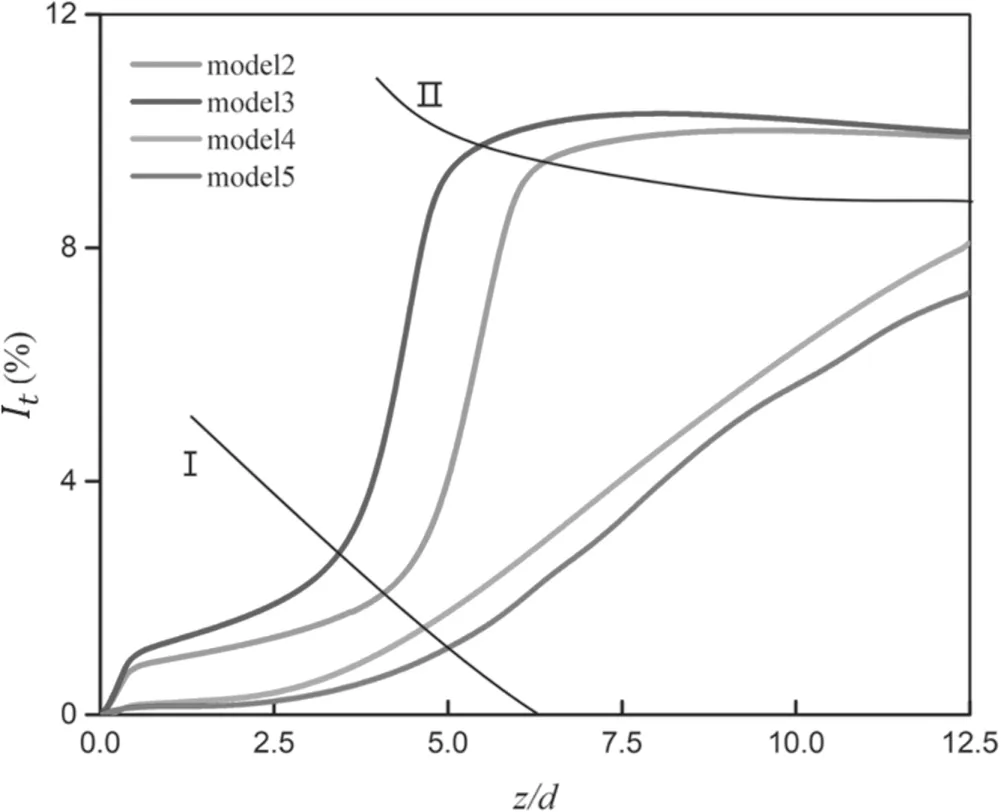
Figure 10.The distribution of calculated turbulence intensity along the axis of the arc, I = 140 A, G = 17.5 m3 h?1.
Arc voltage characteristics depend on the electric field distribution. Turbulence enhances the heat transfer from arc to the cold working gas, which makes the arc more constricted and cooled. So, it is essential to understand the turbulence degree and its distribution.
The turbulence state of the arc burning in an arc chamber can be divided into three sections: the initial section, the transition section, and the developed turbulent section [53].Figure 10 presents the turbulence intensity along the axis of the arc (turbulence intensity It=is the root-meansquare of the turbulent velocity fluctuations and u is the mean velocity [54]) calculated by different turbulence models. The zone under line I is the initial section,where the arc is close to a laminar flow. The zone between line I and line II is the transition section, where the arc transfers from laminar to turbulent. The zone above line II is the developed turbulent section, where the arc has developed into a fully turbulent flow. As seen in figure 10, the turbulence intensity at the initial section calculated by models 2 and 3 is obviously higher than those by models 4 and 5, and the calculated turbulence intensity by models 4 and 5 at the initial section is very low and develops slowly.The arc plasma flow calculated by models 2 and 3 transforms to a fully developed turbulent flow in about 4d-6d (d is the diameter of the torch), then the turbulence intensity starts to decrease slowly.Models 4 and 5 shows a difference. The calculated turbulence intensity rises much slowly,and the arc plasma flow has not transformed to a fully developed turbulent flow in the computational domain within 12.5d. It is referred from figures 8 to 10 that the calculated turbulence intensity of models 2 and 3 is higher,which results in higher calculated voltage; the calculated turbulence intensity of models 4 and 5 is lower,which results in lower calculated voltage (as shown in figures 8 and 9).
Figure 11 presents the distribution of the calculated electric field intensity in a laminar arc. In this case, the diameter of the arc column is very small due to the constricted arc cathodic root,resulting in a high electric field intensity.As the distance from the cathode increases, the arc gradually expands. As a result, electric field intensity gradually decreases.
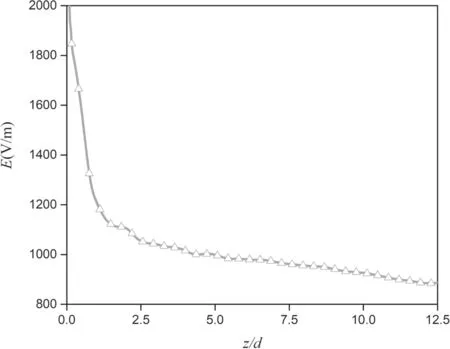
Figure 11.Distribution of calculated electric field intensity along the axis of a laminar arc, I = 140 A, G = 5 m3 h?1.
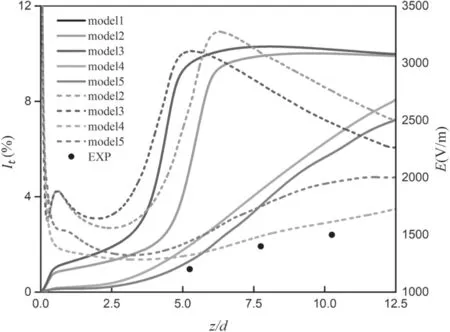
Figure 12.Correlation between turbulence intensity(solid lines)and electric field intensity (dash lines) along the axis of the arc,I = 140 A, G = 17.5 m3 h?1.
Figure 12 presents the distribution of the calculated turbulence intensity and the electric field intensity along the axis of the arc. The results obtained under the turbulent condition differ from the laminar one. Model 2 is taken as an example.In the initial section(about 0-3d),the turbulence effect is very tiny, and the electric field intensity decreases as the distance from the cathode increases owing to the expansion of the diameter of the arc column, like the laminar condition in figure 11. In the transition section (3d-6d), the electric field intensity increases synchronously with the increase of the turbulence intensity. In the developed turbulent section (z > 6d), turbulence intensity stops increasing. Nevertheless,the overhigh power of the Ohm’s heating due to the overhigh electric field intensity makes the arc column continuously expand downstream (see the 6000 K isotherms in figure 13).It results in an increase of the diameter of the arc column and a decrease of the electric field intensity along the axis. The development of the turbulence intensity calculated by model 4 or 5 is much slower compared with that of model 2 or 3,and the calculated electric field intensity along the axis by model 4 or 5 agrees well with the experiments. Moreover, the predicted electric field intensity of model 4 is in the best agreement with the experiments, slightly higher than the experimental results.
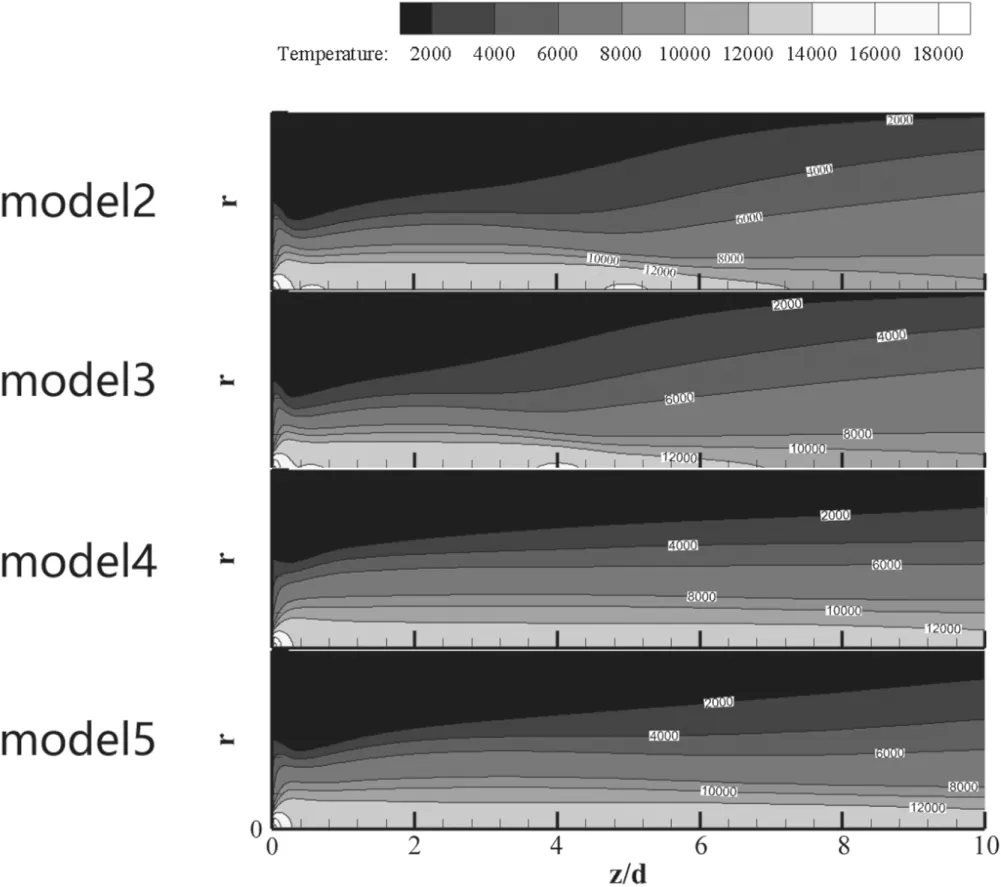
Figure 13.Isotherms calculated by different turbulence models,I = 140 A, G = 17.5 m3 h?1.
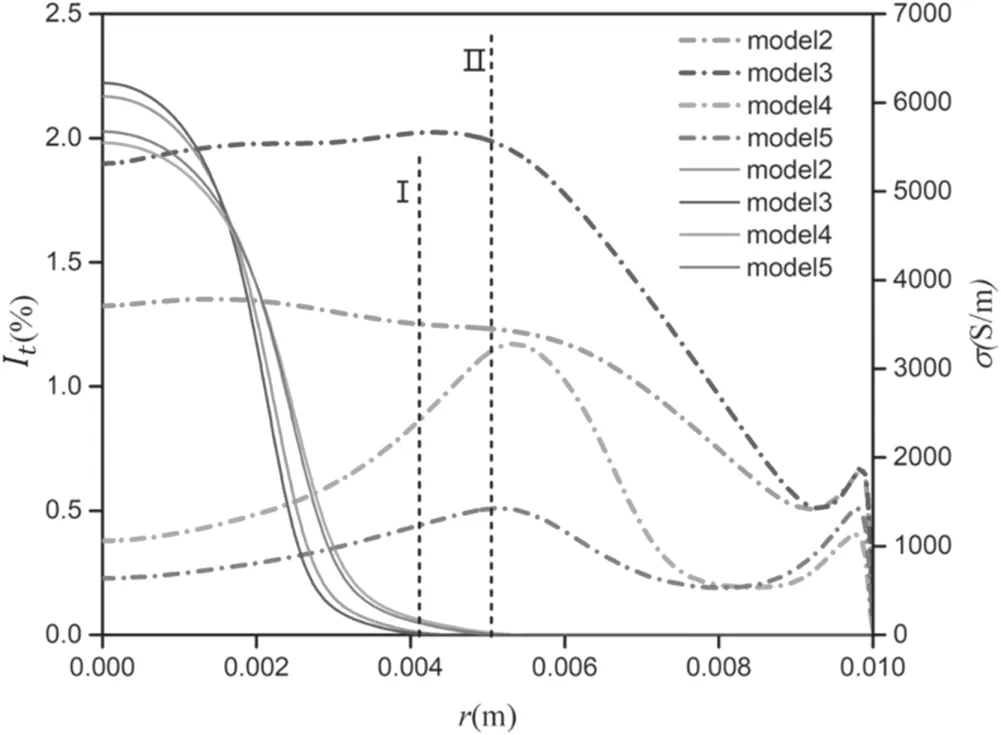
Figure 14.Turbulence intensity distribution (short dash dot lines)and electric conductivity distribution (solid lines) at z/d = 2.5,I = 140 A, G = 17.5 m3 h?1. Line I indicates the edge of the calculated arc column by model 2 or 3,and line II indicates the edge by model 4 or 5.
Figure 14 is the radial distribution of the turbulence intensity and electric conductivity of the arc plasma. As shown in the figure, the calculated turbulence intensity of models 4 and 5 is very low inside the arc column; the maximum turbulence intensity appears near the edge of the arc column.Usually,the arc plasma flow is not fully turbulent in an arc chamber. The core zone of an arc is usually laminar due to the low mass density and the high value of the viscosity. At the edge of the arc column, the turbulence effect is strong due to the interaction between the cold gas and the arc column[11,25,55].The radial distribution of the turbulence intensity of models 4 or 5 is consistent with the analyses of references [11, 25, 55] mentioned above.
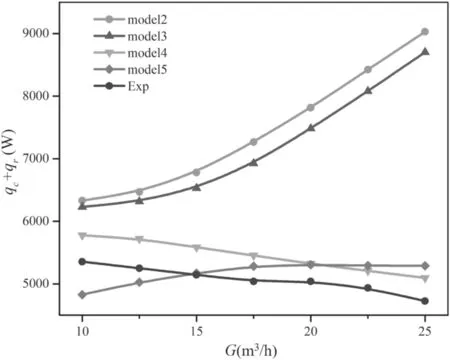
Figure 15.Comparisons of calculated and experimental heat loss of different gas flow rates in an arc chamber, I = 140 A.
Whether outside or inside the arc column, or near the wall, the calculated turbulence intensity of model 2 or 3 is more significant than model 4 or 5.The turbulence outside the arc enhances the cooling effect to arc, which compresses the arc column. The higher the turbulence intensity, the more compressed the arc column. Therefore, the calculated diameter of the arc column of model 2 or 3 is smaller than that by model 4 or 5. The calculated core temperature of the arc by model 2 or 3 is just a little bit higher than that by model 4 or 5 due to the former being of higher current intensity, and the electric conductivity of the arc calculated by model 2 or 3 is also just a little higher. Because the diameter of the arc column has much influence on the electric field, the calculated electric field intensity of model 2 or 3 is much higher than that by model 4 or 5.
Near the wall, the calculated turbulence intensity by model 5 is higher than that by model 4,causing stronger heat conduction to the wall.In this case,the calculated diameter of the arc column by model 5 is a little smaller than that by model 4,so the calculated electric field intensity by model 5 is also a little higher than that by model 4.
Combining figure 13 with figures 12 and 14, we may learn more about how turbulence affects the plasma temperature and the electric field.In the initial section of model 2 or 3 (about 0-3d), high-temperature area (12 000 K isotherm)has no distinct difference among different models, but the 6000 K isotherm calculated by model 2 or 3 is narrower than that by model 4 or 5. That means the diameter of the arc by model 4 or 5 is larger than that by model 2 or 3. In the transition section of model 2 or 3 (about 3d-6d), hightemperature area (12 000 K isotherm) calculated by model 2 or 3 constricts, and the edge of the arc column (6000 K isotherm) starts to expand. However, the high-temperature area(12 000 K isotherm) and the edge of the arc column (6000 K isotherm) calculated by model 4 or 5 nearly maintains unchanging in this district. That means the electric field intensity calculated by model 2 or 3 is higher than that by model 4 or 5, due to the latter being of a larger arc column than the former.In the developed turbulent section of model 2 or 3 (z > 6d), the high-temperature area (12 000 K isotherm)calculated by model 2 or 3 disappears, and the arc column(6000 K isotherm) expands rapidly. The high-temperature area (12 000 K isotherm) calculated by model 4 or 5 slightly decreases and the arc column (6000 K isotherm) nearly maintains unchanging. That means the electric field intensity calculated by model 2 or 3 may decline,while that by model 4 or 5 may increase.
4.3. Heat loss in the arc chamber
Heat loss is one of the most important parameters of the DC arc plasma torch.The hot gas in the arc chamber transfers heat to the wall in two ways: thermal conduction and thermal radiation. In calculations, the boundary condition of the arc chamber wall is set to be a uniform temperature of 300 K,and the plasma radiation heat loss is calculated with net radiation emission coefficients. These two assumptions are rough and make the calculation results hard to match the experiments perfectly. However, the trends of heat loss against gas flow rate and current are significant in engineering. Hence, we focus more on the calculations sharing the similar trends with the experimental results even if their specific values are not exactly equivalent.
Figure 15 is the calculated heat lossthe heat loss of thermal conduction and radial heat transport by turbulence, which is computed by using the effective t hermal conductivity, and qris the heat loss of thermal radiation) against the gas flow rate in an arc chamber.The calculated heat loss by model 4 is a little higher than the experimental result, and both of them have the same decreasing trends as the gas flow increases. Model 4 is the only one that predicts the same trend of heat loss varying with the gas flow as the experiments. Figure 16 further compares the heat loss of thermal conduction. The calculated heat loss of thermal conduction by model 4 decreases as the gas flow rate increases, while those by the other three models all increase with the increase of the gas flow rate.The increase of the gas flow rate compresses the arc column more strongly,which leads to an increase of the thickness of the cold boundary layer.The increased thickness of the cold boundary layer reduces the heat loss conducted to the wall of the arc chamber[56].The heat loss transferred from the gas to the arc chamber wall should decrease as the gas flow rate increases.On the other hand,the increase of the gas flow rate enhances the turbulence intensity. This results in an increase of heat loss transferring to the wall.Thus,except model 4,all models overestimated the increase of the turbulence effect and thus resulted in an opposite trend as gas flow rate increases. It is noticeable that, although model 5 presents a relatively lower turbulence intensity in most areas ( 0 < r<0.008 m), the calculated electric field intensity and heat loss transferred to the wall by model 5 is still higher than that by model 4.This may be inferred due to the higher turbulence intensity calculated by model 5 near the wall (0 .008 < r <0.01 m) (as shown in figure 14).It may also be a cause of the fact that the deviation between calculated voltage and the experimental result is getting larger as the gas flow rate increases(as shown in figure 9).
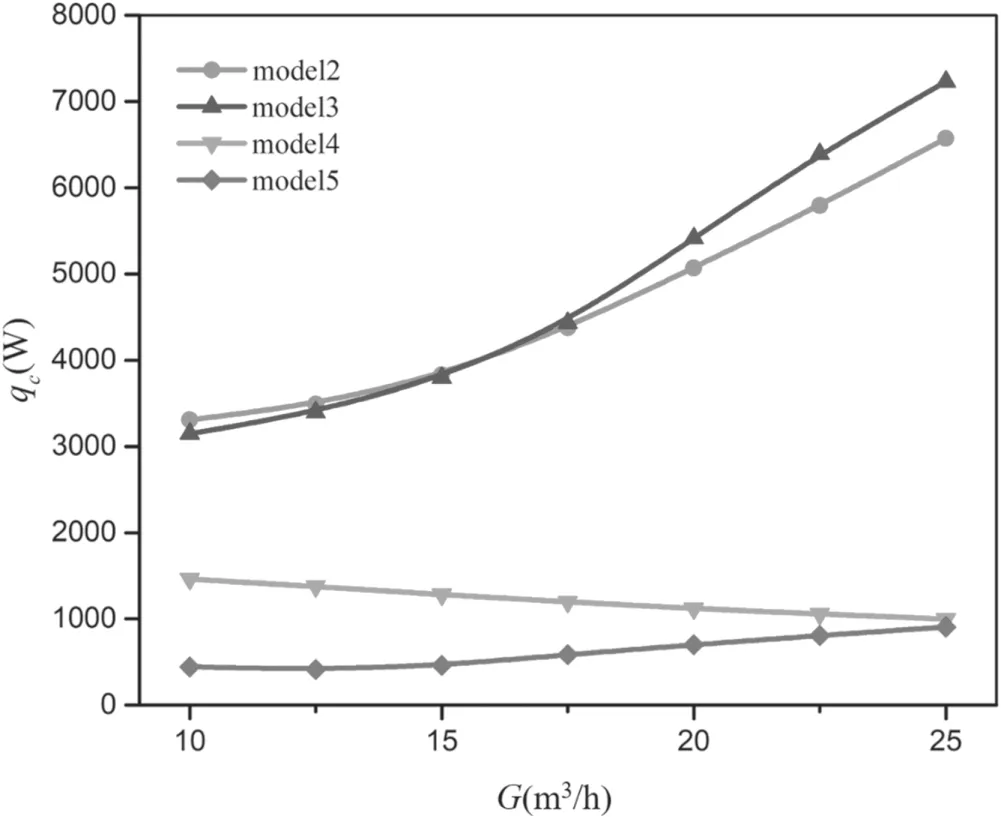
Figure 16.Heat loss of conduction of different gas flow rates in an arc chamber, I = 140 A.

Figure 17.Heat loss of different arc currents, G = 17.5 m3 h?1.
Figure 17 shows the calculated heat loss versus the current. The arc temperature and the arc column are larger with an increase of the current, leading to a simultaneous increase of the heat losses of both thermal conduction and thermal radiation. The results of model 4 and model 5 are in good agreement with the experiments.
5. Conclusions
In this paper, the standardε?kmodel, the RNGε?k model taking into account the low Reynolds number effect,the realizableε?kmodel, the SSTω?kmodel, and the Reynolds stress model (RSM) were employed in numerical simulations of DC arc plasma torches under the conditions of currents(80 A-240 A)and gas flow rate(10 m3h?1-50 m3h?1).
The standard k ?εmodel [1, 5, 6, 15-17], the RNG kmodel taking into account the low Reynolds number effect, and the realizable k ?εmodel all overestimated the degree of turbulence both inside and outside the arc column,and the calculated voltage and electric field deviate far from the experimental results,so we abandon these models.The arc voltage and electric field calculated by the RSM were close to the experimental result,while the heat loss in the arc chamber increases with the increase of the gas flow rate, which is opposite to the experimental results.This may be attributed to the overhigh turbulence near the wall. The calculated results of the electric field distribution and heat loss by the SST kmodel are in the best accordance with the experiments,and the calculated heat loss presents the same trend with the experiments.It may be inferred that the calculated turbulence intensity inside and outside the arc column as well as near the wall is reasonable. Our conclusion differs from Zhou [21].This may be caused by the different length of the arc.Besides,they paid more attention to the plasma jet and compared the results with the experiments, but we focused more on the arc not the plasma jet,and this may be the key factor that leads us to different conclusions.
Turbulence develops in the arc chamber. In the initial section, the degree of turbulence is rather low; then it gradually rises until it is fully developed. According to the correlation between the electric field intensity as well as turbulence intensity and those of the experimental results,the development of turbulence calculated by the SST ω?k model is reasonable.
Considering that the RSM needs more computational resources without better results, the SST ω?k model performs best in the simulations of DC arc plasma torches.
Acknowledgments
This work is supported by National Natural Science Foundation of China (Nos. 11675177, 11875256) and the Anhui Province Scientific and Technological Project (No. 1604a0902145).
猜你喜歡
課堂內外·小學版(低年級)(2023年12期)2023-04-29 00:44:03
Plasma Science and Technology(2021年12期)2022-01-10 14:51:34
中老年保健(2021年11期)2021-08-22 03:17:06
神劍(2021年3期)2021-08-14 02:30:00
Plasma Science and Technology(2021年7期)2021-07-07 02:40:28
小學生(看圖說畫)(2020年4期)2020-12-03 16:55:50
美與時代·美術學刊(2020年3期)2020-06-29 07:24:35
鄉(xiāng)村地理(2019年2期)2019-11-16 08:49:32
藝術品鑒(2019年8期)2019-09-18 01:22:48
Communications in Theoretical Physics(2019年8期)2019-08-20 09:24:36
 Plasma Science and Technology2020年2期
- Plasma Science and Technology的其它文章
- Analysis of the characteristics of the plasma of an RF driven ion source for a neutral beam injector
- Synthesis of vertical graphene nanowalls by cracking n-dodecane using RF inductivelycoupled plasma-enhanced chemical vapor deposition
- Application of persulfate in low-temperature atmospheric-pressure plasma jet for enhanced treatment of onychomycosis
- Magnetic field enhanced radio frequency ion source and its application for Siincorporation diamond-like carbon film preparation
- Microwave frequency downshift in the timevarying collision plasma
- Effects of fast ions produced by ICRF heating on the pressure at EAST