
China's long-term low carbon transition pathway under the urbanization process
2019-06-11 06:20:12LIUJunLingWANGKeXIAHOUQinRuiLIUFangMingZOUJiKONGYing
LIU Jun-Ling, WANG Ke*, XIAHOU Qin-Rui LIU Fang-Ming ZOU Ji KONG Ying
a School of Economics and Management, Harbin Institute of Technology (Shenzhen), Shenzhen, 518055, China
b Tsinghua-Berkeley Shenzhen Institute, Tsinghua University, Shenzhen, 518055, China
c School of Environment & Natural Resources, Renmin University of China, Beijing, 100872, China
d Department of Economics, York University, Toronto, M3J1P3, Canada
Abstract This study develops a comprehensive analysis framework and socio-economic energy system model that interlinks demographic change and energy system in order to analyze the urbanization process and its relation with China's long-term CO2 emissions trend as China’economy enters the “new normal” stage. The results show that, around 300 million people are expected to migrate from rural areas to urban areas by 2050 following a trend,in which people are moving gradually from small and medium city groups to large and super city groups.The migration trend together with the improvement in living standard will promote China's infrastructure construction, industry production, and energy service demand growth.Under the Business as Usual(BAU)scenario,total primary energy consumption in China will reach 8.4 Gtce by 2050,energyrelated CO2 emissions will increase to 17.6 Gt, which is 83% higher than the 2013 level.While in the Low Carbon Transition (LCT) scenario with technology innovation, the total primary energy demand for China in 2050 could be controlled at ~6 Gtce; CO2 emissions would peak during 2020-2025,and be reduced by 78%by 2050 compared to the BAU scenario.In the transition process,non-fossil fuel power generation and energy efficiency technologies have the largest mitigation potentials.Industry and power sectors would peak first before 2020,followed by the building and transport sectors which are projected to peak around 2030. The total additional capital investment required for LCT would account for 1.5% of GDP. Therefore, it is technologically and economically feasible for China to implement new urbanization strategy.
Keywords: Urbanization; Population migration; Consumption demand; Low carbon transition; Bottom-up model
1. Introduction
The report of the 19th National Congress of the Communist Party of China highlighted new development concept that leads China into a new era and into achieving the second centenary goals.Currently,more than 40%of China's population live in rural areas. Future rural population migration scale, migration flow and distribution,development speed in large-,medium-and small-sized cities,and life quality will characterize China's unique urbanization model. Considering the unsustainable resource consumption and huge growth in carbon emissions caused by traditional urbanization models,a new urbanization model characterized by green and low carbon is required, which not only meets people's consumption demands, but also achieves highquality development.
Three methods are widely used in analyzing the relationship between urbanization and energy consumption and CO2emissions. Based on historical data, a macroeconometric model is applied in discussing the correlation between urbanization levels and energy consumption and carbon emissions (Lin and Liu, 2010; Yang et al., 2015; Fu et al., 2014; Liddle and Lung, 2010). However, this method is mainly a summary of historical paths and cannot explain the influence mechanism of urbanization on energy consumption and emissions,so it is unsuitable for deciding longterm trends. Another popular method is the top-down modeling approach (JRC, 2013; Lee et al., 1994; O'Neil et al., 2010, 2012), which treats population, energy, and capital as production factors, and establishes the relationship between inputs and outputs through production functions.Computable General Equilibrium Model is one typical type of the various tools that can evaluate the impact of factor changes or policy implementation on a system's equilibrium state.However,the model is not able to explain the transition path between different equilibrium states, nor give specific suggestions of measures to reduce energy consumption and CO2emissions. The last method is the bottom-up modeling(IEA, 2018; IIASA, 2018; Ma and Chen, 2017), which is a partial equilibrium model. It can simulate the processes and technologies involved in the energy system at a detailed level, which makes it suitable for evaluating the technology substitution effect, including the impact of technology substitution on CO2emissions, resources consumptions and mitigation costs caused by technology advancement, as well as developing detailed roadmaps for different scenarios.After comparing the advantages and disadvantages of the above three methods, it was determined that the bottom-up model can meet the research goal of this study.
However, although each specific bottom-up model follows a similar modeling paradigm, significant differences between models in future energy service demand assumptions, energy consumptions, and CO2emissions projections could occur,even with similar population urbanization rates. For exemple,both ERI (2009) and Liu et al. (2011a) assumed more than 75% of urbanization rate in 2050, but their estimations for China's crude steel production in 2020 differed by 15%.Similar problems existed in the cement industry, where the total energy consumption estimations in 2050 differed by as large as 30% between studies (Fu, 2012; Liu et al., 2010;RMI, 2016; Chen et al., 2016). There are two main reasons for the differences: 1) the future demographic trend assumption in urbanization process is too simple; 2) the influence mechanism of demographic change on energy service demand is not well simulated in the model. Existing models usually considered rural and urban populations as a whole without examining the population structure, migration flow and distribution changes. They are therefor incapable to explain the impact of demographic structure changes on the energy system.
In view of these, this study aimed to build the interaction between the population and energy system, investigate the impact of urbanization process on future energy service demands, and find out a green and low carbon urbanization model and pathway which is both technical and economic feasible. The findings could improve our understanding of the influence mechanism of urbanization on energy consumption and emissions, and provide technical support for the government in designing new urbanization strategy that is consistant with long-term green and sustainable development.
2. Methodology and data
2.1. Framework and model
A comprehensive framework for analyzing interactions between demographic change and energy systems was developed (Fig. 1). Population change and income growth in the urbanization process act as important socio-economic drivers to promote energy services demand growth. On one hand, the urbanization process promotes the development of transport infrastructure and building construction; on the other hand, residents' trips for various purposes including leisure, tourism, and visiting relatives, the annual travel distance, vehicle and appliances ownerships keep on growing; the living conditions such as heating, cooling, hot water and lighting access also continue to improve. As a result, the infrastructure construction and consumer demand surges, which drive the production of industrial products such as steel and cement,energy service demands in building and transport sectors to grow, energy consumption and carbon emissions to rise. However, even with the same energy service demand, the resulting resources consumption and environmental impact depend on technological innovation and development path, which involve different investment directions and requirements.
In the population module, cities were divided into six categories (SC, 2014b). New urbanization planning for each city level and the national macro-population regulation policies(such as household registration system reforms) were taken into account to simulate the dynamic population migration process from rural to all city levels as well as the resulting urban structural changes.
The demographic simulation results were taken as exogenous variables for energy system model PECE-LIU(Program of Energy and Climate Economics) to simulate the energy service demands in industry, building and transport sectors, as well as the medium and long-term energy consumption and CO2emission trends. Future energy service demands were determined first by socioeconomic drivers such as population change and GDP,among which, the outputs of industrial products were calculated based on demands from downstream industries or sectors, such as transport infrastructure, building construction, vehicle and appliances ownership (MIIT, 2014; Shi et al., 2009; Shi et al., 2011; CQCC, 2013); while energy service demands for travel in the transport sector and living conditions in the building sector were determined according to residents' income levels, China's national conditions, and the experiences of developed countries. Then, with energy efficiency levels and fuel emission coefficients for various technologies that meet the energy service demand, the urbanization-driven medium and long-term energy consumptions and CO2emissions were derived. In order to investigate the urbanization paths and CO2emissions impacts under different technological innovation levels, a database of 406 technologies covering energy exploitation,processing, conversion and final consumption processes, and a wide range of information including technical performance, energy consumption, CO2emissions and cost were established by PECE-LIU, which enables the model to evaluate the emission reduction potential, mitigation costs and technical and economic feasibility of low carbon urbanization paths. PECE-LIU was developed based on Longrange Energy Alternatives Planning (LEAP) software(Heaps, 2017), with the base year as 2013 and the target year as 2050. The emissions results were mainly energy combustion related CO2, excluding carbon emissions from industrial production process.

Fig. 1. Comprehensive framework for the interactions between demographic change and energy system in the urbanization process.
2.2. Scenario settings
A scenario analysis method was used to discuss the impact of different technological development paths in meeting specific demands on China's long-term CO2emissions in the urbanization process,with two different types of urbanization paths under different technology development trends proposed namely, Business as Usual (BAU) scenario and Low Carbon Transition (LCT) scenario (Table 1). The technical mitigation measures can be divided into five types:1)energy efficiency technologies in the final sectors(industry,building,transport), such as fuel efficient vehicles, energy saving motors, and boilers; 2) energy structure adjustment technologies in the final sectors, which refer to technologies such as electric vehicles, biofuel vehicles and solar water heating equipment that replace oil and coal consumption by new energy;3)non-fossil fuel power generation technology in thepower sector1According to international energy system sector classification standards and energy consumption definitions, industry, building and transport sectors are all final energy consumption sectors. Energy consumption in the building sector refers to the amount consumed during building operations, rather than the consumption during building construction. Energy consumption of the transport sector refers to fuels consumed by all transport activities, including both operating transport and non-operating transport activities,such as private and official transportation (Zou et al., 2013).; 4) new industrial production process such as electric furnace steel-making technology to replace traditional converter steel-making;5)Carbon Capture and Storage(CCS) technology applied in iron and steel, cement, coalfired power generation, and gas-fired power generation sectors.

Table 1 Scenario setting.

Table 2 Data sources.
2.3. Data sources
Since the model covers the whole energy system, and involves a wide range of parameters and scattered data sources(Table 2), the most comprehensive data year, 2013, was identified and chosen as the base year for PECE-LIU model in order to ensure the integrity and consistency between various sources, and the latest statistics were applied where possible.
3. Urbanization trend and low carbon transition
3.1. Urbanization scenario
The urbanization rate in China was 57.35%in 2016(NBSC,2017), which was far below the average urbanization level in developed countries. In 2010, cities with less than 3 million population accounted for 94% (SC, 2014a) of the total. However there is an remarkable agglomeration effect in population migration (Table 3). In 2050, the dominating city groups of small and medium-sized cities comprise of only 26% of the total urban population, with an average urban population of about 0.37 million.In contrast,large and super-sized cities hold 56%of the total urban population,while the average number of urban residents in those cities reached 2.92 million, which was 7.9 times that of medium and small-sized cities.
According to UN (2015), China's total population will reach its peak around 2028 at about 1.42 billion, then slowly decline to about 1.35 billion by 2050. In this study, it isassumed that the Chinese government's plan to push the urbanization rate to reach 60% (SC, 2014a) by 2020, will be successful;in the medium and long-term,the urbanization rate will continue to advance rapidly, reaching 70% by 2030 and 78% by 2050, which is the average urbanization level of developed countries(WB,2016).This is an indication,during the period 2014-2050, more than 300 million people will migrate from rural areas to urban areas, implying huge demand for infrastructure construction, energy services, and industrial products.

Table 3 Population distribution and city number changes under urbanization process.
3.2. Population migration trends
PECE-LIU simulation showed that before 2020, a number of dominant small, medium-sized and large cities will be the main destinations for the migrating rural population, accounting for 71% of the total new urban population in this period (Table 3). After 2020, the population will increase in large city groups such as large and super large cities with a population size of 1-10 million. The proportion of urban population in these cities will increase from 44% in 2013 to 56% in 2050.
With population migration, the city size and structure change as well. During 2014-2050, 99 small and mediumsized cities will exceed the threshold of 1 million and 3 million population and develop into super large cities. A number of second-tier cities and provincial capitals will also be categorized into the super large city group. As a result, the number of type II,type I large cities and super large cities will grow rapidly from 134 in 2013 to 233 in 2050, and gradually become the main agglomeration area of China's urban population.
3.3. Future consumption demand
Population migration from rural to urban areas will first stimulate infrastructure investment in the transport and building sectors (Table 4). In order to meet the growing demands for frequent mobility and economic activity, the constructed mileage of highways, railways and inland waterways in China will keep rising. Taking the U.S. as a reference,whose land area is close to that of China,it was estimated that the Chinese infrastructure level in terms of highways, railways, and inland waterways will increase by 44%, 98%, and15% respectively, from 2015 to 2050. In cities, mass transit systems represented by rail transit will experience rapid development. Taking various local city conditions into consideration, and using the construction densities of urban rail transit abroad as a reference,it was estimated that the total mileage of urban rail transit in China will grow rapidly from 3618 km in 2015 to 31,184 km in 2050.In the building sector,urban population increase and residents'pursuit of comfortable living condition drive the growth of floor space per capita.The continuous improvement in supply capacity of urban public service will also promote public building floor space.Based on this development,national total floor space will nearly double the 2013 level by 2050.
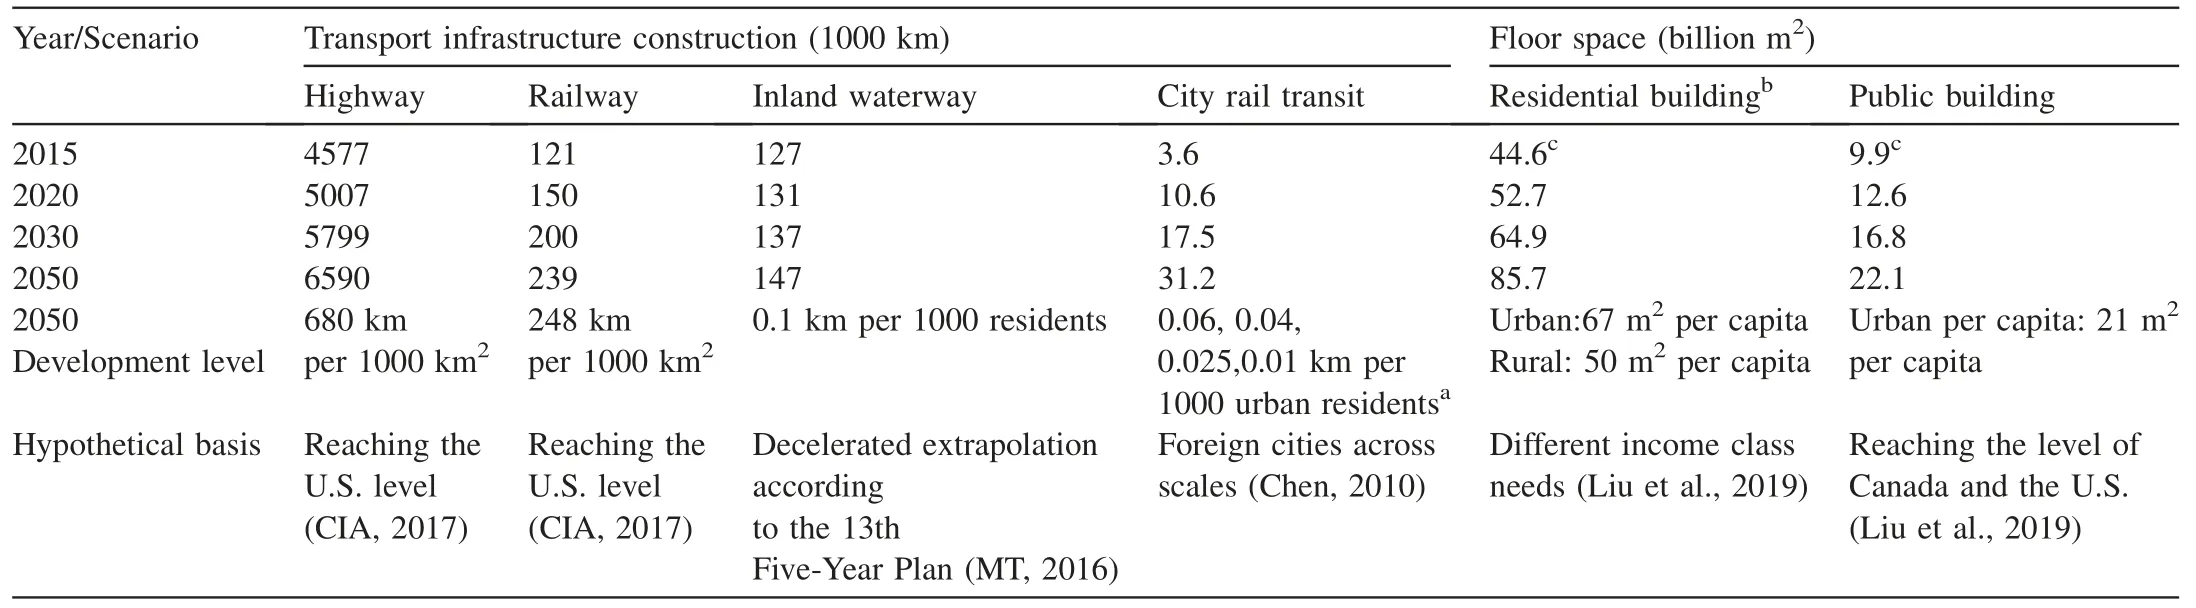
Table 4 Infrastructure development with urbanization process.

Table 5 Future living standard.
Based on the growing trend of travel demand for leisure,vacations, family visits, and business trips (Table 5), annual travel distance per capita was assumed to increase from 6742 km in 2013 to 18,000 km in 2050(Liu,2017).According to existing estimations,it was assumed that vehicle ownership will rise rapidly from 127 million in 2013 to 605 million in 2050 (Fu, 2012; Liu et al., 2018; RGERINDRC, 2018; Liu et al., 2011b). The corresponding vehicle ownership per 1000 people will be more than 400 by 2050, reaching EU's average level.The indoor living condition will be significantly improved,heating and cooling demands in southern China will be fulfilled, and 24-h hot water supply will be available. The indoor thermal and lighting conditions of rural houses will catch up with those in urban houses.The proportion of modernlarge-scale public buildings will increase from currently less than 10%-40%in 2050.Appliances penetration will be full in both urban and rural households (Liu et al., 2019).

Table 6 Demand for future industrial outputs (unit: Mt).
Driven by the demand from downstream industries such as building construction, appliances, and vehicles, crude steel and cement production will remain at a relatively high level in the near-term (Table 6), and peak in 2040, then decline as the downstream industries'demands slow down. Due to the surge in demand from automotive industry, appliances, and electronic products, electrolytic aluminum production will keep rising all the way and reach saturation after 2040. For the petrochemical and chemical industries, currently there is a supply shortage of organic chemical raw materials such as ethylene, but over-capacity of inorganic chemical raw materials including ammonia, caustic soda and soda ash. It was estimated that the total output of these four types of products will rise slowly in the long run.
3.4. Future energy consumption and carbon emissions

Fig. 2. Future energy consumption and CO2 emissions.
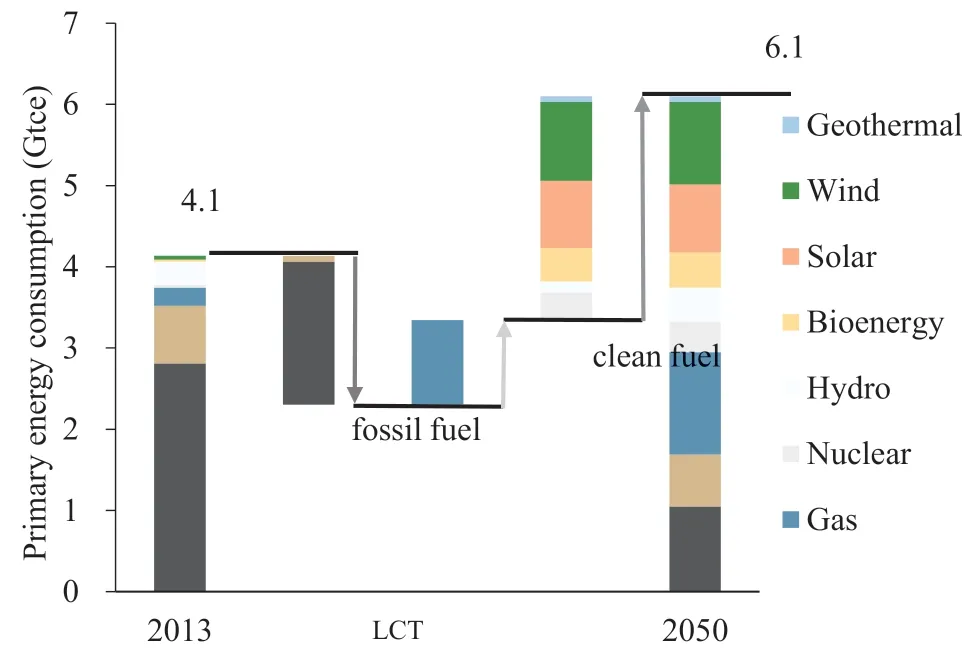
Fig. 3. Energy transition roadmap.
Sustained growth in energy service demand drives energy consumption and CO2emissions growth (Fig. 2). If the traditional urbanization development model and the technological progress rate are sustained under the BAU scenario,China's primary energy consumption demand will rise from 4.1 Gtce in 2013 to 8.4 Gtce in 2050,and energy-related CO2emissions will increase from 9.6 Gt to 17.6 Gt, which will result in significant environmental challenges. However,through the innovation of low carbon technology, in the LCT scenario,the total primary energy consumption in 2050 can be reduced to 6.1 Gtce,which is 27%lower than the consumption in the BAU scenario.Carbon emission reduction will be more significant. The total CO2emissions will peak in the period 2020-2025 by around 10 Gt.Then CO2emissions will decline rapidly and be reduced to 3.9 Gt by 2050,which is 78%lower than that in the BAU scenario. Therefore, technological innovation can effectively minimize the impact of urbanization on resources and environment to meet the same energy consumption demands.
3.5. Low carbon urbanization path
To implement a sustainable low carbon urbanization development path, the growth of total energy consumption must be first controlled. Under the LCT scenario, the total primary energy consumption will be controlled at around 4.8 Gtce and 5.6 Gtce in 2020 and 2030 respectively, and will be further stabilized at around 6.0 Gtce after 2040 (Fig. 3).Secondly, the energy system should be shifted to a clean energy-based energy structure.In LCT,the proportion of fossil fuels in primary energy consumption will fall from 90% in 2013 to 48% in 2050. Among them, the proportion of coal in primary energy consumption will decrease from 68% in 2013 to 17% in 2050, while the proportion of renewable energy in primary energy consumption will increase from 9%in 2013 to 45% in 2050.

Fig. 4. Energy transition technology roadmap.
The five major technical measures, including improving energy efficiency, adjusting the energy structure of the final sector, adjusting production processes, promoting non-fossil fuel power generation, and CCS technology, will play an important role (Fig. 4). Non-fossil fuel power generation and energy efficiency technologies are the two measures that contribute the most to emissions reduction, which contribute 40%and 27%,respectively.The second is to adjust the energy structure of the final sector.Through the coal-to-gas and coalto-electricity transitions in industry and building sectors and the development of new energy vehicles in the transport sector,this measure can contribute 15% of emission reductions.Adjusting industrial production processes especially in the iron and steel industry to improve the proportion of electric furnace steel-making, and applying CCS technology in the industry and power sectors, can both achieve 9% emission reductions respectively.
From the perspective of sub-sectors' transition paths(Fig. 5), in LCT scenario, the industry and power sectors will take the lead in achieving carbon emissions peak in 2020,laying the foundation for the earlier energy-related CO2peak of the whole society, and also leaving more emissions space for the building and transport sectors for which consumption demand will grow rapidly. The CO2emissions from the building sector will peak around 2027,and the transport sector will also achieve peak levels at around 2030. From the perspective of emission reduction potential, the power sector contributes the most to emissions reduction by up to 50%.The second is held by the industry sector,which accounts for 27%of the total emission reduction potential. The transport and building sectors contribute 18% and 6% of emission reductions potential, respectively.

Fig. 5. Transition roadmaps by sectors.

Fig.6.Accumulated and additional capital investment required by low carbon transition (in 2013 price).
To achieve a low carbon transformation of the urbanization path,an accumulated CN¥40.7 trillion of investment,which is CN¥20.2 trillion higher than that in the BAU scenario,will be needed in the medium and long-term(Fig.6).Compared with the cumulative GDP over the same period, total investment and new investment account for 3.0% and 1.5% of GDP,respectively. Among them, the transport and building sectors investments account for 35% and 33%, respectively,followed by the power sector (27%) and the industry sector (5%).
4. Conclusions and discussion
This study discussed the trend of China's demographic change, energy service demand, and the future urbanization paths supported by different technology roadmaps and their corresponding impacts on medium and long-term carbon emissions. The results showed that there will be a gradual trend of population migration from small and medium-sized cities to large and super large cities. By 2050, an estimated 300 million people will move from rural to urban areas. The population migration and the improvement of life quality in the urbanization process would accelerate the growth of infrastructure construction, industrial product production and energy service demand. Following traditional development models, China's primary energy consumption is expected to be 8.4 Gtce, while the energy-related CO2emissions are expected to be 17.6 Gt in 2050. However, through technological innovation, China's primary energy consumption can be reduced to around 6 Gtce and CO2emissions peak would come earlier in 2020-2025, followed by emissions of 3.9 Gt in 2050. Therefore, in the context of resource and carbon emission constraints, China should pursue a new urbanization path that meets the requirements of low carbon development.
The low carbon technology roadmap to achieving low carbon urbanization relies mainly on five major measures and technology investments. Among them, non-fossil fuel power generation and energy efficiency technologies have the greatest potential for emission reduction, followed by adjustment of the energy structure in final sectors, industrial production process and the application of CCS technology. From the perspective of sectoral transformation path, the industry and power sectors should take the lead in achieving carbon emissions peak by 2020. The implementation of low carbon urbanization requires a cumulative new investment of CN¥20.2 trillion,accounting for 1.5%of total GDP.Therefore,China can embark on a new urbanization path that is technically feasible and cost-acceptable.
This study has two policy implications. First, the new urbanization planning and the medium-to-long-term low carbon development strategies should be highly integrated.On the one hand, emphasizing meeting the fundamental requirements for life quality improvement; on the other hand,incorporating the low carbon development into the urbanization strategy,and proposing low carbon urban development goals in the key tasks of the urbanization strategy. Second,developing a low carbon transformation roadmap based on periods and sectors. The energy efficiency technologies and renewable energy power generation technologies should be promoted in the near-term, and the total carbon emissions of industry and power sectors should be controlled and peak first. In the medium and long-term, electric vehicles and biofuel vehicles need to be accelerated;energy efficiency and energy structure in the building sectors should be improved.Moreover, research and innovation of low carbon technologies should be accelerated, CCS technology and electric furnace steel-making technologies should be advanced, low carbon propaganda and low carbon travel and low carbon lifestyles should be actively promoted, so as to deep decarbonize the energy system.
It is worth noting that human needs are also elastically changing and there is great uncertainty. Demand side management is also an important aspect of green and low carbon urbanization as it can further reduce energy service demand and emissions by educating,guiding and controlling excessive consumption behavior. At present, this study only made assumptions on population migration,the potential improvement of life quality, and focused on the technology potential of emission reduction. If green and low carbon lifestyle can be promoted,there will be more space for adjustment potential of transformation process. The study did not consider the structural changes in consumption demand and the aging population impact on emissions.
This study integrated population migration and distribution with the energy system, and established the interactive relationship between demographic change and energy system consumption demand, which is a useful supplement to existing research frameworks and methods. This study's estimations of future energy services demands, especially the demand for energy-intensive industrial products,such as steel and cement, is generally higher compared with previous studies. Previous studies taking developed countries as references for assumptions on per capita consumption level,which cannot reflect China's real consumption structure and technology level. These evaluation results were generally optimistic, and some production forecasts were even lower than the actual consumption value (ERINDRC, 2009; Liu et al., 2010). Therefore, only by continuously strengthening the understanding of the relationship between population,consumption, production, and technology can we grasp the demand trend more accurately.
Conflict of interest
The authors declare no conflict of interest.
Acknowledgments
This work was supported by the China Postdoctoral Science Foundation (2019M650725); Shenzhen Low Carbon City Big Data Engineering Laboratory (ShenzhneDRC[2017]1089);Discipline Construction Program on Combating Climate Change and Low Carbon Economics of the Harbin Institute of Technology,Shenzhen,China(ShenzhenDRC[2018]725).
 Advances in Climate Change Research2019年4期
- Advances in Climate Change Research的其它文章
- Sensitivity of the simulated CO2 concentration to inter-annual variations of its sources and sinks over East Asia
- Impacts of degrading permafrost on streamflow in the source area of Yellow River on the Qinghai-Tibet Plateau, China
- Impact of environmental change on runoff in a transitional basin:Tao River Basin from the Tibetan Plateau to the Loess Plateau, China
- Regional differences in global glacier retreat from 1980 to 2015
- Assessments of the Arctic amplification and the changes in the Arctic sea surface