
Spatiotemporal variations in moisture conditions across Monsoon Asia during the last 500 years
2019-06-11 03:05:30ShuYuanKangYuGangGuo
ShuYuan Kang,YuGang Guo
1.Key Laboratory of Desert and Desertification,Northwest Institute of Eco-Environment and Resource,Chinese Academy of Sciences,Lanzhou,Gansu 730000,China
2.Gansu Innovative Environmental Science Technology Limited Liability Company,Lanzhou,Gansu 730010,China
ABSTRACT Spatial and temporal variations in moisture conditions across monsoon Asia were investigated using 347 Monsoon Asia Drought Atlas (MADA) grid points and 100 Chinese historical documents sites during the years 1470-2000. We applied Rotated Empirical Orthogonal Function(REOF)analysis to evaluate spatial moisture variability during the past 530 years.The first 13 principal components together explained 61.35% of the total variance, with the First Principal Component(PC1)accounting for 14.1%.After varimax rotation to the first 13 EOFs,we obtained new time series and spatial patterns.These patterns divided monsoon Asia into 13 regions with coherent moisture variability. Drought events were analyzed within these 13 regions.The results indicate that there has been a prominent drying trend in eastern and central Mongolia,Southeast Asia and east China during the last 50 years. Conversely, India and the Tibetan Plateau show a significant increase in moisture around the late 20th century.We found four drought periods,A.D. 1625-1644,A.D. 1710-1729,A.D.1920s,and A.D.1975-1999 occurred widely across monsoon Asia during the past 530 years.On inter-annual time scales,moisture variations in the northwest region of monsoon Asia, the Indian subcontinent and Southeast Asia are influenced by the El Ni?o-Southern Oscillation (ENSO).Thirty-year running correlation coefficient diagnostic analysis revealed that moisture variability in monsoon Asia is associated with the Pacific Decadal Oscillation(PDO).
Keywords:moisture variability;drought events;Monsoon Asia;ENSO;PDO
1 Introduction
Precipitation variability across monsoon Asia is mainly controlled by monsoon rainfall (Dai et al.,2003;Wahl and Morrill,2010),with significant socioeconomic and ecological implications for Asian countries. The intra-seasonal progress of the monsoon can lead to severe floods or droughts in different regions and can produce anomalous climate events (Qian etal., 2007). Moisture variations during the last millennium have been linked to large-scale atmospheric circulation features, including the El Ni?o-Southern Oscillation (ENSO; Cook et al., 2010), Pacific Decadal Oscillation (PDO; Buckleyet al., 2007), and other factors, such as volcanic eruptions (Anchukaitis et al.,2010), and solar forcing (Zhang et al., 2008). Evidence from observations and models has suggested that the increasing frequency and extent of droughts during the past decades are associated with global warming(Dai et al.,2004;Ma et al.,2005).However,we still lack knowledge of spatial patterns of moisture on decadal to centennial time scales due to the limited number of climate proxy series.
Recently, Cooket al. (2010) established a Monsoon Asia Drought Atlas (MADA) based on tree-ring data that provides an opportunity to explore spatial patterns of moisture variance during the past millennium across Asia. The MADA dataset also opens new possibilities for understanding global drivers of the Asian Monsoon's hydrological dynamics (Wahl and Morrill, 2010). However, in eastern China, the MADA dataset does not effectively represent dryness and wetness, and its accuracy remains poor in this region(Yang et al., 2013). Fortunately, there are abundant historical records in eastern China (Zhang, 1988;Zhang et al., 2003): for example, the Yearly Charts of Dryness-Wetness in China for the Last 500-year Period (Chinese Academy of Meteorological Science,1981) offers a comprehensive perspective on complex regional moisture variability. This Dryness-Wetness Index (DWI) has been widely used to analyze climate variability in China(Qianet al.,2012).
In the present study, we used the MADA dataset(except eastern China) and DWI dataset (only in eastern China) to explore spatiotemporal variations in moisture conditions and their relationships with atmospheric oscillations. Identifying these moisture patterns in long-term and large-scale climate histories can lead to a better understanding of their physical mechanisms and their spatial and temporal variability.
2 Data and methods
2.1 MADA dataset
Reconstruction of drought in monsoonal Asia were provided by the Monsoon Asia Drought Atlas (MADA) (Cook et al., 2010), which contains reconstructions of summer dryness and wetness since the year 1300.This atlas is available on a 2.5 degree by 2.5 degree grid, and was established by calibrating 327 treering chronologies with 534 MADA grid points. In this MADA dataset, positive values indicate wet conditions and negative values indicate dry conditions. Few treering series are available for incorporation into the MADA dataset in eastern China, where the climate is controlled by the summer monsoon (Li and Zeng, 2002).Therefore, tree-ring records are not accurate for reconstructing drought in eastern China using the MADA dataset(Yang et al.,2013).Here,we used the MADA data for all areas except the eastern regions (105°E-135°E) of China. The monsoon Asia region (except the eastern regions of China) is covered by a total of 347 MADA grid points,all of which were used in our study.
2.2 DWI dataset
The Dryness-Wetness Index (DWI) dataset contains 120 documented sites in China for the period 1470-2000 (Chinese Academy of Meteorological Science, 1981). This DWI dataset mostly includes data from central and eastern China, derived from local historical documents.There are insufficient sites classified as dry or wet in western China,because of missing historical records. The DWI dataset has five grades for each year: very wet (grade 1), wet (grade 2), normal(grade 3), dry (grade 4), very dry (grade 5). Here, we used DWI data only in the eastern regions (105°E-135°E)of China,yielding 100 suitable sites.
2.3 PDSI dataset
A total of 559 grid points of monthly Palmer Drought Severity Index (PDSI) from 1955 to 2005 were extracted for the monsoonal Asia region,on a 2.5°grid (Daiet al., 2004, hereafter, Dai-PDSI). Dai-PDSI is the most prominent index of meteorological drought and has been widely used in past studies (Kang et al.,2012). Dai-PDSI ranges from -10 (dry) to +10 (wet),and was first introduced as a metric of the accumulated moisture deficit relative to local mean moisture conditions for North America (Palmer, 1965).Later,Dai-PDSI was updated to include a global coverage.
2.4 Method
The MADA and DWI datasets represent moisture variations based on different measurements. Missing values in the DWI dataset were filled in using the Regularized Expectation Maximization (RegEM) method(Schneider,2001)applied in MATLAB.Then,the MADA dataset and DWI dataset were standardized to homogenize the original variability of all series over the period 1470-2000. Finally, each series of the DWI dataset was multiplied by-1.Thus,the MADA and DWI datasets (MADA-DWI) were standardized to allow full comparison, with positive values representing wet conditions and the negative values representing dry conditions.These processed data were applied here to investigate the spatial and temporal patterns of the moisture variations in monsoon Asia.
Next, we used the Empirical Orthogonal Function(EOF) or Principal Components Analysis (PCA) to investigate spatial and temporal characteristics of moisture variations across monsoon Asia. This method has been widely used in meteorology and climatology to define the spatial and temporal variability of a large set of variables (Rao and Hsieh, 1991; Singh, 2004; Hannachi et al., 2009). To objectively define the most significant regional patterns of moisture variability across monsoon Asia,we also used a varimax Rotated Empirical Orthogonal Function(REOF)over the period 1470-2000. The varimax rotation method (Richman, 1986)attempts to simplify the structure of the patterns by making each factor have a small number of large loadings and a large number of near-zero loadings.
The Multi-Taper Method (MTM, Mann and Lees,1996) of spectral analysis was used to investigate the variability of mean moisture conditions in the frequency domain.
3 Results and discussion
3.1 The spatial and temporal characteristics of moisture variations
To obtain more information about monsoon Asia climate variations in time and space, PCA was carried out on 447 MADA-DWI series for the common period of 1470-2000.The results indicate that the first 13 EOFs captured 61.35% of the total variance for moisture in the dataset.These first 13 EOFs can reflect the moisture variability across the whole of Asia. Therefore, rotating the first 13 loading vectors of the initial EOFs produces a new set of REOF modes. The orthogonal varimax rotation appears to be an ef f i cient way to recover regional patterns of moisture variability across monsoon Asia.
The f irst 13 REOF loading patterns are presented in Figure 1, and their associated scores in Figure 2. In order to emphasize decadal variations, the low-pass time series of the f irst 13 REOF scores was calculated using an FFT filter, presented in Figure 2. We defined the positive values representing wet conditions and the negative values representing dry conditions in Figure 2.
REOF1 essentially represents the characteristic moisture variability in the northwestern part of monsoon Asia.This pattern explains the largest percentage of the total moisture variance (10.1%). The score of this pattern shows a high degree of decadal variability in moisture in this region. The longest dry period occurred in the 20th century.
REOF2 explains 8.1% of the total moisture variance and represents moisture variability in India, with the highest loading at around 25°N,80°E in central India. The corresponding factor score indicates a relatively low degree of variability in moisture over the past 530 years. Relatively wet conditions were found during the last 50 years.
REOF3 mainly represents the characteristic moisture variability across parts of the western areas of central-west monsoon Asia, from 35°N to 55°N and east of 105°E.This factor explains 8.0% of total variance, and its score suggests that moisture conditions in this region have fluctuated with no persistent trend during the study period.
REOF4 is heavily loaded over Mongolia.This pattern explains 6.3% of the total variance, with the largest loading in eastern and central Mongolia. The scores associated with this pattern indicate strong decadal variations. The driest conditions were observed for the latter half of the 20th century. The distinct drying trend since the 1980s has been documented by many studies (Li et al., 2007; Zhang et al.,2008).Regional droughts are mainly controlled by the Asian monsoon system (Shi et al., 2007; Zhang et al.,2008), and the weakening of the Asian monsoon may be the main cause of the recent drying.
REOF5 describes moisture variability in southern monsoon Asia,particularly in central India,the Himalayas, Myanmar and Thailand. Variance explained by this pattern is 5.0%.The associated scores demonstrate that moisture conditions in this region were highly variable during 1470-1650 and 1900-2000.The driest period in this region was from 1950 to 2000.
REOF6 represents coherent moisture variability over Southeast Asian countries. This pattern explains 4.6% of the total variance. The scores for this pattern indicate two prominent periods of drought in the mid-18th and late 19th centuries,where similar drought periods over northern Vietnam were identified by Sanoet al. (2009).The relatively dry period around the late 20th century is consistent with results from northern Laos(Xu et al.,2013).
REOF7 is heavily loaded over the northeastern Tibetan Plateau. This pattern explains 4.2% of the total variance. We analyzed the correlation between the score of this pattern and the first principal component of seven moisture-sensitive ring-width chronologies from the Qilian Mountains (Yang et al., 2010) during the common period 1470-2000, finding a significant correlation (r=-0.61, p <0.01) which probably reflects long-term similarities between these two series.
REOF8 represents moisture variability in far-western central monsoon Asia. The factor explains 3.4%of the total variance and represents moisture variability in Afghanistan, Pakistan, Tajikistan and Kyrgyzstan. The scores suggest that there is no persistent moisture trend in this region.
REOF9 explained 2.9% of the variance. This pattern describes moisture variability in northwestern China, southwestern Mongolia, Kyrgyzstan, Tajikistan and southeastern Kazakhstan. We analyzed the correlation between the score of this pattern and the drought index reconstruction for far-western Mongolia (Davi et al., 2009) in the period 1565-2000, finding a significant correlation (r = 0.26) at the 0.01 level. The wettest and driest periods are consistent between the two series. This result shows the similarity in moisture variability in this region.
REOF10 essentially represents the moisture variability in northeastern China. This pattern explains 2.7% of the total variance. The correlation coefficient between the scores for this pattern and precipitation in the North China Plain derived from historical documents(Zheng et al.,2006)is 0.47,significant at the 0.01 level.This correlation shows that sites in this area experienced broadly similar fluctuations in the common period 1470-1995.
REOF11 explains 2.1% of the total moisture variance and represents moisture variability in northern monsoon Asia. There is an obvious decreasing trend in this score after 1950.
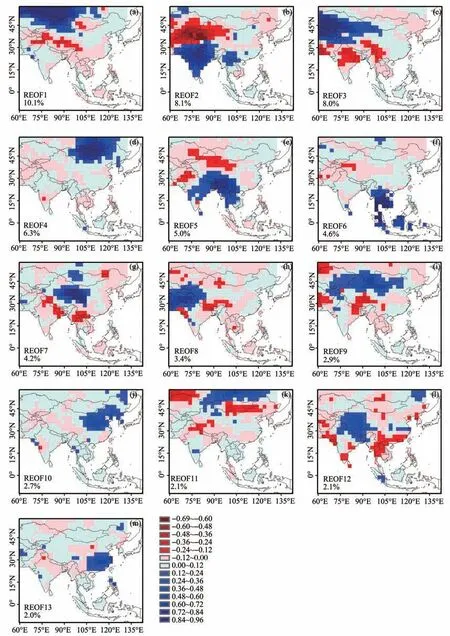
Figure 1 The first 13 REOF spatial patterns of the monsoon Asia region during the period 1470-2000.The percentage variance accounted for by each factor is labeled in each map
REOF12 mainly represents the characteristic moisture variability across most parts of the Tibetan Plateau and explains 2.1% of total variance. During the last century, an increasing trend in moisture variance was seen in the score for this pattern, which is consistent with tree-ring records on the Tibetan Plateau(Liu et al.,2012;Wang et al.,2013).The increased Indian summer monsoon strength in the 20th century was also recorded (Anderson et al., 2002). This wet period across the whole Tibetan Plateau may have been caused by the Indian summer monsoon regime during that time.
Finally, REOF13 essentially represents the characteristic moisture variability in southeastern China. This pattern explains 2.0% of the total moisture variance.The scores show a similar trend in moisture variability to that in the Jiang-Nan area (Zhenget al., 2006) (r=0.26, p <0.01) during the study period (1470-1995).A recent study indicated that the East Asian summer monsoon circulation has experienced an inter-decadal weakening from the 1960s to the 1980s(Li et al.,2010),associated with reduced rainfall in North China and increased rainfall in central East China along 30°E(Yu etal., 2004).This result agrees with our study, specifically the drying trend in the REOF 10 scores curve and wetter trend in the REOF 13 scores curve.
Based on the distribution of these 13 major factors, monsoon Asia can be divided into a 13-level climatic regions.
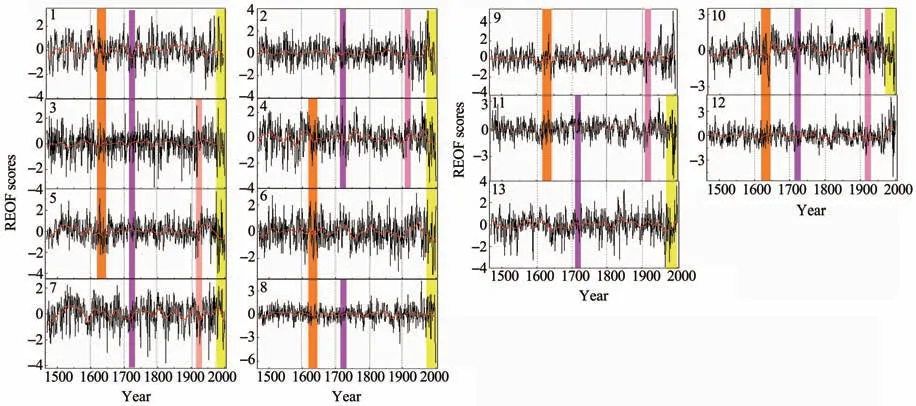
Figure 2 The first 13 REOF scores corresponding to the first 13 factor patterns presented in Figure 1.The red lines are 11-a FFT smoothed curves.Common dry periods are indicated by shaded bars.
3.2 Typical decadal drought events
As presented in Figure 2,the first 13 REOF scores of annual values were smoothed using an 11-year FFT filter to highlight multi-decadal moisture variations.We defined a wet spell as the period when the smoothed value is positive and a dry spell as the period when the smoothed value is negative. During the past five centuries, previous studies found that there have been four typical decadal drought events (Fang et al., 2013; Yang et al., 2014), which occurred in northern China, central and eastern Asia. To illustrate the utility of our study in describing large-scale moisture variations, we examined these four severe drought events. These occurred during A.D. 1625-1644, 1710-1729, the 1920s, and finally the drought of 1975-1999 which led to major economic and life losses in China (Kang et al., 2013). These events are clearly indicated in Figure 2 by shaded bars.
The drought during A.D. 1625-1644 covered almost all of monsoon Asia except for the Indian subcontinent, Tibetan Plateau and southeast China. This dry epoch may have been caused by a Southerly shift in the position of the Pacific Inter-tropical Convergence Zone (ITCZ) and the weaker Asian summer monsoon(Yang et al., 2014). During the dry period A.D. 1710-1729, Southeast Asia, Mongolia, the Indian subcontinent and south China did not suffer from drought.This drought might have been related to the weakening of the westerlies and the East Asian summer monsoon(Fanget al., 2013). A widespread drying tendency occurred in the 1920s. In comparison with the other three drought events, this event was the most widespread and intense. The drought extended across most of China,Mongolia and the Indian subcontinent, but there were wet conditions in Southeast Asia and Pakistan. During A.D. 1975-1999, most of continental Asia was hit by drought, with the exception of the Indian subcontinent,Tibetan Plateau and Mongolia. Recent studies (Yang et al., 2014) show that this drought event and the drought of A.D. 1625-1644 exhibited similar patterns, but the drought during A.D. 1975-1999 resulted from warm temperature anomalies in the tropical Pacific.
3.3 Physical mechanism of moisture variations
Spectral properties of time series of the 13 REOF scores of moisture variability were examined using the MTM method over their common reliable period 1470-2000. As presented in Figure 3, all these results indicate a robust common inter-annual variability at 2.1-6.3 years.Also, there were several significant peaks at 7.6,8.0 and 9.1 years;and some decadal cycles at 10.0,10.8, 11.0 and 26.2 years were significant at the 99%significant levels.The 2-8 years band typical of ENSO was found in this study. The low-frequency decadal(10-12 years) band and bidecadal (20-30 years) band of the PDO was also found in the spectral analysis.These common inter-annual cycles demonstrate how the characteristics of moisture variability in the 13 climatic regions are affected by the same physical mechanism or atmosphere-ocean circulation pattern.
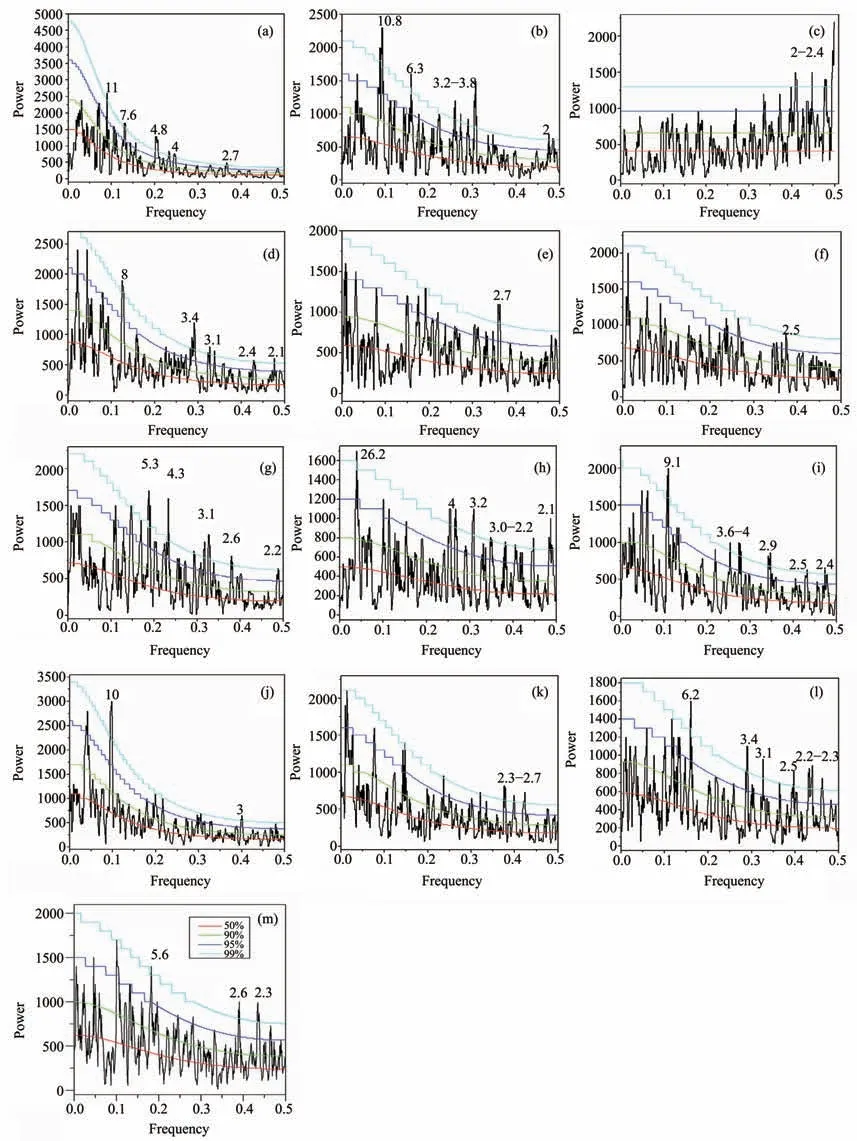
Figure 3 MTM analysis result for the time series of the 13 rotated factors for period 1470-2000.Rotated factors are arranged according to their spatial distribution patterns presented in Figure 1.The red,green,purple and blue lines indicate the 50%,90%,95%and 99%significance levels,respectively
Many studies have identified the influence of ENSO on inter-annual variations of the great drought in monsoon Asia (Cook et al., 2010). To further analyze the influence of atmospheric oscillations on moisture variations over monsoon Asia,we computed the correlation between ENSO Index(Li et al.,2013)and MADA-DWI data on annual timescales during the common period 1470-2000. This ENSO reconstruction(Liet al., 2013) covers a long period, based on many tree-ring chronologies from the tropics and mid-latitudes in both hemispheres, and has a high correlation with equatorial Pacific corals. Figure 4 shows that northwest regions displayed a positive spatial correlation pattern, in contrast to southwest regions which displayed a negative spatial correlation pattern. These findings show that ENSO is associated with wetness in the northwest regions of monsoon Asia and dryness in the Indian subcontinent and Southeast Asia regions.
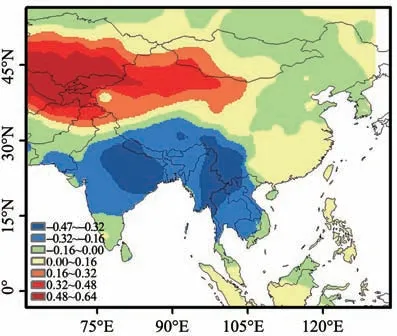
Figure 4 Spatial correlation of the ENSO reconstruction(Li et al.,2013)with the MADA-DWI series of the monsoon Asia region during the period 1470-2000.The positive correlation coefficient is more than 0.16 indicate significant correlation between the two series,and vice versa(significant at the 0.05 level)
To investigate whether this influence has been robust during the instrumental period, we also computed the correlation between the ENSO reconstruction (Liet al.,2013) and the Dai-PDSI data (Dai et al., 2004) during the period 1955-2005. Figure 5 shows similar spatial correlation patterns to those in Figure 4, but with more restricted impacts. These results also suggest that the MADA-DWI series perform reasonably well when used to describe moisture conditions across monsoon Asia.
The PDO is associated with changes in ENSO,with more El Ni?o activity during the positive PDO and more La Ni?a activity during the negative PDO.The timescale of the PDO is around 20-30 years,while typical ENSO events persist for 6-18 months.A PDO index developed by Shen et al. (2006) was used in our study. A remarkable characteristic of this index is its study region on the western side of the Pacific Basin. To investigate possible influences on the moisture variability of monsoon Asia, we calculated spatial correlations between PDO index and MADA-DWI data(Figure 6). A 30-year moving average was applied to the PDO index and our first 13 REOF scores for the period 1470-1998. We also considered the reduction in degrees of freedom when testing the significance of correlation coefficients (Bretherton et al., 1999). There were significant spatial correlations with PDO:a significantly negative correlation was found in east China and Kazakhstan, while a significantly positive correlation was found across Mongolia and the Indian subcontinent.Therefore,the different phases of the PDO influence drought distribution across monsoon Asia. During the drought period in east China, the sea surface temperature anomaly is positive in the tropical eastern Pacific but negative in the extra-tropical North Pacific,indicating a warm PDO phase,and vice versa.
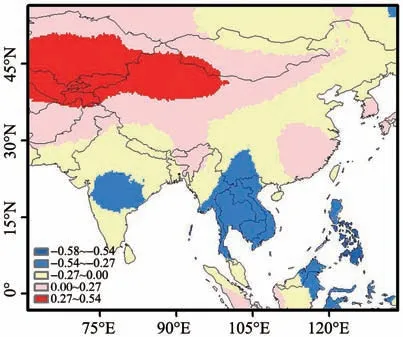
Figure 5 Correlation patterns of the ENSO reconstruction(Li et al.,2013)with the Dai-PDSI series of the monsoon Asia region during the period 1955-2005.The positive correlation coefficient is more than 0.27 indicate significant correlation between the two series,and vice versa(significant at the 0.05 level)
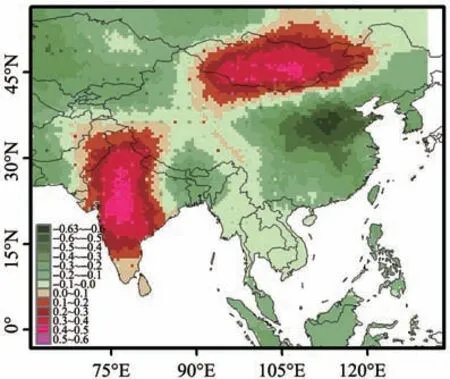
Figure 6 Spatial correlation of 30-year running mean between the PDO index and the MADA-DWI series over the monsoon Asia region during the period 1470-1998.The positive correlation coefficient is more than 0.1 indicate significant correlation between the two series,and vice versa(significant at the 0.05 level)
4 Conclusions
We have used the MADA and DWI datasets to investigate spatial and temporal patterns of moisture variability across monsoon Asia regions during the past 530 years.The 13 most significantly regional patterns of moisture variability were objectively defined using REOF analysis. The 13 factors identified may belong to different climate regimes with different processes influencing their moisture conditions. Correlation between atmospheric oscillations and moisture variations across monsoon Asia suggests that moisture variability is influenced by linkages with ENSO on annual time scales in the northwestern and southwestern regions. The PDO plays an important role in the occurrence of decadal to inter-decadal drought or flood in monsoon Asia. These results may provide a valuable reference when investigating the physical basis of our 13 patterns in monsoon Asia, as well as for climate models; they also provide an important insight into climate change that may inform governmental decision making.
Acknowledgments:
The study was jointly funded by the National Natural Science Foundation of China (Grant Nos. 41405085 and 41325008), Interdisciplinary Innovation Team project of the Chinese Academy of Sciences(29Y329B91), the Chinese Academy of Sciences Visiting Professorship for Senior International Scientists(Grant No. 2010T1Z31) and Foundation for Excellent Youth Scholars of CAREERI,CAS.
 Sciences in Cold and Arid Regions2019年6期
- Sciences in Cold and Arid Regions的其它文章
- An evaluation of soil moisture from AMSR-E over source area of the Yellow River,China
- Vegetation change and its response to drought in Inner Mongolia of northern China from 1998 to 2013
- Characteristics of climate and melt runoff in the Koxkar Glacier River Basin,south slope of the Tianshan Mountains,Northwest China
- Definition of failure criterion for frozen soil under directional shear-stress path
- Editors-in-Chief Guodong Cheng and Ximing Cai
- Relationship between ponding and topographic factors along the China-Russia Crude Oil Pipeline in permafrost regions