
Climate Change of 4°C Global Warming above Pre-industrial Levels
2018-05-19 06:00:30XiaoxinWANGDabangJIANGandXianmeiLANG
Advances in Atmospheric Sciences 2018年7期
Xiaoxin WANG,Dabang JIANG,and Xianmei LANG
1Institute of Atmospheric Physics,Chinese Academy of Sciences,Beijing 100029,China
2CAS Center for Excellence in Tibetan Plateau Earth Sciences,Beijing 100101,China
3Collaborative Innovation Center on Forecast and Evaluation of Meteorological Disasters,Nanjing University of Information Science&Technology,Nanjing 210044,China
4Joint Laboratory for Climate and Environmental Change at Chengdu University of Information Technology,Chengdu 610225,China
5University of Chinese Academy of Sciences,Beijing 100049,China
1.Introduction
According to the Fifth Assessment Report(AR5)conducted by the Intergovernmental Panel on Climate Change(IPCC),the climate system is undergoing a warming process,in which an increase of 0.65°C–1.06°C for the global average surface temperature has occurred over the period 1880–2012.It is 95%certain that the ongoing warming can be attributed to the human activity since the mid 20th century(IPCC,2013).Sustainable social and economic development is increasingly in conflict with climate change and a closely linked series of problems,such as environmental deterioration,ecological degradation,decreased biodiversity,and decreasing food and water supplies.In particular,the climate is connected to a great number of shocks,which can push households into poverty,such as health problems,food price shocks,crop reduction,and natural disasters.These shocks will intensify under climate change,leading to a projected extra 100 million people experiencing poor living standards by 2030(Hallegatte et al.,2015).Hence,investigations into future climate change are of broad social and scientific interest.
To avoid the severe risks induced by climate change,the international community aims to control the increase in global mean temperature at a certain threshold.It should be noted that global climate change includes a series of regional and local climatic variations,which have diverse impacts(Joshi et al.,2011),and currently there is no objective warming target that can really identify when the climate system can no longer bear the risk of dangerous interference(IPCC,2013).In recent decades,to combat climate change,the most frequently discussed threshold is a 2°C limit with respect to the pre-industrial period,which was initially proposed in 1996 by the European Union and advocated as the suitable global warming threshold in the 2009 Copenhagen Accord(Randalls,2010).Based on the bene fits of limiting further global warming,the Paris Agreement proposed a more ambitious intention,which is to pursue international efforts to control the global mean temperature increase to 1.5°C relative to pre-industrial levels(http://unfccc.int/resource/docs/2015/cop21/eng/l09r01.pdf).Accordingly,many studies have been conducted to address the cumulative greenhouse gas emissions budgets(e.g.,Rogelj et al.,2011;Friedlingstein et al.,2014;Rogelj et al.,2015;Schleussner et al.,2016a),emergence times(e.g.,Vautard et al.,2014;Jiang et al.,2016),and climate changes(e.g.,Kaplan and New,2006;Anderson,2012;May,2012;Sui et al.,2015;Wang et al.,2017)relevant to the 1.5°C and 2°C targets.Additionally,since the IPCC is preparing to present a special report in 2018 on the impacts of a 1.5°C global warming,there has been considerable debate on the assessment of this level and its difference witha2°Ctarget(Schleussneretal.,2016b;KingandKaroly,2017;King et al.,2017).Considering the thermal inertia and complexity of the climate system,along with its carbon cycle feedback and radiative efficiencies(Steinacher et al.,2013),global warming may reach a higher level than 2°C.For instance,there is reasonable con fidence that the global mean temperature will increase by more than 4°C in 2081–2100 relative to 1850–1900 under the RCP8.5 greenhouse gas concentration scenario(IPCC,2013).Therefore,of importance for climate change is investigating a world that exceeds the 2°C target,because that situation may bring unprecedented challenges.
As stated in a public report by the World Bank(2012),a great many record-breaking heat events,heavy floods,and extreme droughts will occur if global warming crosses the 4°C level with respect to the pre-industrial period,which would cause severe threats to ecosystems,human systems,and associated societies and economies.Thus,the report suggested making every effort to avoid a 4°C global warming,to prevent catastrophic losses.With this recommendation in mind,Friedlingstein et al.(2014)indicated that,from 2015 onwards,the remaining cumulative CO2emissions quota associated with a 50%likelihood of exceeding 4°C by 2100 is estimated to be 5100(5000–6500)Gt(1 Gt=1012kg).In addition to greenhouse gas emissions budgets,preliminary attention has also been given to the emergence time of 4°C warmingabovepre-industriallevels.Basedon17simulations in a HadCM3-QUMP-perturbed ensemble under the highest SRES A1FI emissions scenario(QUMP:Quantifying Uncertainty in Model Predictions project),the best estimated emergence time of 4°C global warming relative to 1861–90 was projected to occur in the 2070s(Betts et al.,2011).In other work,the timing of 4°C global warming relative to 1871–1900 will be crossed in 2081,according to the historical and RCP8.5 experiments of 29 models in CMIP5(Zhang et al.,2013).Also,in a report by the World Bank(2013)on the basis of the RCP8.5 experiments from 20 CMIP5 models,the estimated timing of 4°C global warming relative to 1851–79 is in the 2080s.Note that these projections were presented relative to various periods around 150 years ago—namely,1861–90(Betts et al.,2011),1871–1900(Zhang et al.,2013)and 1851–79(World Bank,2013)—during which external forcings had evolved with time(Taylor et al.,2012).However,because external forcings are fixed at non-evolving pre-industrial conditions,and the future RCP experiments do not include natural external forcings(Taylor et al.,2012),it is more reasonable to take the pre-industrial control experiments(ca.1850)as the reference period.Additionally,only some of the CMIP5 models have been applied in previous projections(World Bank,2013;Zhang et al.,2013),which may hamper our understanding of the timing.In any case,the time at which global warming will reach a 4°C increase in comparison with the pre-industrial level needs to be explicitly examined,especially based on the numerical experiments carried out by all the obtainable CMIP5 models.
In addition to the timing,there is a lack of quantitative assessments on the implications of 4°C global warming(Fung et al.,2011;Zelazowski et al.,2011).Actually,the corresponding climate changes are of equal importance for an objective insight into a 4°C global warming.Previously,James and Washington(2013)used 24 CMIP3 models to project African temperature and precipitation changes at 1°C,2°C,3°C and 4°C of global warming.Wang et al.(2015)applied 26 CMIP5 models to project future changes in extreme hot summers over land in association with a 4°C global warming.Note that the climate varies from region to region(Mahlstein et al.,2011),which raises a key question as to whether local changes are sufficiently perceptible relative to natural internal variability(Hawkins and Sutton,2012).It is more relevant to investigate whether the magnitude of local climate changes will go outside their background variabilities in a world under 4°C of global warming.For a 4°C global warming,there has been no speci fic research about the climate changes in terms of the signal-to-noise ratio(SNR)using the latest CMIP5 experiments.Given the widely discussed investigation of a 1.5°C global warming,extra emphasis should also be placed on the differences between 4°C and 1.5°C of global warming,especially from the view of the SNR.In addition,considering that different institutes have developed climate models somewhat independently on the basis of a range of numerical schemes for dynamic frameworks and parameterizations for processes(Doblas-Reyes et al.,2009;Taylor et al.,2012),and hence each model projects somewhat divergent climate changes under the same radiative forcings,the inter-model disagreement should also be given special attention to.
Accordingly,the present work provides a global-scale analysis of temperature and precipitation changes related to a 4°C global warming.The data and methods are described in section 2,and the emergence time of 4°C global warming and the corresponding climate changes,as well as the intermodel disagreement among projections,are given in section 3.Finally,a discussion and conclusions are presented in section 4.
2.Data and methods
2.1.Data
Monthly data are obtained from 39 climate models of the CMIP5 archives.These models and their experiments are described in Taylor et al.(2012),and the output data are accessible at http://pcmdi9.llnl.gov.The experiments for the preindustrial run,the historical run,and the 21st century projection run under the RCP8.5 scenario are taken for analysis(Taylor et al.,2012).Table 1 gives the basic information about the 39 climate models,as well as their experiments.Considering that some experiments for some models have multiple ensemble members,the ultimate data for the models running ensembles are obtained from the median of multiple realizations.With regards to the pre-industrial control run,the integration time differs from model to model,and we select the past 200 years of output data for all models to analyze.The horizontal resolutions of the 39 models vary from 0.75°×0.75°to 3.75°×3.75°.To be more uniform,we use the same method as Jiang et al.(2016)to obtain a 2°×2°horizontal grid resolution to perform multi-model analyses.
2.2.Methods
To obtain the emergence time of a 4°C global warming,if rst,time series of the global mean temperature above the pre-industrial levels for the 39 models are smoothed by usinga nine-year running mean to remove the interannual variabilities.After that,the first single year when the median time series of temperature exceeds 4°C is defined as the emergence time of 4°C global warming.To estimate the SNR of climate variables,the background noise and climate change signal need to be estimated.The signal for each variable is expressed as the difference between the nine-year average and the pre-industrial levels for the models that could reach a 4°C increase,and the nine-year period centers the emergence time in association with its own 4°C global warming.Climate noise is the internal variability of a climate system(Hawkins and Sutton,2012).Deser et al.(2012)suggested that the background variability of the climate system occurs without external forcings,and the processes inherent to the ocean,atmosphere,andcoupledocean–atmosphere–landsystem are also included.We estimate the noise of temperature and precipitation by using the pre-industrial control simulation of each model.In this work,the interannual standard deviation of the linearly detrended time series for the last 200 years of the pre-industrial control run is taken to calculate the noise,because there is climate drift independent of internal variability for some models(Gupta et al.,2013).The signal and noise are calculated at each grid cell for each model that can reach a 4°C increase,and then the multi-model median is obtained.
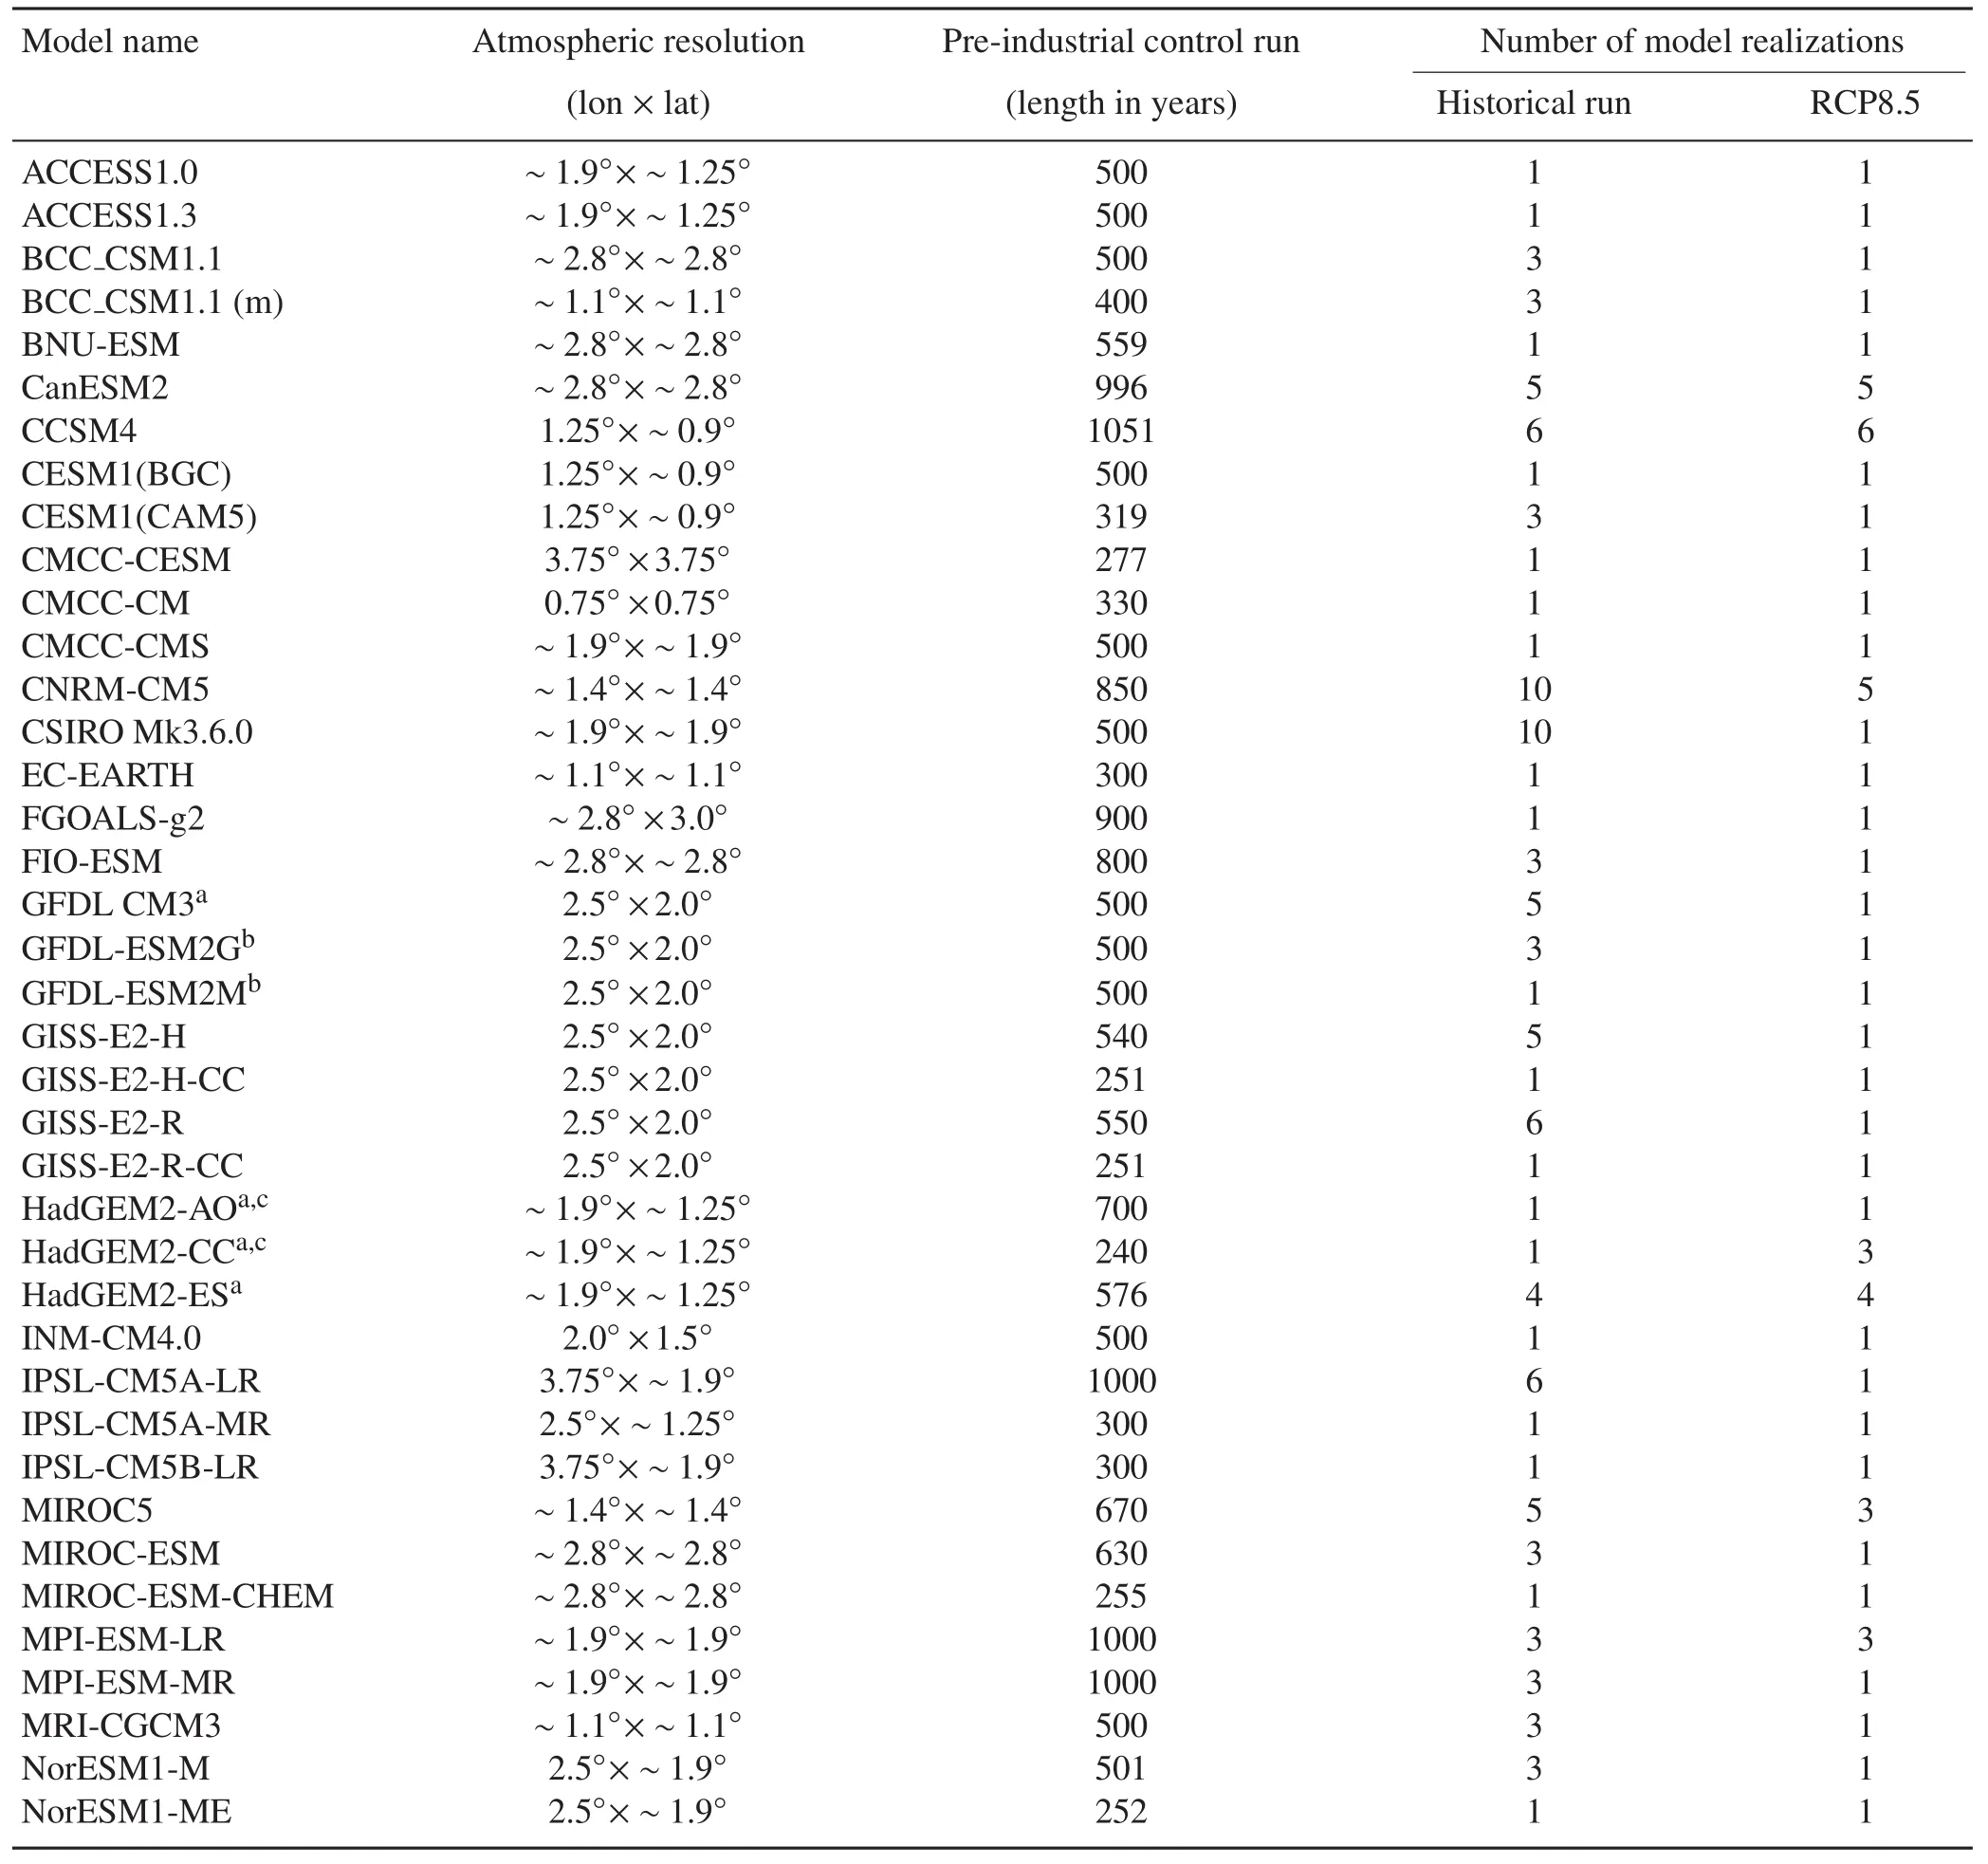
Table 1.Information regarding the 39 CMIP5 models and their experiments as applied in this study.The superscripts “a”and “b”after model names stand for historical run periods of 1860–2005 and 1861–2005,respectively,whilst“c”indicates the RCP8.5 run for 2006–2099,rather than the historical run period of 1850–2005 and RCP8.5 run period of 2006–2100 for other models.
Inaddition,inter-modeldisagreementisfurthertakeninto account,which refers to the consistency among the different models’projections.To estimate the scatter of projected changes among individual models,we use the standard deviation of signals for individual models that can reach a 4°C global warming to measure the inter-model spread.The ratio of inter-model spread to the absolute value of the median signals of all the models that can reach a 4°C global warming is utilized to depict the disagreement among the models.A ratio oflessthan1.0meansthatthemodelsimulationhasconsiderable consistency;otherwise,it indicates large disagreement.
3.Results
3.1.Emergence time of 4°C global warming
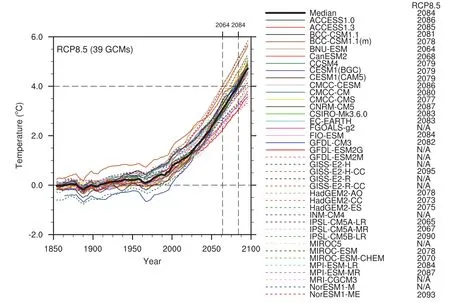
Fig.1.Time series for global mean annual surface temperature changes by a nine-year moving mean method,for all 39 models under RCP8.5 above the reference pre-industrial period.The vertical black dashed lines show the first year and the median year to reach the 4°C global warming among all the models.In the right-hand legend,the listed years are the timing of 4°C warming for individual models,and “N/A”indicates that a 4°C global warming is not projected to occur in the 21st century.
The RCP8.5 scenario is a high emissions scenario,and one that does not include any speci fic climate mitigation(Riahi et al.,2011).Under this scenario,29 out of the 39 models reach a 4°C global warming by 2100,with the earliest at 2064 in BNU-ESM and the latest at 2095 in GISS-E2-HCC(Fig.1).That means if greenhouse gas emissions continue to rise with no mitigation,many of the models suggest a 4°C global warming being reached in the 21st century.When viewed from all 39 models,the median onset year of 4°C global war ming is2084,which iscompatible with an increase of 4°C–5°C of the global mean temperature with respect to the pre-industrial level during 2080–2100,as reported by the World Bank(2013).This timing is approximately one decade later than the previous best estimate of the 2070s for when a temperature rise of 4°C,relative to 1861–1890,will be reached,based on 17 simulations using the HadCM3-QUMP-perturbed ensemble under SRES A1FI(Betts et al.,2011).This difference in timing links to the differences in the reference periods,models,as well as the emissions scenarios.By 2100,the likelihood of exceeding a 4°C increase above preindustrial levels is 74%for RCP8.5,which is lower than the 80%obtained from 20 climate models under RCP8.5(World Bank,2013).As such,only 29 models(excluding FGOALS-g2,GFDL-ESM2G,GFDL-ESM2M,GISS-E2-H,GISS-E2-R,GISS-E2-R-CC,INM-CM4.0,MIROC5,MRI-CGCM3 and NorESM1-ME)that reach the 4°C global warming by 2100 are applied in the following analyses.
3.2.Surface air temperature changes of a 4°C global warming
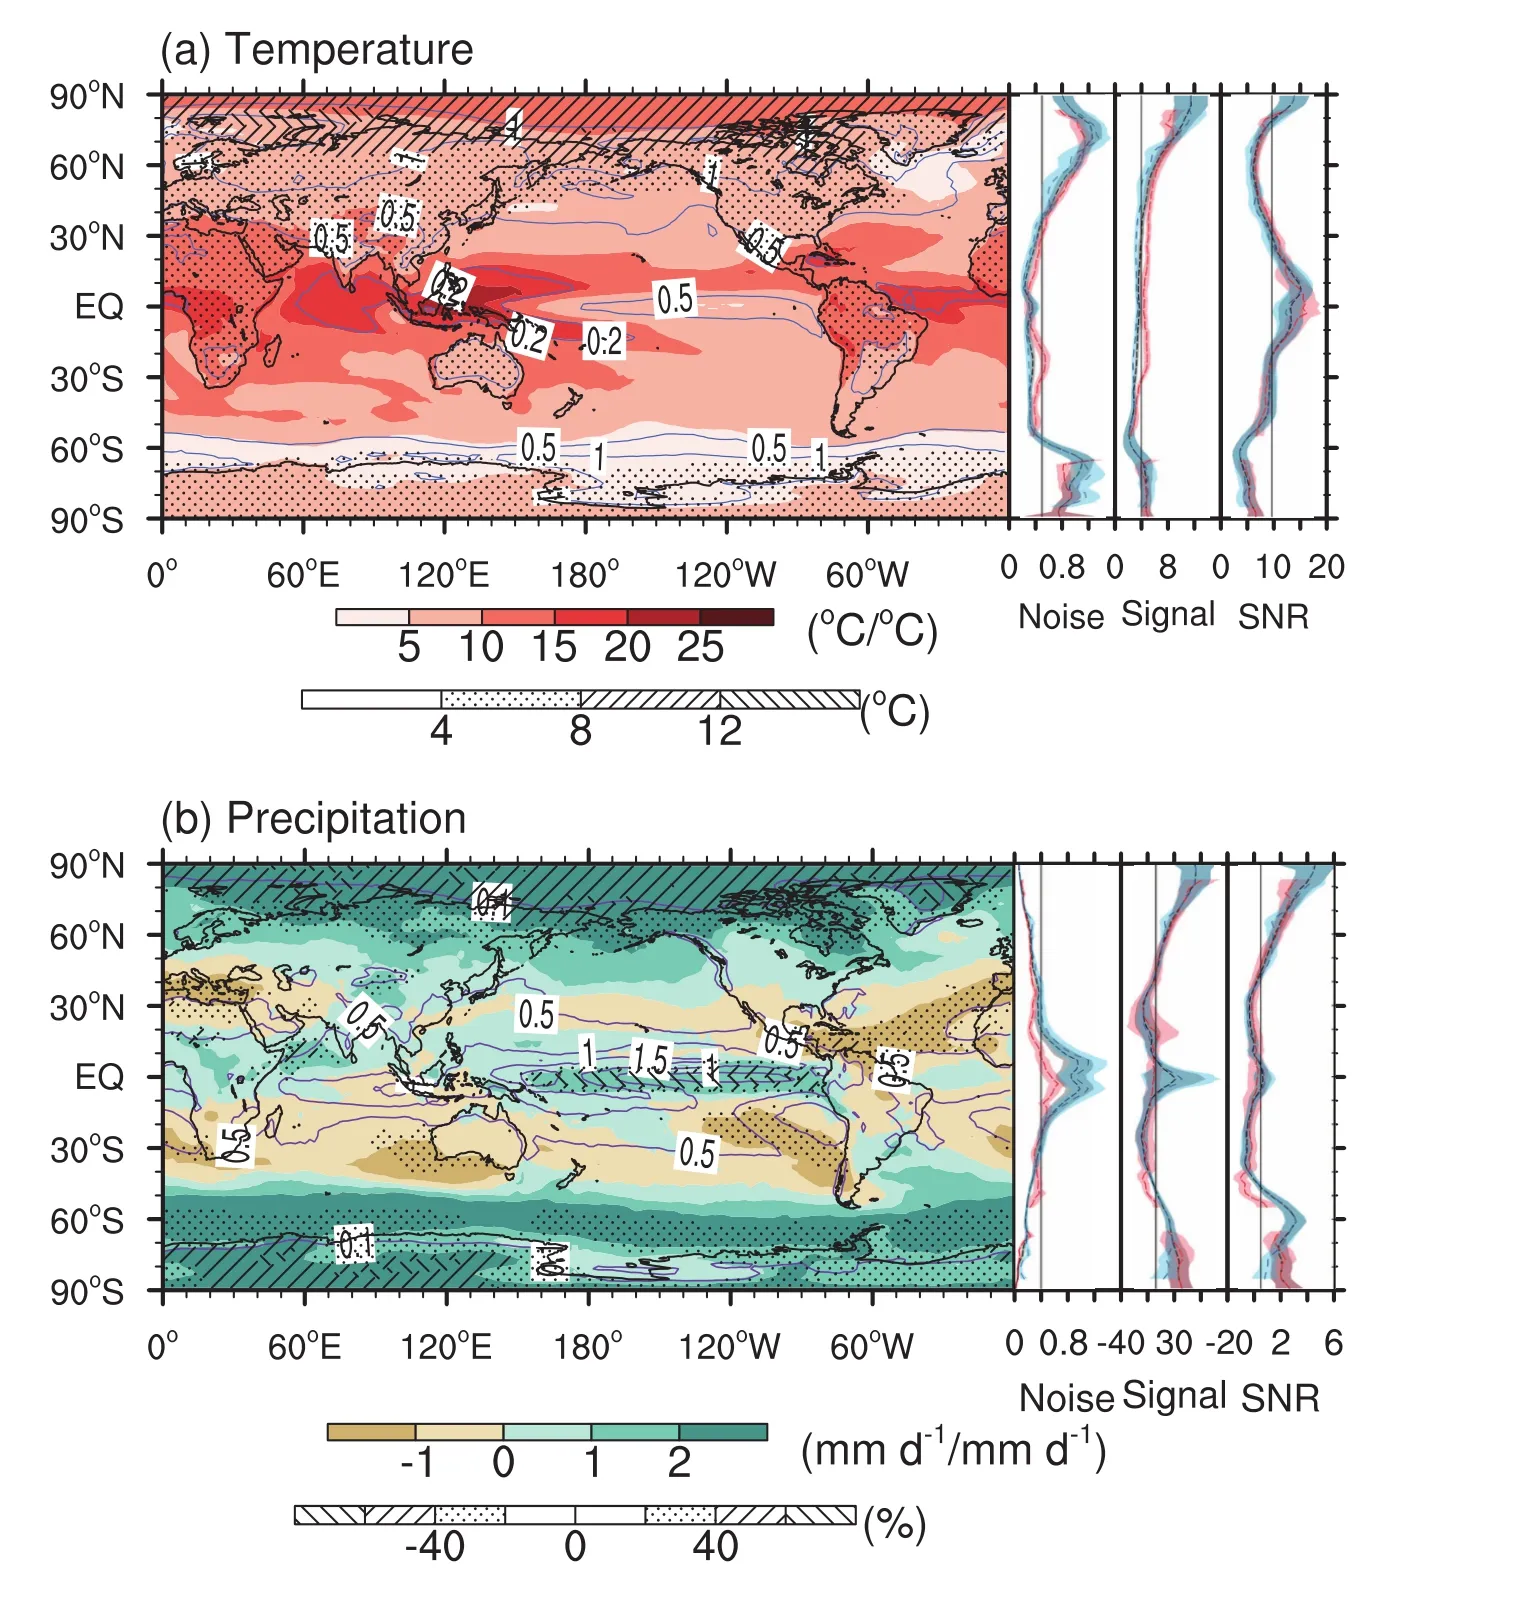
Fig.2.In the left-hand parts,dotted areas indicate the signal,contour lines the noise,and shading the signal-to-noise ratio(SNR),for the global annual mean(a)surface air temperature and(b)precipitation[units for signal: °C and%;noise: °C and mm d?1;SNR:°C °C?1and mm d?1(mm d?1)?1,for(a)and(b),respectively]associated with a 4°C global warming,calculated by the median of the 29 models under RCP8.5.In the right-hand parts,the vertical solid lines represent the globally averaged value for each variable;the other dashed lines show the zonal mean changes for the three variables over the globe(black),over the land(red)and over the ocean(blue);and the shading indicates one standard deviation of the projections from the 29 individual models.
Based on the median of 29 individual models at each grid cell,Fig.2a shows a regionally uneven distribution of the annual temperature change,with the greatest and smallest increases being 13.5°C and 1.5°C,respectively.More intense warming occurs in the Northern Hemisphere than in the Southern Hemisphere,as well as land compared with the ocean.This pattern is concordant with the reported scenario given by the World Bank(2013)and relates to different heat capacities between ocean and land and to different feedbacks,such as evaporation feedback,sensible heat flux feedback,and shortwave cloud feedback(Sejas et al.,2014).Regionally,the strongest warming is projected to appear in the Arctic,with 8°C–12°C of warming in most areas and even greater than 12°C of warming in the Novaya Zemlya,Barents Sea,and Kara Sea.This is the well-known Arctic amplification effect,relevant to the snow and sea-ice feedback(Graversen and Wang,2009),surface albedo feedback,cloud,water vapor and temperature feedbacks,top-of-the atmosphere flux forcing(Winton,2006),and poleward ocean heat transport(Holland and Bitz,2003).Almost all land areas and the ocean adjacent to the Antarctic continent in the Western Hemisphere have a 4°C–8°C increase.A minimum warming of less than 4°C is expected to occur in the rest of the regions,most of which are oceans,on account of a larger heat capacity.Among these areas,the smallest increase in temperature occurs in the Southern Ocean circumpolar regions because of the vertical mixing of deep water(Collins and Senior,2002).On average,zonally,the median warming and one standard deviation for the models,i.e.,uncertainty range(Knutti et al.,2010),are greater over land than over the ocean from 50°S to 60°N(Fig.2a).Additionally,a large uncertainty range of warming among the models tends to occur in high latitudes,in which land has a narrower one than over the globe and the ocean,especially for the Arctic.Moreover,a greater land-to-ocean warming ratio is expected to appear in subtropical areas,and the minimum is found at the tropical latitudes,which might result from variations in soil moisture and clouds(Sutton et al.,2007).
Like the annual mean case,global-scale seasonal warming over land is generally greater(Fig.3).For all seasons,it is clear that Arctic amplification warming is stronger during the winter(December–February)and the autumn(September–November),which is accompanied by atmospheric processes in association with water vapor feedback,heat transport,and cloud feedback(LuandCai,2009).Bycontrast,the least Arctic warming is projected to occur during the summer(June–August),which can be explained by some of the excess heat at the Arctic surface entering into melting ice,and some being absorbed by the ocean with significant thermal inertia(IPCC,2013).The zonal average of the multi-model median and associated one standard deviation for individual models are expected to share a similar pattern to the annual case as well.The greatest uncertainty range occurs in winter,and the smallest one occurs in summer,especially for the Arctic.
In addition to the magnitude of the annual temperature changes above pre-industrial levels,a pronounced degree of interannual variability deserves special emphasis when discussing climate changes relative to the background noise.A particularly significant issue is whether the local temperature changes go outside its natural internal variability(i.e.,SNR values larger or smaller than one).As reflected in Fig.2a,there is a clear signature of greater values in SNR at low latitudes than at the mid-and high latitudes.In general,this characteristic is the opposite of the temperature signal because the noise is greater at high latitudes but smaller at low latitudes(Fig.2a).This pattern agrees with Mahlstein et al.(2011)in that local warming that first exceeds the natural internal variability is expected to occur in low-latitude areas,on the basis of an analysis of 23 models.The noise is 0.1°C–2.3°C,and averages 0.5°C for the globe.The global SNR ranges from 2.3(i.e.,local temperature changes are 2.3 times larger than the natural internal variability)to 26.1,and averages at 9.6,indicating that all local temperature changes at least exceed 2.3 standard deviations of the interannual variation.The spatial distribution of noise(Fig.2a)exhibits a similar pattern to that obtained from 37 CMIP5 models(Jiang et al.,2016).In contrast to land,the noise over the ocean is generally smaller because of the relatively larger thermal inertia(Hu et al.,2012).The highest SNR of greater than 20 is projected to appear in Indonesia and part of the tropical western Pacific,mostly due to the smallest noise of less than 0.2°C and the moderate temperature signals there.The smallest SNR of less than 5 mainly occurs in the ocean areas at 50°–65°S,adjacent to Antarctica,as well as the northernmost North Atlantic Ocean.The tropical western Pacific,the tropical Indian Ocean,and the tropical central Atlantic are the regions where the second-highest SNR of 15–20 is expected;primarily resulting from the high natural internal variability,a ratio of 10–15 is projected to appear in most other low latitude regions and the Arctic area.In general,with the exception of the Arctic,this ratio is relatively high in regions where the climatological temperature is high,and vice versa.Furthermore,the uncertainty range for noise is small at low latitudes and becomes large towards high latitudes(Fig.2a),while the opposite holds for the SNR,with the latter being particularly obvious over land.
On the other hand,all seasons have a similar pattern for their noise and warming to variability ratio to the annual mean,except the Arctic areas during the summer(Fig.3).Since planetary wave activities and atmospheric circulation are stronger in winter,the natural internal variability is smaller in the summer than in the winter/autumn(Rinke et al.,2004).Moreover,owing to the absence of Arctic amplification warming in the summer,the SNR does not show the amplification effect for this season.Specifically,the global mean noise(SNR)is 0.8°C(6.3)in the winter,0.7°C(6.5)in the spring(March–May),0.6°C(7.2)in the summer,and 0.7°C(7.2)in the autumn.All the seasonal mean noise is higher than the annual mean value of 0.5°C,which is responsible for the smaller value of the seasonal mean of SNR than that of the annual mean.In addition,the seasonal uncertainty range of noise and SNR is similar to the annual case.
3.3.Precipitation changes of a 4°C global warming
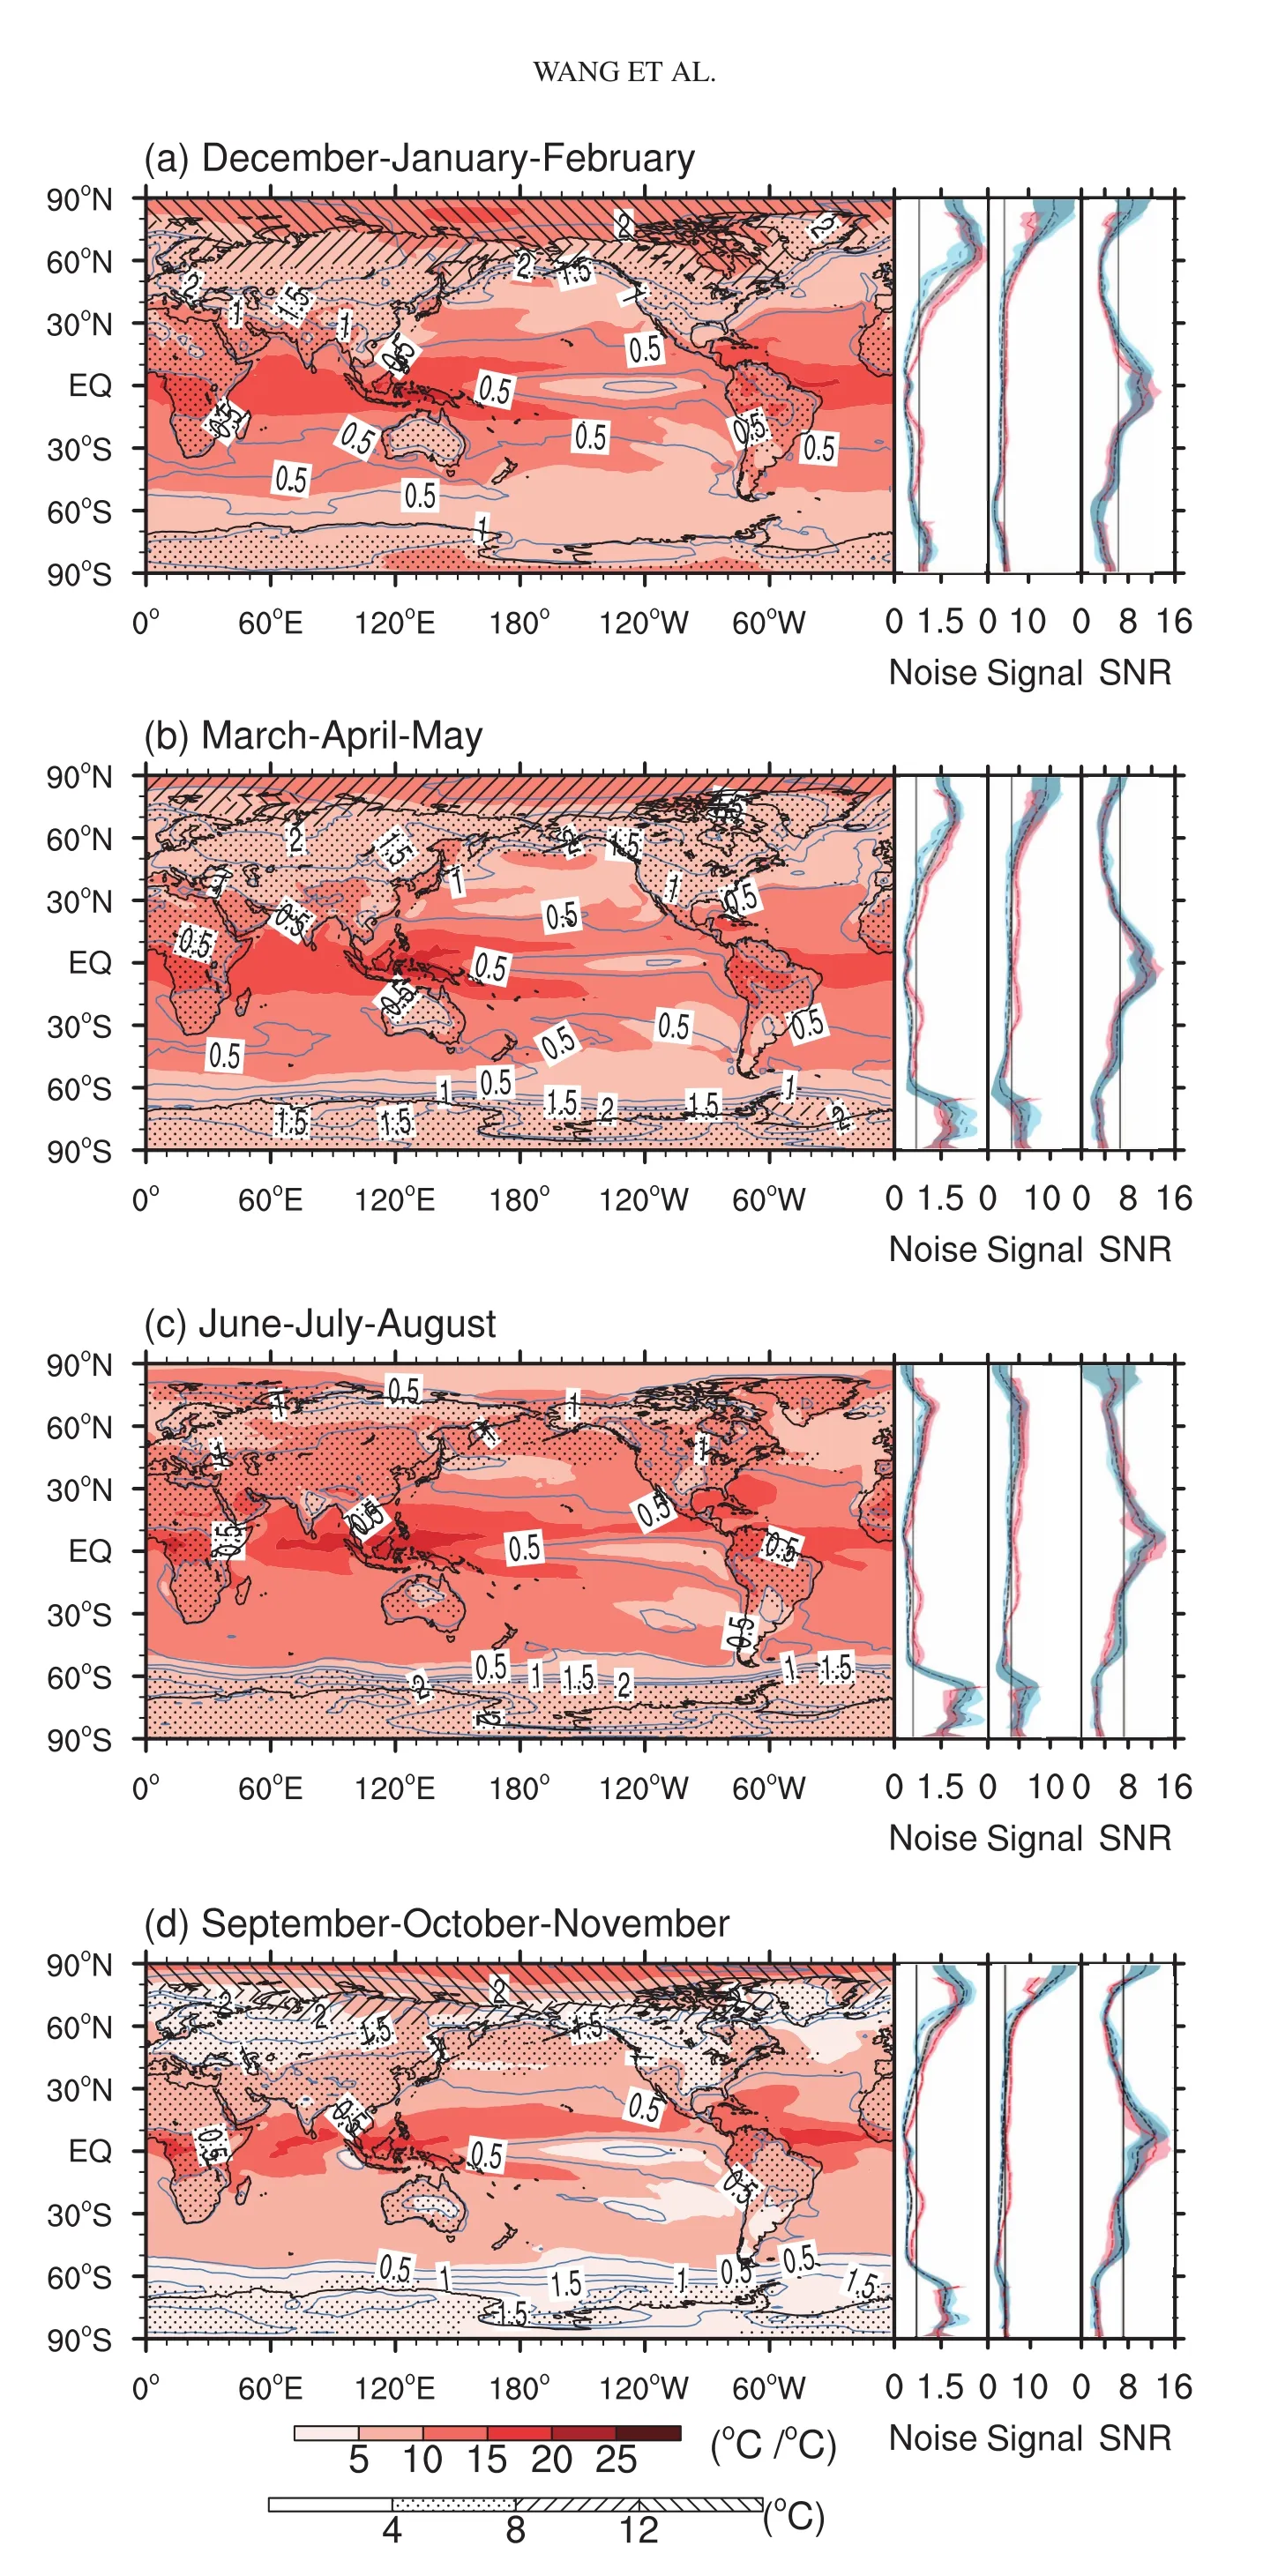
Fig.3.As Fig.2a but for(a)winter,(b)spring,(c)summer,and(d)autumn.
Figure 2b indicates that the distribution of annual precipitation changes above the pre-industrial period is spatially variable to a fair degree over the globe.The annual precipitation varies from ?1.2 to 2.4 mm d?1or?49.9%to 121.9%,with a global mean value of 0.12 mm d?1or 5.1%.This is compatible with AR5,in which the precipitation sensitivity is approximately 1%°C?1to 3%°C?1(IPCC,2013).Precipitation deficits lie mainly in the subtropics(Fig.2b).The maximum increase of more than 60%is expected to ap-pear in a small part of the Arctic,Antarctic in the Eastern Hemisphere,and part of the equatorial Pacific.The projected second-largest increase of 40%–60%occurs in most regions south of 70°S in the Eastern Hemisphere and most of the Arctic,agreeing with the projection that the Arctic will receive more precipitation(>50%)under RCP8.5 over the 21st century(Bintanja and Selten,2014);a rise of 20%–40%is expected to lie primarily in the high latitudes,and the smallest increase of less than 20%appears in part of the northern mid-high latitudes and most equatorial regions.On the other hand,the projected largest deficit of 20%–40%appears in the Mediterranean,20°–40°N of the Atlantic,part of the southeast ocean adjacent to Australia,and the areas within 15°–30°S and ~ 70°–100°W,and a decrease of less than 20%occurs in the other regions.Where these precipitation changes are concerned,surface temperature changes and other complicated processes such as hydrological cycle in association with radiative forcing and surface energy budgets are closely related to(Andrews et al.,2010).The greatest uncertainty range occurs in the tropics for the globe and ocean and at the northern middle latitudes for the land(Fig.2b).Seasonally,all precipitation changes exhibit a similar large-scale distribution to that of the annual mean but with regional differences(Fig.4).In contrast to summer,winter is accompanied with more precipitation in the Arctic,which is primarily relevant to greatly stronger local surface evaporation in association with Arctic warming and sea-ice decline(Bintanja and Selten,2014).Correspondingly,these trends could have great impacts on atmospheric circulation in winter,which in turn has an intimate connection to more precipitation at the mid and high latitudes during the winter(Liu et al.,2012).Quantitatively,the increase in the global mean precipitation averages 9.7%in winter,4.9%in spring,2.6%in summer,and 6.3%in autumn.The seasonal uncertainty range of the signal is similar to the annual case,but wider.
The SNR for annual precipitation varies from?2.4 to 5.5(Fig.2b),and the noise ranges from 0.006 to 2.2 mm d?1,with a global mean value of 0.5 and 0.4 mm d?1,respectively.Note that the SNR and precipitation noise exhibit a generally reversed pattern in comparison with that of the annual temperature.That is,the projected largest SNR occurs in the polar areas,and the highest noise lies at low latitudes and decreases towards high latitudes(Fig.2b),which was also characteristic in a 10000-year control integration of CCSM3(Deser et al.,2012).The distribution of noise(Fig.2b)agrees with that being derived from 37 CMIP5 models for the preindustrial period(Jiang et al.,2016).Similar to the temperature case,the precipitation noise is also closely relevant to the climatological precipitation.There is a suggestion of higher noise appearing in the areas where the annual precipitation is relatively higher.The SNR of precipitation is far lower than that of temperature everywhere,supporting the previous multi-model projections made by Hawkins and Sutton(2011).The projected largest SNR of precipitation lies in the polar areas with the highest value of greater than 4.0.In the precipitation-deficit areas,absolute values of greater than 1.0 for the SNR occur mainly in the Mediterranean,20°–40°N of the Atlantic,and part of the southwest ocean adjacent to Australia and South America;and in the increased precipitation regions,SNRs of larger than 1.0 are found mainly at high latitudes,indicating that the increases in precipitation move outside the range of the background level of interannual variability.Generally,the greatest uncertainty range occurs at low latitudes for the noise of annual precipitation but at high latitudes for the SNR.There is a similar feature of seasonal SNR and noise to that of the annual mean case,but with smaller values for the former and greater values for the latter(Fig.4).Quantitatively,for the winter,spring,summer,and autumn,the globally averaged values of SNR(noise)are 0.4(0.8 mm d?1),0.3(0.8 mm d?1),0.3(0.7 mm d?1),and 0.2(0.7 mm d?1),respectively.Similarly,when we examine the seasonal uncertainty range of noise and SNR,it is suggested to have a parallel pattern with the annual one,but with a wider range.
3.4.Inter-model agreement
Owing to divergent responses to the same external forcings(Hawkins and Sutton,2011),there are some differences among the individual projections.Based on the standard deviation of annual temperature changes from individual models and the median signal at each grid for all 29 models,Fig.5a indicates that the inter-model disagreement of annual temperature changes is not spatially uniform.Generally,it is higher at high latitudes,which are characterized by significantly cold temperatures.This matches with the patterns as obtained from both 15 CMIP5 and 13 CMIP3 models by using the square root error variance metric by Woldemeskel et al.(2015).The ratio of the inter-model spread and median signal is less than 1.0 over almost the entire globe(Fig.5a),indicating that the models have a large degree of consistency in projected annual temperature changes.In general,the seasonal inter-model disagreement displays a similar pattern to the annual mean,and is larger in the Arctic for the summer than in the winter.Overall,it has a high consistency over the globe for both annual and seasonal temperature changes.
There is a signal for a large degree of inter-model disagreement for annual precipitation changes in most of the low latitudes(Fig.5b).Generally,considerable disagreement tends to appear in regions with relatively large amounts of precipitation,and the opposite holds for the weaker precipitation areas.Note,however,that this is not always the situation.For instance,Australia receives little precipitation in general and the inter-model disagreement is still large.Such an exception indicates that not only the magnitude of precipitation but also other factors,such as the difficulty of combining small-scale processes with the comparatively coarse resolution of the models(Macilwain,2014),may affect the inter-model disagreement.This distribution of inter-model disagreement agrees relatively well with the pattern as obtained from 15 CMIP5 models but differs slightly from the results of 13 CMIP3 models using the square root error variance measure(Woldemeskel et al.,2015).On the seasonal scale,the inter-model spread displays a similar characteristic to the annual mean but with larger values at the mid-and low latitudes,and the inter-model disagreement also displays greater values than the annual mean,particularly at high latitudes.Overall,there is a better inter-model consistency for temperature than that for precipitation changes,since the latter are related to more complex processes(IPCC,2013).
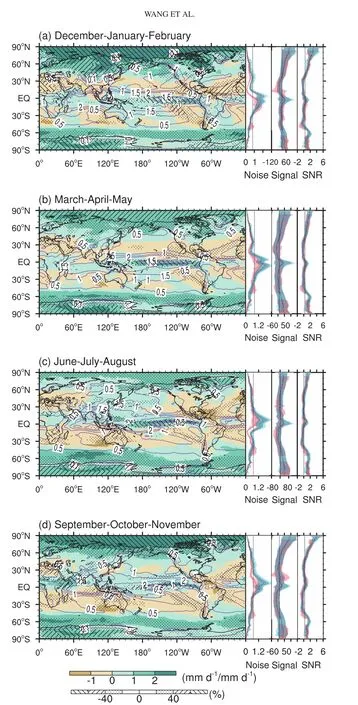
Fig.4.As Fig.3 but for precipitation.
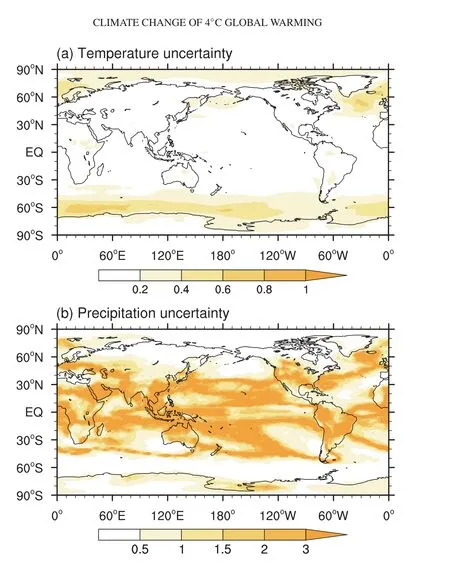
Fig.5.Inter-model disagreement for annual(a)temperature and(b)precipitation,as measured by the ratio of the standard deviation of signals of individual models to the absolute value of the median signal of all 29 models.
4.Discussion and conclusions
As stated in the introduction,a 1.5°C global warming has been widely considered,and it is therefore interesting to compare climate changes associated with the 1.5°C and 4°C levels.Based on the same model data and method applied in this research,it is indicated that a 1.5°C global warming above the pre-industrial period occurs in all the present 39 CMIP5 models in the 21st century under RCP8.5,and the corresponding emergence time is the year 2029,according to the median of all models.At the large scale,changes in annual and seasonal temperature and precipitation have a similar spatial pattern between the 1.5°C and 4°C levels,although there is a degree of difference in some regions(Figs.2 and 6).In a quantitative manner,however,temperature changes related to the 1.5°C level are remarkably less than those of the 4°C level in terms of both the signal and SNR,and the same generally holds for precipitation changes(Fig.7).More specifically,when global warming reaches 1.5°C,annual temperature increases by 0.5°C to 5.3°C,and annual precipitation varies from?30.7%to 30.6%over the globe,which are obviously weaker than the corresponding changes of 1.5°C–13.5°C and ?49.9%to 121.9%under a 4°C global warming.On the seasonal scale,the global mean warming(SNR)is 1.5°C(2.4)in the winter,1.4°C(2.5)in the spring,1.4°C(2.7)in the summer,and 1.6°C(2.8)in the autumn.As for precipitation changes under a 1.5°C global warming,only the increase in precipitation in the Arctic goes outside the background noise in autumn,and the global mean change(SNR)averages 2.5%(0.08)in the winter,2.3%(0.07)in the spring,1.6%(0.04)in the summer,and 3.3%(0.08)in the autumn.Furthermore,when the climate changes associated with the 2°C target(Jiang et al.,2016)are taken into account,it is shown that the spatial patterns of annual and seasonal temperature and precipitation changes are qualitatively comparable,but quantitatively different to some extent,between the 1.5°C,2°C and 4°C levels.For example,the global mean SNR in annual temperature(precipitation)is 5.0(0.2)under a 2°C global warming(Jiang et al.,2016),which is higher than the 3.7(0.09)for a 1.5°C warming but lower than the 9.6(0.5)for the 4°C level.Such comparisons between the three levels of global warming imply that global and regional climate will undergo greater changes if higher levels of global warming are crossed in the 21st century.
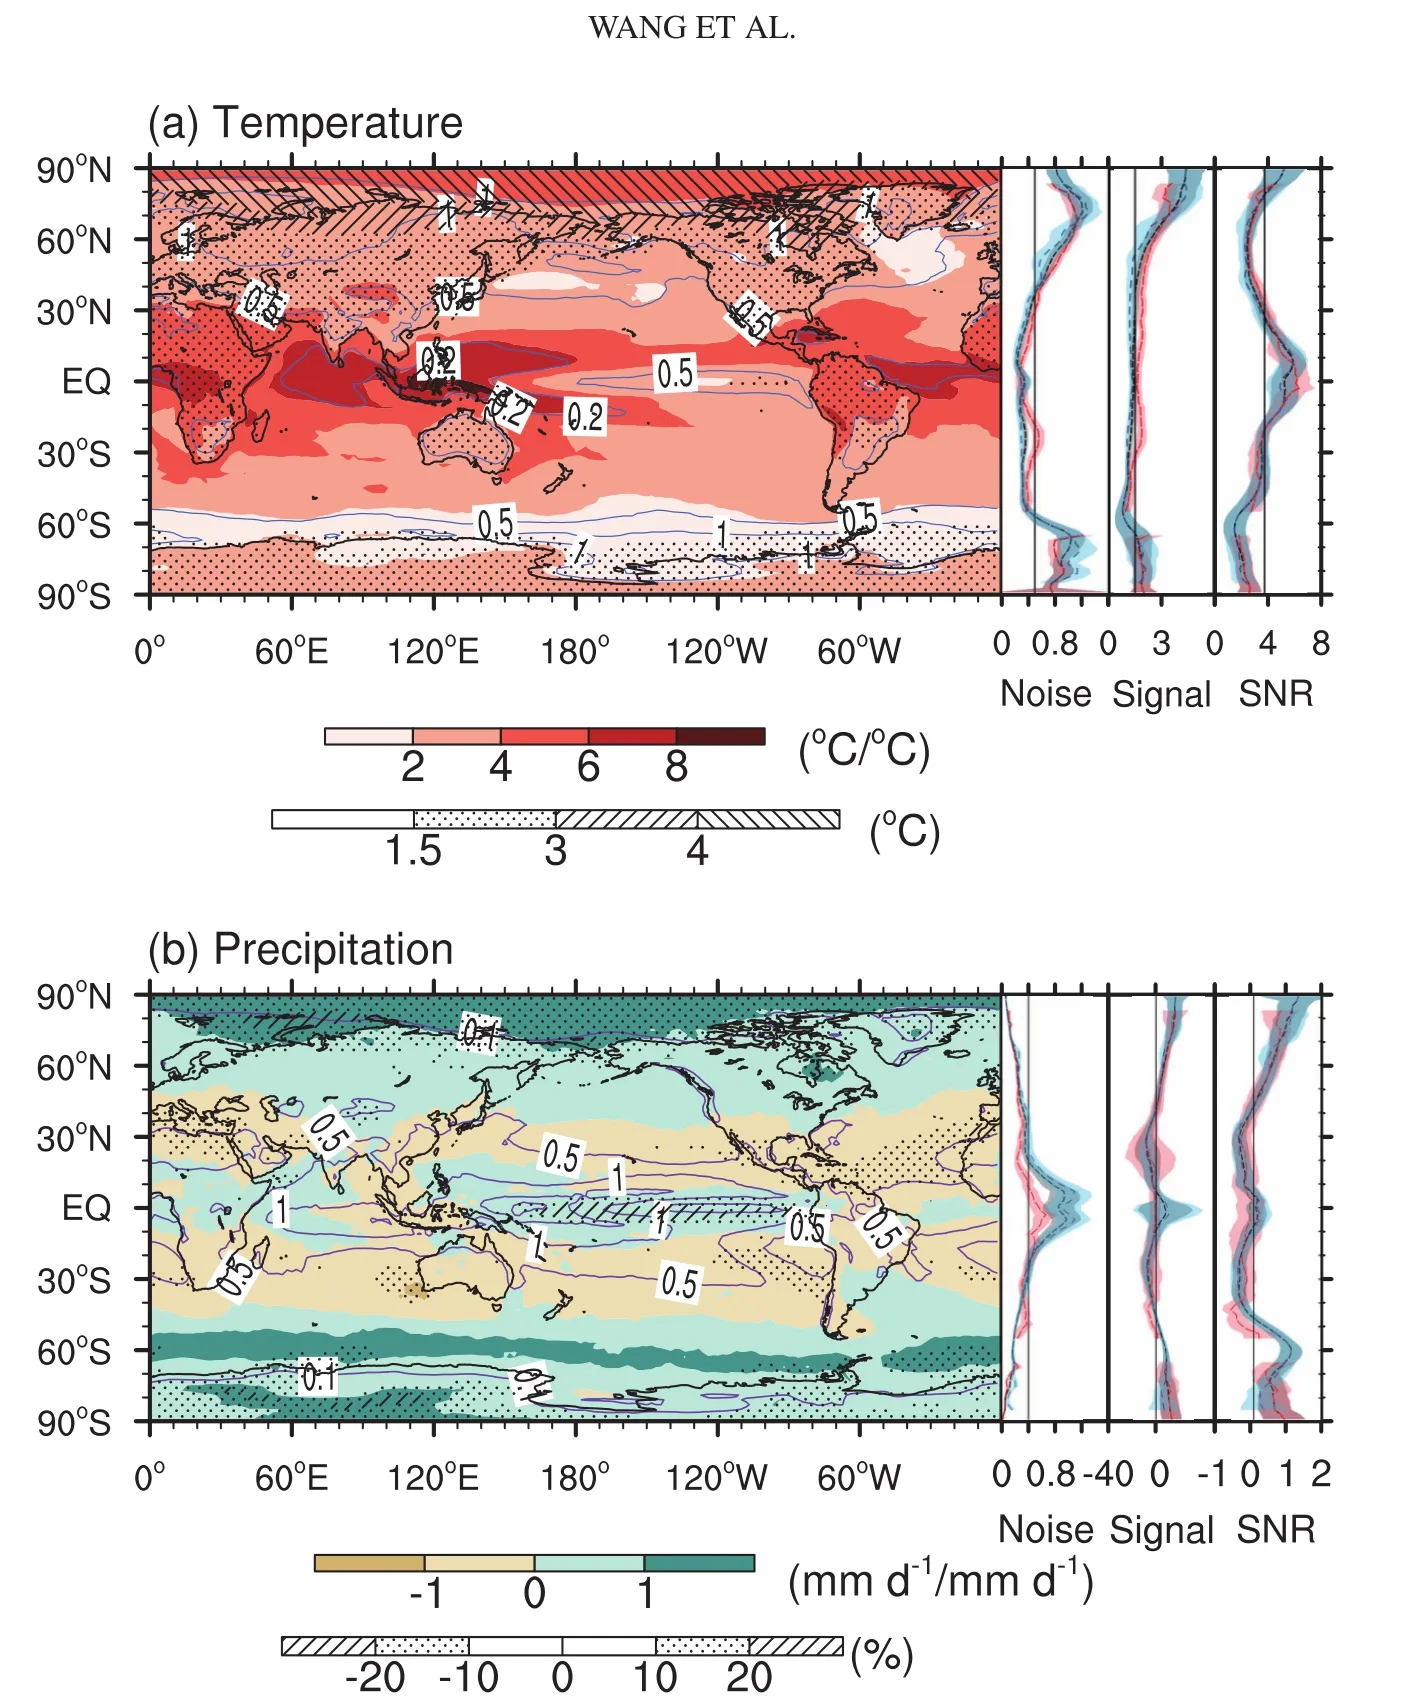
Fig.6.As Fig.2 but for a 1.5°C global warming.
It should be stressed that the present study focuses mainly on 4°C of global warming relative to the pre-industrial period on the basis of all available numerical experiments undertaken by 39 CMIP5 models.Special attention is given to the occurrence time of the 4°C level under the RCP8.5 scenario,as well as the associated climate changes and inter-model disagreement.The temperature and precipitation changes are based on the median of 29 individual models that reach the 4°C level by 2100.The major conclusions are as follows.
(1)Under the RCP8.5 scenario,it is projected that 29 out of the 39 models could reach a 4°C global warming with respect to the pre-industrial period in the 21st century.According to the median of the 39 individual models,the emergence time of a 4°C global warming will be the year 2084.
(2)In a world with 4°C of global warming,annual and seasonal warming over land is likely to be generally stronger than over the ocean,with a remarkable amplification warming occurring in the Arctic,except during summer.The interannual variability of temperature is lower in the tropics and higher in polar areas,except for the Arctic in summer.All the temperature changes move significantly outside the range of the background noise,with the SNR being largest at low latitudes and averaging9.6for the globe.The consistency among the models for annual and seasonal temperature changes is generally high,and the disagreement is relatively large in regions where the climatological temperature is low.
(3)When global warming reaches 4°C,the annual and seasonal precipitation is projected to decrease in the subtropics and increase at high latitudes and in most tropical marine areas,with the maximum increase occurring in the Arctic and equatorial Pacific,except for the Arctic in summer.In most mid-and low-latitude regions,the precipitation changes are smaller than the background variability,with a global average SNR of 0.5.Moreover,higher consistency among the models in projecting annual precipitation changes is expected in polarareas.The inter-model disagreement of projected seasonal precipitation changes is comparatively larger than that of annual precipitation,and that of precipitation is larger overall than that of the temperature.
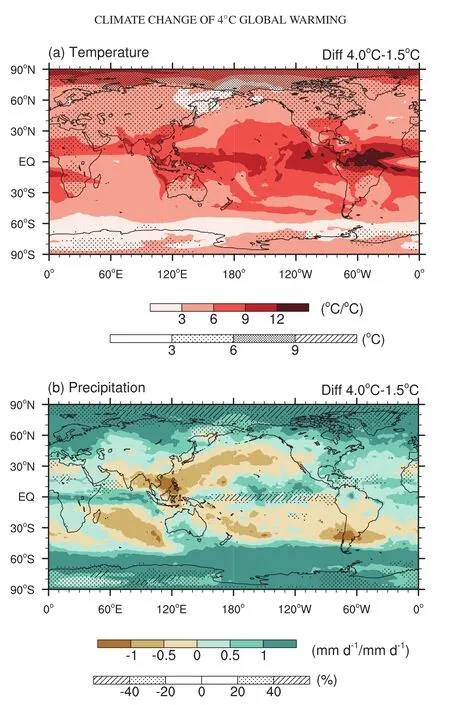
Fig.7.Difference between the changes associated with a 4°C and 1.5°C global warming in(a)temperature and(b)precipitation.Dotted areas indicate the signal and shading shows the SNR[units for signal:°C and%;SNR:°C °C?1and mm d?1(mm d?1)?1,for(a)and(b),respectively].
Finally,it is worth noting that the present occurrence time of 2084 for a 4°C global warming comes from the median of all 39 models.In fact,the emergence time varies from 2064 to 2095 for the 29 models and does not exist for the other 10 models under RCP8.5 in the 21st century,indicating a considerable degree of uncertainty.Second,the projections under the RCP2.6 and RCP4.5 scenarios were also analyzed,but a 4°C global warming was not reached in the 21st century(not shown).Third,the noise is defined here as the inter-annual variability according to most pertinent previous investigations(e.g.,Hawkins and Sutton,2012;Woldemeskel et al.,2015).This definition differs from that of a previous study in which the variability of 20-year averages was employed(Giorgi and Bi,2009).Considering the variance decreases with averaging,the method used in our work gives rise to a smaller estimate of the SNR,but it is considered to have greater relevance to adaptation policies(Hawkins and Sutton,2012).Lastly,only the mean temperature and precipitation changes accompanied by a 4°C temperature increase are analyzed in this study.Extreme climate events,which significantly influence human living and natural environments,in the context of risk prevention,will be addressed in future work.
Acknowledgements.We sincerely thank the three anonymous reviewers for their insightful comments and suggestions to improve this manuscript.We acknowledge the World Climate Research Programme’s Working Group on Coupled Modelling,which is responsible for CMIP,and we thank the climate modeling groups for producing and making available their model output.For CMIP,the U.S.Department of Energy’s Program for Climate Model Diagnosis and Intercom par is on provides coordinating support and led development of software infrastructure in partnership with the Global Organization for Earth System Science Portals.This research was supported by the National Basic Research Program of China(Grant No.2016YFA0602401)and the National Natural Science Foundation of China(Grant No.41421004).
Open AccessThis article is distributed under the terms of the Creative Commons Attribution License which permits any use,distribution,and reproduction in any medium,provided the original author(s)and the source are credited.
REFERENCES
Anderson,B.T.,2012:Intensification of seasonal extremes given a 2°C global warming target.Climatic Change,112,325–337,https://doi.org/10.1007/s10584-011-0213-7.
Andrews,T.,P.M.Forster,O.Boucher,N.Bellouin,and A.Jones,2010:Precipitation,radiative forcing and global temperature change.Geophys.Res.Lett.,37,L14701,https://doi.org/10.1029/2010gl043991.
Betts,R.A.,M.Collins,D.L.Hemming,C.D.Jones,J.A.Lowe,and M.G.Sanderson,2011:When could global warming reach 4°C?Philosophical Transactions of the Royal Society A:Mathematical,Physical and Engineering Sciences,369,67–84,https://doi.org/10.1098/rsta.2010.0292.
Bintanja,R.,and F.M.Selten,2014:Future increases in arctic precipitation linked to local evaporation and sea-ice retreat.Nature,509,479–482,https://doi.org/10.1038/nature13259.
Collins,M.,and C.A.Senior,2002:Projections of future climate change.Weather,57,283–287,https://doi.org/10.1256/004316502320517371.
Deser,C.,A.Phillips,V.Bourdette,and H.Teng,2012:Uncertainty in climate change projections:The role of internal variability.Climate Dyn.,38,527–546,https://doi.org/10.1007/s00382-010-0977-x.
Doblas-Reyes,F.J.,and Coauthors,2009:Addressing model uncertainty in seasonal and annual dynamical ensemble forecasts.Quart.J.Roy.Meteor.Soc.,135,1538–1559,https://doi.org/10.1002/qj.464.
Friedlingstein,P.,and Coauthors,2014:Persistent growth of CO2 emissions and implications for reaching climate targets.Nat.Geosci.,7,709–715,https://doi.org/10.1038/ngeo2248.
Fung,F.,A.Lopez,and M.New,2011:Water availability in+2°C and+4°C worlds.Philosophical Transactions of the Royal Society A:Mathematical,Physical and Engineering Sciences,369,99–116,https://doi.org/10.1098/rsta.2010.0293.
Giorgi,F.,and X.Q.Bi,2009:Time of emergence(TOE)of GHG-forced precipitation change hot-spots.Geophys.Res.Lett.,36,L06709,https://doi.org/10.1029/2009gl037593.
Graversen,R.G.,and M.H.Wang,2009:Polar amplification in a coupled climate model with locked albedo.Climate Dyn.,33,629–643,https://doi.org/10.1007/s00382-009-0535-6.
Gupta,A.S.,N.C.Jourdain,J.N.Brown,and D.Monselesan,2013:Climate drift in the CMIP5 models.J.Climate,26,8597–8615,https://doi.org/10.1175/JCLI-D-12-00521.1.
Hallegatte,S.,and Coauthors,2015:Shock Waves:Managing the Impacts of Climate Change on Poverty.World Bank,Washington,DC,227 pp.
Hawkins,E.,and R.Sutton,2011:The potential to narrow uncertainty in projections of regional precipitation change.Climate Dyn.,37,407–418,https://doi.org/10.1007/s00382-010-0810-6.
Hawkins,E.,and R.Sutton,2012:Time of emergence of climate signals.Geophys.Res.Lett.,39,L01702,https://doi.org/10.1029/2011GL050087.
Holland,M.M.,and C.M.Bitz,2003:Polar amplification of climate change in coupled models.Climate Dyn.,21,221–232,https://doi.org/10.1007/s00382-003-0332-6.
Hu,Z.Z.,A.Kumar,B.Jha,and B.H.Huang,2012:An analysis of forced and internal variability in a warmer climate in CCSM3.J.Climate,25,2356–2373,https://doi.org/10.1175/JCLI-D-11-00323.1.
IPCC,2013:Climate Change 2013:The Physical Science Basis.Contribution of Working Group I to the Fifth Assessment Report of the Intergovernmental Panel on Climate Change,T.F.Stocker et al.,Eds.,Cambridge University Press,1029–1136.
James,R.,and R.Washington,2013:Changes in African temperature and precipitation associated with degrees of global warming.Climatic Change.Climatic Change,117,859–872,https://doi.org/10.1007/s10584-012-0581-7.
Jiang,D.B.,Y.Sui,and X.Lang,2016:Timing and associated climate change of a 2°C global warming.Int.J.Climatol.,36,4512–4522,https://doi.org/10.1002/joc.4647.
Joshi,M.,E.Hawkins,R.Sutton,J.Lowe,and D.Frame,2011:Projections of when temperature change will exceed 2°C above pre-industrial levels.Nat.Clim.Change,1,407–412,https://doi.org/10.1038/nclimate1261.
Kaplan,J.O.,and M.New,2006:Arctic climate change with a 2°C global warming:timing,climate patterns and vegetation change.Climatic Change,79,213–241,https://doi.org/10.1007/s10584-006-9113-7.
King,A.D.,and D.J.Karoly,2017:Climate extremes in Europe at 1.5 and 2 degrees of global warming.Environ.Res.Lett.,12,114031,https://doi.org/10.1088/1748-9326/aa8e2c.
King,A.D.,D.J.Karoly,and B.J.Henley,2017:Australian climate extremes at 1.5 and 2 degrees of global warming.Nat.Clim.Change,7,412–416,https://doi.org/10.1038/nclimate3296.
Knutti,R.,R.Furrer,C.Tebaldi,J.Cermak,and G.A.Meehl,2010:Challenges in combining projections from multiple climate models.J.Climate,23,2739–2758,https://doi.org/10.1175/2009JCLI3361.1.
Liu,J.P.,J.A.Curry,H.J.Wang,M.R.Song,and R.M.Horton,2012:Impact of declining Arctic sea ice on winter snowfall.Proceedings of the National Academy of Sciences of the United States of America,109,4074–4079,https://doi.org/10.1073/pnas.1114910109.
Lu,J.H.,and M.Cai,2009:Seasonality of polar surface warming amplification in climate simulations.Geophys.Res.Lett.,36,L16704,https://doi.org/10.1029/2009GL040133.
Macilwain,C.,2014:A touch of the random.Science,344,1221–1223,https://doi.org/10.1126/science.344.6189.1221.
Mahlstein,I.,R.Knutti,S.Solomon,and R.W.Portmann,2011:Early onset of significant local warming in low latitude coun-tries.Environ.Res.Lett.,6,034009,https://doi.org/10.1088/1748–9326/6/3/034009.
May,W.,2012:Assessing the strength of regional changes in nearsurface climate associated with a global warming of 2°C.Climatic Change,110,619–644,https://doi.org/10.1007/s10584-011-0381-5.
Randalls,S.,2010:History of the 2°C climate target.WIREs Climate Change,1,598–605,https://doi.org/10.1002/wcc.62.
Riahi,K.,and Coauthors,2011:RCP 8.5—A scenario of comparatively high greenhouse gas emissions.Climatic Change,109,33–57,https://doi.org/10.1007/s10584-011-0149-y.
Rinke,A.,P.Marbaix,and K.Dethloff,2004:Internal variability in Arctic regional climate simulations:case study for the SHEBA year.Climate Research,27,197–209,https://doi.org/10.3354/cr027197.
Rogelj,J.,and Coauthors,2011:Emission pathways consistent with a 2°C global temperature limit.Nat.Clim.Change,1,413–418,https://doi.org/10.1038/nclimate1258.
Rogelj,J.,G.Luderer,R.C.Pietzcker,E.Kriegler,M.Schaeffer,V.Krey,and K.Riahi,2015:Energy system transformations for limiting end-of-century warming to below 1.5°C.Nat.Clim.Change,5,519–527,https://doi.org/10.1038/nclimate2572.
Schleussner,C.F.,and Coauthors,2016a:Science and policy characteristics of the Paris Agreement temperature goal.Nat.Clim.Change,6,827–835,https://doi.org/10.1038/nclimate 3096.
Schleussner,C.F.,and Coauthors,2016b:Differential climate impacts for policy-relevant limits to global warming:the case of 1.5°C and 2°C.Earth System Dynamics,7,327–351,https://doi.org/10.5194/esd-7-327-2016.
Sejas,S.A.,O.S.Albert,M.Cai,and Y.Deng,2014:Feedback attribution of the land-sea warming contrast in a global warming simulation of the NCAR CCSM4.Environ.Res.Lett.,9,124005,https://doi.org/10.1088/1748-9326/9/12/124005.
Steinacher,M.,F.Joos,and T.F.Stocker,2013:Allowable carbon emissions lowered by multiple climate targets.Nature,499,197–201,https://doi.org/10.1038/nature12269.
Sui,Y.,X.M.Lang,and D.B.Jiang,2015:Temperature and precipitation signals over China with a 2°C global warming.Climate Research,64,227–242,https://doi.org/10.3354/cr01328.
Sutton,R.T.,B.Dong,and J.M.Gregory,2007:Land/sea warming ratio in response to climate change:IPCC AR4 model results and comparison with observations.Geophys.Res.Lett.,34,L02701,https://doi.org/10.1029/2006gl028164.
Taylor,K.E.,R.J.Stouffer,and G.A.Meehl,2012:An overview of CMIP5and the experiment design.Bul.Amer.Meteor.Soc.,93,485–498,https://doi.org/10.1175/BAMS-D-11-00094.1.
Vautard,R.,and Coauthors,2014:The European climate under a 2°C global warming.Environ.Res.Lett.,9,034006,https://doi.org/10.1088/1748-9326/9/3/034006.
Wang,L.,J.B.Huang,Y.Luo,Y.Yao,and Z.C.Zhao,2015:Changes in extremely hot summers over the global land area under various warming targets.PLoS One,10,e0130660,https://doi.org/10.1371/journal.pone.0130660.
Wang,Z.L.,L.Lin,X.Y.Zhang,H.Zhang,L.K.Liu,and Y.Y.Xu,2017:Scenario dependence of future changes in climate etremes under 1.5°C and 2°C global warming.Sci.Rep.,7,46432,https://doi.org/10.1038/srep46432.
Winton,M.,2006:Ampli fied Arctic climate change:What does surface albedo feedback have to do with it?Geophys.Res.Lett.,33,L03701,https://doi.org/10.1029/2005gl025244.
Woldemeskel,F.M.,A.Sharma,B.Sivakumar,and R.Mehrotra,2015:Quanti fication of precipitation and temperature uncertainties simulated by CMIP3 and CMIP5 models.J.Geophys.Res.Atmos.,121,3–17,https://doi.org/10.1002/2015 JD023719.
World Bank,2012:Turn down the heat:Why a 4°C warmer world must be avoided.A report for the World Bank by the Potsdam Institute for Climate Impact Research and Climate Analytics.World Bank,Washington,DC.
World Bank,2013:Turn down the heat:Climate extremes,regional impacts,and the case for resilience.A report for the World Bank by the Potsdam Institute for Climate Impact Research and Climate Analytics.World Bank,Washington,DC.
Zhang,L.,Y.H.Ding,T.W.Wu,X.G.Xin,Y.W.Zhang,and Y.Xu,2013:The 21st century annual mean surface air temperature change and the 2°C warming threshold over the globe and China as projected by the CMIP5 models.Acta Meteorologica Sinica,71,1047–1060,https://doi.org/10.11676/qxxb2013.087.(in Chinese with English abstract)
Zelazowski,P.,Y.Malhi,C.Hunting ford,S.Sitch,and J.B.Fisher,2011:Changes in the potential distribution of humid tropical forests on a warmer planet.Philosophical Transactions of the Royal Society A:Mathematical,Physical and Engineering Sciences,369,137–160,https://doi.org/10.1098/rsta.2010.0238.
 Advances in Atmospheric Sciences2018年7期
- Advances in Atmospheric Sciences的其它文章
- Dominant SST Mode in the Southern Hemisphere Extratropics and Its Influence on Atmospheric Circulation
- Persistence of Summer Sea Surface Temperature Anomalies in the Midlatitude North Pacific and Its Interdecadal Variability
- ENSO Predictions in an Intermediate Coupled Model In fluenced by Removing Initial Condition Errors in Sensitive Areas:A Target Observation Perspective
- Impact of Soil Moisture Uncertainty on Summertime Short-range Ensemble Forecasts
- Regional Characteristics of Typhoon-Induced Ocean Eddies in the East China Sea
- Comparisons of Three-Dimensional Variational Data Assimilation and Model Output Statistics in Improving Atmospheric Chemistry Forecasts