
Tungsten ion source under double-pulse laser ablation system
2017-08-30 08:25:58AhmedAsaadKhalilAshrafHafezMahmoudElgoharyandMohamedMorsy
Chinese Physics B 2017年9期
Ahmed Asaad I Khalil,Ashraf I Hafez,Mahmoud E Elgohary,and Mohamed A Morsy
1 Department of Laser Sciences and Interactions,National Institute of Laser Enhanced Sciences,Cairo University,Giza 12613,Egypt
2 Central Laboratory of Ministry of Electricity,Cairo,Egypt
3 Atomic Research Center,Atomic Energy Authority,Cairo 13759,Egypt
4 Department of Nuclear Engineering,Jordan University of Science and Technology Irbid,Jordan
5 Department of Chemistry,King Fahd University of Petroleum and Minerals,Dhahran 31261,Saudi Arabia
Tungsten ion source under double-pulse laser ablation system
Ahmed Asaad I Khalil1,?,Ashraf I Hafez2,Mahmoud E Elgohary3,4,and Mohamed A Morsy5
1 Department of Laser Sciences and Interactions,National Institute of Laser Enhanced Sciences,Cairo University,Giza 12613,Egypt
2 Central Laboratory of Ministry of Electricity,Cairo,Egypt
3 Atomic Research Center,Atomic Energy Authority,Cairo 13759,Egypt
4 Department of Nuclear Engineering,Jordan University of Science and Technology Irbid,Jordan
5 Department of Chemistry,King Fahd University of Petroleum and Minerals,Dhahran 31261,Saudi Arabia
New tungsten ion source is produced by using single and double-pulse laser ablation system.Combined collinear Nd:YAG laser beams(266+1064 nm)are optimized to focus on the sample in air.Optimization of the experimental parameters is achieved to enhance the signal-to-noise ratio of the emission spectra.The velocity distribution of the emitted plasma cloud is carefully measured.The influences of the potential difference between the bias electrodes,laser wavelength and intensity on the current signal are also studied.The results show that the increase in the tungsten ion velocity under the double-pulse lasers causes the output current signal to increase by about three folds.The electron density and temperature are calculated by using the Stark-broadened line profile of tungsten line and Boltzmann plot method of the upper energy levels,respectively.The signal intensity dependence of the tungsten ion angular distribution is also analyzed.The results indicate that the double-pulse laser ablation configuration is more potent technique for producing more metal ion source deposition,thin film formation,and activated plasma-facing component material.
tungsten ion beam,double-pulse lasers ablation system,laser ablation system,optical Instrumentation
1.Introduction
The key roles of tungsten(W)and its alloys have been emphasized,and tungsten is regarded as amain candidate material to be used as a plasma-facing component(PFC)in international thermonuclear experimental reactor(ITER)activated phase.[1,2]Ion or high power laser instruments are routinely utilized to produce an environment imitating ITER plasma in order to investigate the corrosion of PFC substances.Tungsten has special properties,such as low sputtering yield,high energy threshold of sputtering,low erosion rate,high thermal conductivity,high melting point,and excellent thermo-mechanical properties.[3]These properties make tungsten suitable for the technological applications in plasma fusion.The superior performance of radiation from tungsten ions under applying an intense electromagnetic flux motivates plasma engineers to use it in many shapes for different applications.Therefore,tungsten electrodes could be designed into boats,tubes,wires,loops,cups,and filament coil shapes to be used in atomic absorption or emission,inductively coupled plasma optical emission spectrometry(AAS or AES or ICP-OES),[4]atomic fluorescence spectrometry,[5]microwave plasma atomic spectrometry,[6]or laser excited atomic fluorescence.[7]For example,the thin W-wire forms are used in glass capillary electrical discharge,electron microprobes,x-ray tubes and scanning electron microscopes,due to their high melting temperature(3680 K)and evaporation features.[8]
Double-pulse laser ablation system(DPLAS)has been an attractive technique of research in material science and analytical chemistry because of its rich source of UV and x-ray radiations.It can also be used for the in situ monitoring of deposition and erosion processes in fusion reactors.[9]The observed W plasma has a wealthy ion sources which are required in many fields such as strong ion source,high energy ion implanters and laser ion source.[10]Ion source with high current is important for fusion reactors,space thrusters,lithography,laser deposition,growth of nanostructures to modify their properties,cluster formation,industrial polymerization,food sterilization,and accelerator implementations.[11–13]Some of research groups have investigated the tungsten surface damage produced by the holes,bubbles and fiber-form structures in the response of helium ion flux.[14,15]Other groups investigated the influences of the tungsten plasma parameters on the IR,green,UV laser wavelengths.[16]The choice of the experimental conditions plays an important role in improving the DPLAS technique.Double-pulse(DP)lasers are utilized for the tungsten ablation which yields the genesis of high-temperature and density plasma.Radiative recombination mechanism(RRM)affects the thermal equilibrium plasma of fusion and the ionization equilibrium.Therefore,in different tungsten ions,the cross sections of radiative recombination play an essential role for DPLAS technique.In addition,thegas discharge is utilized as a buffer gas in accelerators,light sources,plasma spraying,surface treatments,and design of thin films by sputtering.[17–23]All of these applications demand a better understanding of the outcomes of the DPLAS technique including the creation of ion sources,velocity distributions,ion energy,and ion flux.The dynamic behaviors of ion beams released from gold,silver,silicon,graphene,and stainless steel plasmas at various laser pulse durations have been reported.[24–28]
In this work,the W ion source and high current signal under applied DPLAS geometry are generated for the first time. Farid et al.[16]focused only on a single-pulse Nd:YAG laser ablation with an energy of 300 mJ at 1064 nm,160 mJ at 532 nm,and 85 mJ at 355 nm,separately.In our work,several new spectral lines W(I)and W(II)from the plasma emission are identified.The temporal distribution of the double-pulse laser of tungsten plasma parameters in an applied potential is studied.In addition,a Faraday cup ion probe technique is installed to measure the tungsten ion velocities in SPLAS and DPLAS geometries.The experimental parameters such as laser wavelength,laser intensity,argon gas pressure,gate delay,electrode spacing,and laser pulse energy ratios are optimized to improve the DPLAS technique for attaining better quality thin film emission that could be important for optical switching,thin film devices,and pulsed laser deposition (PLD).
2.Experimental details
2.1.SPLAS and DPLAS principle
The layout of the collinear DPLAS geometry setup for producing a W-ion beam in partial vacuum gas pressure is shown in Figs.1(a)and 1(b).The experimetal details of our DP-LIBS emission spectroscopy can be found elsewhere.[24]High temperature(~18000 K)plasma was produced on the W-electrode surface under the action of applied two collinear Nd:YAG laser pulses.The laser arrangement includes a 266 nm laser I(Continuum model NY81-30)of 7 ns pulse duration and 30 Hz repetition rate utilized for ablation process.A 1064 nm laser II(Spectra Physics INDI-50)with a 6 ns pulse width and 30 Hz repetition rate was used for the second pulse. An energy meter was installed to measure the laser pulse energies of the 266 nm and 1064 nm laser beams that are controlled to be 25 and 300 mJ laser energy by varying the flash lamp voltage,respectively.Various pairs of nanosecond lasers were tested to achieve better optimization and confirmed that the integration(266+1064)nm gave a maximal signal-to-noise ratio(S/N),i.e.,a maximum contrast given by the spectrometer.A fundamental IR laser(II)was triggered by UV laser(I) signal.Both laser beams were directed toward the W-electrode surface after being combined into collinear dual-pulsed geometry and impinged on a quartz convex UV and IR lenses of 50 cm focal length at the same point.We used a combination of 266–1064 nm Nd:YAG lasers of the DP-LA system under the same optimization condition to enhance the signal-to-noise ratio(SNR)in comparison with the single pulse(SP)measurements,i.e.,SNRDP/SNRSP.The transition maximum after removing the background spectrum is called signal while the standard deviation of the corresponding background is called noise.A set of measurements was optimized to advance the sensitivity of the UV–NIR spectra and to prolong the plasma life time.
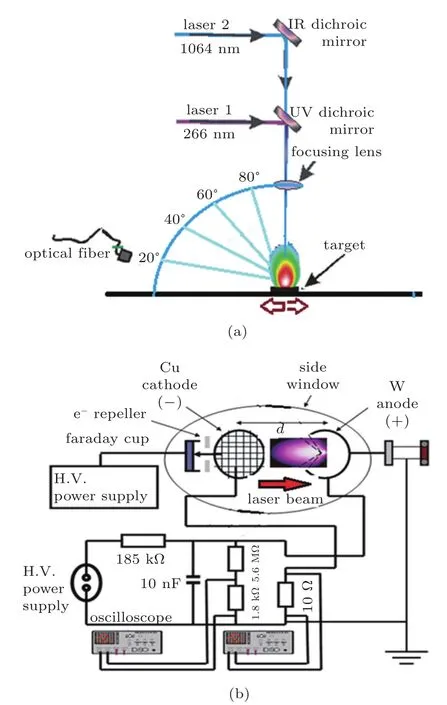
Fig.1.(color online)(a)Experimental setup used for DP-LAS measurements;(b)electric discharge circuit and optics geometry.
The 266 nm laser(shorter wavelength)as the first pulse is more efficient in achieving ionization,bond breaking process,allowing for the formation of a controlled plasma,and coupling to the W target because of reduced screening effects, resulting in increased mass ablation.The use of 266 nm laser for LAS also has shorter optical penetration depth,which offers greater laser energy per unit volume for ablation.Hence, the 1064 nm laser(longer wavelength)as the second pulse provides controllable energy addition through the mechanism of inverse bremsstrahlung absorption and interacts with rarefied ambient conditions,which further ablates the target as well as excites or re-heats the plasma plume produced by 266 nm laser pulse.Hence,more excited species,free electrons and ions are produced which interact with the incoming DP laser photons and cause more ionization and heating,which increases the absorption of more laser photons.The incident energy absorbed by the plasma is used to increase the internal energy of the plasma and consequently increase the extracted ion velocity with gaining more energy from the external electric field of DP lasers.
Thus,it is better to employ a sequence of short(266 nm) and long(1064 nm)wavelength lasers for DP-LAS as preionization,high ablation efficiency,and reheating beams for rewarding the W ions high kinetic energy,resulting from the inverse bremsstrahlung,thereby giving rise to the ion velocity in larger plasma volume and longer plasma life time.
This trend can be explained by the fact that the probability of multiphoton ionization increases proportionally to the photon energy coming from the DP lasers.[29–32]The intensity distribution within each laser beam is in Gaussian profile.The beam quality factor for each laser beam has a Gaussian fit correlation~0.90 with an M2~1.5,pulse-to-pulse stability~7%, and an Airy disk spot diameter of the first zero rings obtained by

where λ is the wavelength,D is the input beam diameter,and f is the focal length of the lens.This gives a focal spot diameter of 100μm at 266 nm laser beam,200μm at 1064 nm laserbeam,and 350μm at(266+1064)nm double laserbeams. To enhance the signal-to-noise ratio,the variation of the inter-pulse delay(Δt)between the two laser pulses from 0 to 500 ns indicates that Δt=250 ns produces the maximum ratio.In addition,the time between the detection gate signal(start of the recording spectrum)and the 1stexcitation laser pulse(gate delay,td=0.3μs)was also optimized.The DP-laser beams were focused at different distances from the tungsten surface, (d=?2.5 mm,?1 mm in front of the tungsten surface;d=0, on the tungsten surface;d=3 mm,4 mm behind the tungsten surface).Finally,the delay was set using a Stanford delay generator DG535 with 1 ns timing jitter,where the fluctuations of both laser pulse energies were less than 5%.
In this setup,a planar anode with circular shape of high purity tungsten(W block 99.999%,Kurt J.Lesker)electrode was utilized.The laser beam passed through a quartz windows of the DPLIP hybrid vacuum chamber to impinge the W-anode and release a photoelectric current.The W-target was also rotated using a rotary disc with an adequate speed using a motorized X-Y translation holder stage in order to impede crater generation.The translation holder stage was controlled by computers oft ware to obtain a fresh surface for each burst of laser shots and suppress the development of any crust.For the cathode,a flat circular shape of mesh grid copper(Cu)with a thickness of a few mm was used.The anode and cathode each has a diameter of 50 mm and a surface area of 706 mm2.A movable holder made of mica in between the electrodes was used to vary the anode/cathode separation gap.The vacuum discharge chamber was partially evacuated by using the oil sealed Varian SD rotary pump(300 Franklin Electric).The argon(Ar)gas was used as it has high-lying metastable states and its pressure was measured by using a Pirani gauge(APGM-NW25-Edwards HV INT Inc.).It will be an interesting process of extending such studies in our laboratory to a wide range of materials in the Periodic Table and discover some correlations with either the electronic geometries or the low and high z-value of the objective materials.
2.2.Optical emission spectra
The spectrum of W-emission was recorded in the region of 320–800 nm by using a high-resolution spectrometer (0.5 m,SPEX)equipped with a telescope(f1=54 mm,f2= 120 mm)to collect the plasma emissions at different angles (0°–80°).The plasma emission was delivered to a multimodefiber optic head(silica,high-OH,a core diameter of 600μm) of 0.05 nm resolution(grating of 1200 grooves mm?1)for further analysis.Synchronization between the gated camera (intensified charge coupled device(ICCD),Princeton Instrument)and the laser pulse has been achieved.The gate pulse width(10μs)was well controlled and the spectrum was perfectly recorded after each laser pulse.The gate delay(1μs) represents the time between the shutter opening pulse of ICCD camera and the laser ignition pulse.The number of accumulations was selected to be 10.The accuracy of our detection system depends on the geometrical setup,quality of optical fiber,and ambient conditions.Therefore,the sensitivity of the observed spectra was improved and the sustained plasma with long-time stabilization was also obtained.In this work,we used a Boltzmann plot to analyze the W-spectra.
2.3.Electric discharge circuit
Gahan and Babaeva have described the electric circuit in detail.[33,34]A DC power supply(max.50 mA,high voltage 1200 V,Model photon)was used to charge a 10 nF capacitor bank and applied a potential voltage of 400 V for providing the discharge across the two planar electrodes.The cylindrical Faraday-cup ion probe(FCIP)was installed in the setup to monitor the W-plasma expansion.The brass FCIP housing was located at an 80 mm normal distance from the anode electrode surface.In addition,the FCIP has a 2 mm circular hole diameter in the center,while an aperture(grounded electron repeller)of the same diameter is mounted before the cathode to avoid the secondary electron emission as shown in Fig.1(b). Then the FCIP is biased with?90 V to repel the released negative electrons and attract the generated positive ions in the plasma.The signal is monitored from the voltage falling across a resistance of 10 ? by using a fast response 500 MHz digital storage oscilloscope with 2 ns temporal resolution in order to evaluate the ion current Iifor various discharge currents.Table 1 shows the relation between argon pressure and flow rate.Table 2 exhibits the physical properties of the copper(Cu)and tungsten(W)electrodes.Under this condition a DC-power supply is used to apply a DC potential,V,across the two electrodes with a fixed resistance to monitor the current flowing into the circuit.The results indicate that the frequency and size of burst increase with increasing voltage.This behavior could be attributed to the multiplication of electrons by collisions with Ar-gaseous molecules.[35,36]The details of other explanations to the current and volt variation based on the abrupt change,self-sustained discharges,subnormal discharge,normal discharge,abnormal discharge,and/oran arc discharge can be found in Ref.[37].

Table 1.Relation between the argon gas pressure and the flow rate.

Table 2.Physical properties of the electrodes.[31]
2.4.Time of flight(TOF)and velocity distribution measurement
The time of flight(TOF)of our system is the time recorded at a certain level of the emitted species from the sustained metal plasma where the kinetic energies of the released metal-ions can be measured.[38]Several critical parameters of the ion emission mechanisms are related to the TOF measurement and the velocities of the released W-ions.Therefore,numerous efforts have been made to obtain wealth information about experimental temporal ion velocity distributions and plasma densities.
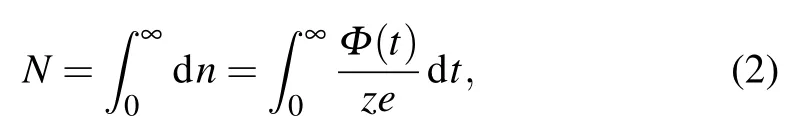
In this work,tungsten ion current,Ii,is recorded along the FCIP signal amplitude divided by the resistance Rf=1 k?. Therefore,the flux of W-ions Nican be determined from[39]

where e,z,s,and Qiare the electron charge,the ion charge order,the area of the covered window on the FCIP cover,and the total collecting charge of ions,respectively.Ni=Qi/ze if the FCIP cover is removed from the setup.Hence,the ion velocity distribution function F(v)can be estimated by measuring the total number of ions N collected by FCIP
where Φ(t)=ze(DN/d t).The I(t)is the current of the W-ions at z=1 at a certain time of flight(t≥s/v),with s being the cathode-front surface of the FCIP separation and v the ion velocity.The velocity distribution functions(VDFs)of the W-anode flare in the absence and presence of plasma were estimated by FCIP collector.
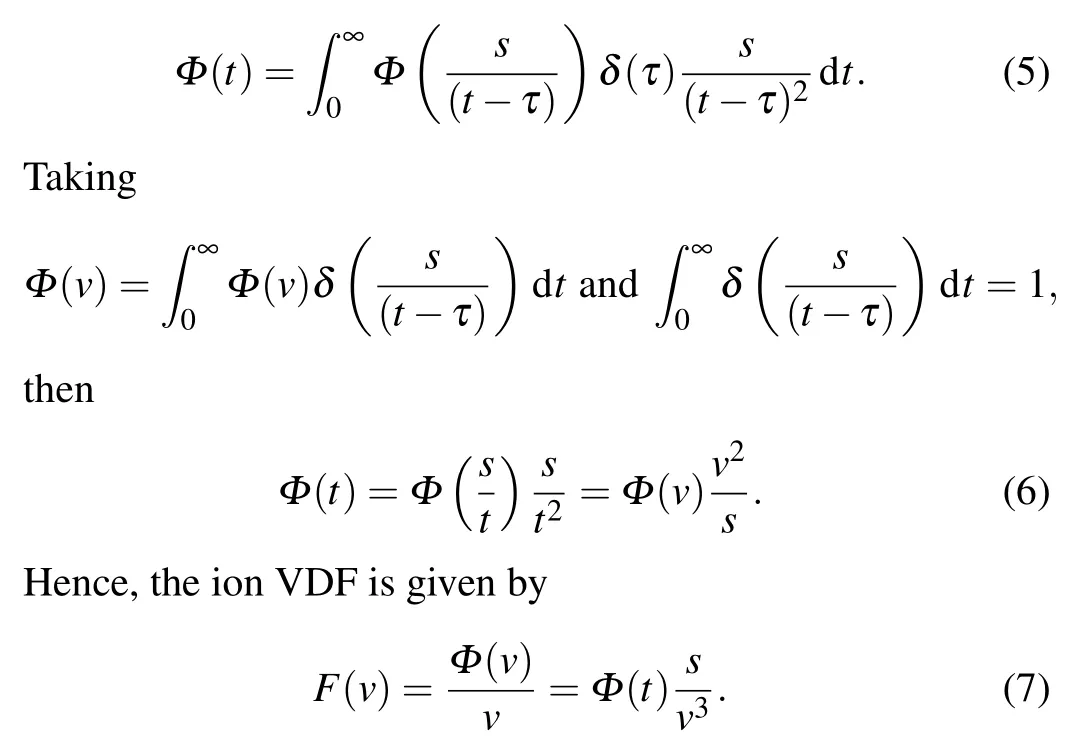
The flux density Φ(t,v)at time t and velocity v can be given by

whereδ(t?s/υ)is the delta function at the emission time,τ= δ(t?s/υ),and flux velocity distribution is Φ(v).By assuming t>s/υ or low eccentricity,the Delta function δ(t?s/υ) equation for ion generation is valid and then
3.Results and discussion
3.1.Analyses of spectra and temporal distributions of T e and N e
The spectra produced by DP lasers induced tungsten plasma are recorded in the regions 320–355 nm,400–455 nm, 520–555 nm,and 625–800 nm as depicted in Figs.2(a)–2(d). Most of the observed atomic and ionic spectral lines are listed in Table 3 by using the spectral line database provided by NIST.[40]Also,the results indicate that the distribution of free electrons in the plasma is Maxwellian as they exhibit a local thermodynamic equilibrium(LTE).[41]Thus,the spectral line intensity can be written as follows:
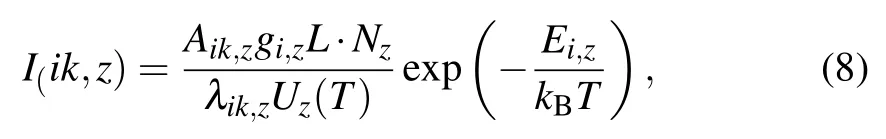
where Iik,zis the relative intensity due to electron moving from a high level i to a lower level k in an atom with ionization z, Ei,zcorresponds to the upper energy level,and gi,zis its statistical weight,Aik,zis the probability of transition,λik,zis the spectral line wavelength,Uz(T)is the atomic partition function at temperature T,L is the characteristic plasma length, Nzis the emitting atoms density,T is the plasma temperature, and kBis the Boltzmann constant.[42,43]Moreover,the degree of harmonization among single examine data is enforced by using large sampling of the homogeneous object.The laser pulses are averaged to stabilize the variance of spatial overlap of laser spots on the W-target.This number of laser pulses is increased in order to increase the precision.In this case,the relative standard deviation(RSD)can be evaluated as[44,45]

The same procedure was reported in material analysis.[46]The precision varies between 2%and 4%and the RSD is 3.9%. This approximate precision of spatial overlapping of laser spots on the W-target depends on the attenuation of shock wave and the numerical simulation of the overlapping process. The overlapping rate(η)is expressed as[47]
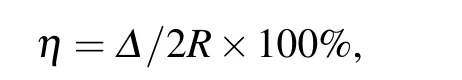
where R is the spot radius and Δ is the coincidence length of two successive laser spots.By considering symmetry properties of the distribution of laser spots,the approximate overlapping rate of our experiment is found to be η=50%.
By using the line intensity in Eq.(8),the Boltzmann plot and the Stark broadening are employed on several W-spectral lines to estimate the electron temperature(Te)and density(Ne) respectively,where the spectral line intensity of atomic species in ionization state z is reduced to[48,49]
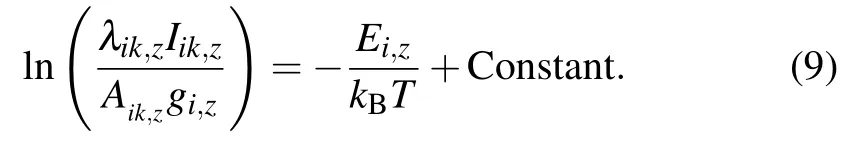
Under applying LTE condition,the plot of the logarithmic term versus Ei,zyields a straight line of slope equal to?1/kBT. The parameters λ,Aik,z,gi,z,and Ei,zof W-lines in Eq.(9)are taken from the NIST.[40]
The tungsten ion source is generated using a sequence of short(266 nm)laser operating at 7 ns pulse duration and long (1064 nm)laser operating at6 ns pulse duration for DP-LAS as high ablation efficiency and reheating beams,respectively,for rewarding the W ions high kinetic energy.Therefore,we optimize our experimental condition to enhance the LAS signal intensity by removing enough quantity of material and extracting enough ions with high energy by DP laser ablation with sufficient laser intensity(≥7×10¹⁰W/cm2)approximately inversely proportional to the laser pulse durations of 7 ns and 6 ns,respectively.
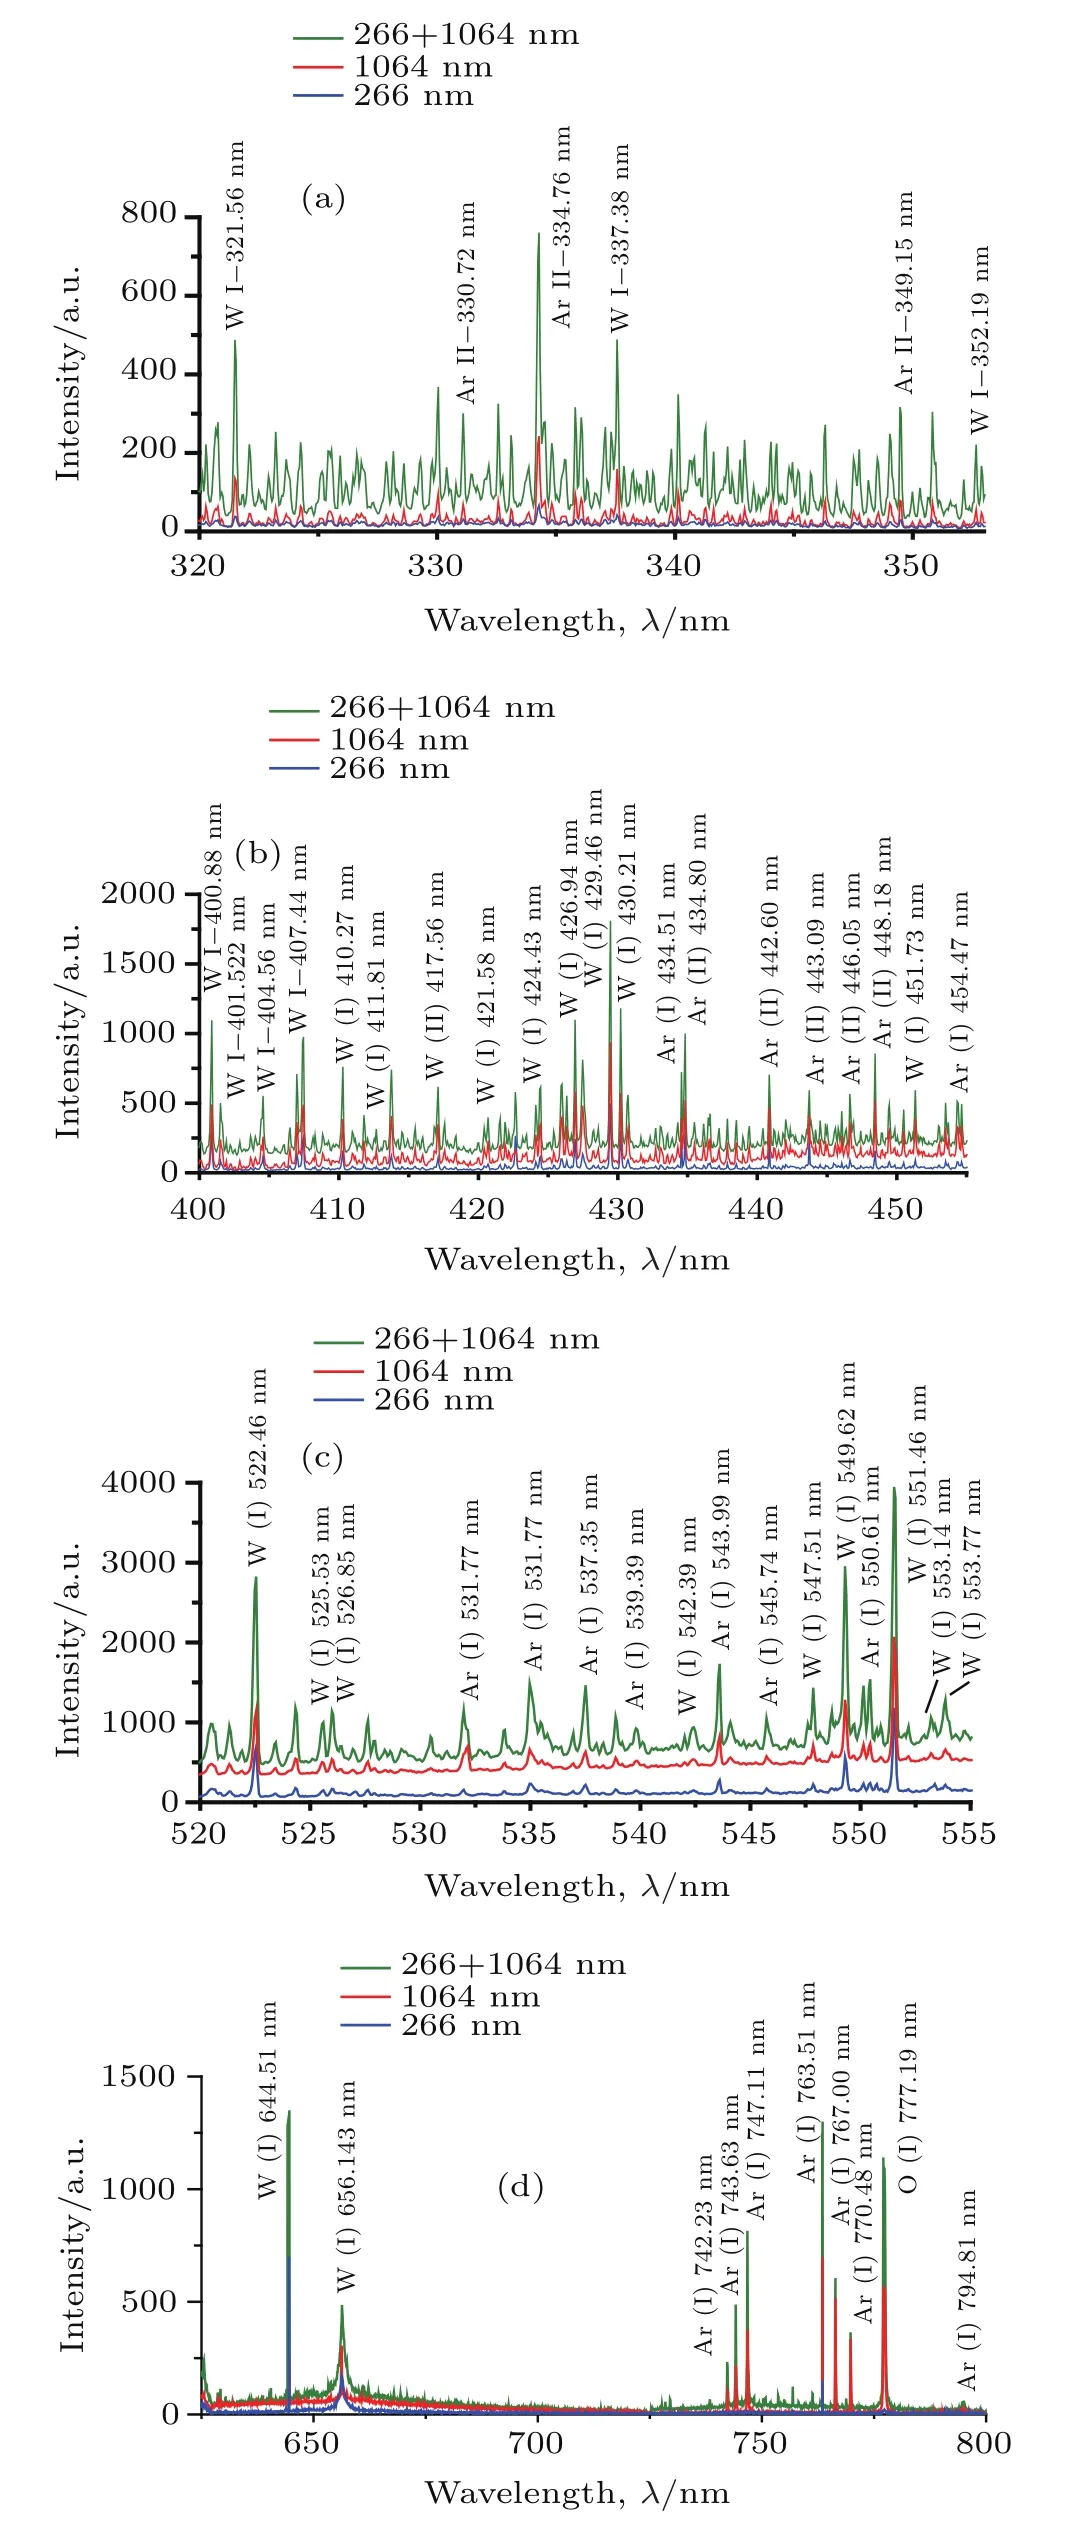
Fig.2.(color online)(a)–(d)Laser induced plasma spectra of the tungsten target recorded in the UV-visible region at 1500 ns delay for the UV or IR SP and(UV+IR)DP geometries.

Table 3.Various atomic W I lines used for the DP-laser-induced plasmas analysis.
The temporal distribution of electron temperature under applying 266 nm or 1064 nm single pulse(SP)laser and combined collinear(266+1064)nm DP-lasers is shown in Fig.3. It can be seen that the Tefor ionized spectral lines increases at the early stages from 0 to 1.5μs due to the more absorbing of DP-laser energy by means of electrons via the inverse Bremsstrahlung absorption process.While it slightly decays in the domain(3–4μs)and fast decays at the long delay time (4–8μs)in the cases of both SP-and DP-LAS geometries. This decay may result from the fact that the thermal energy is quickly converted into kinetic energy by attaining maximum expansion velocity and cooling effect of the W-plasma. Specifically,the Teof W-plasma decreases from 13700 K to 2775 K by applying 266 nm(SP),from 15600 K to 3750 K by applying 1064 nm(SP),and from 17400 Kto 4300 Kby applying(266+1064)nm(DP)as the delay increases from 0.17μs to 8μs,as depicted in Fig.3.The inset in Fig.3 shows the Boltzmann plots for 266 nm SP laser,1064 nm SP laser and combined(266+1064)nm DP lasers using W(I)and W(II)spectral lines.It is worth noting that the experimental data coincide with the approximate values of least square fit.The regression coefficients are in a range of 0.978–0.992 for both SP and DP-LAS geometries with considering that the chosen lines are sensitive to Te.The average of the estimated W-plasma temperatures is found to be Te=17400±450 K,which is reported for the first time for DP-LAS.Farid et al.[16]studied the temporal distributions of Teand Nefor W plasma only under the SP geometry.
For accurate results of detection elements,the local thermodynamic equilibrium(LTE)must exist in optically thin plasma.LTE is satisfied in our W plasma,which has sufficiently high electron number density(Ne).Figure 4 elucidates the variation behaviours of Neof the W-plasma produced by applying UV,IR SP-and(UV+IR)DP lasers each as a function of delay.Initially,the Neis high during the plasma production and then reduces rapidly with further delay.The Nevaries from 1.16×1018cm?3to 1.5×1017cm?3in the case of266 nm(UV-SP),from 1.09×1018cm?3to 2.1×1017cm?3in the case of 1064 nm(IR-SP)and from 1.5×1018cm?3to 2.8×1017cm?3in the case of(266+1064)nm(UV+IR,DP) as the delay time increases from 0.17μs to 10μs.It is worth mentioning that the Nein DP-LAS geometry is higher than those computed in the SP-LAS geometry for W-material.

Fig.3.(color online)Variations of electron temperature(T e)of the W-plasma with gate delay,obtained by using SP-laser running at UV,IR and a combination of(UV+IR)DP-lasers.The inset shows the Boltzmann plots of W(I)emission lines used to predict the T e.
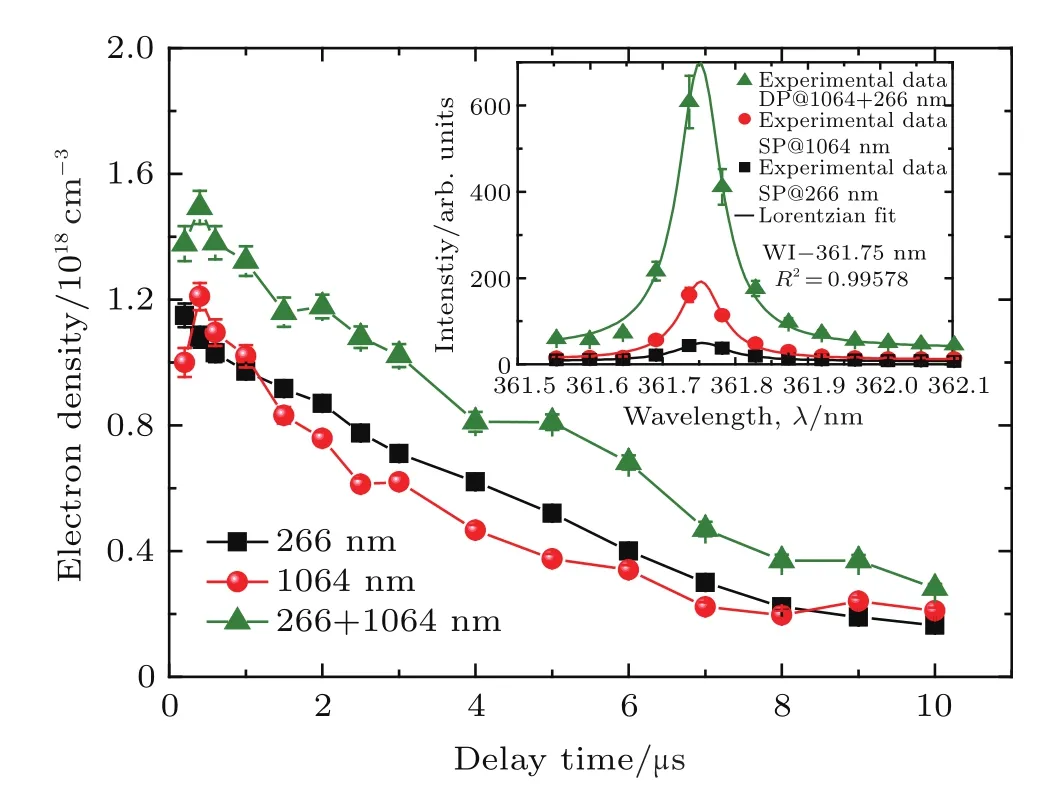
Fig.4.(color online)Variations of N e of W plasma with gate delay by using UV,IR,and the combination of(UV+IR)lasers.The inset shows the Stark-broadened profiles of the W(I)emission line at 381.76 nm used for computing N e.
The Necan be determined by[25]
where A is the ion-broadening parameter and NDis the sum of particles in Debye sphere.Thus,the full width at half maximum(FWHM)ΔλFWHM(nm)in Eq.(10)will be given by
where ΔλFWHM(nm)is obtained from the W(I)spectral line at 361.75 nm because its shape numerically fits the Lorentzian profile,denoting that no self-absorption has been obtained as depicted in the inset of Fig.4;ω is the FWHM of stark broadening at an electron density of 1017cm?3obtained from Griem’s book by interpolating at the calculated plasma temperature.[50]The obtained line width is matched truly by withholding the instrumental line width with relative error around 10%through using a deconvolution process,i.e.,
Generally,the trends of Teand Nebehavior versus the delay time match well with the other reported behaviours of other metals.[51–54]The Teand Ne(plasma parameters)are high through the first phase of plasma generation since the ablated substances dissociate into atomic species and excited ions.From the experimental data,it can be seen that the Teand Nevary markedly over time.Also,the plasma emits a bremsstrahlung continuum of radiation during the initial period(<150 ns)and the continuum/line emission ratio decreases steadily for a longer time.At an ion velocity on the order of 105m/s by gaining energy from the laser duration pulse, the plasma expanded isothermally.[55]The W-plasma expands adiabatically after the ending of the laser pulse,thus,both Teand Nedecrease rapidly over time,which may be due to collisions and recombination with the background Ar gas.[56]In addition,a free electron will be recombined with ions and give up its excess kinetic energy in the shape of a photon.Therefore,the values of Teand Nereduce as plasma expands over time.
3.2.Influences of SP-and DP-LAS on the discharge current and plasma properties
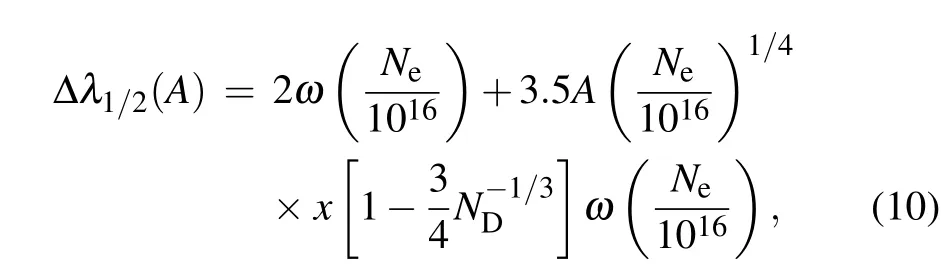
In order to understand the physics behind the glow discharge regime in tungsten plasma,we study the effects of UV,IR as intensities of a single pulse(SP)and(UV+IR)as double pulse(DP)lasers,on the discharge current signal of glow discharge.Figure 5 shows the variations of discharge current signals with relative laser intensity(W/cm2)at fixed Ar-pressure(4 mbar),applied voltage(315 V),and distance gap between electrodes(1.75 cm)in the case of SP and DP-lasers irradiating W-plasma.In this experiment,the relative laser intensities of SP-UV(266 nm),SP-IR(1064 nm),and DP-ratios(I1064/I266)are varied from 1×10¹⁰W/cm?3to 10×1010W/cm?3.Under this condition,the electrons are prevented from escaping from the plume since the internal electric field is initiated at the metal-plasma surface and the ions will be accelerated along the metal electrode surface ablation layer to form the plasma sheath and the angular distribution of the ion flux.The more ions and electrons are created by single,double-pulse lasers and applied potential voltage,showing the current signal increases with laser intensity increasing in a range from 1×10¹⁰W/cm?3to 10×1010W/cm?3.Thus, the electric discharge is triggered by laser induced plasma to produce higher current signals values especially in the case of collinear DPLAS geometry.This could be attributed to the significant effects of ablation efficiency and longer plasma lifetime.The electronic current signals may be saturated at 1.75 A under the action of 266 nm laser,2.5 A under the action of 1064 nm laser,and 3.5 A under the action double pulse lasers(266+1064)nm in a laser intensity range from 8×10¹⁰W/cm?3to 10×1010W/cm?3,respectively.This behavior may result from the space charge effect and the plasma shielding of the laser pulse.Our result is in good agreement with Fuchs et al.’s[57]result.
Fig.5.(color online)Variations of discharge current signal of the W-plasma with laser intensity for UV,IR,and a combination of(UV+IR) lasers,at fixed 4 mbar pressure,315 V power supply voltage and 1 cm distance gap between the two electrodes.
Moreover,in the DP-laser ablation process,the W-plasma expands and the FCIP is utilized as an ion collector.The FCIP is interfaced with an oscilloscope to measure the energy of the W-ions during the emission of sustaining glow discharge plasma.The W ions are produced in glow discharge plasma due to multi-collisions and ionization processes during the sputter W atoms passing through the Ar-gas discharge. Most of the W ions reward high kinetic energy resulting from the inverse Bremsstrahlung in glow discharge plasma beside the plasma produced by DP-laser ablation.At a fixed 3 mA current signal,the Paschen curves for W-anode in Ar-gas at various separation gaps between the two electrodes(d=1,2, and 3 cm)are investigated as depicted in Fig.6.The minimum discharge potential,breakdown voltage(VBr)min,for the anode occur at the value of(pd)min=4 mbar·cm.The curves each have a minimum discharge voltage(VBr)minof 370±5 V.The discharge exactly appears between the two electrodes.The collision frequency is lower at a lower pressure;hence,suf-ficient ionization is maintained only by increasing the probability of ionization at each collision and the electron velocity should have higher value,consequently VBrmust rise as pressure decreases as seen in Fig.6 at low pressure(1–4 mbar). In addition,the mean free path of electrons is much longer than that at the higher pressure zone,thus fewer collisions happen between electrons and neutral atoms.On the other hand, the collision frequency between the neutral atoms and electrons and the rate of energy loss are higher at higher pressure. Hence,the breakdown voltage VBrprogressively increases to overcome the loss of energy for such a distance(d)above 4 bars as depicted on the right-hand side of Fig.6.In addition, the electrons must have enough energy to breakdown the discharge gap between the two electrodes during the increase of VBr.[58]By increasing the electrode separation from 1 to 3 cm, higher voltage will be needed to preserve the discharge and thus,the plasma can cover an extra length.The increasing of the discharge current reveals an increase of the brightness of the discharge and the Ar-gas discharge color is pink(Fig.1(b)) since more energy is dissipated.
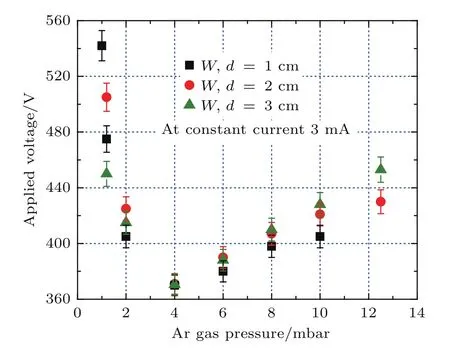
Fig.6.(color online)Variations of applied breakdown voltage of the W plasma with Ar-gas pressure at various distances 1,2,and 3 cm between the two electrodes.
The mechanisms for ion production and material ablation by longer laser pulses like single picosecond(ps)or even single fem to second(fs)laser-matter interaction in vacuum are different from those obtained for single nanosecond(ns)laser pulse interaction.In the case of fs laser,the duration of its interaction with the surface is shorter than the time necessary for the hydrodynamic and thermal mechanisms that work during a single ns laser pulse.Hence,in fs LA system,less dense plasma will appear and exhibits reduced spectral broadening as well as reduced recombination and bremsstrahlung background emission which leads to improving the signal-tobackground ratio of the spectral emission lines and the tolerances for utilizing the non-gated detectors.In addition,the decreasing in the spectral broadening of the spectral lines helps us to discern the overlapped individual lines.
The single ns and ps laser pulses depend on the thermal diffusivity of the objective material.The ablation depth can be determined by thermal diffusion.While in fs laser pulse ablation,the laser plume is more directly perpendicular to the target surface than single ns ablation,causing less ion loss due to ion divergence,and the mean free path of non-equilibrium electrons of phonons and optical penetration depth play an important role.[59]Whereas those hot electrons carry the energy from the optical penetration depth and heat transport to a deeper heat affected zone behind the surface.In addition, the plasma decays faster due to the difference in energy coupling mechanism.The plasma screening effect is lower in fs laser produced ions than in single ns laser pulse produced ions.[60]It is interesting to compare the nanosecond double pulse-LAS and psamp;fs-LAS,which has not been reported previously.Hence we need to improve the spectral modeling and analysis of the tungsten emission over large wavelength ranges in ns,ps and fs LAS plasmas in our future study.
Figure 7 shows the voltage–current(V–I)characteristic trends of the W-plasma created by UV,IR as a single pulse and(UV+IR)as double pulse lasers in the absence and presence of glow discharge plasma,at constant electrode separation(1 cm).It is noticed that the V–I curves almost linear with slopes depend on the applied SPLA and DPLA potential. The curves obey Ohm’s law and the glow discharge plasma is the resistive discharge where at a constant potential of 400 V, the plume currents in W-plasma are increased by 7-fold,15-fold and 20-fold under the action of 266 nm,1064 nm,and (266+1064)nm DP lasers,respectively.By increasing the applied voltage,the ions obtain more energies and extra charged particles may be generated due to the inelastic collisions between particles and the reduction of sheath thickness.[61]Thus, the discharge current signal will increase and then the charged anode-cathode electrodes act as a charged capacitor.Hence,if the laser irradiates the anode electrode,this capacitance will discharge in a nanosecond.This will also be used to evaluate gas conduction between electrodes at different laser geometries.
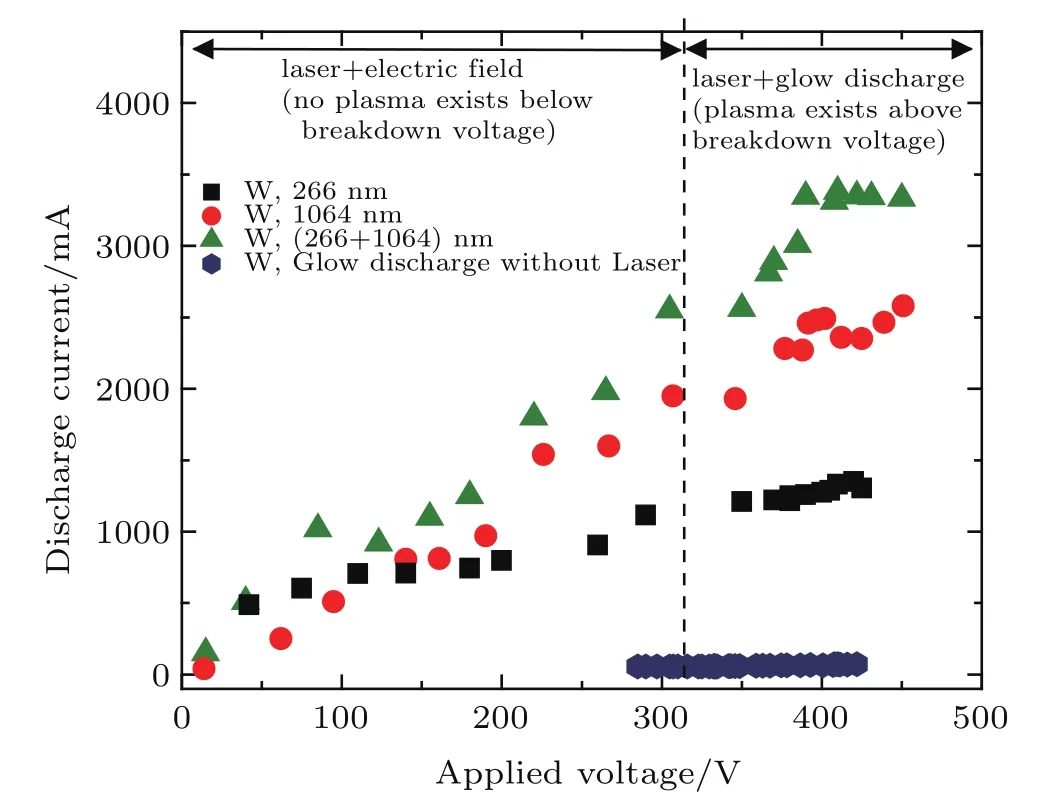
Fig.7.(color online)Volt-current curves of the W-plasma without and with applying UV,IR,and combination(UV+IR)lasers at fixed 2 mbar Ar-gas pressure and 1 cm distance between the two electrodes.
Figure 8 shows the dependence of the velocity distribution function F(v)on the W ion velocity under the action of UV,IR,and(UV+IR)DPLAS fields at constant p=0.2 mbar, Vf=?80 V and VD=800 V.It can be seen that apeak velocity at 0.3×10³m/s is obtained without irradiation of laserfield during the variation of ion velocity from 0.15×10³to 1×10³m/s.Multi-peak velocities are obtained under their radiations of UV,IR as a single pulse and(UV+IR)as double pulse laser fields during the variation of ion velocity from 0.2×10³to 1.4×10³m/s,respectively.It is clear that the W-ion velocity is high under applying DP-laser geometry.This could be correlated to the atomic mass of W(183.84)as listed in Table 2.The absorption of more energies by W-ions from the laser irradiation leads to the rising W-ion velocity.

Fig.8.(color online)Variations of F(v)of the W-plasma with ion velocity recorded by FCIP,without and with applying UV,IR,and combination (UV+IR)lasers at fixed 0.2 mbar Ar-gas pressure,800 V discharge voltage and?80 V FCIP voltage.
Figure 8 exhibits the trends of glow discharge plasma created between the anode-cathode electrodes at 800 V discharge voltage without irradiation of the laser field.When the UV, IR as a SP-LAS and(UV+IR)as DP-LAS fields irradiate the W-anode electrode in the presence of glow discharge plasma, the W-ion velocities are increased by 2,4,and 7 folds,respectively.The observed multi-peaks correspond to different velocities and different charge states of ions.It is observed that the peak velocities decrease with decreasing SP and DP laserfield intensities,which results from the Coulomb collisions of ions with the plasma.
3.3.Effects of gate delay and laser pulses energies ratio on W emission intensity
Each substance has the special behavior of temporal evolution of the DP-LAS signal intensity.Figure 9 shows the variations of normalized signal intensity of spectral line W(I) 551.49 nm as a function of the ICCD gate delay(td)by focusing the DP-laser beams at different distances from the W-target surface(d=?2.5 mm,?1 mm in front of the tungsten surface),(d=0,on the tungsten surface),and(d=3 mm,4 mm behind the surface).The tdvaries from 0.0μs to 1.0μs.It is obvious that the emission intensities of W(I)line rise steadly to a maximum value at about 0.3μs delay and then decreases. Hence,the optimum delay is selected to be 0.3μs,and the maximum emission intensity of the W(I)is also obtained by focusing the DP-laser beams at D=4 mm behind the tungsten surface.Farid et al.[16]did not study this case.
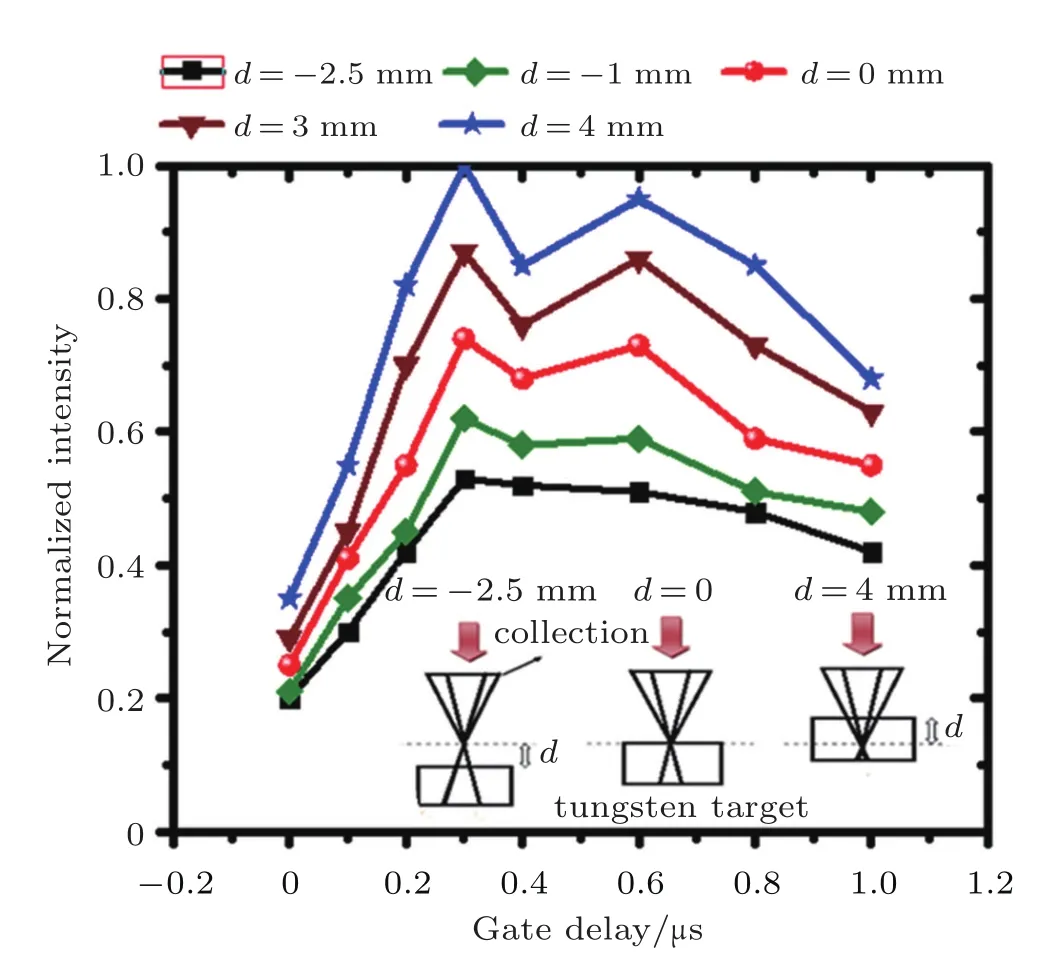
Fig.9.(color online)Gate delay dependence of the normalized emission intensities of W(I)361.75 nm line by focusing the DP-lasers at various distances relative to the tungsten surface(d=?2.5 mm,?1 mm front of the surface,0,3 mm,and 4 mm behind the surface)recorded in air.
On the other hand,figure 10 displays the variations of the signal intensity of the spectral line W(I)551.49 nm with laser pulse energy ratio at different distances from the tungsten surface,(d=?2.5 mm,?1 mm in front of the surface;d=0,on the surface;d=3 mm,4 mm behind the surface).When the 2ndlaser pulse energy E2is twice the delayed 1stlaser pulse energy E1at d=4 mm behind the surface,the maximum signal intensities of W(I)551.49 nm line will occur.Thus,the pulse energies are carefully selected to be 25 mJ and 50 mJ for ultraviolet laser 1 at 266 nm and near infrared laser 2 at 1064 nm,respectively.In addition,the variations of signal intensity of different atomic W spectral lines(W(I)522.46 nm, W(I)525.53 nm,W(I)526.85 nm,W(I)549.62 nm,W(I) 551.47 nm,W(I)644.51 nm)with laser pulse energy ratio are studied and the results are shown in Fig.11.Maximum signal intensity is registered,when E2is twice E1.As the laser pulse energy ratio is 2:1,the signalintensity of the spectralline W(I)551.47 nm is nearly enhanced by four times as compared with the intensity registered with lasers pulse energy ratio 1:1. The previously reported values of the enhancement factor in the DP-geometry for Cu lines are4 to 10.[62]From the results, it can be concluded that the DP-LAS technique is superior if the optimum value of the E2/E1ratio is the laser wavelength dependent and kept at E2≥2E1.
Moreover,we conduct a comparison between the collinear and orthogonal dual pulse lasers geometries to enhance the signal-to-noise ratio of the DP-LAS.Figure 12 exhibits the variations of the DP-LAS signal intensity of W(I) 361.75 nm spectral line with laser pulse energy ratio for different collinear and orthogonal dual pulse laser geometries.It is found that signal intensity is enhanced by about four times for DP-LAS in the case of collinear geometry(266+1064 nm) at Δt=250 ns inter-pulse delay as compared with that for DP orthogonal geometry(1064+266 nm).In addition,the laser pulse energy ratios for both collinear and orthogonal geometries are well optimized.The results indicate that the DP-LAS intensity of W(I)361.75 nm spectral line reach a maximum value for the collinear DP geometry at 266+1064 nm as compared with that for the other geometries when the delayed laser pulse energy E2≥2E1.
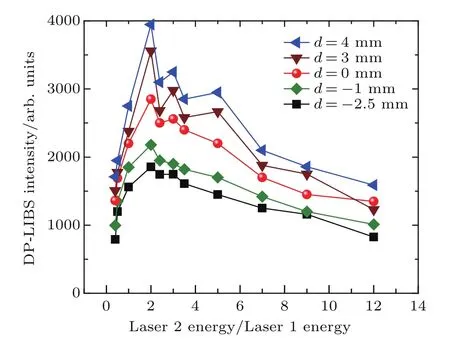
Fig.10.(color online)Variations of the DP-LIBS signal intensity of W(I) 361.75 nm line with laser pulse energy ratio E2(1064 nm)/E1(266 nm) by focusing the DP-lasers at various distances relative to the W surface (d=?2.5 mm,?1 mm in front of the surface,0,3 mm,and 4 mm behind the surface).

Fig.11.(color online)Variations of signal intensity of different atomic W spectral lines(W(I)522.46 nm,W(I)525.53 nm,W(I)526.85 nm,W(I) 549.62 nm,W(I)551.47 nm,W(I)644.51 nm)with laser pulse energy ratio The inter-pulse delay between the two laser pulses is Δt=250 ns and the total energy remains the same in all the cases.
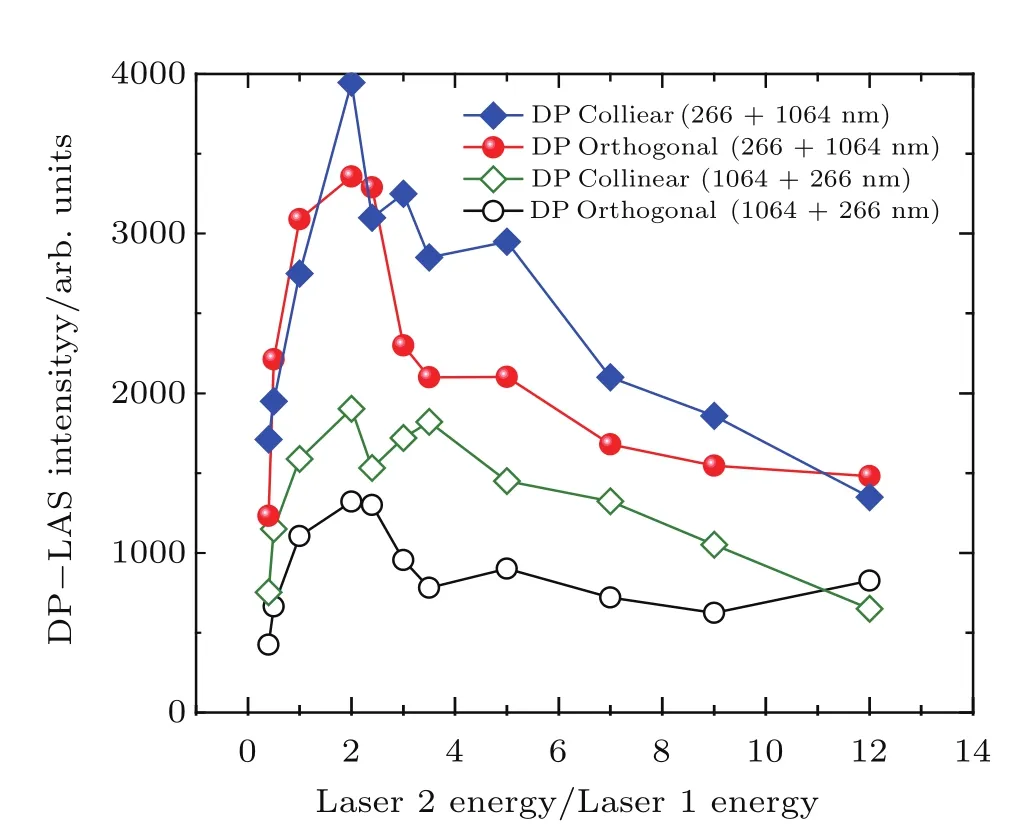
Fig.12.(color online)Variations of the DP-LAS signal intensity W(I) 361.75 nm spectral line as a function of laser pulse energy ratio at different collinear and orthogonal dual pulse laser geometries.
Figure 13 shows the distance–time(r–t)relation of tug-sten shockwave front parallel to the tungsten electrode surface at various time domains(0–10μs)which are obtained from the incoming laser pulse.During the laser pulse firing,the free expansion of spherical shock front increases with time interval according to a power law(r~t0.44).The plume front exhibits 5%of the greatest emission intensity of the plume body.The plume front starts to move at a speed of about 5.7×106cm·s?1.The plume front follows a shock wave after free propagation in air.Our experimental data are depicted in Fig.13 along with predictions from the“blast wave”theory. Zeldovich and Raizer[63]showed excellent match corresponding to the spherical blast wave model.This behavior is also in agreement with that obtained by Noll et al.[64]By applying Sedov’s theory[65]and utilizing a single fit to spherical expansion x/tβ,where β=2/5,and t is the time of expansion of the shockwave.Hence,the directed shockwave radius is estimated to be 0.46.The imaging data are utilized for recording plume lengths at various laser intensities as depicted in the inset of Fig.13.These results are useful for positioning the witness plate for particle trend.
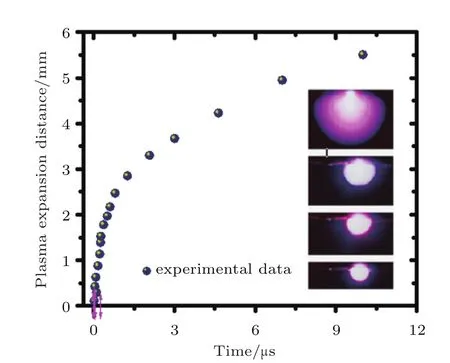
Fig.13.(color online)Time evolutions of the distance traveled by the plume front in the direction parallel to the tungsten electrode at 1500 ns delay.
3.4.SP and DP signal intensity dependence of W ion angular distribution
We design a special holder attached with an optical fiber for observing the plasma emission at different angles(20°–80°)as shown in Fig.14.Our work is mainly to study the dependence of SP and DP signal intensities on the angle of observation in order to reduce the measurement uncertainty and increase the light gathering efficiency.It can be noted that the intensity of W(I)at 361.75 nm increases with the rise of angle of observation till maximum degree at 80°under applying SP (266 nm),SP(1064 nm)and DP(266+1064 nm)system.The emission intensity of the W(I)at 361.75 nm spectral line is a factor of about 2.1 for DP-LAS experiment higher than that obtained by SP-LAS.The maximum intensities are observed at an angle of 80°in both SP and DP configurations.The inset in Fig.14 shows the plasma images produced by single and double laser pulses with using accumulation side spectra.It is observed that the plasma emission propagates and further becomes larger above the W surface in the case of DP-excitation than in the case of the SP-excitation single pulse excitation. In addition,the plasma plume propagates to form a spherical shape with a little hot spot in the center near the W target surface.It is also observed that the ion angular distribution is well described by the Anisimov model of expansion[66]up to11 J/cm2laser fluence,in exact agreement with the results reported previously.In addition,the best angle for collecting LAS signal depends on the excitation region used.
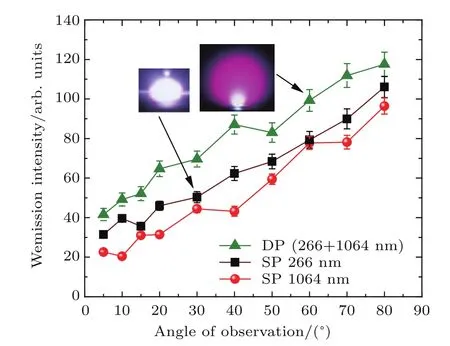
Fig.14.(color online)Variations of the LAS emission intensity W(I) 361.75 nm spectral line with angle of observation for SP-LAS(266 nm), SP-LAS(1064 nm)and DP-LAS(266+1064 nm)lasers.
4.Conclusions
In this study,self-developed collinear-beam DPLAS technique with proper geometry of UV followed by IR,can play a crucial role in adjusting and optimizing various applications. The temporal behaviors of plasma parameters like plasma density and temperature are investigated to prove that there is no self-absorption of atomic emission lines.It is observed that the collinear beam of DP-LAS geometry produces higher Teand Nevalues than that of SP-LAS geometry.The results are recorded at various factors like laser intensity,argon gas pressure,discharge voltage,and electrode distance.Moreover,the thermal plasma reheating and the inverse Bremsstrahlung processes by the collisions absorption and the discharge spark reveal the emission of W-ion source with high kinetic energy. In this work,a convenient technique(Faraday-cup ion collector)is used to measure the W-ion velocity of the plasma plume created by laser fields.The optimized DPLAS is achieved to accelerate W-ions under the action of an electric field by using FCIP.Acceleration of W-ions results from the increase in their charge number,which is in good agreement with the potential hump theory.The results confirm that the collinear beam DPLAS geometry is a superior technique compared with the conventional SP-LIP geometry and can be used for rapidly analyzing the W-plasma and production of tungsten ion sources.In this work,the angular distribution of tungsten ion flux is characterized by moving the fiber optic collector on semi-circle of 15 cm radius around the plasma spot on the electrode surface. In order to reduce the uncertainty of LAS emission measurements and enhance the light-gathering efficiency,we consider the plasma-confining influence from various angles on emissions of W plasma plumes.It is observed that the ion angular distribution is well described by the Anisimov model of expansion up to11 J/cm2laser fluence,which is in exact agreement with previous report.In addition,the best angle for collecting LAS signal depends on the excitation region used. At higher observation angle,the results are more favored in DP excitation than in SP scheme.The quantitative LAS analysis should be achieved with careful attention paid to the observation angle and spatial plasma distribution.
Acknowledgment
The authors would like to thank for continuous support of the equipments and facilities for this work the National Institute of Laser Enhanced Sciences(NILES),Cairo University,Giza,Egypt,the laser laboratories at University of Central Florida,USA,and the Department of Chemistry, King Fahd University of Petroleum and Minerals KFUPM, Dhahran,Saudi Arabia through good collaboration,and also thank Professor HJ Kunze,Esperimental-Physik V,Ruhr Uni-versitaet Bochum,Germany,for fruitful comments and support.
[1]Neu R,Dux R,Kallenbach A,et al.2005 Nuclear Fusion 45 209
[2]Ueda Y et al.2014 Fusion Engineering and Design 89 901
[3]Lide D R 1994 CRC Handbook of Chemistry and Physics,75thedn (Boca Raton.,Eds.)
[4]Cantle J E and West T S 1973 Talanta 20 459
[5]Ou Y,Yang Q,Du G,Chen F,Wu Y,Lu Y and How X 2015 Opt.amp; Laser Technol.70 71
[6]Kong X,Jia Q and Zhou W 2007 Microchemical J.87 132
[7]Stchur P,Yang K X,Hou X,Sun T and Michel R G 2001 Spectrochim. Acta Part B 56 1565
[8]Saleem S,Haun J and Kunze H J 2001 Phys.Rev.E 64 056403
[9]Zhang Y,Li J,Lu N,Shang K,Mizuno A and Wu Y 2016 Vacuum 123 49
[10]Sharkov B 1995 Handbook of Ion Sources Ed.B Wolf(Boca Raton, FL:CRC Press)p.149
[11]Jiang F,Zhang Y,Sun N and Len J 2015 Appl.Surf.Sci.331 278
[12]Bhatti K A,Rafique M S,Khaleeq-ur-Rahman,M,Latif A,Hussain K, Hussain A,Chaudhary K T,Tahir B A and Qindeel R 2011 Vaccum 85 915
[13]Butt M Z,Ali D,Tanveer M U and Naseem S 2014 Appl.Surf.Sci.305 466
[14]Farid N,Harilal S S,El-Atwani O,Ding H and Hassanein A 2014 Nucl. Fusion 54 1
[15]Kajita S,Sakaguchi W,Ohno N,Yoshida N and Saeki T 2009 Nucl. Fusion 49 1
[16]Farid N,Li C,Wang H and Ding H 2013 J.Nucl.Mater.433 80
[17]Manzoli A,Almeida G F B de,Filho J A,Mattoso L H C,Jr A R, Mendonca C R and Correa D S 2015 Opt.amp;Laser Tech.69 148
[18]Aussems D U B,Nishijima D,Brandt C,Doerner R P and Cardozo N J L 2014 J.Appl.Phys.116 063301
[19]Sun L,Yu H,Cong Z,Xin Y,Li Y and Qi L 2015 Spectrochim.Acta Part B:Atomic Spectroscopy 112 40
[20]Abbasi S A,Hussain M S,Ilyas B,Rafique M,Dogar A H and Qayyum A 2015 Laser Part.Beams 33 81
[21]Maurmann S,Kadetov V A,Khalil A A I,Kunze H J and Czarnetzki U 2004 J.Phys.D 37 2677
[22]Khalil A A I,Gandol M and Al-Suliman N 2011 Appl.Phys.B:Lasers Opt.103 441
[23]Zhao X and Shin Y C 2015 Appl.Phys.B 120 81
[24]Khalil A A I 2010 Laser Phys.20 238
[25]Khalil A A I and Gandol M 2009 Nucl.Instr.Meth.Phys.Res.B 267 3356
[26]Qi Y,Qi H,Wang Q,Chen Z and Hu Z 2015 Opt.amp;Laser Tech.66 68
[27]Frolov V D,Pivovarov P A,Zavedeev E V,Khomich A A,Grigorenko A N and Konov V I 2015 Opt.amp;Laser Tech.69 34
[28]Khalil A A I and Richardson M C 2006 Laser Phys.Lett.3 137
[29]Khalil A A I 2015 Opticsamp;Laser Tech.75 105
[30]Khalil A A I 2013 Opticsamp;Laser Tech.45 443
[31]Khalil A A I,Younis W O and Gandoll M 2017 Indian J.Phys.91 327
[32]Coons R W,Harilal S S,Hassan S M and Hassanein A 2012 Appl.Phys. B 107 873
[33]Gahan D,Daniels S,Hayden C,Scullin P,O’Sullivan D,Pei Y T and Hopkins M B 2012 Plasma Sources Sci.Technol.21 024004
[34]Babaeva N Y and Kushner M J 2007 J.App.Phys.101 113307
[35]Nayar A 1997 TheMetals Data Book(New Delhi:Tata McGraw-Hill Publishing Company Limited)
[36]Franzke J 2009 Anal.Bioanal.Chem.395 549
[37]Khalil A A I 2002 Study of the Effect of the Interaction of Laser Irradiation with Electrode Material on the Plasma Produced by an electric discharge and measurements of plasma properties by laser Thomson scattering diagnostic technique,Ph.D.thesis,(Cairo University,Giza: Egypt)
[38]Fujioka S,Shimomura M and Shimada Y 2008 Appl.Phys.Lett.92 241502
[39]Todorovi R,Skatari D,Bajramovi Z and Stankovi K 2016 Vacuum 123 111
[40]NIST 2017 Atomic spectra database
[41]Stavropoulos P,Palagas C,Angelopoulos G N,Papamantellos D N and Couris S 2004 Spectrochim.Acta B 59 1885
[42]Alonso-Medina A 2008 Spectrochim.Acta Part B 63 598
[43]Khalil A A I 2015 Appl.Phys.A:Mater.Sci.amp;Process.119 1087
[44]Miller J N and Miller J C 2006 Statistics and chemo-metrics for analytical chemistry,6thed.(England:Prentice Hall)
[45]Natrella M G 1963 Experimental Statistics,NBS Handbook,(91 National Institute of Standards and Technology)
[46]Gunther D and Hattendorf B 2005 Trac-Trends in Analytical Chemistry 24 255
[47]Hu Y and Yao Z 2008 Surfaceamp;Coatings Technology 202 1517
[48]Khalil A A I,Richardson M,Barnett C and Johnson L 2006 J.Appl. Spectrosc.73 735
[49]Khalil A A I,Richardson M,Johnson L and Gandol M 2009 Laser Phys.19 1981
[50]Griem H R 1974 Spectral Line Broadening by Plasmas(New York: McGraw-Hill)
[51]Khalil A A I 2013 Laser Phys.23 015701
[52]Khalil A A I,Gandol M and Dostger M A 2014 Appl.Opt.53 1709
[53]Khalil A A I,Gandol M,Shemis M and Khan I S 2015 Appl.Opt.54 2123
[54]Khalil A A I 2005 Surf.amp;Coat.Tech.200 774
[55]Khalil A A I and Morsy M A 2016 Talanta 154 109
[56]Capitelli M,Casavola A,Colonna G and De Giacomo A 2004 Spectrochim.Acta Part B 59 271
[57]Fuchs S E,Kolmhofer P J,Bodea,M A,Hechenberger J G,Huber N,Rossler R and Pedarnig J D 2015 Spectrochim.Acta Part B:Atomic Spect.109 31
[58]Liebermann M A and Lichtenberg A J 1994 Principles of Plasma Discharges and Materials Processing(New York:Wiley)
[59]Ye M and GrigoropoulosC P 2001 J.Appl.Phys.89 5183
[60]Nolte S,Momma C,Jacobs H,Tunnermann A,Chichkov BN,Wellegehausen B and Welling H 1997 JOSA B 14 2716
[61]Kim H T,Park D K and Choi W S 2003 J.Korean Phys.Soc.42 S916
[62]Pinon V,Fotakis C,Nicolas G and Anglos D 2008 Spectrochim.Acta B 63 1006
[63]Zeldovich Y B and Raizer Y P 2002 Physics of Shock Waves ad High-Temperature Hydrodynamic Phenomena(New York:Dover)
[64]Noll R,Sattman R,Sturm V and Winkelmann S 2004 J.Anal.At.Spectrom.19 419
[65]Sedov L I 1957 Similarity and Dimensional Methods in Mechanics,4thedn.English transl.ed.M Holdt(New York,NY:Academic Press)
[66]Anisimov S I,Bauerle D and Luk’yanchuk B S 1993 Phys.Rev.B 48 12076
11 April 2017;revised manuscript
29 May 2017;published online 11 August 2017)
10.1088/1674-1056/26/9/095201
?Corresponding author.E-mail:ahmedasaad68@yahoo.com;ahmedasaad@niles.edu.eg
?2017 Chinese Physical Society and IOP Publishing Ltd http://iopscience.iop.org/cpb http://cpb.iphy.ac.cn

- Chinese Physics B的其它文章
- Relationship measurement between ac-Stark shift of 40Ca+clock transition and laser polarization direction?
- Air breakdown induced by the microwave with two mutually orthogonal and heterophase electric field components?
- Collective motion of active particles in environmental noise?
- Temperature dependence of heat conduction coefficient in nanotube/nanowire networks?
- Analysis of dynamic features in intersecting pedestrian flows?
- Heat transfer enhancement in MOSFET mounted on different FR4 substrates by thermal transient measurement?