
Impact of Atmospheric and Oceanic Conditions on the Frequency and Genesis Location of Tropical Cyclones over the Western North Pacific in 2004 and 2010
2016-12-07 07:40:59PanSONGJiangZHUZhongZHONGLinlinQIandXiaodanWANG
Advances in Atmospheric Sciences 2016年5期
Pan SONG,Jiang ZHU,Zhong ZHONG,Linlin QI,and Xiaodan WANG
1College of Meteorology and Oceanography,PLA University of Science and Technology,Nanjing 2111012International Center for Climate and Environment Science,Institute of Atmospheric Physics, Chinese Academy of Sciences,Beijing 100029
3Beijing Institute of Aeronautical Meteorology,Beijing 100085
Impact of Atmospheric and Oceanic Conditions on the Frequency and Genesis Location of Tropical Cyclones over the Western North Pacific in 2004 and 2010
Pan SONG?1,3,Jiang ZHU2,Zhong ZHONG1,Linlin QI3,and Xiaodan WANG3
1College of Meteorology and Oceanography,PLA University of Science and Technology,Nanjing 211101
2International Center for Climate and Environment Science,Institute of Atmospheric Physics, Chinese Academy of Sciences,Beijing 100029
3Beijing Institute of Aeronautical Meteorology,Beijing 100085
This study examines the impact of atmospheric and oceanic conditions during May–August of 2004 and 2010 on the frequency and genesis location of tropical cyclones over the western North Pacific.Using the WRF model,four numerical experiments were carried out based on different atmospheric conditions and SST forcing.The numerical experiments indicated that changes in atmospheric and oceanic conditions greatly affect tropical cyclone activity,and the roles of atmospheric conditions are slightly greater than oceanic conditions.Specifically,the total number of tropical cyclones was found to be mostly affected by atmospheric conditions,while the distribution of tropical cyclone genesis locations was mainly related to oceanic conditions,especially the distribution of SST.In 2010,a warmer SST occurred west of 140?E,with a colder SST east of 140?E.On the one hand,the easterly flow was enhanced through the effect of the increase in the zonal SST gradient. The strengthened easterly flow led to an anomalous boundary layer divergence over the region to the east of 140?E,which suppressed the formation of tropical cyclones over this region.On the other hand,the colder SST over the region to the east of 140?E led to a colder low-level air temperature,which resulted in decreased CAPE and static instability energy.The decrease in thermodynamic energy restricted the generation of tropical cyclones over the same region.
tropical cyclone,SST,numerical simulation,western North Pacific
1.Introduction
The western North Pacific(WNP)is the world’s most active tropical cyclone basin(Emanuel,2005;Peduzzi et al., 2012;Lin et al.,2013).The interannual variability of tropical cyclone activities,including the frequency,intensity,location and landfalling,is complicated and has been found to be closely related to large-scale circulation,including ENSO (Chan,1985,2000;Lander,1994;Wang andChan,2002;Camargo and Sobel,2005;Wada and Chan,2008),MJO(Liebmann et al.,1994;Nakazawa,2006;Nakano et al.,2015), quasi-biennialoscillation(Chan,1985;Lau and Chan,1993), Asian–Pacific Oscillation(Zhou et al.,2008),North Pacific oscillation(Wang et al.,2007),Antarctic oscillation(Ho et al.,2005;Wang and Fan,2007),North Atlantic oscillation (Zhouand Cui,2014),and Hadley circulation(Zhouand Cui,2008).In addition,many researchers consider global warming,and related SST change,to be a key driver of changes in tropical cyclone activity(Webster et al.,2005;Emanuel et al.,2008;Sugi et al.,2002,2012;Gleixner et al.,2014;Scoccimarro et al.,2014;Holland and Bruy`ere,2014).However, the exact impacts that changes in SST may have on tropical cyclone activity remain ambiguous,especially when changes are not uniform.
The effects of climate change on tropical cyclones have been a prominent issue for a number of years.In recent decades,SST in major tropical cyclone generation regions has increased several tenths of a degree Celsius(Santer et al.,2006).As a result of the recent increase in the capabilities of climate models,such models have captured some of the essential physical relationships that govern the links between the climate and tropical cyclones.Early climate model simulations,however,suggested some ambiguity in changes of tropical cyclone characteristics induced by warmer SST. While many models projected fewer tropical cyclones glob-ally(Sugi et al.,2002;Bengtsson et al.,2007;Gualdi et al.,2008;Knutson et al.,2010),other climate models suggested some increase in future numbers(Broccoli and Manabe,1990;Haarsma et al.,1993;Emanuel,2013).Yoshimura and Sugi(2005)investigated impacts of SST warming on the tropical cyclone climatology using a high-horizontalresolution AGCM.The results of numerical experiments in which SST was uniformly higher by 2 K demonstrated that the changes in SST had a relatively small influence on the tropical cyclone frequency.Similar to Yoshimura and Sugi (2005),Held and Zhao(2011)carried out an experiment in which SST was uniformly higher by 2 K,and found that the tropical cyclone frequency decreased by 10%.Zhao et al. (2013)comparedHurricaneWorkingGroupmodel responses for various simulations.They found that most of the models showed decreases in global tropical cyclone frequency when the model was run with 2 K higher SST.In addition to the experiments with a uniformly higher SST,Sugi et al.(2002) found that the regional change in tropical cyclone frequency was closelyrelatedtothedistributionoftheSSTanomalyand the changein convectiveactivity associated with it.Chen and Huang(2006)pointed out that when the West Pacific warm pool was warm,the tropical cyclone numbers over the WNP were lower than those when it was cold.Additionally,when the West Pacific warm pool was warm,the locations of tropical cyclones were mostly in the northwest,whereas the tropical cyclones occurred in the southeast more frequently when the warm pool was relatively cold.These studies show that the exact influence of SST changes on tropical cyclone activity is still a matter fordebate.Moreover,the uniformincrease or decrease in SST and non-uniformSST changes may affect the tropical cyclone activity differently.
?Institute of Atmospheric Physics/Chinese Academy of Sciences,and Science Press and Springer-Verlag Berlin Heidelberg 2016
The horizontal scale of tropical cyclone ranges from hundreds of kilometers to thousands of kilometers,both of which are small relative to the scale of global climate models.However,tropical cyclones always involve substantial energy exchange and complex thermodynamic mechanisms, which cannot be depicted in detail even by the highest resolution global climate models.The WRF model,as one of the most popular numerical models in studying mesoscale weather systems,has been widely used in tropical cyclone case studies(Fierro et al.,2009;Cha and Wang,2013;Sun et al.,2014a).Shen et al.(2010)and Wang et al.(2012)attempted the seasonal prediction of tropical cyclones over the WNP in 2006 and indicated that WRF was capable of tropical cyclone seasonal forecasting.However,they did not discusstheimpactsofatmosphericenvironmentchangeandSST change on tropical cyclone activity.
In the present study,the impacts of the different atmospheric environments and SST between 2004 and 2010 on tropical cyclone activity were examined using the WRF model.The rationale for the choice of 2004 and 2010 as abnormalyearsfortropicalcycloneactivityis introducedinsection 2.After a briefdescription of the model and experiments in section 3,the results of the experiments and the possible reasons for the changes in tropical cyclone activities due to changes in atmospheric environments and SST are presented and discussed in section 4,followed by a summary in section 5.
2.Choice of abnormal years for tropical cyclone activity,and the climate background
2.1.Analysis of tropical cyclone frequency
Tropical cyclone numbers were analyzed using the best track dataset of the China Meteorological Administration (CMA)(http://tcdata.typhoon.gov.cn/en/index.html)for the period 2000–2012 to identify abnormal years for tropical cyclone activity.Figure 1 shows that the annual total number of tropical cyclones was highest in 2004 and lowest in 2010. In addition,the average number of tropical cyclones during May–August was also highest in 2004 and lowest in 2010. Therefore,2004 and 2010 were chosen as abnormal years for this study.Theredandblue lines inFig.1 showthe same pattern,meaningthat the variationin thetotal numberoftropical cyclones during May–August(MJJA)can also indicate the variation in the total number of tropical cyclones in a year.
Thenumbersoftropicalcyclonesforeachmonthbetween May and August of 2000 to 2012 are given in Table 1.The total number of tropical cyclones in 2004 and 2010 was 34 and 18,respectively.The number of tropical cyclones during MJJA in 2004 and 2010 was 20 and 8,respectively.For this reason,we chose the months of MJJA in 2004 and 2010 as the case study period.
In addition to the difference in total tropical cyclone numbers,we considered whether there was any difference in the activity region or distribution of the genesis location of tropical cyclones between the two years.Figure 2 shows the distribution of tropical cyclone genesis location over the WNP from the best track dataset.There are clear differences in tropical cyclone numbers and locations between 2004 and 2010.Tropical cyclone numbers in 2004 are considerably greater than those in 2010,and the locations are scattered across a range from 100?E to 180?E in 2004,whereas in 2010 they are mainly located to the west of 140?E.In this study,we sought to determine why such great differences in total numbers and locations existed between the two years. We also sought to determine what the differences were in theatmosphericand oceanic situation that influencedthe tropical cyclone activity between these two abnormal years.

Fig.1.Tropical cyclone numbers recorded in the CMA best track dataset over the WNP during the period 2000–2012:annual total number(red line);total during MJJA(blue line).

Table 1.Monthly tropical cyclone numbers during MJJA of 2000–2012.
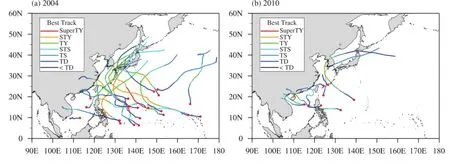
Fig.2.The tracks and locations from the best track dataset during MJJA(a)2004 and(b)2010 over the WNP.Different colors represent different intensities:weaker than tropical depression(<TD);tropical depression(TD);tropical storm(TS); severe tropical storm(STS);typhoon(TY);severe typhoon(STY);and super typhoon(SuperTY).
2.2.Atmospheric and oceanic background of 2004 and 2010
We examined the differences in the subtropical high, WNP monsoon trough and SST during MJJA between 2004 and2010.Thedatasets usedwereall fromtheNCEP FNL(final)Analysis(http://rda.ucar.edu/datasets/ds083.2/)at 1?resolution and 6-h intervals.
The forecasting of circulation is a very important part in the process of tropical cyclone seasonal forecasting(Wang et al.,2012).In the typhoon season,the southeast trade winds in the south of the western Pacific subtropical high directly influence the main genesis locations of tropical cyclones, as well as their generation,development and track(Lei and Chen,2001;Huang et al.,2013).Figures 3a and b demonstrate the circulation at 500 hPa in 2004 and 2010.In 2004, the subtropical high(area of 588 dagpm line)was weaker than that in 2010.The western ridge was near 140?E in 2004, while it expanded to 122?E in 2010.Downward air-flows in regions controlled by a subtropical high are unfavorable for the formation of tropical cyclones.Therefore,tropical cyclones always activate in the south and west of the western Pacific subtropical high(Ren et al.,2007;Sun,2011). This explains why the locations of tropical cyclones in 2004 were scattered over the broad region in the south and west of the subtropical high.In 2010,the subtropical high extended southward to 10?N.In general,tropical cyclones do not originate in such low latitude regions,so the locations of tropical cyclones in 2010 were located mostly in the west of the subtropical high,and fewer tropical cyclones were activated in total.
The western North Pacific monsoon trough is a low pressure belt formed by convergence of the southwest monsoon or cross-equatorialflow and southeast trade wind in the south of the subtropical high.It is a part of the ITCZ.The WNP monsoon trough is a region of considerable convective activity,and such activities are conducive to the generation of low pressure perturbations and therefore the generation and development of tropical cyclones(Gao et al.,2008).Figures 3c and d show the monsoon trough in 2004 and 2010. The monsoon trough in 2004 was clearly stronger than it was in 2010.The monsoon trough extended eastward to 150?E with more tropical cyclones in 2004;while in 2010,it did not reach130?E andthereforethe tropicalcyclonelocationswere further west,and fewer tropical cyclones were activated in total.
From the analysis of atmospheric circulations,we can see that the atmospheric conditions were clearly distinct between the two years in question.The location and strength of the subtropical high and monsoon troughs strongly influenced the tropical cyclone activity.Following the description of these different atmospheric situations,we next examinedwhether the oceanic situation in 2004 and 2010 was also noticeably different.Previous research has indicated that tropical cyclone activity is closely related to SST(Holland,1997; Hoyos et al.,2006;Dare and McBride,2011;Sun et al., 2014b).Therefore,this paper also analyzes the variation in the SST in 2004 and 2010.
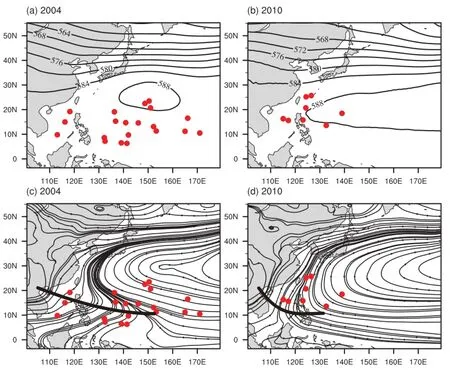
Fig.3.The average MJJA(a,b)geopotential height(contours;interval of solid contours:4 dagpm;units:dagpm) at 500 hPa and(c,d)stream fields at 850 hPa with tropical cyclone genesis locations(red dots)in(a,c)2004 and (b,d)2010.Fields were derived from NCEP FNL;tropical cyclone genesis locations were from best track dataset of CMA.
Figure 4 shows the distribution of oceanic heat(SST)difference between 2004 and 2010(expressed as 2010 minus 2004).Figure 4 shows that there was a significant difference in SST distribution between 2004 and 2010.The SST difference of the warm pool[located at approximately(0?–20?N, 110?–150?E)]andtheoceantotheeastofthewarmpoolwere totally opposite.The warm pool in 2010 was warmer than that in 2004,while the ocean to the east of the warm pool was colder than that in 2004.
The SST in 2004 and 2010 was also compared with the climatology(not shown).The results were consistent with those in Fig.4,e.g.,the warm pool in 2004 had a negative anomaly,but there was a positive anomaly in 2010.The observations of tropical cyclone genesis locations in 2004 and 2010 show that the tropical cyclone numbers over the east of the warm pool in 2010 were lower than those of 2004.This indicates that the number of tropical cyclones formed in the east of the warm pool decreases when the warm pool has a warm anomaly.This relationship between different thermalconditions of the warm pool and tropical cyclone activity is consistent with the results of Chen and Huang(2006).

Fig.4.Difference in average SST(units:?C)between 2004 and 2010.
3.Model and experiments
3.1.Model configuration
The WRF model(version 3.3.1)(Skamarock et al.,2008) was employed in this study.A 10-km resolution domain with 36 vertical levels was set up for the simulation.The model domain was centered at(30?N,140?E),with 380(east–west) ×340(north–south)grid points,including complex topography and land–sea contrast.The initial and lateral boundary conditions,as well as the SST forcing data,were derived from the datasets used in section 2.2.The simulation started at 0000 UTC 1 May and ended at 1800 UTC 31 August,with a total of 123 days’integration.The physical parameterizations used included the Eta microphysics scheme (Rogers et al.,2001),and the Betts–Miller–Jajic cumulus parameterization scheme(Janji′c,1994).The other schemes were the Yonsei University planetary boundary layer scheme (Hong et al.,2006),the Rapid Radiative Transfer Model (Mlawer et al.,1997)for longwave radiation,and the Goddard scheme(Chou and Suarez,1994)for shortwave radiation.The sst update option in the WRF model was opened to update the SST every six hours.
3.2.Experiments
From the analyses above,we can see that both oceanic and atmospheric conditions were significantly different between 2004 and 2010.There seems to be a close link between the difference in SST and tropical cyclone locations in 2004 and 2010.Based on these observations,we next considered what influence the SST changes may have on tropical cyclone activity when the atmospheric conditions remain the same.To answer this question,four experiments were implemented.
The atmospheric initial and lateral boundary conditions and oceanic SST forcing of EXP1 were from the 2004 FNL dataset.EXP2 was the same as EXP1 except that the SST forcingwas taken from2010.The atmosphericinitial and lateral boundary conditions and oceanic SST forcing of EXP3 were from the 2010 FNL dataset.EXP4 was the same as EXP3 except that the SST forcing was taken from 2004.
3.3.Criteria for selecting tropical cyclones
An essential first step in the analysis was to select a method for detecting and tracking the cyclones in the model outputs.A number of such schemes have been developed over the years.For example,the model and basinthreshold dependent scheme(Camargo and Zebiak,2002), the structure-based threshold scheme(Walsh et al.,2007), and the circulation-based scheme(Tory et al.,2013).These schemes havesome keydifferencesbut also sharemanycommon characteristics:(1)near-surface wind speed;(2)lowlevel relative vorticity;(3)a warm core;(4)a difference in wind speed between the upper and low levels;and(5)duration.Based on Hurricane Working Group simulations,Horn et al.(2014)examined the sensitivity of the variation in tropical cyclone numbers to different schemes.In general,after corrections were made,there was considerablygreater agreementthandisagreementonthesign ofthe modelresponsebetween different tracking schemes.Nevertheless,it was possible to obtain a different sign of the response for the same experiment by using different schemes.
This was demonstrated by Camargo and Zebiak(2002), who used basin-and model-dependent threshold criteria to improve the climatology and interannual statistics of model tropicalcyclones.Themethodsusedinthepresentstudywere basically the same as those used by Camargo and Zebiak (2002).Values of 850-hPa relative vorticity,sea level pressure,and 10 m wind speed were chosen to locate the tropical cyclone.The structure was described from three different aspects:700,500and300 hPa temperatureanomalies,to depict the warm core structure;the difference between the 300 and 850 hPa temperature anomalies,to depict the vertical structure of the warm core;and the difference in wind speed between 300 and 850 hPa,to depict the vertical structure of the tropical cyclone.These thresholds were confirmed by Camargo and Zebiak(2002).Seven sets of criteria were used as follows:
(1)An850-hParelativevorticityof>3.6×10⁻⁵s-1near the cyclone center;
(2)A maximum surface wind speed in a centered 7?×7?grid box of>11.8 m s-1;
(3)A sea level pressure that is the local minimum and carries a value of<1020 hPa;
(4)Anaveragetemperaturedifferencefromtheareamean of the surrounding region at 300,500 and 700 hPa of>1.9?C;
(5)A local temperatureanomalyat 300hPa that is greater than that at 850 hPa;
(6)An average speed that is larger at 850 hPa than at 300 hPa;
(7)A duration of at least 1.5 days(for six-hourly output).
Camargo and Zebiak(2002)pointed out that the tracks obtainedbythesecriteriaareusuallyveryshort.Visualexamination of the corresponding relative vorticity fields showed that the cyclone structure is visible well before and after the detection criteria are met.This suggests that relaxing the detection criteria would produce longer tracks.To verify the givenmethod,it was used to detecttropicalcyclonesfromthe FNL dataset ranging from 0000 UTC 1 May 2004 to 1800 UTC 31 August 2004.Figure 5 shows the result from the model and the best track.The results show that the method is able to successfully detect the tropical cyclone locations and tracks.
4.Results and discussion
4.1.Results

Fig.5.Tracksdetected fromtheFNLdataset using theCamargo (2002)method(blue)and the tracks of the best track dataset from the CMA(red).
The numbers of tropical cyclones and tropical cyclone“dots”simulated by the numerical experiments are shown in Table 2.A tropical cyclone“dot”is a grid location that meets all seven of the criteria mentioned above.A longer track was obtained by tracking backward and forward based on the tropical cyclone dot.Both the number of tropical cyclones and number of tropical cyclone dots were the most in EXP1,while in EXP3 they were both the least.These results agreed well with the CMA best track dataset.EXP1 simulated three fewer tropical cyclones than the best track of 2004 and EXP3 simulated two fewer tropical cyclones than the best track of 2010,i.e.,the simulated tropical cyclone numbers were lower than observed,which is in agreement with the result of Wang et al.(2012).Comparison of EXP1 and EXP2 indicates that the SST of 2010(EXP2)reducedthe number of tropical cyclone dots by nearly 15%and tropical cyclone numbers by nearly 29%.Meanwhile,comparison of EXP3 and EXP4 indicates that the SST of 2010(EXP3)decreased the number of tropical cyclone dots by nearly 35% and tropical cyclone numbers by nearly 25%.Comparison of EXP1 and EXP4 indicates that the atmospheric environment of 2010(EXP4)reduced the number of tropical cyclone dots by nearly 44%and tropical cyclone numbers by nearly 53%. Meanwhile,comparison of EXP2 and EXP3 indicates that the atmospheric environment of 2010(EXP3)decreased the number of tropical cyclone dots by nearly 57%and tropical cyclone numbers by nearly 50%.Thus,we can conclude that such changes in atmospheric conditions and oceanic conditions(SST)greatlyaffecttropicalcycloneactivity.Moreover, the roles of changes in atmospheric conditions were slightly greater than those of oceanic conditions.
The tracks and locations of tropical cyclones simulated in EXP1 and EXP3 are shown alongside the best track results in Fig.6.EXP1 was a simulation of 2004,while EXP3 was a simulation of 2010.Although the simulated tracks were not able to remain consistent with the best track one by one, the results nevertheless captured general features of tracksandthedistributionof locations.Thetropicalcyclonegenesis locations simulated in EXP1 were essentially in accordance withthebesttrackresultsfor2004,withaslightwestwarddeviation.The results of EXP3 show that the tropical cyclone genesis locations in 2010 were mostly located to the west of 140?E.

Fig.6.The(a,b)tracks and(c,d)locations of model outputs(blue)and best track dataset(red)in(a,c)2004(EXP1) and(b,d)2010(EXP3).

Table 2.Number of tropical cyclones and tropical cyclone“dots”in the four experiments.
Figure 7 shows the tracks and locations of the four experiments.The number of tropical cyclones that originated from east of 140?E in EXP2 was lower than in EXP1(Fig. 7e).In other words,SST in 2010 reduced the number of tropical cyclones originating from east of 140?E.This is in agreement with the best track results,which show that the locations in 2010 were in the west.The number of tropical cyclones originating from the region east of 140?E was higher in EXP4 than in EXP3(Fig.7f).In other words,SST in 2004 increased the number of tropical cyclones originating from east of 140?E.Again,this is in agreement with the best track results,which show that the tropical cyclone genesis locationsin 2004were scatteredwidelybotheast andwest of 140?E.Figure 7g shows many tropical cyclones originating from east of 140?E in both EXP1 and EXP4 with SST in 2004.The atmospheric conditions in 2010 reduced the total number of tropical cyclones.Figure 7h shows that tropical cyclones in EXP2 and EXP3 with SST in 2010 were mainly scattered west of 140?E.The atmospheric conditions in 2004 increased the total number of tropical cyclones.These model results were all in accordance with the observations.
4.2.Discussion
The comparisons between the experiments reported above indicate that any changes of atmospheric conditions and oceanic conditions can greatly affect tropical cyclone activity.We now attempt to explain this process by analyzing the impacts of their changes on the convectiveactivity and its associated quantities.
Figure 8 shows the differences in average atmospheric conditions(geopotential height at 500 hPa:H500),oceanic conditions(SST)and precipitation rate.We can see good agreement between the pattern of the SST anomaly and the pattern of the precipitation difference in both Figs.8a and b.The pattern correlation(8?–30?N)reaches 0.44 and 0.42, respectively.All the pattern correlation coefficients in this paper passed the u-test(Mann and Whitney,1947),with a significance level of 0.05.The regions with a positive SST anomaly have a positive precipitation difference,and vice versa.Thus,over the region east of 140?E,the patterns of changes in tropical cyclone numbers,precipitation and the SST anomaly resemble each other.There is also good agreement between the H500 and the pattern of the precipitation differencein bothFigs.8candd.Thepatterncorrelation(8?–30?N)reaches-0.38 and-0.43,respectively.The regions with a positive H500 anomaly have a negative precipitation difference.This suggests a chain of links from the geopotential height anomaly at 500 hPa and the SST anomaly to convective activity(or precipitation),from convective activity to circulation,andfromcirculationtocyclogenesis.Besides,we can see that the spatial patterns of SST and precipitation rate in Figs.8a and b possess apparent differences in zonal direction,while the spatial patterns of H500 and precipitation rate in Figs.8c and d do not show any obvious zonal difference.
To understand the changes in convective activity,we examined the changes in the distribution of the mean fields of quantities associated with convection.Figure 9 shows the difference in the wind field at 850 hPa and the vertical velocity at 500 hPa(W500).In Fig.9a,there is weak anticyclonic circulation in the east of the warm pool between 10?N and 20?N,and weak anticyclonic circulation in the same regions shown in Fig.9b.Zhao et al.(2013)showed that decreases in global tropical cyclone frequency for the 2 K higher SST run were most closely related to 500 hPa vertical velocity. Kim et al.(2014),using GFDL CM2.5,obtained the same result;that the reduction of tropical cyclone frequency was strongly related to weakening of vertical velocity in the midtroposphere.In the 500 hPa vertical velocity field in Fig.9a, there is a downwardW500in the east of the warm pool where an anticyclone is located in the lower level,which is not suitable for tropical cyclone generation.In Fig.9b,there is also downwardW500intheeast ofthewarmpoolwithanticyclonic circulation in the lower level,which is not suitable for tropical cyclone formation.The anticyclone and downward W500can be seen in Figs.9c and d over the region to the west of the warm pool,and also to the east of the warm pool.We can conclude that the atmospheric circulation triggered by the atmospheric condition and SST in 2010 was not conductive to cyclogenesis.
In addition to the dynamic variables,Figs.10 and 11 show the patterns of differences in average CAPE,static stability,relative humidity at 700 hPa,and OLR.In Fig.10a, negative anomalous CAPE with a negative SST difference is apparent in the east of the warm pool.Over these regions,anomalous convection is negative(Fig.8a).On the other hand,the same relationship can be seen in Figs.10b and 8b.The pattern correlation in Figs.10a and b reach 0.54 and 0.66,respectively.Here,the static stability is defined as the difference in potential temperature at 500 hPa and 1000 hPa(denoted as THETA for convenience).Figure 10c shows negative anomalous static stability east of the warm pool, and Fig.10d also shows negative anomalous static stability in the same region.The pattern correlation in Figs.10c and d reaches 0.82 and 0.81,respectively.In Fig.10e,there are positive and negative relative humidity centers in the east ofthe warm pool with a negative anomalous SST.In Fig.10f, there are also positive and negative relative humidity centers in the region where the anomalous SST is negative.Therefore,the pattern correlation in Figs.10e and f only reaches -0.04 and 0.12,respectively.In Fig.10g,there is positive anomalous OLR in the warm pool and east of the warm pool, whereas Fig.10h shows positive anomalous OLR in the east of the warm pool with a negative anomalous SST and negative anomalousOLR in the warm poolwith a positive anomalous SST.The pattern correlation in Figs.10g and h reaches -0.20 and-0.16,respectively.Moreover,there are zonal differences in all of these quantities’distributions.The consistency between the distribution of SST and these quantities associated with convectionmeansthat the distributionof SST influenced the distribution of tropical cyclone genesis locations.

Fig.7.The simulated(a–d)tracks and(e–h)locations in the four experiments.

Fig.8.Difference in average SST(a,b)(contours;above zero:solid line;below zero:dashed line;interval:0.4?C), geopotential height at 500 hPa(c,d)(contours;above zero:solid line;below zero:dashed line;interval:0.5 dagpm) and precipitation rate(shaded;units:mm d-1).Pattern correlations between SST,geopotential height at 500 hPa and precipitation are also shown in parentheses.
Figure 11 shows the difference in CAPE,static stability, relative humidity at 700 hPa,OLR,and H500,in EXP4 versus EXP1,and EXP3 versus EXP2.Compared with Fig.10, we can see that the distributions of these quantities in Fig. 11 possess no obvious zonal differences.The differences in CAPE,static stability,and relative humidity at 700 hPa are negatively correlated with the differences in H500,while the differences in OLR are positively correlated with the differences in H500.The pattern correlations in Figs.11a–h reach -0.22,-0.25,-0.17,-0.24,-0.39,-0.53,0.34 and 0.36, respectively.This means that the increase in H500 in 2010 restrained the convective activity.
Besides,we also calculated the pattern correlation with SST and H500 of the relative vorticity at 850 hPa and divergence at 200 hPa,separately.Figure 10 shows the roles of SST fields(EXP1 versus EXP2,EXP3 versus EXP4)in tropical cyclone activity in the WNP,and Fig.11 shows the roles of the atmospheric environment(EXP1 versus EXP4,EXP2 versus EXP3)in tropical cyclone activity in the WNP.We averaged the pattern correlation in Figs.10a and b to represent the impacts of SST on CAPE.Similarly,we averagedthe pattern correlation in Figs.11a and b to represent the impacts of the atmospheric environment(H500)on CAPE.The results are shown in Table 3.It is clear that changes in atmosphericenvironment have greater impacts on changes in RH,OLR, relative vorticity and divergence,compared with changes in oceanconditions.However,changesinoceanconditionshave greater impacts on changes in CAPE and THETA,compared with changes in atmospheric environment.

Fig.9.Difference in the average stream field(vectors;units:m s-1)at 850 hPa and vertical velocity(colored shading; units:m s-1)at 500 hPa.

Table 3.Pattern correlations between CAPE,static stability (THETA),relative humidity(RH),OLR,relative vorticity,divergence and SST,H500.
The above analysis may help us to better understand why colder SST over the region to the east of 140?E in 2010 decreased tropical cyclone numbers over the same region.In 2010,a greater SST warming occurred west of 140?E;meanwhile,there was colder SST east of 140?E.As a result,the zonal SST gradient increased across the whole region(90?–180?E).The increased zonal SST gradient strengthened the easterly flow,which led to an increase in boundary layer divergence over the region to the east of 140?E(wind fields in Figs.9a andb).As we know,tropicalcyclonesoriginatefrom tropical disturbances(Lau and Lau,1990;Fu et al.,2007); therefore,the anomalousboundarylayer divergenceoverthat region suppressed the formation of tropical cyclones.In addition to the unfavorable dynamic conditions,the colder SST east of 140?E led to a colder low-level air temperature,which resulted in a decrease in CAPE and static instability energy (Figs.10a–d).The decrease in thermodynamic energy restricted the generation of tropical cyclones.
5.Summary

Fig.10.Difference in(a,b)CAPE(units:J kg-1),(c,d)static stability(units:?),(e,f)relative humidity(units:percent)at 700 hPa,and(g,h)OLR(units:W m-2)and SST(contours;above zero:solid line;below zero:dashed line;interval:0.4?C).Pattern correlations between CAPE, static stability,relative humidity at 700 hPa,OLR and SST are also shown in parentheses.

Fig.11.Difference in(a,b)CAPE(units:J kg-1),(c,d)static stability(units:?),(e,f)relative humidity(units:percent)at 700 hPa,and(g,h)OLR(units:W m-2)and geopotential height at 500 hPa(contours;above zero:solidline;below zero:dashed line;interval:0.5dagpm).Pattern correlations between CAPE,static stability,relative humidity at 700 hPa,OLR and geopotential height at 500 hPa are also shown in parentheses.
In this study,the influence of different atmospheric and oceanic conditions on tropical cyclone frequency and location in the WNP was examined using the WRF model.Fourexperiments that employed different atmospheric initial and lateral boundary conditions,as well as different SST forcing, were performed for the MJJA period of 2004 and 2010.
The results of the experiments showed that changes in atmospheric environment have greater impacts on changes in RH at 700 hPa,OLR,relative vorticity at 850 hPa,and divergence at 200 hPa,compared with changes in ocean conditions.However,changes in ocean conditions have greater impacts on changes in CAPE and static stability.The differences in the locations of tropical cyclones in 2004 and 2010 were closely related to the distribution of the SST anomaly, and the change in its associated convective activity.In the warmer(colder)region,low-level static instability enhanced (weakened),mid–low-level moisture increased(decreased), and CAPE increased(decreased).The increase(decrease)of low-levelinstability energyandmoisture directlyaffectedthe convective activity.Accompanied by low-level cyclonic(anticyclonic)circulation and upward(downward)vertical velocity in the mid-troposphere,tropical cyclone activity over this region was promoted(restrained).
It has been found that the total number of tropical cyclones was mostly affected by atmospheric conditions,while the distribution of tropical cyclone genesis locations was mainly influenced by oceanic conditions,especially the distribution of SST.The physical processes responsible for the decreased numbers of tropical cyclones over the region to the east of 140?E in 2010,caused by colder SST over the same region,are discussed below.In 2010,on the one hand,the easterly flow was enhanced through the effect of the increase of the zonal SST gradient.The strengthened easterly led to anomalous boundary layer divergence over the region to the east of 140?E.The anomalous boundary layer divergence suppressed the formation of tropical cyclones.On the other hand,the colder SST over the region to the east of 140?E led to colder low-level air temperature,which resulted in decreased CAPE and static instability energy.The decrease in thermodynamic energy restricted the generation of tropical cyclones.
Although the simulated numbers and locations of tropical cyclones in 2004 and 2010 were close to the best track on the seasonal timescale,there were still clear differences on the monthly timescale.Model errors accumulatedin longterm simulations and the choice of parameterizationschemes may contribute to this issue.Improving our understanding of the mechanisms through which changes of atmospheric conditions and oceanic conditions influence tropical cyclone activity requires more detailed analyses and experiments in the future.
Acknowledgements.This work was supported by the Chinese Academy of Sciences’Project“Western Pacific Ocean System: Structure,DynamicsandConsequences”(GrantNo.XDA10010405), the National High Technology Research and Development Program of China(863 program)(Grant No.2012AA091801),the National Natural Science Foundation of China(Grant Nos.41205044 and 41205075),and the Natural Science Foundation of Jiangsu Province (Grant No.BK2012062).
REFERENCES
Bengtsson,L.,K.I.Hodges,M.Esch,N.Keenlyside,L.Kornblueh,J.J.Luo,and T.Yamagata,2007:How may tropical cyclones change in awarmer climate?Tellus,59(4),539–561.
Broccoli,A.J.,and S.Manabe,1990:Can existing climate models be used to study anthropogenic changes in tropical cyclone climate?Geophys.Res.Lett.,17(11),1917–1920.
Camargo,S.J.,and S.E.Zebiak,2002:Improving the detection and tracking of tropical cyclones in atmospheric general circulation models.Wea.Forecasting,17(6),1152–1162.
Camargo,S.J.,and A.H.Sobel,2005:Western North Pacifictropical cyclone intensity and ENSO.J.Climate,18(15),2996–3006.
Cha,D.H.,and Y.Q.Wang,2013:A dynamical initialization scheme for real-time forecasts of tropical cyclones using the WRF model.Mon.Wea.Rev.,141(3),964–986.
Chan,J.C.L.,1985:Tropical cyclone activity in the northwest Pacific in relation to the El Ni?no/Southern Oscillation phenomenon.Mon.Wea.Rev.,113(4),599–606.
Chan,J.C.L.,2000:Tropical cyclone activity over the western North Pacific associated with El Ni?no and La Ni?na events.J. Climate,13(16),2960–2972.
Chen,G.H.,and R.H.Huang,2006:The effect of warm pool thermal states on tropical cyclone in West Northwest Pacific. J.Trop.Meteor.,22(6),527–532.(in Chinese)
Chou,M.D.,and M.J.Suarez,1994:An efficient thermal infrared radiation parameterization for use in general circulation models.NASA Tech.Memo,84 pp.
Dare,R.A.,and J.L.McBride,2011:Sea surface temperature response to tropical cyclones.Mon.Wea.Rev.,139(12),3798–3808.
Emanuel,K.A.,2005:Divine Wind,the History and Science of Hurricanes.Oxford University Press,New York,296 pp.
Emanuel,K.A.,2013:Downscaling CMIP5climatemodels shows increased tropical cyclone activity over the 21st century.Proceedings of the National Academy of Sciences of United States of America,110(30),12219–12224.
Emanuel,K.A.,R.Sundararajan,and J.Williams,2008:Hurricanes and global warming:Results from downscaling IPCC AR4 simulations.Bull.Amer.Meteor.Soc.,89(3),347–367.
Fierro,A.O.,R.F.Rogers,F.D.Marks,and D.S.Nolan,2009: The impact of horizontal grid spacing on the microphysical and kinematic structures of strong tropical cyclones simulated with the WRF-ARW model.Mon.Wea.Rev.,137(11),3717–3743.
Fu,B.,T.Li,M.Peng,and F.Weng,2007:Analysis of tropical cyclone genesis in the western North Pacific for 2000 and 2001. Wea.Forecasting,22(4),763–780.
Gao,J.Y.,X.Z.Zhang,Z.H.Jiang,and L.J.You,2008:Anomalous western North Pacific monsoon trough and tropical cyclone activities.Acta Oceanologica Sinica,30(3),35–47.(in Chinese)
Gleixner,S.,N.Keenlyside,K.I.Hodges,W.L.Tseng,and L. Bengtsson,2014:An inter-hemispheric comparison of the tropical storm response to global warming.Climate Dyn., 42(7-8),2147–2157.
Gualdi,S.,E.Scoccimarro,and A.Navarra,2008:Changes in tropical cyclone activity due to global warming:Results from a high-resolution coupled general circulation model.J.Climate,21(20),5204–5228.
Haarsma,R.J.,J.F.B.Mitchell,and C.A.Senior,1993:Tropicaldisturbances in a GCM.Climate Dyn.,8(5),247–257.
Held,I.M.,and M.Zhao,2011:The response of tropical cyclone statistics to an increase in CO2with fixed sea surface temperatures.J.Climate,24(20),5353–5364.
Ho,C.H.,J.H.Kim,H.S.Kim,C.H.Sui,and D.Y.Gong,2005: Possible influence of the Antarctic Oscillation on tropical cyclone activity in the western North Pacific.J.Geophys.Res., 110(D19),D19104.
Holland,G.J.,1997:The maximum potential intensity of tropical cyclones.J.Atmos.Sci.,54(21),2519–2541.
Holland,G.,and C.L.Bruy`ere,2014:Recent intense hurricane response to global climate change.Climate Dyn.,42(3-4),617–627.
Hong,S.Y.,Y.Noh,and J.Dudhia,2006:A new vertical diffusion package with an explicit treatment of entrainment processes. Mon.Wea.Rev.,134(9),2318–2341.
Horn,M.,and Coauthors,2014:Tracking scheme dependence of simulated tropical cyclone response to idealized climate simulations.J.Climate,27(24),9197–9213.
Hoyos,C.D.,P.A.Agudelo,P.J.Webster,and J.A.Curry,2006: Deconvolution of the factors contributing to the increase in global hurricane intensity.Science,312(5770),94–97.
Huang,L.N.,J.Y.Gao,J.Sun,and J.L.Wu,2013:Abnormal climatic features of accumulated cyclone energy over the Northwest Pacific.Meteorological Monthly,39(8),995–1003.(in Chinese)
Janji′c,Z.I.,1994:The step-mountain eta coordinate model:Further developments of the convection,viscous sublayer,and turbulence closure schemes.Mon.Wea.Rev.,122(5),927–945.
Kim,H.S.,G.A.Vecchi,T.R.Knutson,W.G.Anderson,T.L. Delworth,A.Rosati,F.R.Zeng,and M.Zhao,2014:Tropical cyclone simulation and response to CO2doubling in the GFDL CM2.5 high-resolution coupled climate model.J.Climate,27(21),8034–8054.
Knutson,T.R.,and Coauthors,2010:Tropical cyclones and climate change.Nature Geoscience,3(3),157–163.
Lander,M.A.,1994:An exploratory analysis of the relationship between tropical storm formation in the western North Pacific and ENSO.Mon.Wea.Rev.,122(4),636–651.
Lau,K.H.,N.C.Lau,1990:Observed structure and propagation characteristics of tropical summertime synoptic scale disturbances.Mon.Wea.Rev.,118(9),1888–1913.
Lau,R.,and M.Y.Chan,1993:Equatorial stratospheric flow patterns and quasi-biennial/pentaennial oscillations.East Asia and Western Pacific Meteorology and Climate,2,31–38.
Lei,X.T.,and L.S.Chen,2001:An overview on the interaction between tropical cyclone and mid-latitude weather systems. J.Trop.Meteor.,17(4),452–461.(in Chinese)
Liebmann,B.,H.H.Hendon,and J.D.Glick,1994:The relationship between tropical cyclones of the western Pacific and Indian Oceans and the Madden-Julian oscillation.J.Meteor. Soc.Japan,72(3),401–412.
Lin,I.I.,and Coauthors,2013:An ocean coupling potential intensity index for tropical cyclones.Geophys.Res.Lett.,40(9), 1878–1882.
Mann,H.B.,D.R.Whitney,1947:On a test of whether one of two random variables is stochastically larger than the other.Ann. Math.Statis.,18(1),50–60.
Mlawer,E.J.,S.J.Taubman,P.D.Brown,M.J.Iacono,and S. A.Clough,1997:Radiative transfer for inhomogeneous atmospheres:RRTM,a validated correlated–k model for the longwave.J.Geophys.Res.,102,16 663–16 682.
Nakano,M.,Sawada,M.,Nasuno,T.,and Satoh,M.,2015:Intraseasonal variability and tropical cyclogenesis in the western North Pacific simulated by a global nonhydrostatic atmospheric model.Geophys.Res.Lett.,42,565–571.
Nakazawa,T.,2006:Madden-Julian oscillation activity and typhoon landfall on Japan in 2004.Sola,2,136–139.
Peduzzi,P.,B.Chatenoux,H.Dao,A.D.Bono,C.Herold,J. Kossin,F.Mouton,and O.Nordbeck,2012:Global trends in tropical cyclone risk.Nature Climate Change,2(4),289–294.
Ren,S.L.,Y.M.Liu,and G.X.Wu,2007:Interactions between typhoon and subtropical anticyclone over western pacific revealed by numerical experiments.Acta Meteorologica Sinica, 65(3),329–340.(in Chinese)
Rogers,E.,T.Black,B.Ferrier,Y.Lin,D.Parrish,and J.DiMego, 2001:Changes to the NCEP Meso Eta Analysis and Forecast System:Increase in resolution,new cloud microphysics, modified precipitation assimilation,modified 3DVAR analysis.NWS Technical Procedures Bulletin,No.488.[Available online at http://www.emc.ncep.noaa.gov/mmb/mmbpll/eta22 tpb/]
Santer,B.D.,and Coauthors,2006:Forced and unforced ocean temperature changes in Atlantic and Pacific tropical cyclogenesis regions.Proceedings of the National Academy of Sciences of United States of American,103(38),13 905–13 910.
Scoccimarro,E.,S.Gualdi,G.Villarini,M.Zhao,K.Walsh,and A.Navarra,2014:Intenseprecipitationeventsassociated with landfalling tropical cyclones in response to a warmer climate and increased CO2.J.Climate,27(12),4642–4654.
Shen,X.Y.,W.D.Zhu,J.Du,and W.Y.Pan,2010:The seasonal forecasting experiment of typhoon from July to September of 2006.Scientia Meteorologica Sinica,30(5),676–683.(in Chinese)
Skamarock,W.C.,and Coauthors,2008:A description of the Advanced Research WRF version 3.NCAR Tech.Note NCAR/ TN-475+STR,113 pp.
Sugi,M.,A.Noda,and N.Sato,2002:Influence of the global warming on tropical cyclone climatology:An experiment with the JMA global model.J.Meteor.Soc.Japan,80(2), 249–272.
Sugi,M.,H.Murakami,and J.Yoshimura,2012:On the mechanism of tropical cyclone frequency changes due to global warming.J.Meteor.Soc.Japan,90,397–408.
Sun,L.,2011:Analysis of features and causation for tropical cyclone activities over the Western North Pacific in 2010.Meteorological Monthly,37(8),929–935.(in Chinese)
Sun,Y.,Z.Zhong,L.Wei,and Y.J.Hu,2014a:Why are tropical cyclone tracks over the western North Pacific sensitive to the cumulus parameterization scheme in regional climate modeling?A case study for Megi(2010).Mon.Wea.Rev.,142(3), 1240–1249.
Sun,Y.,Z.Zhong,L.Yi,Y.Ha,and Y.M.Sun,2014b:The opposite effects of inner and outer sea surface temperature on tropical cyclone intensity.J.Geophys.Res.:Atmos.,119(5), 2193–2208.
Tory,K.J.,S.S.Chand,R.A.Dare,and J.L.McBride,2013:The development and assessment of a model-,grid-,and basinindependent tropical cyclone detection scheme.J.Climate, 26(15),5493–5507.
Wada,A.,and J.C.L.Chan,2008:Relationship between typhoon activity and upper ocean heat content.Geophys.Res.Lett., 35(17),L17603.
Walsh,K.J.E.,M.Fiorino,C.W.Landsea,and K.L.Mcinnes, 2007:Objectively determined resolution-dependent threshold criteria for the detection of tropical cyclones in climate models and reanalyses.J.Climate,20(10),2307–2314.
Wang,B.,and J.C.L.Chan,2002:How strong ENSO events affect tropical storm activity over the western North Pacific.J. Climate,15(13),1643–1658.
Wang,H.J.,and K.Fan,2007:Relationship between the Antarctic oscillation in the western North Pacifictyphoon frequency. Chinese Science Bulletin,52(4),561–565.
Wang,H.J.,J.Q.Sun,and K.Fan,2007:Relationships between the North Pacific Oscillation and the typhoon/hurricane frequencies.Science in China Series D:Earth Sciences,50(9), 1409–1416.
Wang,Y.Q.,T.Y.Song,J.Liang,and W.Y.Pan,2012:Simulation of seasonal tropical cyclone activity over the western North Pacific by using the WRF model.Transactions of Atmospheric Sciences,35(1),24–31.(in Chinese)
Webster,P.J.,G.J.Holland,J.A.Curry,and H.R.Chang,2005: Changes in tropical cyclone number,duration,and intensity in a warming environment.Science,309(5742),1844–1846.
Yoshimura,J.,and M.Sugi,2005:Tropical cyclone climatology in a high-resolution AGCM-Impacts of SST warming and CO2increase.SOLA,1,133–136.
Zhao,M.,and Coauthors,2013:Response of global tropical cyclone frequency to a doubling of CO2and a uniform SST warming—A multi-model intercomparison.U.S.CLIVAR Hurricane Workshop,Geophysical Fluid Dynamics Laboratory,Princeton,US,5-7 June 2013.
Zhou,B.T.,and X.Cui,2008:Hadley circulation signal in the tropical cyclone frequency over the western North Pacific.J. Geophys.Res.:Atmos.,113(D16),D16107.
Zhou,B.T.,and X.Cui,2014:Interdecadal change of the linkage between the North Atlantic Oscillation and the tropical cyclone frequency over the western North Pacific.Science China Earth Sciences,57(9),2148–2155.
Zhou,B.T.,X.Cui,and P.Zhao,2008:Relationship between the Asian-Pacificoscillationandthetropical cyclone frequency in the western North Pacific.Science in China Series D:Earth Sciences,51(3),380–385.
Song,P.,J.Zhu,Z.Zhong,L.L.Qi,and X.D.Wang,2016:Impact of atmospheric and oceanic conditions on the frequency and genesis location of tropical cyclones over the western North Pacific in 2004 and 2010.Adv.Atmos.Sci.,33(5), 599–613,
10.1007/s00376-015-5046-2.
7 February 2015;revised 20 September 2015;accepted 12 October 2015)
?Pan SONG
Email:songpan@mail.iap.ac.cn
 Advances in Atmospheric Sciences2016年5期
- Advances in Atmospheric Sciences的其它文章
- The 10th Antarctic Meteorological Observation,Modeling,and Forecasting Workshop
- The Impact of Boreal Autumn SST Anomalies over the South Pacific on Boreal Winter Precipitation over East Asia
- Developed and Developing World Contributions to Climate System Change Based on Carbon Dioxide,Methane and Nitrous Oxide Emissions
- Upper-Tropospheric Environment–Tropical Cyclone Interactions over the Western North Pacific:A Statistical Study
- Barotropic Processes Associated with the Development of the Mei-yu Precipitation System
- Mesoscale Numerical Simulation Study of Warm Fog Dissipation by Salt Particles Seeding