
Spatial variability of soil organic carbon in the forestlands of northeast China
2014-09-06 11:13:31LingLiuHaiyanWangWeiDaiXiangdongLeiXiaojuanYangXuLi
Journal of Forestry Research 2014年4期
Ling Liu · Haiyan Wang · Wei Dai · Xiangdong Lei Xiaojuan Yang · Xu Li
ORIGINAL PAPER
Spatial variability of soil organic carbon in the forestlands of northeast China
Ling Liu · Haiyan Wang · Wei Dai · Xiangdong Lei Xiaojuan Yang · Xu Li
Received: 2013-10-17; Accepted: 2014-03-06
? Northeast Forestry University and Springer-Verlag Berlin Heidelberg 2014
Soil organic carbon (SOC) is an effective indicator of soil fertility and productivity, and it varies spatially and temporally in relation to other soil properties. Spatial variability of SOC in the forestlands of northeast China was characterized using geostatistics. Soil samples at the depths of 0-20 cm, 20-40 cm and 40-60 cm were collected from sixty-three temporary plots to evaluate SOC concentration and density (SOCD) and other soil properties. We analyzed correlations between SOC and soil properties. Soil organic carbon concentrations were high. The total amount of C stored in soil (0-60 cm) was 16.23 kg·m-2with the highest SOCD of 7.98 kg·m-2in topsoil. Soil properties in most cases differed by horizon, suggesting different processes and effects in each horizon. Soil organic carbon had positive relationships with total N, P and K as well as readily available K, but did not show a significant positive correlation with available P. Spatial factors including elevation, slope and aspect affected SOC distribution. Soil organic carbon at 0-60 cm had strong spatial autocorrelation with nugget/sill ratio of 5.7%, and moderate structured dependence was found at 0-20 cm, which indicatedthe existence of a highly developed spatial structure. Spatial distributionsof SOC concentration and SOCD were estimated using regression-kriging, with higher prediction accuracy than ordinary kriging. The fractal dimension of SOC indicated the preferential pattern of SOC distribution, with the greatest spatial heterogeneity and strongest spatial dependence in the northeast-southwest direction.
northeast China, soil organic carbon, spatial variability, geostatistics
Introduction
Soil organic carbon (SOC) is a key determinant of soil quality (Stocking 2003) and represents one of the largest reservoirs of organic carbon in the global carbon cycle that can influence global warming (Lützow et al. 2006). In terrestrial ecosystems, forest soil carbon is the largest carbon sink. Soil organic carbon storage in global forest ecosystems was estimated as 402×1012-787×1012kg, or 25%-50% of the global soil carbon storage (Arrouays and Pelissier 1994). In northeast China, considerable organic carbon is stored in soils because of the dense forest vegetation and the thick accumulation of organic matter. Humic cambisols (Dark brown forest soils, in Chinese soil taxonomy) are typical soils mainly found in warm-temperate, mixed coniferous and broad-leaved forests and cold-temperate coniferous forests in northeast China. The soils were higher in natural fertility and supported dense vegetation. The soils of 40.2×10⁶ha are mainly located in the provinces of Heilongjiang, Jilin and Inner Mongolia (Zhao et al. 2004). These areas have been, therefore, among the most important for timber production and as a sink for organic matter on a global scale. Humic cambisols are also considered to store substantial amounts of organic matter, thereby serving as CO2sinks.
Geostatistics is an effective method for study of spatial distribution characteristics and their variability. Geostatistical methods quantify spatial distributions based on the spatial scale of the study area, distance between detecting points, and spatial patterns of modeling semivariograms. They have been widely ap-plied to evaluate spatial correlation in soils and to analyze the spatial variability of soil characteristics, such as soil physical and chemical properties (Vieira et al. 2007; Zheng et al. 2009) and biological properties (Fromm et al. 1993). Similar to other soil properties, SOC concentration and stock are highly variable over space (horizontally and vertically) and time (Wigginton et al. 2000). Soil organic carbon density can vary due to intrinsic or extrinsic factors. Intrinsic variability is caused by natural variation (Cambardella et al. 1994) and extrinsic variability results from external factors imposed on sites (Rao and Wagenet 1985). Spatial correlation of SOC can be explored by geostatistical analysis. On a national scale, Lacelle established the soil landscape and SOC description database of Canada, and calculated that SOC storage at depths of 0-30 cm was 72.8×10¹²kg (Lacelle 1998). Bernoux estimated 0-30 cm SOC pool of 36.4(±3.4)×1012kg in Brazil with soil and vegetation maps (Bernoux et al. 2002). Soil carbon reserves in different soil horizons were studied in New Zealand (Scott et al. 2002) and Congo (Schwartz and Namri 2002). In China, with the aid of GIS spatial analysis, soil organic carbon density (SOCD) and storage were estimated for the entire country and a high degree of spatial variability was documented. Many studies investigated the spatial variability of SOC on a regional scale. Xue et al. (2003) surveyed the Qaidam basin and calculated the SOCD to be 6.11 kg·m-2. Using current 1:1000000 digital soil maps and 736 typical soil profiles in northeast China, organic carbon storage in topsoil and its spatial distribution were estimated, and the average SOCD at 0-1 m depths was 16.13 kg·m-2(Sun et al. 2004). In the tropical area of south China, SOC storage and spatial distribution were studied by combining soil data with a digital elevation model (DEM). Similar studies were conducted in Jiangsu, Guangdong and Anhui provinces (Jiang et al. 2005; Gan et al. 2003; Cheng and Xie 2009). According to previous studies, the initial application of GIS was to soil and land resource survey and evaluation, with focus on assessment of farmland soil degradation and mapping. Forestland, as a high potential land use type for carbon storage, has not yet gained much attention. Moreover, forest SOC storage or SOCD estimation on regional scales has large uncertainties because it is mainly based on soil survey data and literature and lacks detailed and reliable measurement. Ordinary kriging (OK) has been widely used for spatial interpolation in plains, but its predictive capability is limited in regions of complex topography with highly developed spatial conditions such as mountains and hills. Some ancillary variables such as terrain attributes and vegetation indices extracted from DEMs and remote sensing images are available for digital soil maps. Combining maps of soil types with soil properties information from point observations can improve spatial prediction of soil properties compared with prediction from a soil map only (Goovaerts and Journel 1995).
The forest area in northeast China covers 3590×106ha, accounting for 24% of the total forest area of China, and the total forest stock volume amounts to 3.2×10⁹m3(Department of Forest Resources Management 2010). It is the largest forest area and the transition region between broad-leaved mixed forest to the south and pure coniferous forest to the north. Research in this region has mainly focused on the relationship between forest and climate change and on spatial heterogeneity of organic carbon storage in vegetation layer. However, the forest soil carbon pool has seldom been studied and most spatial interpolation used OK. Information on the spatial distribution of SOC is important for evaluating soil ecological functions and understanding soil carbon sequestration processes. The use of geostatistics in combination with DEM and regression-kriging (RK) can provide such information and help to define and improve the accuracy of representations of the distribution of soil parameters across landscapes. Increased accuracy in the delimitation of SOC content classes could assist in meaningful soil quality prediction and assessment of the impacts of soil redistribution. The objectives of the present study were to evaluate the carbon-related soil properties and terrain attributes, and to determine the spatial variability and SOC distributions in different soil horizons of Humic cambisols in forests of northeast China using geostatistical analysis. This information will provide a scientific basis for sustainable forest management and ecological environment improvement in this region.
Materials and methods
Study area
The study was carried out in Jincang Forest Farm, a typical forest area in the north temperate region of Wangqing County, Jilin Province, China (Fig. 1). The study area was in the eastern part of the low-middle hill region of the Changbai Mountain range (43°19′-43°23′ N, 130°26′-130°37′ E) at elevations of 562 to 950 m. The study area has a north temperate, monsoon climate with hot summers, cold winters, and abrupt changes of temperature. Average annual air temperature is 3.9°C. Average annual precipitation is 547 mm, concentrated from July to September (1970–2010). Soils are characterized by thick and black topsoil, loamy texture, an acidic pH range, large amount of humus and high natural fertility. The predominant soils in the area are Humic cambisols, together with meadow, peaty, swamp soil in some valleys that are developed from residual deposits of parent material such as granite, gneiss and basalt. Due to special landforms, abundant precipitation and changeable climate, rich vegetation resources are formed, including coniferous forest, broad-leaved forest, and mixed coniferous and broad-leaved forest. The major arbor species are Changbai larch (Larix olgensis), spruce (Picea koraiensis), Korean pine (Pinus koraiensis Sieb. et Zucc.), maple (Acer mono Maxim.), ash (Fraxinus mandshurica Rupr.), Asian white birch (Betula platyphylla Suk.) and linden (Tilia amurensis Rupr.).
Soil sampling and analysis
In August 2011, a total of 63 temporary circular sample plots (250 m2each plot) were set up in the study area. Within each plot, a soil profile was dug to describe profile characteristics and samples from the “bottom up” were taken with a ring sampler formeasurement of soil bulk density. The surface litter was removed prior to composite soil sampling. Soil samples at depths of 0-20, 20-40, and 40-60 cm were collected with 5 soil cores each well mixed into a composite soil sample, which was further divided into two sets of sub-samples. One set of the sub-samples was air dried and passed through a 2 mm sieve for analysis of soil texture, pH and available P and K; the remaining sub-sample was air-dried, homogenized and passed through a 0.25 mm sieve for analyses of SOC, total N, P and K (Li et al. 2011). Gravel and stones (fractions >2 mm) were sorted out and weighed. Soil texture was measured using the hydrometer method (Wilde et al. 1972). Soil pH was measured (1:2.5 = w/v) with a pH-meter (pH/ISE meter, model 710A; Orion). Soil organic carbon (SOC) concentration was determined by Walkley-Black wet oxidation method (Nelson and Sommers 1996; Bao 2000). Soil total N (TN) concentration was determined by Kjeldahl’s azotometer and total P (TP) by spectrophotometer, following wet digestion in concentrated H2SO4(Bremner 1996). Total K (TK) was determined by flame spectrophotometer following wet digestion in HF-HClO4(Jackson 1958; Knudsen et al. 1982). Available P (AP) was extracted with HCl-NH4F and estimated by spectrophotometer (Bray and Kurtz 1945). Readily available K (AK) was extracted with 1.0 M NH4OAc and quantified by flame spectrophotometer (Carson 1980). Soil bulk density was determined by oven-drying the soil samples collected with a ring sampler at 105°C for more than 8 h. In addition to soil sampling, the longitudes and latitudes of the sampling points were recorded with global positioning system (GPS). Forest type and survey, including environmental information, vegetation and management, for each sampling point were also recorded. A digital elevation model (DEM) of the study area was acquired at 5-m spatial resolution. The DEM and sampling points were geo-referenced to the Gauss Kruger coordinate system with Pulkovo 1942 GK Zone 22 (Fig. 1).
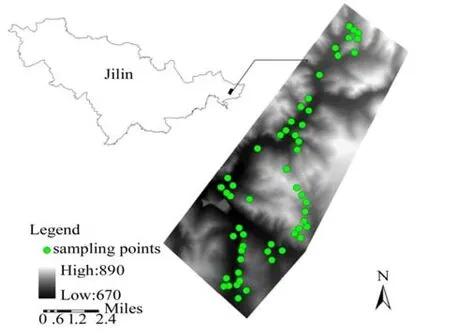
Fig. 1 Study area location and sampling design.
Calculation of soil organic carbon density (SOCD)
Soil organic carbon density (SOCD) is the organic carbon content per unit area. We calculated SOCD in the profile with k layers (Sk, kg·m-2), on a ground-area basis up to 60 cm depth as follows:
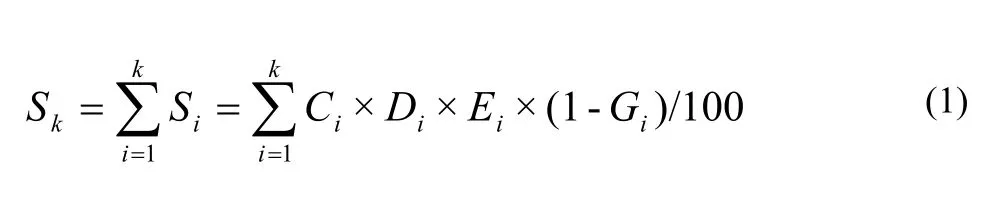
where, Ciis SOC concentration (g·kg-1), Diis soil bulk density (g·cm-3), Eiis soil thickness (cm) and Giis volumetric percentage of the fraction >2 mm (rock fragments). Siis soil organic carbon density in the ith horizon. In the present study, k=3.
Statistical analysis
Descriptive statistics
A descriptive statistical analysis was carried out to determine the mean, minimum, maximum, standard deviation (SD) and coefficient of variation (CV) of the original data variables. The correlations among SOC, other soil properties and topographic factors such as elevation and aspect were also tested using correlation analysis and multiple linear stepwise regression. The significance of the difference between means of each property variable for different soil horizons was analyzed using one-way ANOVA. The statistical software SPSS 18.0 was used for statistical analysis.
Geostatistical analysis
The terrain analysis was based on a 5-m resolution digital elevation model (DEM) generated from a 1: 5000 contour topographical map. The elevation, slope in degrees, and aspect expressed in positive degrees from 0 to 360 measured clockwise from north of the study site were generated from the DEM using ArcGIS 9.3 (Esri Company, RedLands, USA). Geostatistical analysis was performed using the software GS+ and ArcGIS 9.3. A sample semivariogram was calculated for each soil variable as follows (Goovaerts 1999; Wang and Shao 2013):
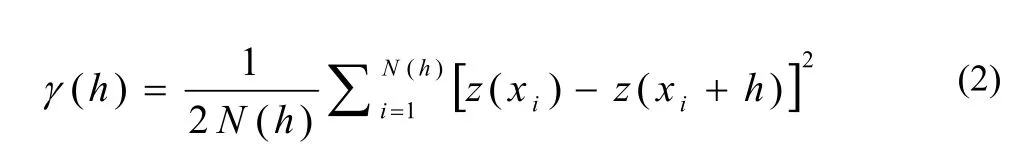
where, z(xi) and z(xi+h) are sample values at two points separated by the distance interval h, and N(h) is the total number of sample pairs for the lag interval h. For irregular sampling, it is rare for the distance between the sample pairs to be exactly equal to h. Therefore, h is often represented by a distance interval. γ(h) is the sample semivariance for the distance lag h, which reflects spatial relationship between neighbor sampling points.
The sample semivariogram was calculated and then fitted with a suitable theoretical model chosen from spherical, exponential, Gaussian, Mate′rn or Stein’s Mate′rn (Cressie 1993). The semivariogram models provide information about the spatial structure as well as the input parameters for kriging interpolation. Spatial dependence of soil variables can be evaluated by three important parameters: nugget (C0), partial sill (C1) and range in the semivariogram plot. The nugget is defined as the variability at a scale smaller than the sampling interval and/or sampling and analyticalerror; the partial sill reflects the amount of spatial structural variance; and the range expresses the distance at which the semivariogram stabilizes around a limiting value. The spatial variation distance increasing to a constant value (sill) is known as range of spatial dependence (Cambardella et al. 1994), and it is affected by the sampling scale. The distribution distances of sampling points closer to the range are spatially correlated and the distances greater than the range are independent. In addition, the fractal dimension could be used to determine the spatial variability of soil properties. When the fractal dimension values are small, soil properties have weak spatial dependence and simple distribution, or vice versa (Burrough 1981, 1983; Wang and Shao 2013).
Regression-kriging (RK) uses traditional regression methods that model the trend or drift in conjunction with geostatistical methods that model the random residuals from the regression (Hengl et al. 2004; Rivero et al. 2007). In RK the trend and residuals from the regression are fitted separately and then summed afterwards. It considers influence of geographic factors in the complex topography and simulates both spatial distribution trend and uncertainty. The trend item was separated by establishing regression equations between the auxiliary variable and target variable, and interpolation was applied to the residual with ordinary kriging (OK). The predicted value of the target variable was then obtained by spatial overlay between the trend item of regression prediction and OK value of the residual.
Accuracy evaluation
The prediction accuracy could be tested by comparing observed values with predicted values for soil nutrients, soil organic carbon (SOC) and soil organic carbon density (SOCD) from sample plots. Mean prediction error (M) and root mean square error (R) of prediction were adopted as the evaluation indices, and R was used to analyze the relative accuracy improvement value by comparing regression-kriging (RK) with ordinary kriging (OK) (Lal 2000; Kucharik et al. 2001).
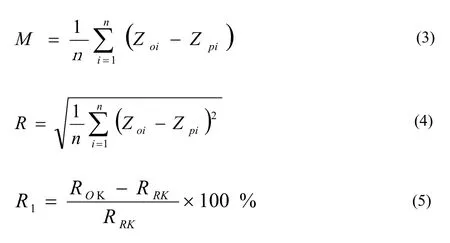
where, n is a sample point of test set, Zoiand Zpiare, respectively, observed values and predicted values, ROKis root mean square error of prediction using OK, and RRKis the prediction using RK. The prediction accuracy of RK is higher than OK when the R1value is positive, and the larger the value, the greater the accuracy. In this study, 10 soil sampling points were randomly extracted from 63 points to test the prediction accuracy of the remaining 53 points.
Results
Descriptive statistics of soil organic carbon (SOC) and other soil properties
Table 1 shows the descriptive statistics of soil organic carbon (SOC) concentration and soil organic carbon density (SOCD). The mean of soil characteristics indicated the central tendency, and standard deviation (SD), coefficient of variation (CV) and skewness were used as the estimates of variability from each site. The average SOC concentration was 42.32 g·kg-1in the topsoil, and it decreased with depth until reaching 14.35 g·kg-1at 40-60 cm. The CV was low for SOC concentration in 0-20 cm (CV<10%), indicating low variability of SOC in topsoil. However, at soil depths of 20-40cm and 40-60 cm, SOC concentration showed high CVs (67% and 80%). Accordingly, the SOCD was 7.98 kg·m-2for the topsoil, and it declined gradually with increasing depth to 5.23 kg·m-2at 20-40 cm and 3.06 kg·m-2at 40-60 cm. Although there was a decreasing trend with increasing depth, the subsoil also contained a considerable amount of C, and the total amount of organic C stored to the depth of 60 cm was 16.23 kg·m-2, with a CV of 52%.
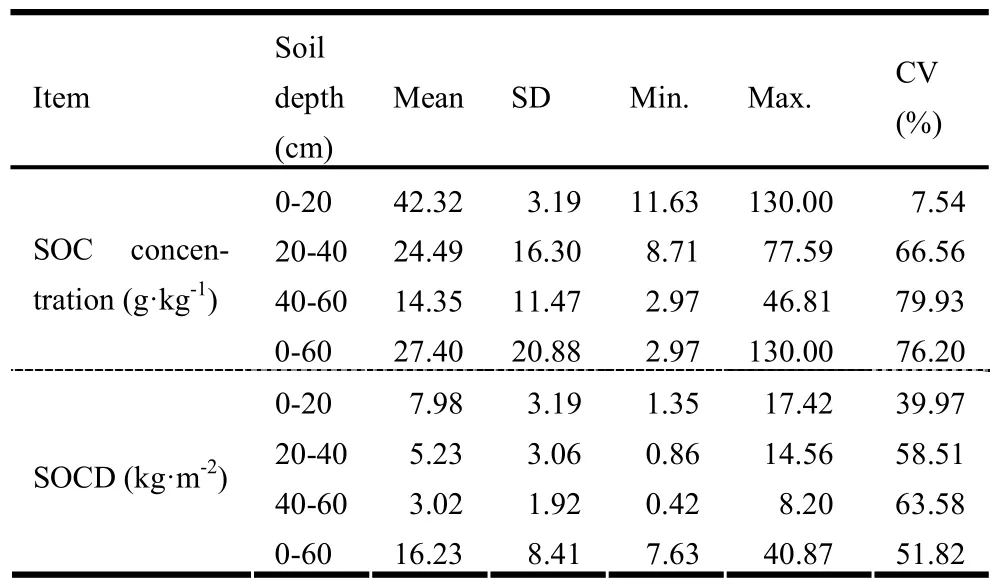
Table 1: Descriptive statistics of soil organic carbon (n=63)
The descriptive statistics for other soil properties in the study area are shown in Table 2. Soil pH had a mean of 5.41-5.57 with similar SDs of 0.26-0.30 in three soil layers. The CVs of total N (TN), total P (TP) and available P (AP) all exceeded 50%, which indicated considerable spatial variation in these properties within the study area. The concentrations of TN, TP and AP had means of 1.07 g·kg-1, 0.38 g·kg-1and 25.49 mg·kg-1, respectively, at 0-60 cm depth for all sampling points, and means and SDs varied by soil horizon. Mean values for all of these properties peaked at 0-20 cm and declined with increasing depth.
Soil properties other than AP varied significantly by soil horizon. Concentrations of total N (TN), total P (TP), total K (TK) and readily available K (AK) declined with increasing depth in the following rank order: 0-20 cm > 20-40 cm > 40-60 cm withsignificant differences between each horizon (p<0.05); this trend was, however, not followed by available P (AP). In general, the typical distribution of soil chemical properties suggested higher variation between horizons and better nutrient status in the topsoil.
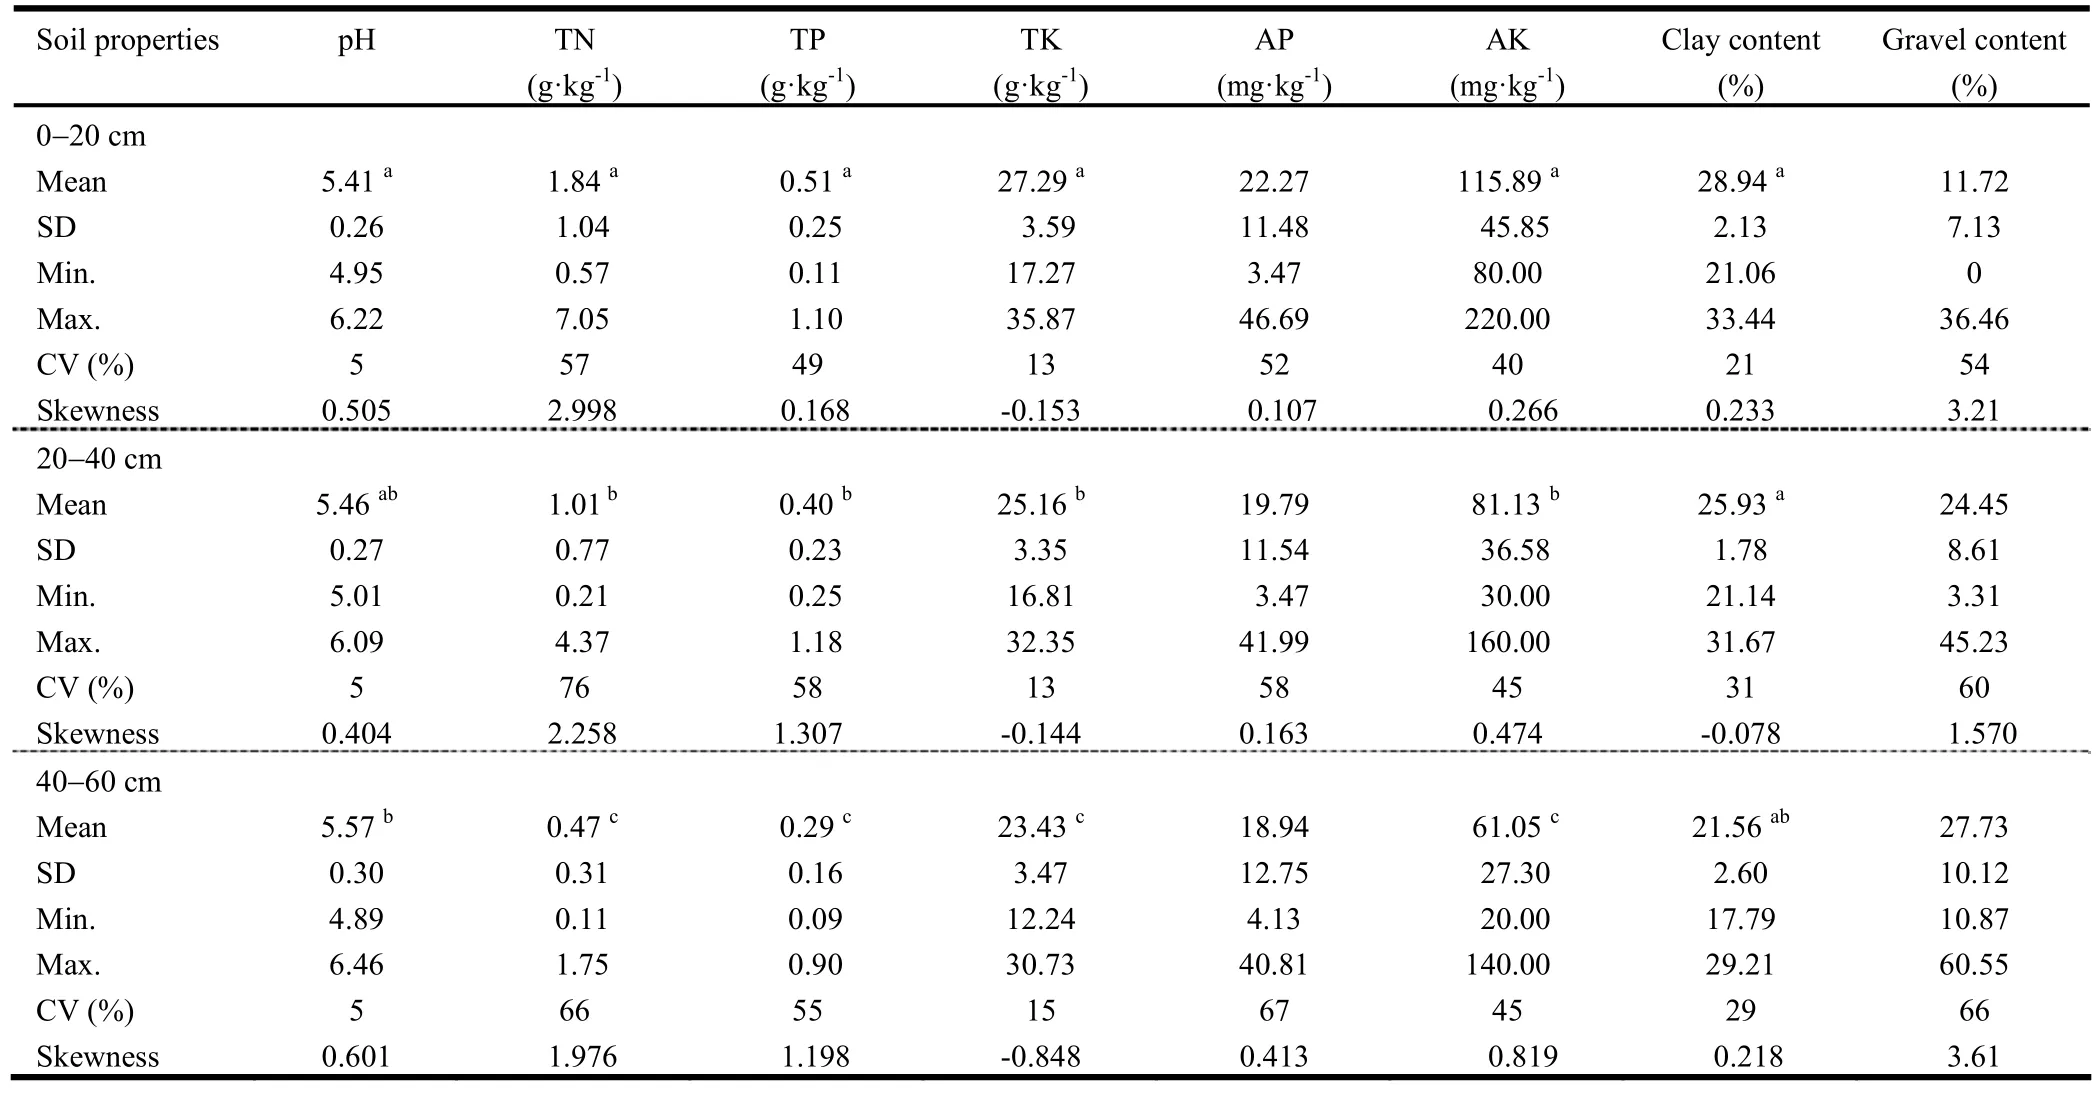
Table 2: Descriptive statistics of soil properties in different soil horizons
Correlation analysis The correlation matrix of selected soil properties was shown in Fig. 2. Soil organic carbon (SOC) concentration was significantly and positively correlated with total N (TN), total P (TP), total K (TK) and readily available K (AK), but not with available P (AP). Soil TN was positively related with SOC concentration (r = 0.795, p<0.01), but its correlation with AP was weak. Correlations of AP with TN and TP were weak, while correlation of AP with AK became stronger with increasing depth. In each horizon, there were strong positive correlations between soil properties. In addition, TN, TP, TK and AK had significant positive correlations with each other. The difference in SOC concentration was caused by natural organic matter distribution. To a certain extent, soil nitrogen levels affect SOC concentration through soil microorganisms. Different concentrations of P and K can be caused by different effects of organic matter, different pH values, and mineral composition.
To the depth of 60 cm, the significant correlations between soil organic carbon (SOC) concentration and topographic attributes indicated that SOC concentration tended to be greater at higher elevation. The correlation between SOC concentration and elevation was very significant and positive (r =0.532, p<0.01). A very significant positive correlation was also found between soil organic carbon density (SOCD) and elevation (r = 0.565, p<0.01), but there was a very significant negative correlation between SOCD and slope (r = -0.451, p<0.01).

Fig. 2: Correlation matrix between soil properties.??significant at probability level of 0.01;?significant at probability level of 0.05. TN is total N; TP is total P; TK is total K; AP is available P; AK is readily available K; SOC is soil organic carbon.
There were very significant correlations between SOC concentration and SOCD (Table 3), and between these variables and cosine of slope aspect (p<0.01). SOC had, however, weak correlation with sine of slope aspect (which showed the degree of facing north), indicating that the more the aspect faced north the larger the SOC concentration. It tended to be greater on shady slopes at higher elevations. SOC in the topsoil had the same correlations with elevation and cosine of aspect, but this was not the case at depths of 20-40 cm and 40-60 cm.
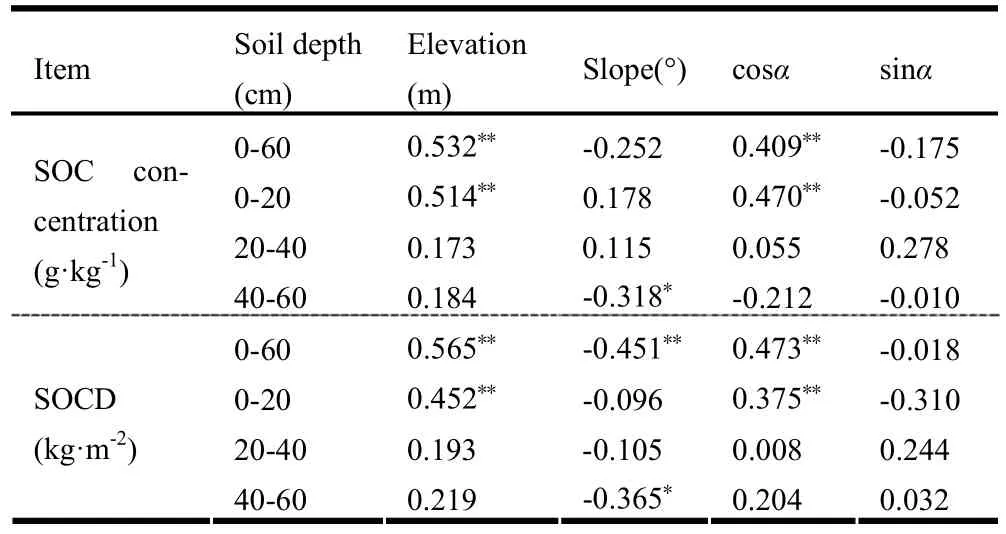
Table 3: Correlations between SOC concentration as well as SOCD and spatial factors (n=63)
level of 0.05. SOC is soil organic carbon; SOCD is soil organic carbon density. cosα=cosine of aspect; sinα=sine of aspect. Aspect represents the degree of facing north.
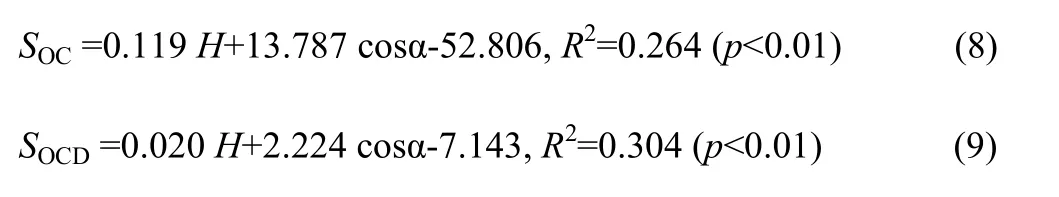
Multiple linear stepwise regression of soil organic carbon (SOC) concentration and soil organic carbon density (SOCD) on topographic factors yielded the following equations. Elevation and cosine of aspect (cosα) emerged as the optimal predictors of SOC and SOCD.
Equations for 0-60 cm were:
where, SOCis soil organic carbon concentration, SOCDis soil organic carbon density, and H is elevation. The coefficients of determination for fitting SOC and SOCD were 0.344 and 0.385, respectively, p<0.01 in both cases indicating good fits for both equations (6) and (7).
Equations for 0-20 cm were:
Geostatistical analysis
Spatial variability of soil organic carbon (SOC) and semivariogram models
Geostatistical parameters of soil organic carbon (SOC) are shown in Table 4. After interpolating the residual with ordinary kriging (OK), the log-transformed data of SOC concentration at 0-20 cm depth was fitted well by a Gaussian model having a nugget/sill ratio (NSR) of 5.7%, a range of 0.294 km, and very strong spatial autocorrelation. The large spatial range indicated a strongly structured regional pattern of SOC. The Gaussian model was best fitted to sample semivariograms of SOC at 0-60 cm depth with moderate structured dependence (NSR=47.8%). As for soil organic carbon density (SOCD), the NSRat 0-20 cm was 15.4%, suggesting a considerable development of the spatial structure and high spatial correlativity. SOC at 0-60 cm depth was fitted by an exponential model and the spatial structure was moderate to well developed (NSR=49.3%).
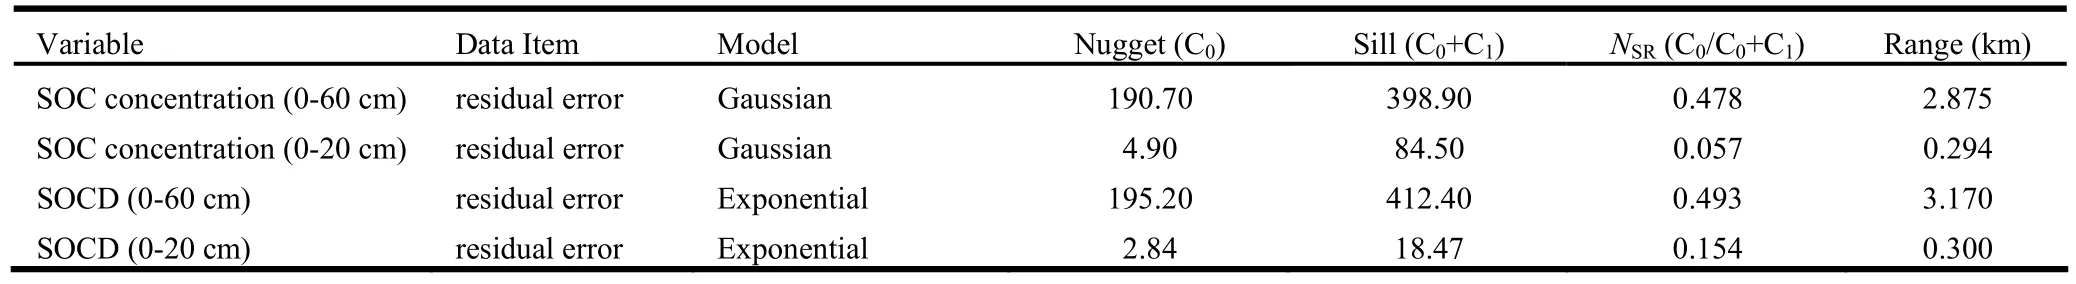
Table 4: Semivariogram models for SOC concentration and SOCD’s residual error
Accuracy evaluation for different prediction methods
The regression-kriging (RK) method considers environmental factors and separates residual error to increase prediction accuracy. Fifty-three sampling points were randomly extracted from 63 points to conduct ordinary kriging (OK) interpolation for regression prediction residual error of soil organic carbon (SOC). Fig. 3 shows the spatial distribution of SOC concentration and soil organic carbon density (SOCD) interpolated using RK. At 0-60 cm, the spatial distribution of SOC mainly concentrated on northerly aspects. Taking the digital elevation model (DEM) in comparison, SOC concentration and SOCD were relatively rich at high elevations. Soil organic carbon at 0-20 cm showed that spatial distribution of SOC concentration had a number of high-value centers but was mainly concentrated in high elevation regions. The results suggest that slopes of northerly aspect served as sinks of organic matter and became the largest sources of SOC.
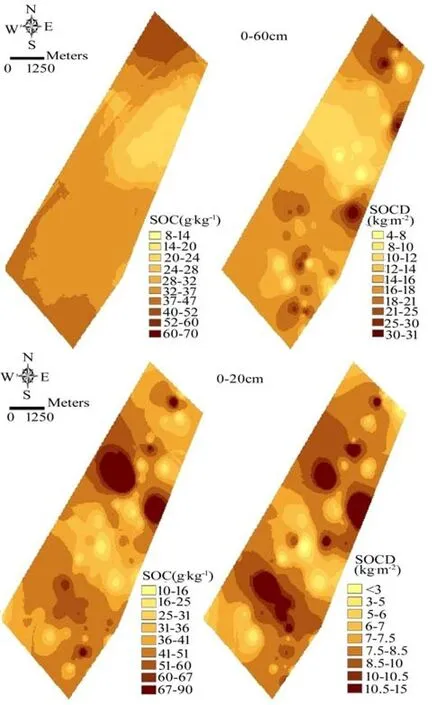
Fig. 3: Spatial distributions of soil organic carbon (SOC) and soil organic carbon density (SOCD) interpolated by regression-kriging.
The remaining 10 sampling points were used to test the accuracy of the two prediction methods. Regression-kriging (RK) prediction was much more detailed on spatial variation and more closely approximated spatial distribution condition of the actual value (Table 5). Positive R1values indicated higher accuracy using the RK method.
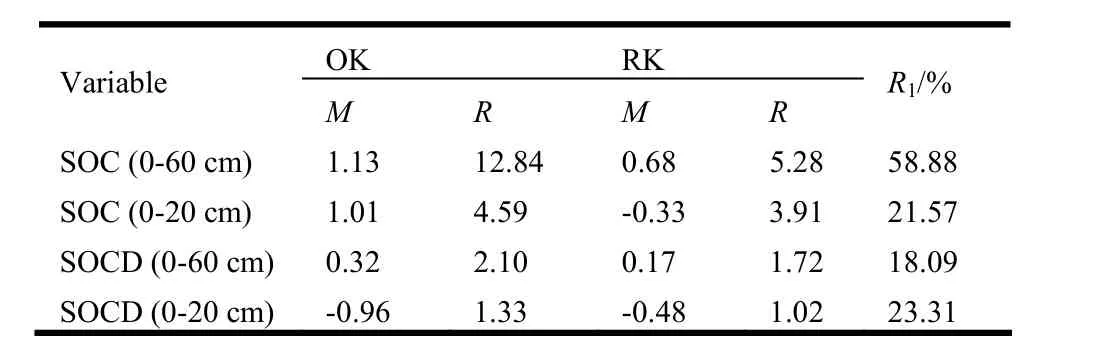
Table 5: Comparison of accuracy using different prediction methods
The fractal dimension values of soil organic carbon (SOC) in different soil horizons are shown in Table 6. The greatest isotropic fractal dimension was found at 0-20 cm, indicating the most complex spatial pattern of SOC and the highest degree of uniformity. The fractal dimension at 20-40 cm was the smallest, indicating a relatively simple spatial pattern and stronger spatial dependence than other soil horizons.
In terms of slope aspect, the greatest fractal dimension of soil organic carbon (SOC) at 0-20 cm was found in the northwest-southeast (NW-SE) direction, and the smallest in the northeast-southwest (NE-SW) direction, which had the greatest spatial heterogeneity and the strongest spatial dependence, and was also the direction of the longest transect through the study site (Fig. 3). As for the coefficient of determination, NE-SW direction showed a preferential pattern of SOC distribution. At 20-40 cm, the NE-SW direction had the smallest fractal dimension with the strongest spatial dependence; east-west (E-W) direction was the preferential pattern distribution for SOC. The fractal dimension of SOC at 40-60 cm depth was greatest in the NW-SE direction; and smallest in the NE-SW direction, which had greatest spatial heterogeneity. The coefficient of determination showed that NE-SW had the preferential pattern of SOC distribution.

Table 6: Fractal dimension of SOC in different soil layers
Discussion
The average soil organic carbon (SOC) concentration was 27.40 g·kg-1and soil organic carbon density (SOCD) to the depth of 60 cm was 16.23 kg·m-2, which is in agreement with previous studies that estimated SOCD in a range of 16.55-27.02 kg·m-2in this region (Zu et al. 2011; Sun et al. 2004). Because of differences inthe locations of study areas and management activities, SOC varies spatially. In addition, research methods are not standardized, and estimates are not free of uncertainty due to sampling depth and quantity.
Soil organic carbon (SOC) and soil organic carbon density (SOCD) were higher in topsoil and declined with increasing depth. Distribution of SOC is related to vegetation types and succession, and human disturbance, so organic carbon in topsoil is greatly influenced by these factors. In the forest ecosystem, soil organic matter is mainly from litter and root decomposition. That surface soil can obtain more forest litter leads to the enrichment of SOC. The SOCD is associated with soil bulk density and stoniness (diameters >2 mm). Several studies found that SOCD increased with increasing soil depth (Yang and Wang 2005). However, some studies in forests suggest that the changes in SOC stocks are due to the development of vegetation restoration and succession. For instance, vegetation restoration can increase non-active organic carbon concentration in surface soil (Su et al. 2005). Succession of restored vegetation can also increase SOC and nitrogen concentration (Christian et al. 2001).
Correlation analysis quantifies the tendency of variables such as SOC, soil properties, and terrain attributes to vary in similar ways. Soil properties have indirect influence on SOC by affecting litter decomposition, microbial activity and organic carbon mineralization rates (Fayez and Esmael 2006). Soil total N (TN) concentration can promote the accumulation of biomass in understory vegetation and litter generation, thereby facilitating SOC accumulation. As a result, SOC, elevation, aspect, TN and total K (TK) were all interrelated, suggesting that the geographical characteristics and soil properties were correlated with SOC. Soil organic carbon (SOC) in all soil horizons had a positive relationship with TN, total P (TP), TK and readily available K (AK), in agreement with previous observations (Mládková et al. 2005). A significant positive correlation between SOC and elevation indicated that SOC concentration tended to be greater at higher elevation. This is inconsistent with studies reporting greater SOC concentrations on the valley floor because of the deposition of water, solutes and sediments down along the slope (Mueller and Pierce 2003; Sumfleth and Duttmann 2008; Wang et al. 2001). Our findings agree with those of Tsuia et al. (2004) and Zhang et al. (2012) who documented increasing SOC with increasing elevation.
Spatial patterns of soil organic carbon (SOC) suggest that organic matter dynamics in the field were affected by topography. The spatial variability of SOC and soil organic carbon density (SOCD) differed by soil horizon. The spatial distribution of surface SOC demonstrated more developed spatial structure than the other two horizons, implying that topsoil might be more sensitive to environmental disturbances, whereas spatial variability of SOC at depths of 20-40 cm and 40-60 cm was greatly affected by random factors and suggested considerably weaker spatial correlativity. By combining the kriging map with the digital elevation model (DEM), the SOC concentration was related to elevation, indicating greater SOC in the higher terrain area. Similar findings with regard to the importance of elevation to SOC were reported by Geng et al (2011). However, some research yielded the opposite results (Cheng et al. 2009; Zhang et al. 2012). This study showed that predictive capability of ordinary kriging (OK) was sometimes limited in regions of complex topography affected by intense cultivation and land use change. Recently, more studies have demonstrated regression-kriging (RK) can provide secondary information to improve the prediction accuracy (Lark and Webster 2006; Liu et al. 2010). It is possible that other useful ancillary information, such as soil and forest types, can be added in using RK to produce more accurate representations of the spatial distribution of SOC (Hengl et al. 2004). The RK method with elevation as the predictor gave more details in space than the OK method in predicting spatial distributions of SOC variables. In the present study, it was difficult to use the spatial information reliably to establish correlations with the SOC variables by using RK analysis because study area spanned a small range of elevations.
Conclusions
Soil organic carbon (SOC) concentration and soil organic carbon density (SOCD) decreased significantly with increasing soil depth. Mean SOC concentration was 27.40 g·kg-1and SOCD in the whole soil profile (0-60 cm) was 16.23 kg·m-2. Correlations between SOC and soil chemical properties varied by soil depth. Soil organic carbon concentration showed significant positive relationships with total N (TN), total P (TP), total K (TK) and readily available K (AK), but not with available P (AP). A significant positive correlation was found between SOC and elevation, as well as between SOC and slope aspect. Soil organic carbon tended to be higher on sunny slopes. In the surface horizon, spatial variation produced by random factors was larger and had very small spatial correlation. With increasing depth, SOC was less sensitive to external influence with smaller spatial variation. The effect of terrain factors on SOC was very complex. Resulting maps showed the spatial distribution of SOC in the study area based on the data of spatial dependency, and they can be used to delineate the areas with different impact of elevation.
Arrouays H, Pelissier P. 1994. Modeling carbon storage profiles in temperate forest humic loamy soils of France. Soil Science, 157(3): 185-192.
Bao SD. 2000. Soil and agricultural chemistry analysis. Beijing: China Agriculture Press, p. 495. (In Chinese)
Bernoux M, Conceicao SCM, Volkoff B. 2002. Brazil’s soil carbon stock. Soil Science, 66: 888-896.
Bray RH, Kurtz LT. 1945. Determination of total, organic and available forms of P in soils. Soil Science, 59: 39-45.
Bremner JM. 1996. Nitrogen—total. In: Sparks DL (ed), Methods of Soil Analysis. Madison, WI: SSSA-ASA, pp. 1085-1121.
Burrough P. 1981. Fractal dimensions of landscapes and other environmental data. Nature, 294: 240-242.
Burrough P. 1983. Multiscale sources of spatial variation in soil. I. The application of fractal concepts to nested levels of soil variation. European Journal of Soil Science, 34: 577-597.
Cambardella CA, Moorman TB, Novak JM, Parkin TB, Karlen DL, Turco RF, Konopka AE. 1994. Field-scale variability of soil properties in central Iowa soils. Soil Science Society of America Journal, 58: 1501-1511.
Carson PL. 1980. Recommended potassium test. In: Dahnke WC (ed) Recommended chemical soil test procedures for the North Central region. North Dakota Agricultural Experimental Station Bulletin 499: 17-18.
Cheng XF, Xie Y. 2009. Spatial distribution of soil organic carbon density in Anhui Province based on GIS. Sientia Geographica Sinica, 29(4): 540-544. (In Chinese)
Christian PG, Michael GR, Robert MH. 2001. Tree species and soil textural controls on carbon and nitrogen mineralization rates. Soil Science Society of America Journal, 65: 1272-1279.
Cressie NAC. 1993. Statistics for Spatial Data. New York: John Wiley & Sons p. 900.
Department of Forest Resources Management. 2010. The 7th national forest resources inventory and the status of forest resources. Forest Resource Management, 2: 1-8. (In Chinese)
Fayez R, Esmael A. 2006. Soil microbial activity and litter turnover in native grazed and ungrazed rangelands in a semiarid ecosystem. Biology and Fertility of Soils, 43: 76-82.
Fromm H, Winter K, Filer J. 1993. The influence of soil type and cultivation system on the spatial distributions of the soil fauna and microorganisms and their interactions. Geoderma, 60: 109-118.
Gan HH, Wu SH, Fan XD. 2003. Reserves and spatial distribution characteristics of soil organic carbon in Guangdong Province. Chinese Journal of Applied Ecology, 14(9): 1499-1502. (In Chinese)
Geng GP, Gao P, Lü SQ, Zhang J. 2011. Spatial distribution of soil organic matter and total nitrogen in Matiyu small watershed in hilly area of middle southern Shandong Province. Science of Soil and Water Conservation, 9(6): 99-105. (In Chinese)
Goovaerts P, Journel AG. 1995. Integrating soil map information in modeling the spatial variation of continuous soil properties. Soil Science, 46(3): 396-414.
Goovaerts P. 1999 Geostatistics in soil science: state-of-the-art and perspectives. Geoderma, 89: 1-45.
Hengl T, Heuvelink GBM, Stein A. 2004. A generic framework for spatial prediction of soil variables based on regression-kriging. Geoderma, 120: 75-93.
Jackson ML. 1958. Soil chemical analysis. NJ, USA:Prentice Hall, Inc. Englewood Cliffs, p. 498.
Jackson RB, Caldwell MM. 1993. The scale of nutrient heterogeneity around individual plants and its quantification with geostatistics. Ecology, 74(2): 612-614.
Jiang XS, Pan JJ, Li XL. 2005. Organic carbon density and storage in topsoil of Jiangsu and spatial analysis. Chinese Journal of Soil Science, 36(8): 501-503. (In Chinese)
Knudsen D, Peterson GA, Pratt P. 1982. Lithium, sodium, and potassium. In: Page AL (eds), Methods of Soil Analysis, Vol. 2. Madison, Wis:American Society of Agronomy, Soil Science Society of America, pp. 225-246.
Kucharik CJ, Brye KR, Norman JM, Foley JA, Gower ST, Bundy LG. 2001. Measurements and modeling of carbon and nitrogen cycling in agroecosystems of southern Wisconsin: potential for SOC sequestration during the next 50 years. Ecosystems, 4: 237-258.
Lacelle B. 1998. Canada’s soil organic carbon database. In: Lal R, Kimble JM, Follett RF, Stewart BA (eds), Advances in Soil Science: soil processes and the carbon cycle. CRC Press, pp. 93-101.
Lal R. 2000. Carbon sequestration in dry lands. Annual of Arid Zone, 39(1): 1-10.
Lark RM, Webster R. 2006. Geostatistical mapping of geomorphic variables in the presence of trend. Earth Surf Process Landforms, 31: 862-874.
Li LJ, Zeng DH, Yu ZY, Fan ZP, Yang D, Liu YX. 2011. Impact of litter quality and soil nutrient availability on leaf decomposition rate in a semi-arid grassland of Northeast China. Journal of Arid Environments, 75:787-792.
Liu DW, Wang ZM, Zhang B. 2006. Spatial distribution of soil organic carbon and analysis of related factors in croplands of the black soil region, Northeast China. Agricultural Ecosystem Environment, 113: 73-81. (In Chinese)
Liu SL, Li Y, Wu JS. 2010. Spatial variability of soil microbial biomass carbon, nitrogen and phosphorus in a hilly red soil landscape in subtropical China. Soil Science and Plant Nutrition, 56:693-704. (In Chinese)
Lützow Mv, K?gel-Knabner I, Ekschmitt K, Matzner E, Guggenberger G, Marschner B, Flessa H. 2006. Stabilization of organic matter in temperate soils: mechanisms and their relevance under different soil conditions-a review. European Journal of Soil Science, 57(4):426-445.
Mládková L, Bor?vka L, Drábek O. 2005. Soil properties and toxic aluminium forms in acid forest soils as influenced by the type of vegetation cover. Soil Science and Plant Nutrition, 51:741-744.
Mueller TG, Pierce FJ. 2003. Soil carbon maps: enhancing spatial estimates with simple terrain attributes at multiple scales. Soil Science Society of America Journal, 67: 258-267.
Nelson DW, Sommers LE. 1996. Total carbon, organic carbon, and organic matter. In: Sparks DL, Page AL, etc. (eds), Methods of Soil Analysis, Part 3. Chemical methods. Wisconsin, WI, USA: Soil Science Society of America Book Series, Vol. 5. pp. 961-1010.
Rao PSC, Wagenet RJ. 1985. Spatial variability of pesticides in field soils: methods for data analysis and consequences. Weed Science, 33(suppl. 2):18-24.
Rivero RG, Grunwald S, Bruland GL. 2007. Incorporation of spectral data into multivariate geostatistical models to map soil phosphorous variability in a Florida wetland. Geoderma, 140: 428-433.
Schwartz D, Namri M. 2002. Mapping the total organic carbon in the soils of the Congo. Global and Planetary Change, 33: 77-93.
Scott NA, Tare KR, Giltrap DJ. 2002. Monitoring land-use effects on soil carbon in New Zealand: quantifying baseline soil carbon stocks. Environmental Pollution, 116: 167-186.
Stocking MA. 2003. Tropical soils and food security: the next 50 years. Science, 302(5649): 1356-1359.
Su J, Zhao SW, Ma JD. 2005. Influence of man-made vegetation on carbon pool in southern Ningxia Region in Loess Plateau. Research of Soil and Water Conservation, 12(3): 50-52. (In Chinese)
Sumfleth K, Duttmann R. 2008. Prediction of soil property distribution in paddy soil landscapes using terrain data and satellite information as indicators. Ecological Indicators, 8: 485-501.
Sun WX, Shi XZ, Yu DS. 2004. Estimation of soil organic carbon density and storage of northeast China. Acta Pedologica Sinica, 41(2):298-300. (In Chinese)
Tsuia C, Chena Z, Hsieh C. 2004. Relationships between soil properties and slope position in a lowland rain forest of southern Taiwan. Gerderma, 123: 131-142.
Vieira VA, Mello CR, Lima JM. 2007. Spatial variability of soil physical attributes in small watershed. Ciência e Agrotecnologia, 31(5): 1477-1485. (In Portuguese).
Wang J, Fu BJ, Qiu Y. 2001. Soil nutrients in relation to land use and landscape position in the semi-arid small catchment on the loess plateau in China. Journal of Arid Environments, 48(4): 537-550
Wang YQ, Shao MA. 2013. Spatial variability of soil physical properties in a region of the Loess Plateau of PR China subject to wind and water erosion. Land Degradation and Development, 24(3): 296-304.
Wigginton JD, Lockaby BG, Trettin CC, Nelson EA, Kolka RK, Wisniewski J. 2000. Soil organic matter formation and sequestration across a forested floodplain chronosequence. In: Proceedings of a workshop held at Clemson University, 12-14 April 1999, pp. 141-155.
Wilde SA, Voigt GK, Iyer JC. 1972. Soil and plant analysis for tree culture. New Delhi, India: Oxford and IBH Publishing Co., p. 209.
Xue L, Ma HZ, Cao GC, Sha ZJ, Ou LY. 2003. The application of geographic information systems on the calculation of storage of organic carbon in soils. Ecology & Environment, 12(4):419-422. (In Chinese)
Yang JY, Wang CK. 2005. Soil carbon storage and flux of temperate forest ecosystems in northeastern China. Acta Ecologica Sinica, 25(11): 2875-2882. (In Chinese)
Zhang W, Wang KL, Chen HS, He XY, Zhang JG. 2012. Ancillary information improves kriging on soil organic carbon data for a typical karst peak cluster depression landscape. Journal of the Science of Food and Agriculture, 92(5): 1094-1102.
Zhao J, Zhang JM, Meng K. 2004. Spatial heterogeneity of soil nutrients in black soil, China-a case study at Hailun County. Bulletin of Soil and Water Conservation, 24(6): 53-57. (In Chinese)
Zhao X, Wang Q, Kakubari Y. 2009. Stand-scale spatial patterns of soil microbial biomass in natural cold-temperate beech forests along an elevation gradient. Soil Biology and Biochemistry, 41: 1466-1474.
Zheng Z, Zhang FR., Ma FY. 2009. Spatiotemporal changes in soil salinity in a drip irrigated field. Geoderma, 149: 243-248.
Zu YG, Li R, Wang WJ. 2011. Soil organic and inorganic carbon contents in relation to soil physicochemical properties in northeastern China. Acta Ecologica Sinica, 31(18): 5207-5216. (In Chinese)
DOI 10.1007/s11676-014-0533-3
Project funding: The study was jointly supported by Natural Science Foundation of China (No. 31270697), the Fundamental Research Funds for the Central Universities (TD2011-2), State Forestry Administrative public service sector project “Key management techniques for the health of typical forest types in China” (20100400201) and National ‘973’project “Soil carbon stock and its temporal and spatial distribution pattern in natural forests” (2011CB403201).
The online version is available at http:// www.springerlink.com
Ling Liu, Haiyan Wang (), Wei Dai, Xiaojuan Yang, Xu Li
College of Forestry, Beijing Forestry University, Beijing 100083, P. R. China. E-mail: haiyanwang72@aliyun.com
Xiangdong Lei
Institute of Forest Resource Information Techniques, Chinese Academy of Forestry, Beijing 100091, P. R. China.
Corresponding editor: Zhu Hong
 Journal of Forestry Research2014年4期
- Journal of Forestry Research的其它文章
- Growth and yield of two grain crops on sites former covered with eucalypt plantations in Koga Watershed, northwestern Ethiopia
- Full length cDNA cloning and expression analysis of annexinA2 gene from deer antler tissue
- Bamboo resources of Sikkim Himalaya: diversity, distribution and utilization
- Implications of crude oil pollution on natural regeneration of plant species in an oil-producing community in the Niger Delta Region of Nigeria
- Enhancement of seed germination in Macaranga peltata for use in tropical forest restoration
- Bio-amelioration of alkali soils through agroforestry systems in central Indo-Gangetic plains of India