
Exp2 polymorphisms associated with variation for fiber quality properties in cotton(Gossypium spp.)
2014-03-13 05:50:26DohuHeZhongpingLeibHongyiXingBoshnTngJunxingZhoBixiLu
The Crop Journal 2014年5期
Dohu He*,Zhongping Leib,Hongyi XingBoshn TngJunxing ZhoBixi Lu
aCollege of Agronomy,Northwest A&F University,Yangling,712100,China
bCollege of Life Sciences,Northwest A&F University,Yangling,712100,China
1.Introduction
Cotton,which provides the most popular natural textile fiber,is one of the most important crops in the world.The genus Gossypium comprises about 45 diploid and 5 allotetraploid species.Four species are cultivated; Gossypium hirsutum and Gossypium barbadense account for 90% and 5% of the world cotton production,respectively,and Gossypium arboreum and Gossypium herbaceum are grown in a few areas.Fiber length and fiber strength are the primary quality properties that influence textile processing [1].After fiber yield,improving fiber quality is a goal of breeders.To develop cultivars with further improved fiber quality,it is critical to characterize and dissect the molecular genetic bases of fiber quality.
Hitherto,advances in molecular genetics have increased genetic knowledge in fiber quality,such as by QTL mapping and gene expression profile analysis.Unfortunately,low resolution,lack of knowledge of phenotypic functions of candidate genes in natural populations,and other factors have prevented these advances from facilitating genetic design and selection for breeding.
Association mapping (AM) can be used to relate natural variation in candidate genes to agronomic phenotypes.AM provides a high-resolution alternative for the characterization of candidate genes and has the potential to allow exploring and evaluating a wide range of alleles [2].Recently,AM has been successfully applied to plant populations[3–5].In an attempt to validate the function of the Dwarf8 locus,a large AM population of maize inbred lines was genotyped for Dwarf8 polymorphism and phenotyped for flowering time,and an association of a Dwarf8 polymorphism with flowering time was detected [6,7].Later studies associated the candidate gene su1 with sweetness[8]; bt2,sh1,and sh2 with kernel composition; and ae1 and sh2 with starch pasting properties[9].DREB1A showed associations with vegetation index,heading date,biomass,and spikelet number.Both ERA1-A and ERA1-B were associated with harvest index,flag leaf width,and leaf senescence.Gene 1-FEH-A was associated with grain yield,and 1-FEH-B was associated with thousand kernel weight and test weight [10].In sunflower,HaCOI1-1 and HaCOI1-2 were found to be strongly associated with Sclerotinia stalk rot resistance[11].In waxy rice,Xu et al.[12]associated starch synthase IIa(SSIIa or SSII-3)and SSI with starch properties.As these examples illustrate,AM is useful for dissecting candidate genes underlying complex traits.In cotton,some AM studies have been reported[5,13–16],but these were all genome wide association studies (GWAS) rather than candidate gene association studies.
Expansin refers to a family of closely related non-enzymatic proteins found in the plant cell wall,with important roles in plant cell growth,emergence of root hairs,meristem function,and other developmental processes in which cell wall loosening occurs.The elongation of cotton fiber is associated with the expression of many genes,among which Expansin is one of the most highly expressed[17–19].That Expansin may control fiber development is of interest in strategies aimed at improving fiber quality,because final fiber length and strength largely determine the quality of commercial cotton thread.Given that Expansins play a pivotal role in cell wall extension,they are attractive targets for strategies designed to alter cell shape and size,and this consideration led us to characterize some of the genes that encode Expansins in Gossypium.
Six cDNAs encoding α-expansins were identified in a previous study of cotton fiber development [18].RT-PCR expression analysis showed that the mRNA from GhExp2 was specific to cotton fibers,where it was the second most abundant transcript (at a low level) during the elongation phase of fiber development [18].Intron and exon sizes of GhExp2 were all different from those of the other five genes.In GhExp2,a Cys →Arg substitution at the first Cys [a residue conserved in most α-expansins previously described[20]]was found,and the Phe [which commonly is contained in a His-Phe-Asp (HFD) domain] residue had been replaced by Lys.But,the amino acid sequence derived from GhExp2 was most closely related(with 97%sequence identity)to that from GhExp1,which may play an important role in cell wall extension during fiber development [18].It is still unclear whether the nucleotide diversity of GhExp2 is associated with phenotypic variation.
After sequence alignment of six genes (GhExp1–GhExp6)and AY189969 (expansin mRNA),gene-specific primers were designed to amplify only Exp2.The objectives of this study were to investigate the nucleotide and haplotype diversity and the extent and pattern of linkage disequilibrium (LD) in the Exp2 gene,and then to validate the association between Exp2 and fiber quality by AM,and identify the most favorable allele of Exp2,with the aim of providing knowledge for future fiber quality breeding efforts in cotton.
2.Materials and methods
2.1.Plant material
A collection of 92 cultivated cotton accessions (presented in Table 1) consisting of 7 G.arboreum,74 G.hirsutum,and 11 G.barbadense accessions collected worldwide was used.This population of accessions covered multiple ecological regions and periods of cultivar development,revealing a wide range of phenotypic variation among fiber quality traits.Seeds of all accessions were obtained from the germplasm storage of Chinese National Center for Cotton Improvement(Institute of Cotton Research of CAAS,Anyang,China).
2.2.Field trials and trait evaluation
The germplasm collection was sown in two growing seasons(2008 and 2009) at Sanyuan (34° 36′ N; 108° 56′ E; elevation 416.25 m.a.s.l.) Experimental Station of Northwest A&FUniversity,and at Yangling (2009),Shaanxi Province,China.Each accession was represented by three rows of 30 plants planted with 40 cm between plants and 80 cm between rows in a randomized complete block design with three replications.At maturity (September 15),fibers from each plot were collected,mixed,and measured using HVI900 instrument(USTER HVISPECTRUM,SPINLAB,United States) in the Test Center of Cotton Fiber Quality affiliated with the Agriculture Ministry of China.The test temperature was 20 °C and the relative humidity was 65%.All accessions were evaluated in replicated field experiments for five fiber quality (FQ) properties: fiber strength (STR,in cN/tex),fiber length (upper half mean length,UHML,in mm),uniformity(UI,in%),elongation(ELO,in%),and micronaire (MIC).

Table 1-Name,species,and pedigree of 92 accessions studied.
Table 1(continued)
2.3.DNA extraction and SSR genotyping
From each accession group,4–5 young fully expanded leaves were collected and stored at-80 °C.Genomic DNAs were isolated from the frozen leaf tissues by the CTAB procedure[21].The DNAs were checked by 0.9% agarose electrophoresis and DNA concentrations were determined by spectrophotometric estimation.
To provide an estimate of population structure,accessions were genotyped using a core set of 132 SSR primers (an average of ~5 SSR markers per chromosome,covering evenly the 26 chromosomes of cotton).The SSR primers include 84 BNL,26 CIR,and 22 JESPR primers,which were obtained from the Cotton Marker Database (http://www.cottonmarker.org/).PCR amplification and visualization of amplification products were performed according to He et al.[22].
2.4.Primer design and genotyping of Exp2
The alpha-expansin gene(GhExp1–GhExp6)sequences(AF512539–AF512544,and AY189969 mRNA as a supplementary sequence)were downloaded from NCBI (http://www.ncbi.nlm.nih.gov/).Based on these sequences,Exp2-specific PCR primers were designed to amplify different and overlapping regions of Exp2.Part of the Exp2 gene,from 1 to 868 bp (of AF512540)spanning part of the 5′UTR,exon I,intron I,exon II,intron II,and part of exon III,was amplified with the primer combinations F1/R1(F1:5′-ATCCAATAAAGGTTAGGTCAGCCA-3′; R1: 5′-GAAAGAGAGG CTTTGGCCGTTA-3′);part of the Exp2 gene,from 719 to 1501 bp(of AF512540) spanning part of exon III and part of the 3′UTR,was amplified with the F2/R2 (F1: 5′-TCAACATGGTGTTGAT AACCG-3′;R1:5′-TTGCCTCACAACAAAGTTACCA-3′).The overlap length of the two amplicons was 149 bp.Two fragments of this candidate gene were amplified by PCR in two separate PCR reactions,of which the volumes were 15 μL containing 30 ng DNA,150 nmol L-1of each primer,1× Pfu polymerase reaction buffer,1.5 or 2.0 mmol L-1MgCl2,0.2 mmol L-1of each dNTP,and 0.5 U Pfu polymerase.After initial denaturation at 95 °C for 6 min,34 cycles were conducted at 95 °C for 1 min,primer-specific annealing temperatures at 58 °C for 1 min,72 °C for 1 min,and a final extension step at 72 °C for 10 min.PCR products were then separated by polyacrylamide gel electrophoresis.The band of interest was cut out from the gel with a razor blade.The gel slice was soaked and crushed briefly in ddH2O,and the water was used as template for a second PCR.The second PCR products were directly sequenced by the Sunny Sequencing Service (Sunny,Shanghai,China).Amplicons of each accession were sequenced with both forward and reverse PCR primers.

Fig.1-The structure of the Exp2 gene sequence as characterized in the present study.Pink lines represent boundaries between coding region and non-coding regions:three exons,two introns,5′UTR,3′UTR;blue bars represent polymorphic sites.
2.5.Statistical analysis
Sequence reads were checked and assembled into contigs.The sequences of AF512540 and AY189969 were used as the reference sequences.The sequence reads were aligned using ClustalW2.1 [23] and manually corrected using BioEdit [24].Sequence polymorphisms were deduced from sequence comparisons in gene-wise sequence alignments.Reference sequences were excluded from all subsequent analyses,and InDels were treated as single polymorphic sites.Nucleotide diversity(π),haplotype identification,haplotype diversity(Hd)and LD were determined with software DnaSP v5.10 [25].Analyses of π and Hd were performed separately for each species as well as for full populations.
Population structure was inferred from SSR data with Structure version 2.2 [26].We used prior population information,predefining accessions as belonging to specific populations.Accessions were defined as 1) G.arboreum accessions,2)G.barbadense accessions,and 3)G.hirsutum accessions.The optimum number of populations (K) was selected after five independent runs with a burn-in of 500,000 iterations followed by 500,000 iterations testing for K = 2 to K = 10.Structure produced a Q matrix that lists the estimated membership coefficients for each accession in each cluster.The estimated Q matrices were used in the subsequent AM,by logistic regression,performed in TASSEL software [27].SNPs or InDels at site frequencies of 0.05 or greater among the 92 accessions were evaluated using TASSEL.Mean phenotypic values were applied for the association analysis.One thousand permutations of the data were run to account for multiple testing,and a significant association was assigned if the P-value of the most significant polymorphism in a region was seen in <5%of the permutations.
3.Results
3.1.DNA sequence polymorphisms of Exp2
We analyzed DNA polymorphisms in the Exp2 genomic region in 92 Gossypium accessions.Based on AF512540 and AY189969 from NCBI,the genome sequence of Exp2 was obtained using two gene-specific primer pairs.Sequencing results showed the contigs of the genomic region,named Exp2-A (868 bp amplified by primers F1/R1) and Exp2-B (783 bp amplified by primers F2/R2).The overlap length was 149 bp.Sequence assembly resulted in a 1501 bp fragment,which was analyzed.With AF512540 and AY189969 used as outgroups,94 sequences were aligned using ClustalW and distal nucleotides were excluded(to reduce error),so that the ultimate length of the 92 sequences was 1265 bp (including aligned gaps),on which our further analysis mainly focused.
The resulting sequences consisted of 3 exons,2 introns,5′UTR,and 3′UTR (Fig.1),with discrepancies occurring except in the 5′UTR.The lengths of these regions were 9,160,85,313,76,301,and 321 bp,respectively (Table 2).Thirty-three polymorphic loci (26 SNPs and 7 InDels,which were all parsimony-informative sites,none singleton variable sites)were found in this 1265 bp sequence among the 92 cotton samples sequenced.SNP/InDel frequency (per bp) in the non-coding region is 3.87%,which is markedly higher than that(1.81%)in exons,and the average SNP/InDel per-nucleotide rate was 2.61%.In the three exons,SNPs were not distributed equally.The SNP frequencies were:for exon III,2.66%;for exon II,0.96%; and for exon I,1.88%.InDels were found in the non-coding region,so that the polymorphism frequency(3.87%)was markedly higher than that in the coding region(1.81%).
Further analysis of these polymorphic loci indicated that the SNP types,length of InDels,and frequency were diverse.Of the six possible types of SNP,most were A/G transitions or A/C transversions.Among these SNPs,A/G transitions were scattered over all regions,but the other types of SNPs occurred only in exons and 3′UTRs(Table 3).Four types of InDels,which were classified based on length (1 bp InDels being the most frequent),were scattered over introns and 3′UTRs.The number of InDel polymorphisms was less than that of SNPs.Four(A42T,A69C,A120G,and GC1043/1044CG) of the 26 SNPs found in the sequences were considered to be rare alleles because they appeared in these samples no more than four times each.Thus,there were few rare SNPs in the sequences.
Two estimates of nucleotide variation were calculated:1) nucleotide diversity (π,pi),representing average pairwise sequence differences between two random sequences in a sample,and 2) the mutation parameter θ (theta),which is based on the observed number of polymorphic sites in a sample.The sequence polymorphism distribution is shown in Fig.2.The trendline of π is coincident with that of θ.The DNA sequence polymorphism in the region covering the 1250 bp was higher than that in other regions.The π value increased from 0 (175–384 bp region) to 0.0154 (850 bp),rapidly decreased to 0 (950 bp),and then increased to 0.0196 (1188 bp).The θ value decreased from 0.00589 (75 bp) to 0 (175–384 bp),and then increased (with two slow decreases and one rapid decrease) to 0.00982 (850 bp) and 0.01178 (1062 bp).Fig.2 shows that the nucleotide diversity in the 3′ region was higher than that in the 5′ region.Sequences from the 3′UTR(22 bp/SNP) yielded 4.7 times as many SNPs/InDels as that from exon II(104 bp/SNP).The frequency of InDels was lowest in 5′end sequences and greatest in 3′UTRs.
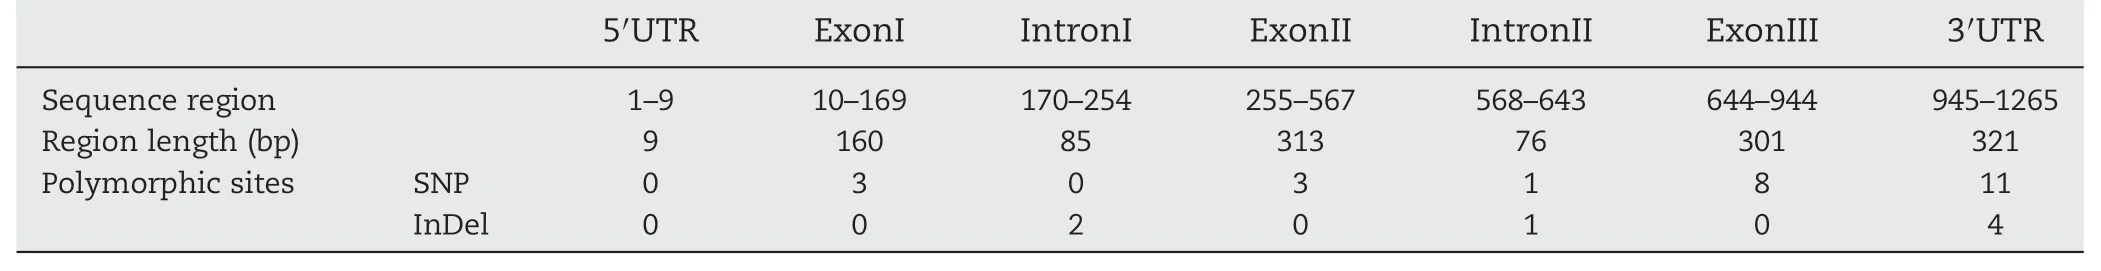
Table 2-Polymorphisms in Exp2 sequences in sampled accessions.
Of the 14 SNPs in the coding regions,nine were silent substitutions and the other five resulted in amino acid replacement (Table 4).The first site was at 42 bp,where the amino acid Phe encoded by TTT was replaced by Leu encoded by TTA.The second site was at 522 bp,where Arg encoded by the common allele CGG was replaced by Gln encoded by CAG.The third site was at 761 bp,where Lys encoded by AAG was replaced by Asn encoded by AAT.The fourth site was at 769 bp,where Arg encoded by AGA was replaced by Lys encoded by AAA.The fifth site was at 885–886 bp,where Ala encoded by GCC was replaced by Thr encoded by AAC.
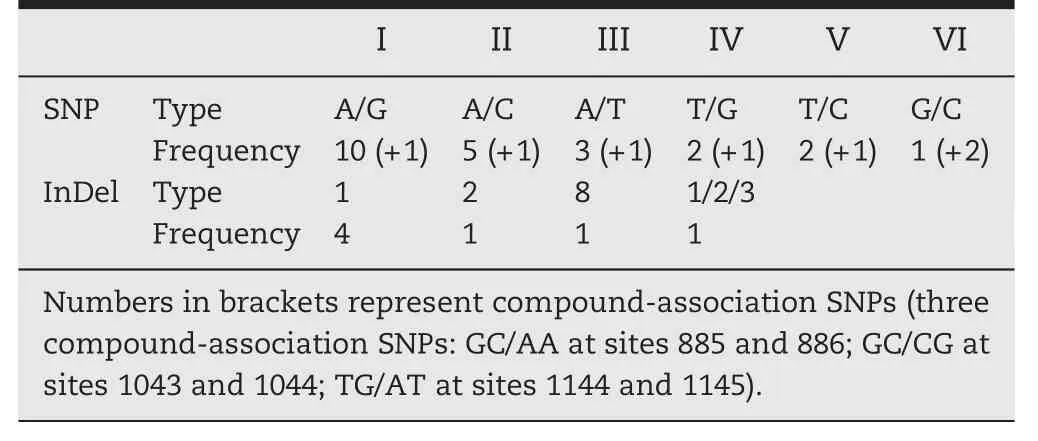
Table 3-Types of polymorphisms in Exp2 sequences.
3.2.Linkage disequilibrium(LD)between loci at the Exp2 gene
LD analysis revealed several high LD values at P ≤0.01,with two groups of sites showing complete linkage disequilibrium(cLD).The first cLD group consisted of 8 sites (769,836,851,885,1038,1095,1144,and 1169) and the second cLD group 3 sites(761,875,and 1034).Additionally,two SNP pairs(484 and 710; 522,599 and 632) showed complete linkage disequilibrium,respectively(Fig.3).These cLD groups were referred to as LD blocks [29].The mean of r2(the squared allele–frequency correlations,which represented LD)was 0.48.According to the formula r2= 1 / (a + 4 × b × distance) + e[30],the LD decay curve was estimated using a non-linear least-squares estimate of Γ fitted with the nls function in R,which indicated that LD did not decay over 748 bp.Using a different criterion[31],16.81%of SNP/InDel pairs had significant(P ≤0.001)LD by the commonly accepted criterion of r2≥0.1; 14.11% of SSR marker pairs were in LD at r2≥0.2.This estimate was based on 33 SNP/InDel loci that generated a total of 528 pairwise comparisons.
Decay scatterplots of the LD values based on the syntenic r2value for 92 accessions are shown in Fig.4.Fig.4 shows the effect of inter-marker distance on LD,namely that LD decays steadily and relatively rapidly with physical distance(bp).The extent of LD in the Exp2 sequence was 748 bp,with critical value r2= 0.351 (determined according to the approach of Breseghello and Sorrells[3]),and 14.39% (76/528) of LD pairs were detected with r2<0.351.
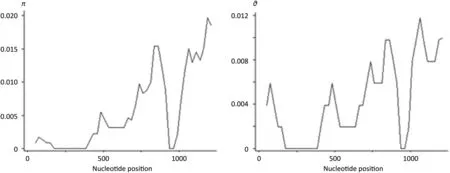
Fig.2-The sequence diversity of Exp2(π,θ).The mean pairwise nucleotide diversity π was 0.00603,and Watterson's estimator θ was 0.00456.Tajima's[28] test for selection indicated that these accessions did not show significant deviation from the neutral expectation(D = 0.98212 and P >0.10).The diversity indices of non-coding regions(π = 0.00905 and θ = 0.00580)were higher than those of coding regions(π = 0.00420 and θ = 0.00382).But separate Tajima's D tests for each region revealed no significant departure from the neutral expectation(1.55043 for non-coding regions and 0.27147 for coding regions,P >0.10).In the coding sequences,the expected synonymous sites were 181 and non-synonymous sites were 593,and the π(0.00920)and θ(0.00975)of the synonymous sites were fivefold greater than those of the non-synonymous sites(π = 0.00264 and θ = 0.00199).
3.3.Haplotype identification of candidate gene Exp2
The combination of these 26 SNPs and 7 InDels resulted in a total of twelve haplotype groups across 92 accessions(Table 5).The level of haplotype diversity (Hd) was 0.844,with the frequency of each haplotype shown in Table 5.Among all the haplotypes,two major haplotypes (Hap_8 and Hap_9) were detected in 48 accessions,with the cumulative frequency of the first two haplotypes being 0.52.Haplotype Hap_9 was found in more than one fourth of the accessions screened,and haplotype Hap_8 was observed in one fourth of the accessions,while six haplotype groups contained no more than four accessions.The frequency of the other haplotypes(Hap_6,Hap_7,Hap_10,and Hap_11) was moderate,between 5.4%and 8.7%(Table 5).
Table 4-Information for polymorphisms in Exp2 sequences.
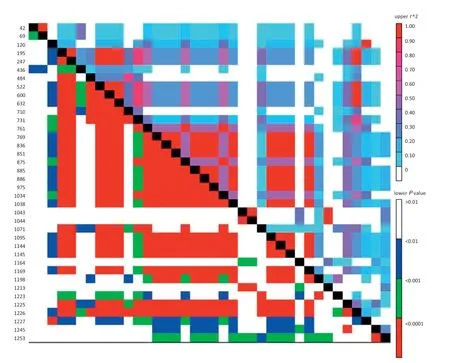
Fig.3-Linkage disequilibrium between pairs of Exp2 sequence polymorphic sites.
The frequencies of GhExp2 haplotypes differed markedly across species (Table 6).Haplotype diversity ranged from 0.667 in G.arboreum (7 accessions) to 0.767 in G.hirsutum(74 accessions).The difference was particularly evident for the haplotypes (Hap_1,Hap_2,and Hap_3) present only in G.arboreum.The most frequently identified haplotypes were confined to G.hirsutum.Six haplotypes were present in <10%of accessions sampled,six were unique to one species,and six were exclusive to accessions from single species,indicating that every allele was unique to one species.Thus,interspecific crossing would create novel alleles.G.hirsutum accessions were largely separated into six haplotypes.In comparison with G.arboreum and G.barbadense,more haplotypes and higher diversity were observed in G.hirsutum(Table 5).
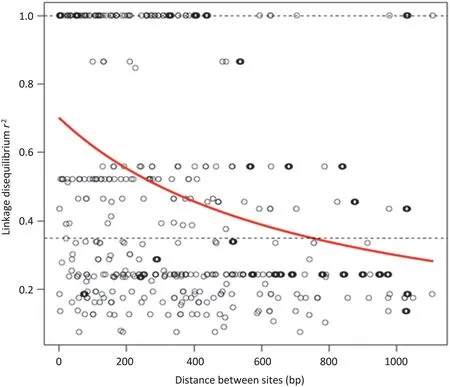
Fig.4-Scatterplot of the LD(r2)of marker pairs versus intermarker distance in nucleotide distance(base pairs),and the LD decay curve.Composite plot of LD in the Exp2 genomic region as a function of distance(nucleotide distance,bp).r2 measures of LD are shown as functions of distance for all loci examined.LD values between all pairs of SNP/InDels are plotted.The logarithmic trend line is included in the figure.Of 528 pairwise comparisons,174 pairs were significant at P <0.001(207 pairs were significant at P <0.01).
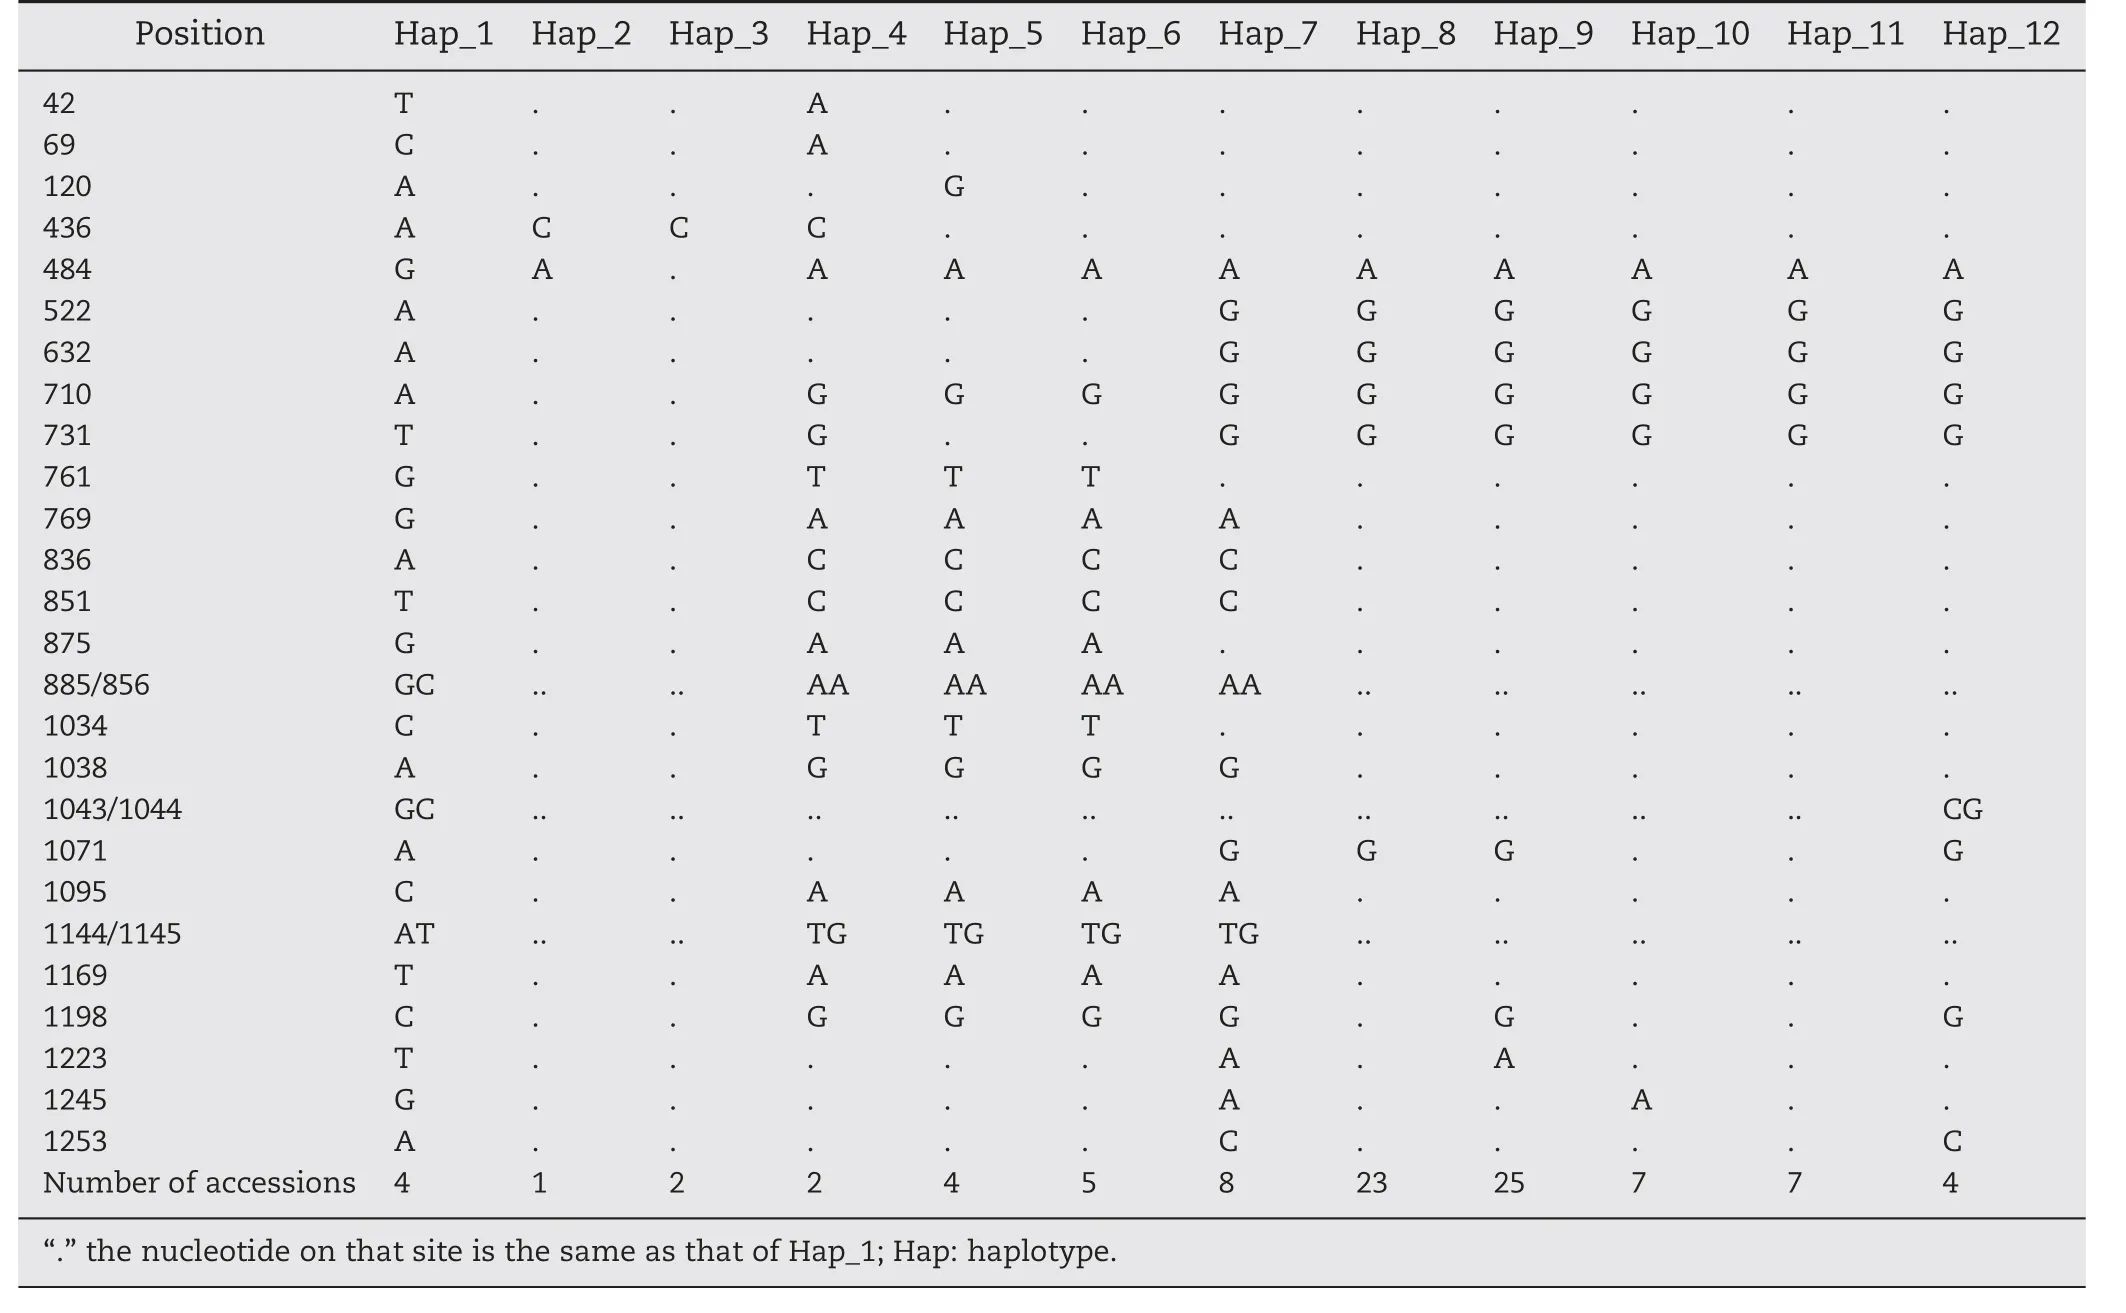
Table 5-Haplotypes in Exp2 sequences of accessions.
3.4.Population structure
The prerequisite for all subsequent analyses in this study was the characterization of population structure using the software package Structure 2.3.1 [26].Based on 132 unlinked SSR markers,providing even coverage of the cotton genome,we ran Structure for K (number of fixed subpopulations or clusters) ranging from 2 to 10.The model with K = 7 clusters showed higher log likelihood (ln Pr(X|K) =-9805.2) than for other integer values of K,and the likelihoods for K = 8 and 9 decreased markedly,compared with that for K = 7.Because the likelihood peaked at K = 7 in the range of two to ten subpopulations,the most likely number of putative ancestral populations (K) was identified as seven.The number of these 92 cotton accessions assigned to each of the seven inferred clusters ranged from 2 to 39.Kullback–Leibler distances of pairwise subpopulations were significant (P <0.001) and ranged from 0.1251 to 1.4933 (average 0.6856),suggesting a genuine difference among these clusters and supporting the existence of genetic structure(Fig.5,Table 7).The G.arboreum accessions (except for CRZM) and G.barbadense accessions(except for Giza 80)lines were very distinct from all other lines from G.hirsutum because of the genetic isolation that occurred during their development,and were accordingly(6 G.arboreum and 10 G.barbadense accessions)assigned to A(Arboreum)and B (Barbadense) groups,respectively.Giza80 (introduced from Egypt) and CRZM (with fiber length approximating that of tetraploid cotton)were assigned to a seventh M(Mixed)group.Four clusters from G.hirsutum are referred to hereafter as H1(8 accessions),H2 (19 accessions),H3 (39 accessions) and H4(8 accessions) subpopulations.These results are consistent with their genomic origins and evolutionary histories.These population subgroup estimates (Q matrix) were then used in TASSEL software to test for associations between Exp2 polymorphisms and fiber quality traits.
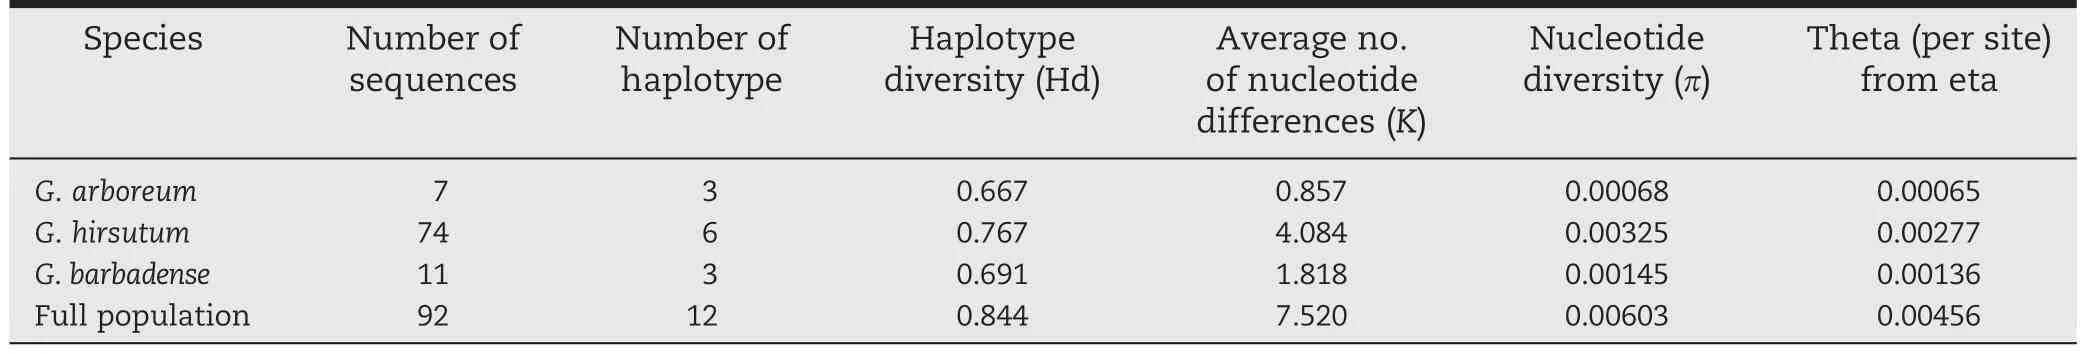
Table 6-Haplotype diversity of the Exp2 sequence.
Fig.5-Bar plot of the genetic compositions of individual lines,based on 132 SSR unlinked multilocus data using the admixture model in Structure 2.3.1.(a)Lines are grouped by pre-defined POP ID;A,B,and H denote G.arboreum,G.barbadense,and G.hirsutum,respectively;(b)lines are sorted by Q.Each column(92 columns in total)represents the genotype of an accession and is partitioned into K colored segments,with the length of a segment representing the estimated genetic fraction in every line of each of the 7 inferred subpopulations.A:cluster G.arboreum;B:cluster G.barbadense;H1,H2,H3,and H4:four clusters for 4 ancestries in G.hirsutum;M:cluster for mixed ancestries between species.
3.5.Association analyses
SNP–FQ associations were identified using 26 SNPs from the gene (Exp2) sequenced region.In total,four statistically significant SNPs (A484G,G1071A,G1198C,and G1245A) were identified(P <0.01; Table 8).Among these four SNPs,one site(A484G)was synonymous in the coding region,but associated significantly with MIC.SNP site G1198C was associated significantly with STR.Locus G1071A was associated significantly with UHML,UI,and STR.The amount of phenotypic variation in UHML and UI explained by G1071A was relatively high.Locus G1245A was associated significantly with both UHML and UI.No SNP–FQ associations were found for non-synonymous SNPs in the coding region.No associations were identified for ELO.Based on the associated loci,the favorable allele at each locus was identified for the Exp2 gene in all sequenced accessions,and was considered to be the superior haplotype of the Exp2 gene with respect to fiber quality.Full information on SNP–FQ associations may be found in Table 8.
The allelic effects of the four significant SNPs were relatively low,ranging from-2.02 to 1.88.Half of all significant SNPs had positive allelic effects,indicating that the non-reference allele increased FQ relative to the reference allele.The largest positive allelic effect among the four SNPs was observed for locus G1245A (1.88).This unfavorable allele(base A) was present only in the G.hirsutum subpopulation(15/74 = 20.27%),and the corresponding favorable allele occurred at much higher frequency (100%) in the other two species.The amount of phenotypic variation explained by significant SNPs ranged from 2.68% to 12.85% with a median of 6.43%.
Haplotype–FQ associations were calculated using 6 haplotypes [MAF (minor allele frequency) >5%] in this candidate gene.Six rare haplotypes (MAF <5%) were excluded from further analysis (haplotype–FQ association analysis).Rare haplotypes (MAF <5%) found in Exp2 (n = 17) resulted in missing genotypes (17/92 = 18.48%) in the haplotype–FQ association analysis.The highest positive effect on UHML and STR was observed for haplotype Hap_6 of Exp2,implicating this haplotype as the best candidate with superior FQ (Table 9).The low-UHML and-STR accessions had the haplotype Hap_10,whereas the high-UHML and-STR accessions had the haplotype Hap_6.This favorable haplotype was present mainly in the G.hirsutum subpopulation (15/74 =20.27%),rather than in the other species (G.arboreum and G.barbadense).The proportion of phenotypic variation explained by the haplotypes ranged from 21.51%(ELO)to 84.56%(UHML)with a median of 51.40%.
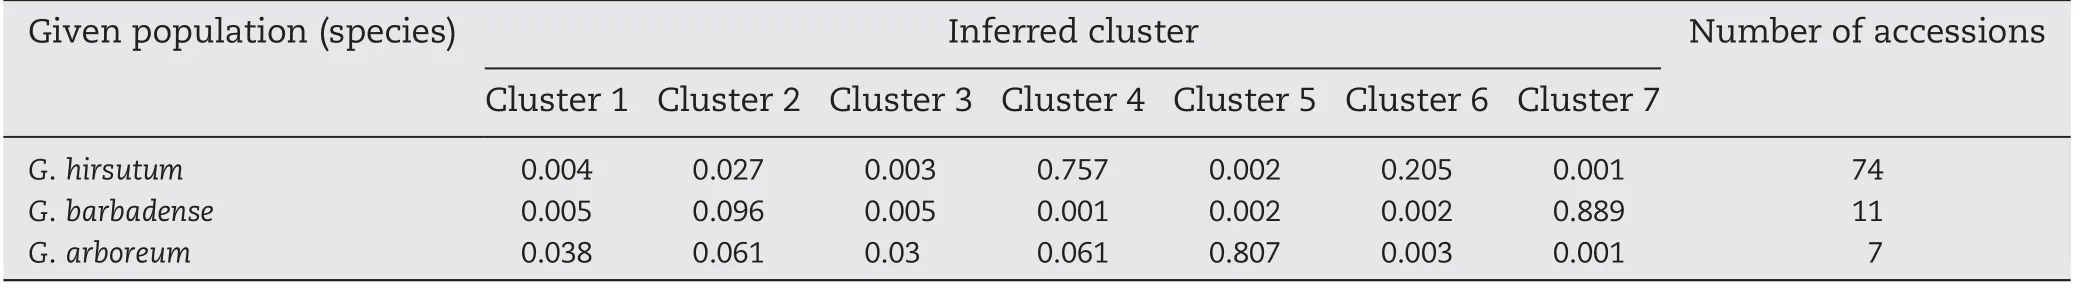
Table 7-Proportion of membership of each pre-defined population(three species)in each of the 7 clusters.

Table 8-Candidate-gene association analysis of fiber quality based on SNPs in the Exp2 sequenced region of 92 cotton accessions.
4.Discussion
4.1.Sequence diversity and SNPs
Informative,abundant,high-throughput markers associated with genes such as SNPs or insertion/deletions (InDels) are desirable for both breeding and genetic analyses.Expressed genes are available as templates to study variation.Van Deynze et al.[32]described a strategy for efficiently characterizing genomic variation (SNPs and InDels) within and among cotton species and reported the characterization and mapping of 270 SNPs based on EST sequencing,the first public SNP set[32].This study had been initiated to investigate nucleotide sequence diversity in Gossypium genomes [32,33],and its findings laid the groundwork for developing large numbers of SNP markers in cotton.Now,precisely because paralogs can be distinguished,we can screen DNA primer pairs that efficiently amplify single-copy loci [32].In this study,based on differences in sequences from NCBI,we designed and pre-screened locus-specific primers and ensured that one primer pair annealed to only a single locus in the genome in both diploid and tetraploid cotton,with the aim of characterizing the allelic diversity.
In total,1265 bp from the candidate gene (Exp2) in 92 cotton lines were amplified,resulting in 26 SNPs,7 InDels,and an average SNP frequency of 1 SNP/48 bp,similar to that(52 bp) in rye [30].Eight SNPs were non-synonymous polymorphisms resulting in amino acid replacement.It is noteworthy that the nucleotide diversity in the 3′ region was higher than that in the 5′ region,in agreement with the observation of Zhang et al.[34]InDels were located in introns,without causing a frame shift.
Lacape et al.[19] identified 21,000 inter-genotypic SNPs by deep EST pyrosequencing and validated 48 SNPs by genetic mapping.In the multigene family of ubiquitin proteins,most(99.7%) SNPs showed a biallelic pattern,and transition mutations (A ←→G,or T ←→C) were the most frequent type (61%) as compared to transversion mutations(39%) as is commonly reported in plants [35].The overall density for inter-genotypic SNPs was of 1 position every 108 bp,but that for intra-genotypic SNPs was of 1 every 82 and 79 bp in G.hirsutum and G.barbadense,respectively[19].
Analysis of DNA sequence diversity among six cotton Expansin A genes in diploid and tetraploid cotton[33]revealed a mean frequency of SNPs per nucleotide of 2.35% (one SNP per 43 bp),with 1.74 and 3.99% occurring in coding and non-coding regions,respectively,in the selected genotypes.In plants,SNP frequency also varies among species and is distributed unevenly across genomes.The nucleotide variation generated from this study was similar to that reported by An et al.[33]and Li et al.[30].
Lu et al.[36]identified 18 SNPs(including four InDels)in seven of the 15 fiber gene fragments on the basis of direct DNA sequencing.Lu et al.[36]concluded that the average frequency of SNPs per nucleotide was 0.34%,with 0.31%and 0.41%in coding and non-coding regions,respectively.Eight of the 15 SNPs were interspecific and 78% were nucleotide substitutions,with the four InDels contributing to interspecific polymorphism.
Exp2 was transcribed only in the developing cotton fiber[18].Twelve SNPs and seven InDels were located in the non-coding region of Exp2,and this sequence diversity should not result in any change in the Expansin protein.Five of the remaining 14 SNPs,which were located in the coding region,were missense mutations.But association analysis indicated that these polymorphic sites (which could give rise to missense mutations) did not show a significant association with fiber quality.In contrast,four SNPs that could not give rise to missense mutations were associated significantly with at least one of the fiber quality traits.Perhaps these missense mutations were not important for the Expansin protein,and silent substitutions in coding regions and SNPs in the non-coding region could play important roles in regulating Exp2 expression.
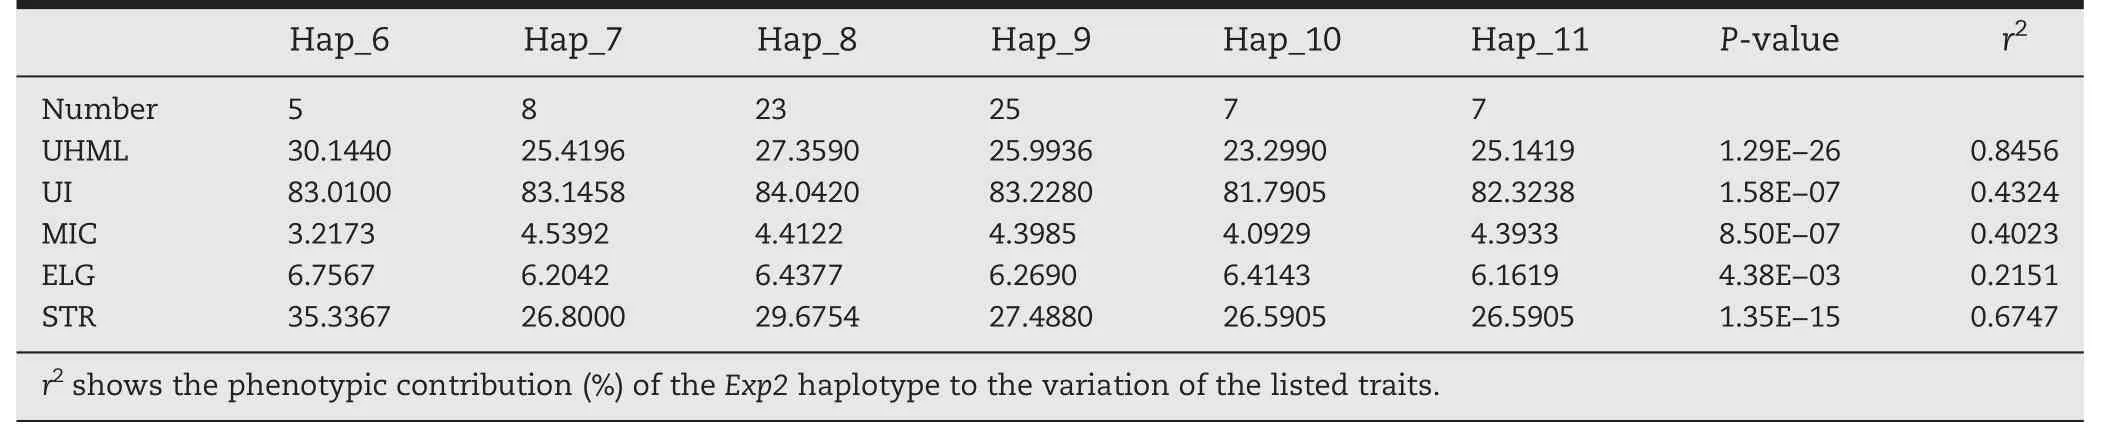
Table 9-Candidate-gene association analysis of fiber quality based on haplotypes in the Exp2 sequenced region.
4.2.Linkage disequilibrium (LD)
The comparatively high resolution provided by AM is dependent upon the amount of LD,or the non-random association of alleles,present in a species [9].In cotton,some studies of LD have been published.Using 95 SSRs in a total of 285 G.hirsutum accessions,Abdurakhmonov et al.[13]found that:1) at r2≥0.1,genomewide LD declines within a genetic distance of <10 cM in landrace stock germplasm and >30 cM in variety germplasm;2)at r2≥0.2,genomewide LD was reduced on average to ~1–2 cM in the landrace stock germplasm and 6–8 cM in variety germplasm.Abdurakhmonov et al.[14] reported the extent of LD using 202 SSRs in 335 G.hirsutum germplasm.At the significance threshold (r2≥0.1),a genomewide average of LD extended to a genetic distance of 25 cM in assayed cotton variety accessions.Genomewide LD at r2≥0.2 was reduced to approximately 5–6 cM.Fang et al.[37]reported that LD between marker pairs was clearly uneven among chromosomes,and among regions within a chromosome.Using 448 SSRs in 193 upland cotton cultivars,Fang et al.[37] concluded that the average size of a LD block was 6.75 cM at r2= 0.10.A low level of genomewide LD was detected in a collection consisting of 51 cultivars of 4 cotton species (r2= 0.07) as well as within the four species(r2= 0.11–0.15).In the entire collection,4.18%of 6,044,502 possible genomewide marker pairs were in LD at P <0.001,and the strongest LD (r2= 1) was observed for 302 marker pairs [38].These results provided evidence of the potential for AM of agronomically important traits in cotton[13].
To date,however,the distance of LD decay within cotton genes has never been reported.In maize,two LD studies for both diverse inbreds and traditional landraces suggested that in most cases LD decays rapidly within genes,usually within 2000 bp[9],favoring high-resolution AM.In this study,LD did not decay over 748 bp sequence,facilitating high-resolution AM and close tracking of the favorable allele of the gene Exp2 in descendants.
Haplotype tag SNPs(htSNPs)are needed for identification of favorable alleles (haplotype) during marker-assisted selection(MAS).Because of linkage disequilibrium,a check of three sites can identify the favorable haplotype Hap_6.The first site contains G761T,G875A,GC885/886AA,C1034T,which were in complete linkage disequilibrium.The second site contains T42A,C69A,G731T,which were also in complete linkage disequilibrium,and the third site is A120G.Optimizated genotyping methods maybe developed to facilitate MAS on Hap_6.
4.3.Population structure and genetic diversity
To discover genuine associations by AM,the accessions of the natural population should be randomly mated germplasm.Unfortunately,there is little truly randomly mated germplasm available.To avoid spurious association,population structure (subpopulation membership) must be controlled in statistical analyses[39].
Ulloa et al.[40] assessed the population structure in Gossypium species using SSRs with wide genome coverage.They found 111 accessions clustered into distinct groups at K = 5,consistent with the knowledge of genomic origin,evolutionary history,and geographic distribution or ecotypes of these accessions.Jena et al.[38] grouped the 51 genotypes of 4 cotton species into three clusters or subpopulations with Structure using 1100 AFLP markers.All 11 G.arboreum and 15 G.herbaceum genotypes grouped into two clusters.Similarly,the 25 genotypes belonging to G.hirsutum and G.barbadense grouped into a single cluster.The population structure analysis performed by Kantartzi and Stewart [15] identified six main clusters for accessions corresponding to different geographic regions,indicating agreement between genetic and predefined populations.Yu et al.[41]described a core set of 105 SSR markers with a wide genome coverage of at least four evenly distributed markers per chromosome for the 26 tetraploid cotton chromosomes.In this study,the core set of 132 SSRs was most in agreement with the results of Yu et al.[41].We estimated the population structure by genotyping 132 SSR loci,which were then used to estimate a genetic background matrix (Q,a vector of subpopulation membership) by Bayesian approaches [27].The population structure analysis in this study identified seven main clusters for the accessions,which also corresponded to different genomic origins,evolutionary history,and geographic regions,indicating agreement between genetic and predefined populations.
The results of whole genomic SSR genotyping and sequencing Exp2 showed that the population contained diverse DNA variation,especially in G.hirsutum.Based on SSR genotyping,a model-based population structure analysis divided the whole population into seven groups.G.hirsutum was further subdivided into subgroups H1–H4.Based on the sequence of Exp2 in 92 accessions,more haplotypes and higher diversity were observed in G.hirsutum than that in G.arboreum and G.barbadense.Perhaps G.hirsutum was more genetically diverse owing to its cultivation worldwide and greater exploitation of variation during the breeding process of this species.
4.4.Association analyses
First reports of AM in plants were published on rice in 1996[42]and in oat in 1997[43],respectively.But these studies did not take the population structure into account,resulting in spurious associations.The first report of AM in plants accounting for the population structure emerged in 2001 in maize [27].Later,AM was extended to barley,Arabidopsis,potato,wheat,and sea beet,considering the population structure and extent of LD.In tetraploid cotton the first study of AM was reported by Abdurakhmonov[13]associating fiber quality with SSRs.These previous reports [14,15]provided evidence of the potential for AM of agronomically important traits in cotton.
In G.hirsutum,Abdurakhmonov et al.[13]performed AM of 178 SSR loci with fiber quality traits,and identified between 6%and 13% of SSR markers associated with traits,explaining between 1%and 5%of phenotypic variation.In diploid cotton,the first attempt at AM identified 30 SSR marker–trait associations in 56 G.arboreum accessions introduced from different regions worldwide[15].Zeng et al.[44]found that 39 SSRs showed a significant(P <0.05,0.01,or 0.001)and reliable association with six fiber traits in 260 germplasm lines derived from multiple crosses among tetraploid species in Gossypium.
All of the examples mentioned above focus on GWAS rather than candidate gene association.With the genome sequence in place,comprehensive gene discovery can be initiated,providing enormous opportunity for candidate-gene AM studies.Moreover,as draft sequencing of diploid Gossypium species becomes available,the feasibility of candidate-gene AM (not excluding GWAS) can be further investigated.The goal of the current project was primarily to identify and characterize polymorphisms in expressed genes (Exp2) and detect associations between molecular polymorphisms and phenotypic variation by AM,with the purpose of 1)validating the phenotypic effect of genes of interest,2) characterizing the alleles of the genes of interest,and 3)identifying favorable alleles of the genes.
Harmer et al.[18] found that RT-PCR with primers specific for GhExp1 detected a high level of mRNA only in elongating cotton fibers,and in transient assays the GhExp1 promoter directed fiber-specific expression of a GUS reporter gene.GhExp1 encodes plant cell wall proteins (α-expansins) known to facilitate cell wall extension.Cotton fibers require extensive cell wall relaxation for elongation.It was accordingly hypothesized that GhExp1 plays an important role in cell wall extension during fiber development.As for GhExp2,it shares 97% nucleotide sequence identity with GhExp1 within coding regions,and GhExp2 transcripts are also specific to the developing cotton fiber.But GhExp2 was expressed at very low levels and its role was not determined [18].Association analyses indicated that polymorphism of Exp2 could give rise to a variation in fiber quality properties.The results of this study suggest that,like GhExp1,Exp2 plays an important role during fiber development.
In the present study,26 SNPs and 7 InDels were found in gene Exp2.These polymorphisms resulted in twelve haplotypes.On two levels,we performed association analyses:SNP–FQ and haplotype–FQ associations.We found that only 4 SNPs were significantly associated with different fiber quality properties,and none with ELO.The remaining polymorphic sites cannot independently exert significant effects on fiber quality properties.In haplotype–FQ associations,Exp2 was treated as an indivisible biological entity in the form of different allele or haplotypes.The most favorable UHML and STR properties were observed for haplotype Hap_6.In future MAS and molecular design breeding programs,we should identify and propagate plants carrying haplotype Hap_6 in the Exp2 region,with the aim of transferring positive alleles to breeding germplasm.And during genotyping of MAS,some attention should be paid to the 4 SNP loci.
The authors thank the anonymous reviewers for their valuable comments and suggestions to improve the quality of the paper.This work was supported by the National Natural Science Foundation of China(30971821),Specialized Research Fund for the Doctoral Program of Higher Education (Ministry of Education; 20090204120017),the Shaanxi Natural Science Fund project (2010JQ3005),the National Transgenic Plants Project of China (2011ZX08005-002),and China Agriculture Research System(CARS-18-45).The funders had no role in the study design,data collection and analysis,decision to publish,or preparation of the manuscript.
[1] R.J.Kohel,Cotton germplasm resources and the potential for improved fiber production and quality,in:A.S.Basra(Ed.),Cotton Fibres,The Haworth Press Inc.,New York,1999,pp.167–182.
[2] E.S.Buckler,J.M.Thornsberry,Plant molecular diversity and applications to genomics,Curr.Opin.Plant Biol.5 (2002)107–111.
[3] F.Breseghello,M.E.Sorrells,Association mapping of kernel size and milling quality in wheat (Triticum aestivum L.)cultivars,Genetics 172 (2006) 1165–1177.
[4] D.F.Cai,Y.J.Xiao,W.Yang,W.Ye,B.Wang,M.Younas,J.S.Wu,K.D.Liu,Association mapping of six yield-related traits in rapeseed (Brassica napus L.),Theor.Appl.Genet.127 (2014)85–96.
[5] Y.L.Zhao,H.M.Wang,W.Chen,Y.H.Li,Genetic structure,linkage disequilibrium and association mapping of Verticillium wilt resistance in elite cotton (Gossypium hirsutum L.)germplasm population,PLoS ONE 9(2014)e86308.
[6] J.R.Andersen,T.Schrag,A.E.Melchinger,I.Zein,T.Lubberstedt,Validation of Dwarf8 polymorphisms associated with flowering time in elite European inbred lines of maize(Zea mays L.),Theor.Appl.Genet.111 (2005) 206–217.
[7] L.Camus-Kulandaivelu,J.B.Veyrieras,D.Madur,V.Combes,M.Fourmann,S.Barraud,P.Dubreuil,B.Gouesnard,D.Manicacci,A.Charcosset,Maize adaptation to temperate climate:relationship with population structure and polymorphism in the Dwarf8 gene,Genetics 172(2006)2449–2463.
[8] S.R.Whitt,L.M.Wilson,M.I.Tenaillon,B.S.Gaut,E.S.Buckler,Genetic diversity and selection in the maize starch pathway,Proc.Natl.Acad.Sci.U.S.A.99(2002) 12959–12962.
[9] L.M.Wilson,S.R.Whitt,A.M.Ibá?ez,T.R.Rocheford,M.M.Goodman,E.S.Buckler IV,Dissection of maize kernel composition and starch production by candidate gene association,Plant Cell 16(2004) 2719–2733.
[10] E.A.Edae,P.F.Byrne,H.Manmathan,S.D.Haley,M.Moragues,M.S.Lopes,M.P.Reynolds,Association mapping and nucleotide sequence variation in five drought tolerance candidate genes in spring wheat,Plant Genome 6 (2013),http://dx.doi.org/10.3835/plantgenome.
[11] Z.I.Talukder,B.S.Hulke,L.L.Qi,B.E.Scheffler,V.Pegadaraju,K.McPhee,T.J.Gulya,Candidate gene association mapping of Sclerotinia stalk rot resistance in sunflower (Helianthus annuus L.)uncovers the importance of COI1 homologs,Theor.Appl.Genet.127 (2014) 193–209.
[12] F.F.Xu,G.Zhang,C.Tong,X.Sun,H.Corke,M.Sun,J.S.Bao,Association mapping of starch physicochemical properties with starch biosynthesizing genes in waxy rice (Oryza sativa L.),J.Agric.Food Chem.61(2013) 10110–10117.
[13] I.Y.Abdurakhmonov,R.J.Kohel,J.Z.Yu,A.E.Pepper,A.A.Abdullaev,F.N.Kushanov,I.B.Salakhutdinov,Z.T.Buriev,S.Saha,B.E.Scheffler,J.N.Jenkins,A.Abdukarimov,Molecular diversity and association mapping of fiber quality traits in exotic G.hirsutum L.germplasm,Genomics 92(2008)478–487.
[14] I.Y.Abdurakhmonov,S.Saha,J.N.Jenkins,Z.T.Buriev,S.E.Shermatov,B.E.Scheffler,A.E.Pepper,J.Z.Yu,R.J.Kohel,A.Abdukarimov,Linkage disequilibrium based association mapping of fiber quality traits in G.hirsutum L.variety germplasm,Genetica 136 (2009) 401–417.
[15] S.K.Kantartzi,J.McD.Stewart,Association analysis of fiber traits in Gossypium arboreum accessions,Plant Breed.127(2008) 173–179.
[16] H.X.Mei,X.F.Zhu,T.Z.Zhang,Favorable QTL alleles for yield and its components identified by association mapping in Chinese upland cotton cultivars,PLoS ONE 8 (2013) e82193.
[17] A.B.Arpat,M.Waugh,J.P.Sullivan,M.Gonzales,D.Frisch,D.Main,T.Wood,A.Leslie,R.A.Wing,T.A.Wilkins,Functional genomics of cell elongation in developing cotton fibers,Plant Mol.Biol.54 (2004) 911–929.
[18] S.E.Harmer,S.J.Orford,J.N.Timmis,Characterisation of six α-expansin genes in Gossypium hirsutum(upland cotton),Mol.Genet.Genomics 268 (2002) 1–9.
[19] J.M.Lacape,M.Claverie,R.O.Vidal,Deep sequencing reveals differences in the transcriptional landscapes of fibers from two cultivated species of cotton,PLoS ONE 7 (2012) e48855.
[20] D.J.Cosgrove,New genes and new biological roles for expansins,Curr.Opin.Plant Biol.3(2000) 73–78.
[21] A.H.Paterson,C.L.Brubaker,J.F.Wendel,A rapid method for extraction of cotton (Gossypium spp.) genomic DNA suitable for RFLP and PCR analysis,Plant Mol.Biol.Report.11(1993)112–127.
[22] D.H.He,Z.X.Lin,X.L.Zhang,Y.X.Zhang,W.Li,Y.C.Nie,X.P.Guo,Dissection of genetic variance of fiber quality in advanced generations from an interspecific cross of Gossypium hirsutum and G.barbadense,Plant Breed.127 (2008)286–294.
[23] M.A.Larkin,G.Blackshields,N.P.Brown,R.Chenna,P.A.McGettigan,H.McWilliam,F.Valentin,I.M.Wallace,A.Wilm,R.Lopez,J.D.Thompson,T.J.Gibson,D.G.Higgins,ClustalW and ClustalX version 2(2007),Bioinformatics 23(2007)2947–2948.
[24] T.Hall,BioEdit v7,http://www.mbio.ncsu.edu/BioEdit/BioEdit.html 2007.
[25] P.Librado,J.Rozas,DnaSP v5: a software for comprehensive analysis of DNA polymorphism data,Bioinformatics 25(2009)1451–1452.
[26] J.K.Pritchard,M.Stephens,P.Donnelly,Inference of population structure using multilocus genotype data,Genetics 155 (2000) 945–959.
[27] J.M.Thornsberry,M.M.Goodman,J.Doebley,S.Kresovich,D.Nielsen,E.S.Buckler,Dwarf8 polymorphisms associate with variation in flowering time,Nat.Genet.28(2001) 286–289.
[28] F.Tajima,Statistical method for testing the neutral mutation hypothesis by DNA polymorphism,Genetics 123 (1989)585–595.
[29] B.Stich,A.E.Melchinger,M.Frisch,H.P.Maurer,M.Heckenberger,J.C.Reif,Linkage disequilibrium in European elite maize germplasm investigated with SSRs,Theor.Appl.Genet.111 (2005) 723–730.
[30] Y.Li,G.Haseneyer,C.C.Sch?n,D.Ankerst,V.Korzun,P.Wilde,E.Bauer,High levels of nucleotide diversity and fast decline of linkage disequilibrium in rye(Secale cereale L.)genes involved in frost response,BMC Plant Biol.11(2011),http://dx.doi.org/10.1186/1471-2229-11-6.
[31] V.Belamkar,M.G.Selvaraj,J.L.Ayers,P.R.Payton,N.Puppala,M.D.Burow,A first insight into population structure and linkage disequilibrium in the US peanut minicore collection,Genetica 139 (2011) 411–429.
[32] A.Van Deynze,K.Stoffel,M.Lee,T.A.Wilkins,A.Kozik,R.G.Cantrell,J.Z.Yu,R.J.Kohel,D.M.Stelly,Sampling nucleotide diversity in cotton,BMC Plant Biol.9(2009)125,http://dx.doi.org/10.1186/1471-2229-9-125.
[33] C.F.An,S.Saha,J.N.Jenkins,B.E.Scheffler,T.A.Wilkins,D.M.Stelly,Transcriptome profiling,sequence characterization,and SNP-based chromosomal assignment of the Expansin genes in cotton,Mol.Genet.Genomics 278 (2007) 539–553.
[34] H.Y.Zhang,X.G.Mao,J.N.Zhang,X.P.Chang,C.S.Wang,R.L.Jing,Genetic diversity analysis of abiotic stress response gene TaSnRK2.7–a in common wheat,Genetica 139(2011)743–753.
[35] R.L.Byers,D.B.Harker,S.M.Yourstone,P.J.Maughan,J.A.Udall,Development and mapping of SNP assays in allotetraploid cotton,Theor.Appl.Genet.124(2012)1201–1214.
[36] Y.Z.Lu,J.Curtiss,R.G.Percy,S.E.Hughs,J.W.Yu,S.X.Yu,J.F.Zhang,DNA polymorphisms of genes involved in fiber development in a selected set of cultivated tetraploid cotton,Crop Sci.49(2009) 1695–1704.
[37] D.D.Fang,L.L.Hinze,R.G.Percy,P.Li,D.Deng,G.Thyssen,A microsatellite-based genome-wide analysis of genetic diversity and linkage disequilibrium in upland cotton(Gossypium hirsutum L.) cultivars from major cotton-growing countries,Euphytica 191 (2013) 391–401.
[38] S.N.Jena,A.Srivastava,U.M.Singh,S.Roy,N.Banerjee,K.M.Rai,S.K.Singh,V.Kumar,L.B.Chaudhary,J.K.Roy,R.Tuli,S.V.Sawant,Analysis of genetic diversity,population structure and linkage disequilibrium in elite cotton (Gossypium L.)germplasm in India,Crop&Pasture Sci.62(2011) 859–875.
[39] S.R.Whitt,E.S.Buckler,Using natural allelic diversity to evaluate gene function,from: methods in Molecular Biology 236,in: E.Grotewold (Ed.),Plant Functional Genomics:Methods and Protocols,Humana Press,Inc.,Totowa,NJ,2003.
[40] M.Ulloa,I.Y.Abdurakhmonov,C.Perez,R.Percy,J.M.Stewart,Genetic diversity and population structure of cotton(Gossypium spp.) of the New World assessed by SSR markers,Botany-Botanique 91(2013) 251–259.
[41] J.Z.Yu,D.D.Fang,R.J.Kohel,M.Ulloa,L.L.Hinze,R.G.Percy,J.F.Zhang,P.Chee,B.E.Scheffler,D.C.Jones,Development of a core set of SSR markers for the characterization of Gossypium germplasm,Euphytica 187 (2012) 203–213.
[42] P.S.Virk,B.V.Ford-Lloyd,M.T.Jackson,H.S.Pooni,T.P.Clemeno,H.J.Newbury,Predicting quantitative variation within rice germplasm using molecular markers,Heredity 76(1996) 296–304.
[43] S.C.Beer,W.Siripoonwiwat,L.S.O'Donoughue,E.Souza,D.Matthews,M.E.Sorrells,Associations Between Molecular Markers and Quantitative Traits in an Oat Germplasm Pool:Can We Infer Linkages?http://wheat.pw.usda.gov/jag/papers97/paper197/jqtl1997-01.html 1997.
[44] L.H.Zeng,W.R.Meredith,O.A.Gutierrez,D.L.Boykin,Identification of associations between SSR markers and fiber traits in an exotic germplasm derived from multiple crosses among Gossypium tetraploid species,Theor.Appl.Genet.119(2009) 93–103.
- The Crop Journal的其它文章
- Productivity,quality and soil health as influenced by lime in ricebean cultivars in foothills of northeastern India
- Genotype × environment interaction effects on early fresh storage root yield and related traits in cassava
- Identification of QTL for adult-plant resistance to powdery mildew in Chinese wheat landrace Pingyuan 50
- Effect of subsoil tillage depth on nutrient accumulation,root distribution,and grain yield in spring maize
- Isolation and characterization of a novel wall-associated kinase gene TaWAK5 in wheat(Triticum aestivum)
- The impacts of conservation agriculture on crop yield in China depend on specific practices,crops and cropping regions