
ECT Image Analysis Methods for Shear Zone Measurements during Silo Discharging Process*
2012-10-31 03:35:26KrzysztofGrudzienZbigniewChanieckiAndrzejRomanowskiMaciejNiedostatkiewiczandDominikSankowskiComputerEngineeringDepartmentTechnicalUniversityofLodzStefanowskiegostr9094LodzPolandDepartmentofFundamentalsofBuildingandMaterialEn
Krzysztof Grudzien, Zbigniew Chaniecki, Andrzej Romanowski,**, Maciej Niedostatkiewicz and Dominik Sankowski Computer Engineering Department, Technical University of Lodz, Stefanowskiego 8/ str, 90-94 Lodz, Poland Department of Fundamentals of Building and Material Engineering, Gdansk University of Technology, Gdansk, Poland
ECT Image Analysis Methods for Shear Zone Measurements during Silo Discharging Process*
Krzysztof Grudzien1, Zbigniew Chaniecki1, Andrzej Romanowski1,**, Maciej Niedostatkiewicz2and Dominik Sankowski11Computer Engineering Department, Technical University of Lodz, Stefanowskiego 18/22 str, 90-924 Lodz, Poland2Department of Fundamentals of Building and Material Engineering, Gdansk University of Technology, Gdansk, Poland
The paper covers the electrical capacitance tomography (ECT) data analysis on shear zones formed during silo discharging process. This is due to the ECT aptitude for detection of slight changes of material concentration. On the basis of ECT visualisations, wall-adjacent shear zone profiles are analysed for different wall roughness parameters. The analysis on changes of material concentration, based on ECT images, enables the calculation for the characteristic parameters of shear zones—size and material concentration inside the shear zone in a dynamic process of silo discharging. In order to verify the methodology a series of experiments on gravitational flow of bulk solids under various conditions were conducted with different initial granular material packing densities and silo wall roughness. The investigation shows that the increase in container wall roughness is an effective method for reducing the dynamic effects during the material discharging, since these effects are resulted from the resonance between hopper construction and trembling material. Such effects will damage industrial equipment in practical applications and need further investigation.
electrical capacitance tomography, silo flow, shear zone
1 INTRODUCTION
About 60% of industrial products are powders or grains. Many of them are stored in containers, the majority of which are silos. Operational work of silos for storing friable materials is a complex problem regarding safety issues. This may be caused by the uneven material distribution, resulting in unsymmetrical stresses of walls and the bottom during loading and discharging of bulk materials [1-3]. The most recurrent problems related to silo usage are shear zones, increasing the pressure in points of silo due to the geometrical transformation (when changing from bin to cone part of container) and volume change of material [4].Strong dynamic effects may result from the interaction between the vibration of material being unloaded from silo and the silo structure [5, 6]. For slender silos it is more probable for stronger dynamic effects to occur.Resonance vibration increases the pressure on walls and the bottom, which in turn may cause malfunction or even construction catastrophe. These phenomena depend on many factors, such as initial density of granular material, stress level, mean grain diameter,specimen size and deformation rate. Additional difficulty lies in the determination of those time variant factors (humidity, temperature, etc.) influencing the bulk solid storage behaviour. Dynamic effects are inherent during the discharging process. For cohesionless materials, the effect appears as pulsation, and for cohesion materials it is pulsations and strokes[7-14]. The volume changes of the flowing material result in the occurrence of narrow zones with intense shearing. The shear zones occur along silo walls, as well as the cross section of the flowing bulk. During gravitational flow of bulk materials in silos the appearance of strain localization can be observed along the walls in parallel part of the silo in the form of shear zones, due to lower material concentration than those in the surrounding areas. Particularly evident effects of shear zones can be seen at rough walls of a silo. One of the most effective means for reduction of dynamic effects is to increase silo wall roughness. In industrial applications, special corrugated sheets are mounted on the inner walls of the silo [9]. Increasing the silo wall roughness, the shear effects in the walls will increase, causing additional transversal strain waves and increasing the frequency of vibrations of flowing particles. This in turn shifts the frequency away from the construction vibration and avoids the resonance [4]. On the other hand, increasing the wall roughness does not change the flow of bulk solids, so that in the upper part of a container, the mass flow regime is maintained. Monitoring the behaviour of granular materials in silos is crucial for safety of construction site. Therefore, the accurate parametric description of shear localization zones is important.
The purpose of this paper is to reveal the applicability of electrical capacitance tomography (ECT) to silo bulk flow diagnostics for smooth and rough silo walls. It is not the first ECT approach in this area[15-17], but those researches focused mostly on monitoring of flowing core during loading and discharging processes. The investigation on the interaction between wall and particles at silo wall was presented in[14], where ECT system was used to detect oscillations in non-cohesive sand during silo flow. The analysis of ECT data on the sand pulsation in laboratory scale silo showed that the pulsation and vibration of granularmaterial in gravitational flow are the strongest effect in the by-the-wall regions of the silo. The investigation allowed the estimation of pulsation (amplitude and frequencies). However, the complex knowledge about material behaviour in shear zones needs information about shear zone width and material concentration in this zone. The present work examines the possibility of detection of the influence of wall roughness on flowing material behaviour, with special interest in by-the-wall shear zone localization.
2 EXPERIMENTAL
The experimental model considered here was a flat bottom silo with a circular cross section made of PMMA (polymethyl methacrylate), pipe (external diameter d=0.2 m, height h=2.0 m, wall thickness t=0.005 m). The discharge orifice with do0.07 m was located at the center of silo). The material in the silo was cohesionless sand, with medium grain diameter d50=0.8 mm. The silo model was placed on a supporting structure and firmly fixed, but the upper silo part (e.g. inlet) had no additional support. The silo was filled with loose sand (volumetric mass ρ1500 kg·m?3, porosity factor e0=0.76) and compressed sand(ρ=1650 kg·m?3, e0=0.61). In the case of loose sand,the silo was loaded with a funnel placed in the upper silo part, and in the case of compressed sand, the loading was conducted with the so-called ‘scattered rain’method—using 6 mm×6 mm mesh sieve placed above the silo. The sand initial parameters values were determined experimentally by measurement. Experiments were conducted with these values of initial sand parameters intentionally, because firstly, the expected by-the-wall shear zone regions are greater for loose sand than for packed sand, and secondly expected dynamic effects are less significant (vibrations amplitude is smaller) for loose sand than for packed sand,however the origin mechanism for both cases is the same. Experiments were conducted with gravitational flow for both smooth walls (rw?d50, rw—wall roughness) and rough walls (rwd50). Silo wall roughness was increased by sticking sandpaper along the inner walls on the full height of the container. The same silo model was employed for different research purposes,and its extensive description can be found in [14].Fig. 1 presents the laboratory silo model and the scheme of cross-section with electrodes located around the silo.
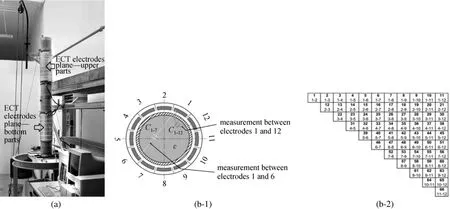
Figure 1 Experimental set up (a) station photograph; scheme of silo cross section with electrodes located positions including:(b-1) the 12-electrode sensor with the measurement between adjacent electrodes C1-12 and opposite electrodes C1-7 marked,(b-2) triangular measurement—measurement frame for 12-electrode sensors
ECT is applied for measurement of material concentration distribution during industrial flow processes [18, 19]. The main task of ECT is to give visualization of material concentration in sensor measurement space in the form of reconstructed images [20, 21].The applied tomography unit enables to use 12 separate electrodes of axial length of 0.2 m. Data acquisition rate was 30 frames per second for each of measurement plane (a frame is a set of n capacitance measurement records offor one cycle i, which are the base of tomography image reconstruction). In order to ensure sufficient signal-noise ratio, the length of externally placed electrodes was equal to silo diameter.Reconstructed images reveal material distribution in the form of 2D picture of 32×32 pixel resolution. For a mixture with two materials, a value associated with each pixel represents a relative value of higher electric permittivity material (friable material) with respect to lower electric permittivity material (e.g. air). The values of normalized tomography image pixel are in range <0, 1>. This means, that value of 0 represents sensor emptiness (in detail: sensor space occupied by material of lower electric permittivity) while value of 1 is assigned to fully filled (sensor filled with material of higher electric permittivity). These range limits: (0)and (1) are mapped to, respectively: lowest and highest permittivity values in process of calibration, before conducting proper experiments. In case of silo flow,ECT sensor is calibrated for empty sensor (only air inside) and for fully filled sensor with sand, which in fact is a mixture of sand particles and air voids. This mixture is the same as initial stage of silo discharging process (just before opening the silo outlet) and therefore gives rise for image analysis to be feasible in comparing images taken during silo flow to the image of initial stage. ECT image can be presented in different scales of greyness level. The previous researches,using the same ECT sensor, shown that value changes in tomography images pixels higher than 0.002 can be interpreted as change caused by the sand concentration changes. For such value the number of distinguishable levels in image is equal to 500. The quality of output image depends mainly on a number of independent measurement records with respect to single reconstructed image. In ECT, this number n is the combination of measurement electrode pairs, and for a given study n is 66 (for a single measurement frame)[Fig. 1 (b-2)]. The tomography images presented in this paper are reconstructed using well-known linear back projection (LBP) method. The LBP algorithm belongs to a group of simple and direct image reconstruction methods. The reconstructed images using this algorithm are usually associated with blurred edges of reconstructed objects. The main advantage of LBP is its speed (which is of particular importance in the online monitoring systems) and ease of implementation. One could use a different image reconstruction algorithm,but the other algorithms are associated with another specific issues, and the choice of algorithm was not crucial to the presented results of this research. So in the future investigation it is advised to use more sophisticated algorithms, however the choice of particular one should be considered carefully.
3 RESULTS
Measurements were conducted for different locations of sensors (h 0.3, 0.75, 0.85, 1.0 and 1.5 m from the flat bottom), but we focused only on simultaneous measurements with sensors located at h 1.0 m and h 1.5 m. The following considerations regard experiments with loose and concentrated sand, smooth and rough silo walls. The results are presented in form of 1D plot (pixels value changes in time for chosen position of ECT sensor cross section) and in 2D topogram form (Figs. 3, 5, 7, 9), where changes of concentration value related to individual pixels in time along one line passing through the sensor cross-section are depicted. Obtained results are subject mainly to qualitative comparative analysis rather than quantitative, since ECT measurement error is difficult to determine. Presented quantitative results are in fact the result of assessment of pixel values change for comparison of different flow conditions.

Figure 2 Changes of loose sand concentration for smooth silo walls [line: h 1.5 m; dashed line: h=1.0 m; 3, 4 insilo wall area, with the values of wall-adjacent pixel p(1,15); 1, 2:in centre area, with the values of pixel p(15,15)]
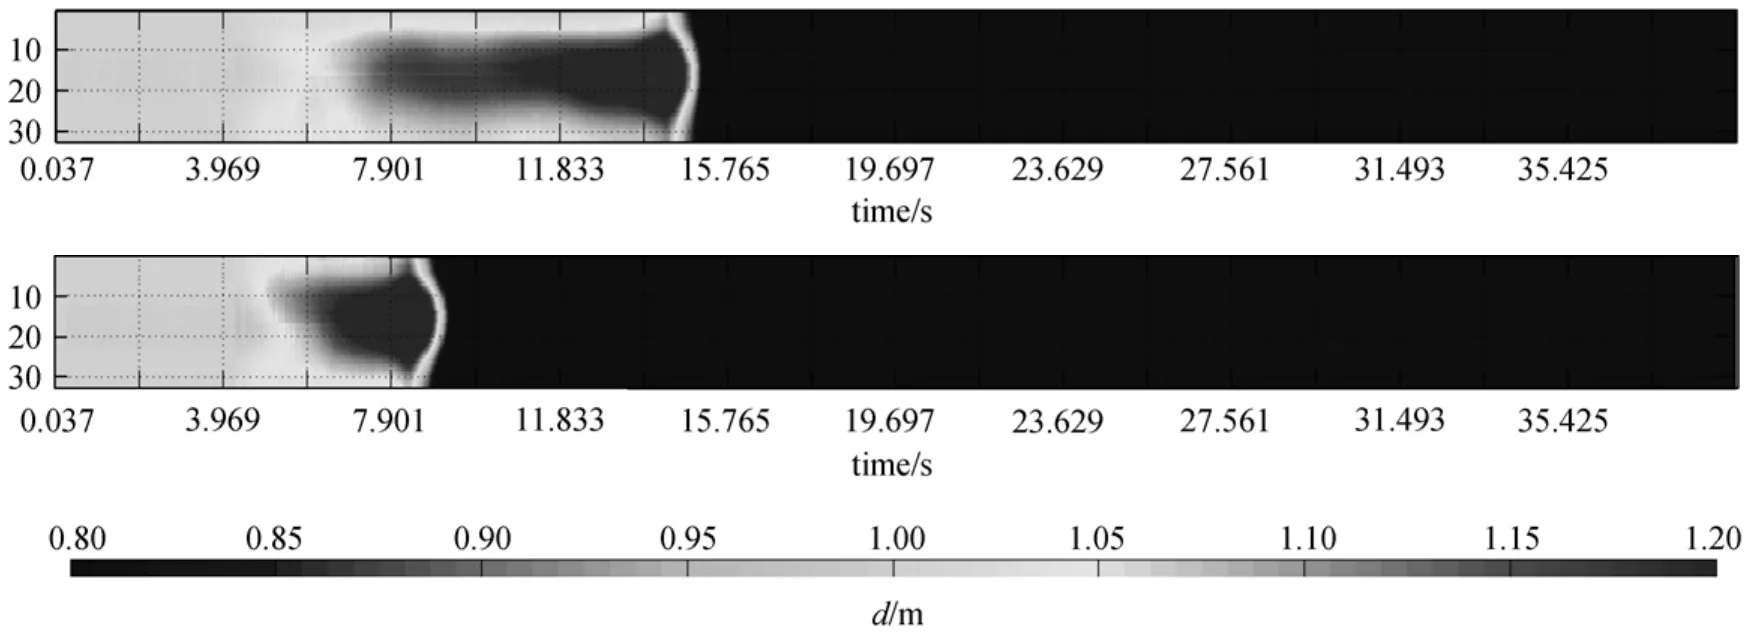
Figure 3 Tomographic visualization of concentration changes for loose sand and smooth silo walls along time (Coordinate indexes the pixel along the cylinder diameter; sensor location: bottom h 1.0 m, top h 1.5 m)
For loose sand and smooth walls, flowing material during discharging is subject to contractancy (material concentration or packing density increases), as shown in Figs. 2 and 3. Pair of characteristics dropping at about 10 s time is for sensor height h 1.5 m,and pair of characteristics dropping at about 15 s time is for sensor location at h=1 m. In the cross-section centre, for pixel p(15,15), at heights h=1.0 m and h 1.5 m, when the material approaches the upper boundary of sensing electrodes, the concentration rise is up to ≈20-25 of initial value (it is worth to indicate,the obtained maximum reaching 50%-60% is a result of measurement error, associated with that the upper surface of flowing material starts to move throughout the sensor space). Such changes take place for initially loose sand and in comparison to the initial stage. For a region adjacent to a wall, for pixel p(1,15), at h 1.0 m, the concentration rise is negligible, and for h 1.5 m, it is about 8% rise with respect to initial value. Additionally, at h=1.5 m, flowing solids, for both central and wall-adjacent zones, exhibit dynamic pulsations during silo discharging. Fig. 3 exposes full information about material distribution inside sensor presented along a radial line passing through the sensor cross-section. One can see relative symmetry of distribution of material concentration changes during flow for both 1 m and 1.5 m height.
For concentrated sand and smooth walls, bulk solid is subject to contractancy, as well as dilatancy(concentration drops), as seen in Figs. 4 and 5. Pair of characteristics dropping at about 12 s time is for sensor height h=1.5 m, and pair of characteristics dropping at about 18 s is for sensor location at h=1 m.

Figure 4 Changes of compressed sand concentration for smooth silo walls [line: h=1.5 m; dashed line: h=1.0 m; 3,4:in silo wall area, with the values of wall-adjacent pixel p(1,15);1,2: in centre area, with the values of pixel p(15,15)]
In the cross-section centre, for pixel p(15,15), at h=1.0 m, the material was contracted by ~3% (compared to initial value) at the moment when the material started to flow, and then suddenly underwent dilatancy,~25% of initial value. Afterwards, the contractancy increased gradually. When material surface approached the upper boundary of sensing electrodes, the concentration increased ~10%. Similar material behaviour was observed for h 1.5 m. First ~3% contractancy,then ~10% dilatancy, and finally ~15% contractancy were recorded before the material approached the upper boundary of sensor electrodes. In a region adjacent to a wall, for pixel p(1,15), gradual decrease of concentration was observed during silo discharging. Both at h 1.0 m and h 1.5 m the dilatancy reached ~10%of initial value.
Similar to experiments with loose sand, at h 1.5 m,flowing solids, in both central and wall-adjacent zones,dynamic pulsations were observed for concentrated sand.Pulsation amplitude values, determined using ECT,were comparable for loose and compressed sand. Again,alike to loose sand experiments, the distribution of material concentration change is relatively symmetrical for compressed sand as well—this can be seen on Fig. 5.
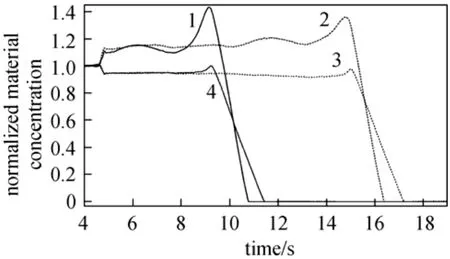
Figure 6 Changes of loose sand concentration for rough silo walls [line: h 1.5 m; dashed line: h=1.0 m; 3, 4: in silo wall area, with the values of wall-adjacent pixel p(1,15); 1, 2:in centre area, with the values of pixel p(15,15)]

Figure 5 Tomographic visualization of concentration changes for compressed sand and smooth silo walls along time axis(sensor location: bottom h=1.0 m, top h=1.5 m)
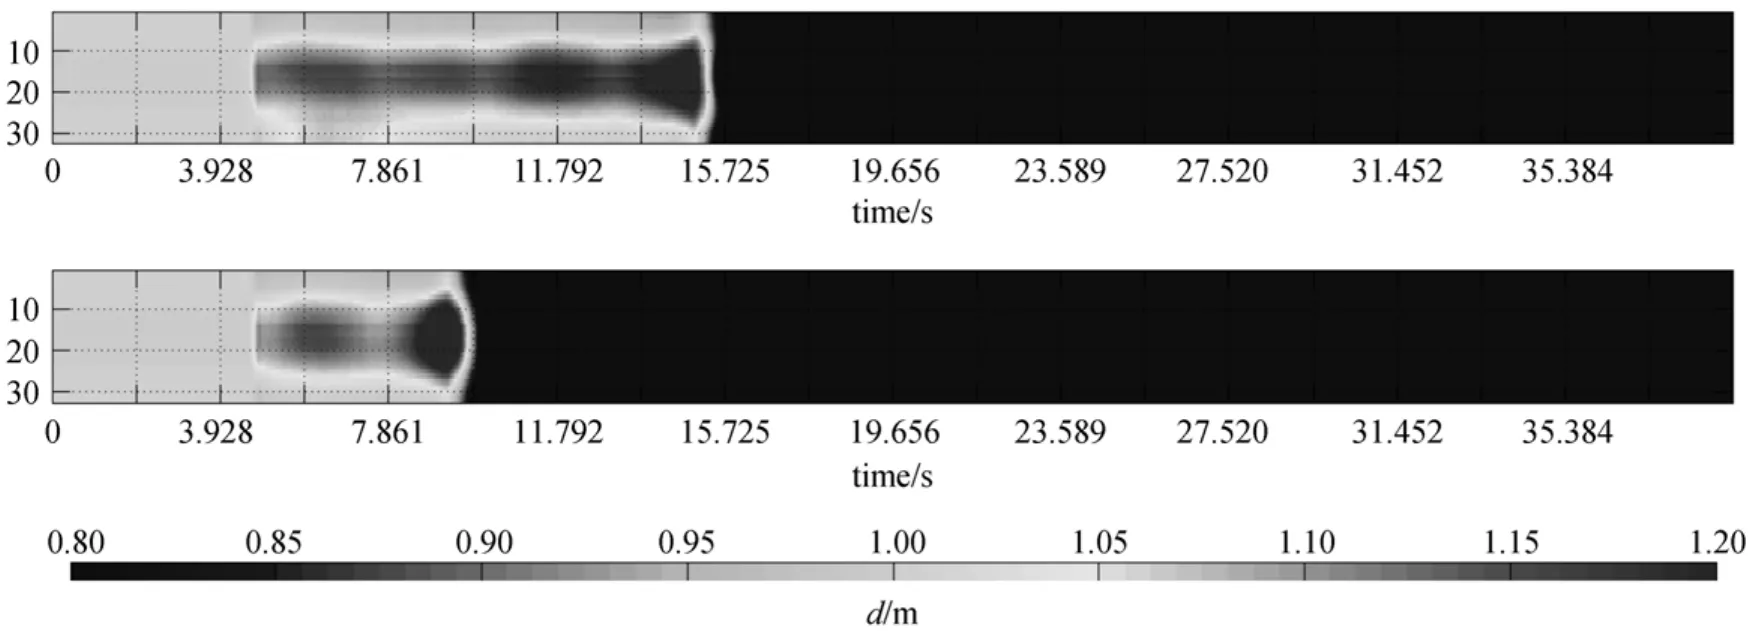
Figure 7 Tomographic visualization of concentration changes for loose sand and rough silo walls along time (sensor location: bottom h=1.0 m, top h=1.5 m)
For loose sand and rough silo walls, bulk solid is subject to contractancy in central cross-section region[pixel p(1,15)] and dilatancy in wall-adjacent zone[pixel p(15,15)], as seen in Figs. 6 and 7. Pair of characteristics dropping at about 10 s time is for sensor height h 1.5 m, and pair of characteristics dropping at about 16 s is for sensor location at h 1 m. In a cross-section centre, for both h=1.0 m and h 1.5 m the material undergoes contractancy by ~12% (compared to initial value) at the moment when the material starts to flow, and afterwards the contractancy continues gradually. When material surface approaches the upper boundary of sensing electrodes, the contractancy reaches ~20%. For a wall-adjacent region, (h 1.0 m and h=1.5 m), transient concentration increases to~3% of initial value, and afterwards the dilatancy occurs. The dilatancy at both h=1.0 m and h 1.5 m reaches ~8% before material surface approaches upper boundary of electrodes. The thickness of shear zone along silo wall is about 20 mm. When comparing these results for rough wall with those for smooth wall,the shrinkage of the region where the sand concentration rises (with respect to initial stage) can be noticed on Fig. 7. This is due to shear zone, which is more significant by the wall.
Finally presented are experimental results with compressed sand and rough silo walls. The bulk solid is subject to dilatancy in both central cross-section region [pixel p(1,15)] and wall-adjacent zone [pixel p(15,15)], as shown in Figs. 8 and 9. Pair of characteristics dropping at about 12 s time is for sensor height h=1.5 m, and pair of characteristics dropping at about 18 s is for sensor location at h=1 m. In the cross-section centre, for both h=1.0 m and h 1.5 m the material undergoes transient contractancy by ~4%(compared to initial value) at the moment when the material starts to flow, and afterwards the dilatancy occurs gradually. In the next phase, the dilatancy reaches ~30% at h 1.0 m and ~35% at h=1.5 m. In a wall- adjacent region, at h=1.0 m and h=1.5 m, in contrast to loose sand and smooth wall experiment,initial concentration does not rise transiently. Firstly,for both sensors, the concentration does not change at all, and afterwards, when material surface approaches the upper boundary of sensing electrodes, the dilatancy reaches ~18% of initial value. However, because of unsymmetrical flow (Fig. 9), the thickness of shear zone could not be determined undisputedly.
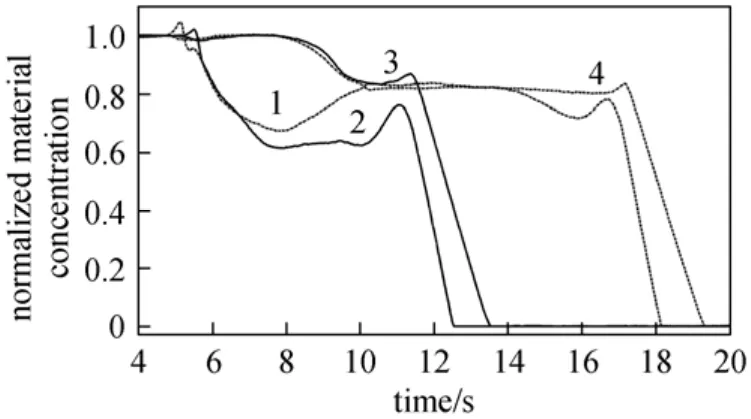
Figure 8 Changes of compressed sand concentration for rough silo walls [line: h 1.5 m, dashed line: h=1.0 m; 3, 4:in silo wall area, with the values of wall-adjacent pixel p(1,15); 1, 2: in centre area, with the values of pixel p(15,15)]

Figure 9 Tomographic visualization of concentration changes for compressed sand and rough silo walls along time axis(sensor location: bottom h=1.0 m, top h=1.5 m)
In above results, changes of concentration are noticeable. For the gravitational flow of loosely packed bulk, the rise of concentration is visible in considerable area of sensor space. This effect is caused by possible movements of sand particles in all directions.Loose sand is not filling the volume in such significant level as dense sand—its initial porosity is greater than that of dense sand. This is clearly visible especially in the central part of silo. In the region at silo walls the concentration cannot increase to such level as that in the centre of silo. In the initial stage, measured material concentration at silo wall is higher than in silo centre, which is caused by silo filing realized by using funnel. After opening the silo outlet, for loose sand, material concentration has risen, however for silo wall area the increment is smaller than for silo centre, in comparison to the initial stage (where real initial concentration is higher for silo wall area) (Fig. 3).For dense sand, after the initial concentration increases,one can observe the decrease of concentration. This is especially noticeable for the sensor located at height 1.0 m (Fig. 5). Increase of wall roughness greatly influences material concentration changes in whole silo section. For slim silos, it is most important to analyse the region near silo walls, since there exist a dangerous phenomenon: resonance caused by moving particles by the container wall. The dark colour on topogram images indicates non-symmetrical flow; material did not flow symmetrically in the centre of silo centre. The flow core was shifted a bit towards the silo wall. Such phenomena take place especially for dense sand and rough wall, which mean that these conditions tend to increase possibility of the non-symmetrical flow occurrence.
The presence of sandpaper stacked to the wall causes a shear zone to appear, which in turn decreases the interaction between material particles and silo structure. This effect can be observed especially in the case of loose sand (Fig. 6), where bulk solid concentration in the next-to-the-wall region is lower than that before opening the outlet of the silo. In order to monitor the changes in this region of interest, a method of tomography image analysis is proposed in the next section.

Figure 10 Tomographic visualization of concentration changes in full reconstructed cross-section for loose sand at sensor height h=1.0 m and time 7 s for silo discharging
4 DETERMINATION OF SHEAR ZONE PARAMETERS
Analysis on reconstruction images for concentration changes of bulk solid flow enables the determination of shear zone thickness along silo walls. The following analysis was conducted for loose sand experiment and sensor height h=1.0 m. In the case of smooth silo walls, the material in wall-adjacent zone did not undergo dilatancy (compared to initial state) as it went for rough walls, and its concentration (determined by the reconstructed tomography images) did not changed [Fig. 10 (a)]. In the case of rough walls,the shear zone occurred in wall-adjacent region, and the dilatancy reached ~5%-8% of initial state [Fig. 10(b)]. The thickness of shear zone, determined with simplified approximation of pixel number (the method is described below), was ~20 mm. Unfortunately, because of flow asymmetry, it is not possible to determine the influence of initial sand compression on the shear zone size. However, the previous work has showed that the increase of initial packing density results in a decrease of shear zone [12, 13].
In order to determine the shear zone parameters(e.g. concentration and size), the reconstructed image processing method was applied. Distinct phases of applied image processing algorithm are presented in Fig. 10 for loose sand and rough wall. The first step is to determine the indices of all the pixels belonging to the shear zone, according to the following formula [22, 23]:

with i{1,··, M},C is a mean of normalized capacitance records (parallel normalization scheme is applied),ε is the mean of normalized image pixel values,ε(i) is an i-th pixel in image, M is the total number of reconstructed image pixels, m is an empirical constant equal to 0.065, and K is a classification factor.
Each pixel, whose value is below K [Eq. (2)], is categorized as belonging to shear zone, otherwise its value maintains original. The pixels outside the shear zone adopt value of 2 [Fig. 11 (b)]. Because of flow asymmetry for rough walls (low grain sandpaper applied), and some local occurrence of sand particles between sandpaper and silo wall during discharging process, only part of the image was taken for further analysis. It is a circular fragment of the image, which correctly represents the material distribution in a wall-adjacent zone [Fig. 11 (c)]. The second step is to determine the shear zone parameters, e.g. concentration and size. The concentration is calculated as average value for all the pixels belonging to the zone. The evaluation method of shear zone size proceeds in four stages:
(1) indicate pixels pglying on the boundary of the shear zone and rest of cross-section image [Fig. 11(d)], and assign to each of them value of 3;
(2) calculate the distance between image centre and the centre of each of pgpixels;
(3) calculate the average distance dp(for each pixel pg),

where N is the number of pixels lying on the boundary of the shear zone, and i indicates single pixels belonging to the boundary of the shear zone;

Figure 11 Stages with tomography image processing method
(4) the final thickness of shear zone is the difference between the silo radius d and calculated average distance dp.
Determination of shear zone parameters can be conducted in a predefined time period. Fig. 12 presents plots of the shear zone parameter changes (including additional algorithm transient parameters).The parameters are determined over 6.6-13.2 s time.The starting point of analysis is ~1.7 s from the start of silo discharging process (associated with flow stabilization) and the analysis is conducted until the material surface appears at the level of lower sensor location. The calculations show that the shear zone thickness varies between 17.61-24.73 mm, and material concentration is in the range of 0.92-0.94. The average value is 20.68 mm and 0.93, respectively, which is approximately equal to material dilatancy, in wall-adjacent zone, of ~7%. The dilatancy determined using simplified method (on the basis of single image)for loose sand equals ~5% [Fig. 11 (b)]. Evaluated shear zone size corresponds with theoretical considerations [4, 9] and is approved compared to expert knowledge based assessment.
In order to investigate in details the concentration changes in measurement space, the analysis of difference between concentrations in shear zone and in the rest of measurement space can be provided. In this study, this difference in analysed time window is in range of 0.094-0.126, and its average value equals 0.108.
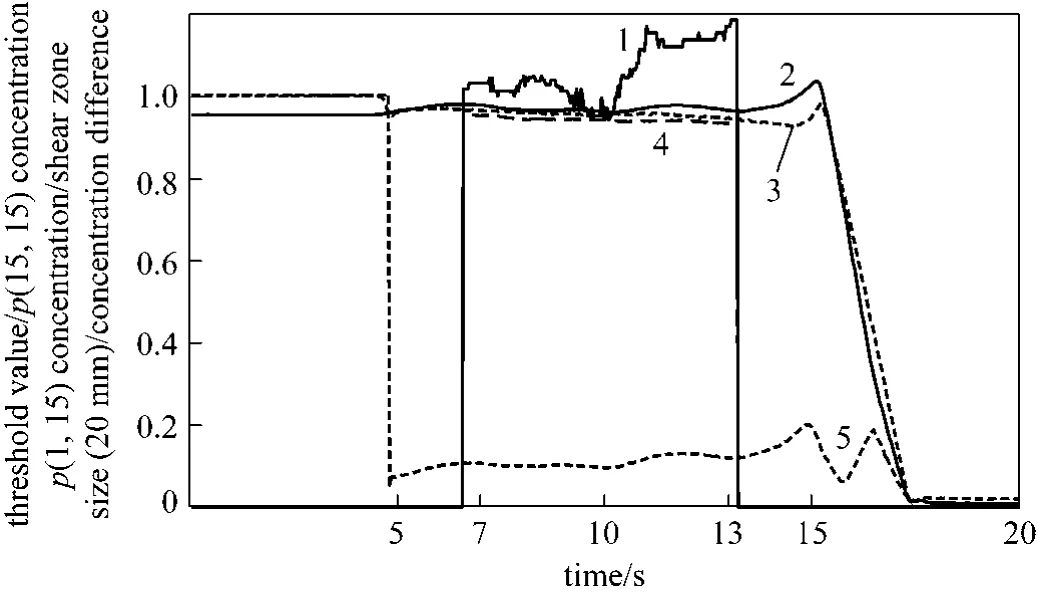
Figure 12 Characteristic plot of shear zone parameter change for bulk solid flow during silo discharging1—shear zone size; 2—threshold value; 3—concentration in centre p (15,15); 4—shear zone concentration p(1,15); 5—concentration difference
There are two important factors to be concerned when dealing with tomography reconstructed image analysis. The first one is the normalization of capacitance values recorded. Results presented in this paper were derived applying the so-called parallel normalization scheme. The previously reported researches [14, 15]show that this type of normalization gives reliable results. It is possible to apply another normalization scheme [24], but it obliges the change of value m from Eq. (2), which is the second factor but requires additional comments. The proper parameter value is derived based on additional experiment with static measurement of material distribution inside ECT sensor space—with sand in the centre of sensor having higher packing density than that located in the next-to-wall area.The derived value m=0.065 gives the best result for distinguishing two different packing densities in ECT images. It is worth to mention that application of this methodology for another size of silo and different ECT sensor would require newly determined parameter value form particular laboratory set-up.
Results shown on Fig. 12 indicate the possibility of monitoring the phenomena taking place on the boundary of bulk solids with the use of proposed methodology. The size and actual concentration in the shear zone is dependent on many factors, such as material type, container geometry and variation between different parts of silo. Determination of the optimal parameters in shear zone (e.g. not introducing any possible thread to the silo) requires additional mechanical computation both on the particulate medium and silo construction. The proposed method is an element of monitoring phenomena occurring in silo flow,and the results obtained should be further investigated and interpreted.
5 CONCLUSIONS
Electrical capacitance tomography enables quantitative analysis of bulk solid flow concentration changes in silos. It is possible to determine the contractancy(concentration rise) and dilatancy (concentration drop)levels of bulk solid for both wall-adjacent and central cross-section flow regions.
The analysis on this research allows concluding the following.
(1) Behaviour of flowing material depends on initial material concentration and silo wall roughness.Loose sand shows a tendency to contract, and compressed sand tends to dilatancy.
(2) In initial stage of discharging process, for rough wall silo, the material hangs up on the walls,resulting in temporary concentration rise in wall-adjacent region, afterwards dilatancy occurs and shear zone develops.
(3) Determination of shear zone size may lead to future ability to evaluate the influence of material concentration changes on the magnitude of material pressure on the silo walls.
(4) Feasibility of shear zone diagnostics in flowing bulk solid will enable precise description of dynamic effects through concentration changes with the propagation detection at the initial silo discharging stage.
NOMENCLATURE
C mean of normalized capacitance values
d diameter of silo, m
dodiameter of silo outlet, m
dpaverage distance of the pixel
d50medium diameter of grain of sand, mm
e0porosity factor
h height of silo, m
K classification factor
M total number of reconstructed image pixels
m empirical constant ( 0.065)
N number of pixels lying on the boundary of the shear zone
n number set of capacitance measurements
pgpixels lying on the boundary of the shear zone and rest of crosssection image
p(x,y) pixel coordinates in reconstructed image matrix 32×32
rwroughness of silo wall, mm
t wall thickness of silo, m
ε mean of normalized image pixel values
?(i) i-th pixel in image
ρ volumetric mass, kg·m?3
Subscripts
g boundary pixel
o outlet
p pixel
w wall
1 Horabik, J., Schwab, C.V., Ross, I.J., “Non-symmetrical loads in a model grain bin during eccentric discharge”, Trans. ASAE, 35 (3),987-992 (1992).
2 Munch-Andersen, J., Nielsen, J., “Pressures in slender grain silos.Measurements in three silos of different sizes”, In: 2nd European Symposium on the Stress and Strain behaviour of Particulate Solids-Silo Stress, Praha, Czehoslovakia (1990).
3 Zhong, Z., Ooi, J., Rotter, J., “The sensitivity of silo flow and wall stresses to filling method”, Eng. Struct., 23, 756-767 (2001).
4 Niedostatkiewicz, M., Tejchman, J., “Experimental and theoretical studies on resonance dynamic effects during silo flow”, Powder Handl. Process., 15 (1), 36-42 (2003).
5 Wilde, K., Rucka, M., Tejchman, J., “Silo music—Mechanism of dynamic flow and structure interaction”, Powder Technol., 186 (2),113-129 (2008).
6 Niedostatkiewicz, M., Tejchman, J., “Reduction of dynamic effects during granular flow in silos”, Bulk Solids Powder Sci. Technol., 1(3), 51-55 (2008).
7 Tejchman, J., “Dynamic phenomena in model silos”, Internal Report of Institute for Rock and Soil Mechnics, Karlsruhe University, Thailand (1987).
8 Nielsen, J., Ruckenbrod, C., “A note on dynamic phenomena in silos”, In: Proc. Int. Conf.: Silos-Forschung und Praxis, Karlsruhe,Thailand, 191-209 (1988).
9 Tejchman, J., “Silo-quake—Measurements, a numerical polar approach and a way for its supsion”, Thin Wall. Struct., 31 (1-3),137-158 (1998).
10 Wensrich, C., “Experimental behaviour of quaking in tall silos”,Powder Technol., 127, 87-94 (2002).
11 Muite, B.K., Quinn, F.S., Sundaresan, S., Rao, K.K., “Silo music and silo quake: Granular flow-induced vibration”, Powder Technol., 145,190-202 (2004).
12 Dhoriyani, M.L., Jonnalagadda, K.K., Kandikatla, R.K., Rao, K.K.,“Silo music: Sound emission during the flow of granular materials through tubes”, Powder Technol., 167, 55-71 (2006).
13 Buick, J.M., Chavez-Sagarnaga, J., Zhing, Z., Ooi, J.Y., Pankaj,D.M., Cambell, D.M., Greated, C.A., “Investigation of silo-honking:Slip-stick excitation and wall vibration”, J. Eng. Mech. ASCE, 131(3), 299-307 (2005).
14 Grudzien, K., Romanowski, A., Chaniecki, Z., Niedostatkiewicz, M.,Sankowski, D., “Description of the silo flow and bulk solid pulsation detection using ECT”, Flow Meas. Instr., 21 (3), 198-206 (2010).
15 Chaniecki, Z., Dyakowski, T., Niedostatkiewicz, M., Sankowski, D.,“Application of electrical capacitance tomography for bulk solids flow analysis in silos”, Part Part Syst. Char., 23 (3-4), 306-312 (2006).
16 Romanowski, A., Grudzien, K., Williams, R.A., “Analysis and interpretation of hopper flow behaviour using electrical capacitance tomography”, Part Part. Syst. Char., 23 (3-4), 297-305 (2006).
17 Chaniecki, Z., Sankowski, D., “Monitoring and diagnosis of dynamics states using process tomography”, In: Diagnostics of Processes and Systems, Korbicz, J., Patan, K., Kowal, M., eds., Academic Publishing House, Warszawa, Poland 387-394, 456 (2007). (in Polish)
18 Plaskowski, A., Beck, MS., Thorn, R., Dyakowski, T., Imaging Industrial Flows: Applications of Electrical Process Tomography, IOP Publishing, Bristol, UK, 232 (1995).
19 Williams, R.A., Beck, M.S., eds., Process Tomography—Principles,Techniques and Applications, Butterworth-Heinemann, Oxford, UK,507 (1995).
20 Yang, W.Q., Peng, L., “Image reconstruction algorithms for electrical capacitance tomography”, Meas. Sci. Technol., 14, r1-r14 (2003).
21 Lionheart, W.R.B., “Review: Developments in EIT reconstruction algorithms: Pitfalls, challenges and recent developments”, Physiol.Meas., 25, 125-142 (2004).
22 Xie, C.G., Huang, S.M., Beck, M.S., Hoyle, B.S., Thorn, R., Lenn,C., Snowden, D., “Electrical capacitance tomography for flow imaging: System model for development of image reconstruction algorithms and design of primary sensors”, IEE Proc., G Circuits, Devices and Systems, 139 (1), 89-98 (1992).
23 Peng, L., Yao, D., Zhang, B., “Regularization based image reconstruction for electrical capacitance tomography”, In: 2nd World Congress on Industrial Process Tomography, Hannover, Germany,144-150 (2001).
24 Guo, Z.H., “New normalization method of imaging data for electrical capacitance tomography”, In: International Conference on Mechatronic Science, Electric Engineering and Computer, Jilin,China, 1126-1130 (2011).
2011-12-07, accepted 2012-01-09.
* Supported by the Polish Ministry of Science and Higher Education in 2009-2012 as a research project (3687/B/T02/2009/37).** To whom correspondence should be addressed. E-mail: androm@kis.p.lodz.pl
 Chinese Journal of Chemical Engineering2012年2期
- Chinese Journal of Chemical Engineering的其它文章
- Optimization for Production of Intracellular Polysaccharide from Cordyceps ophioglossoides L2 in Submerged Culture and Its Antioxidant Activities in vitro*
- A Pilot-scale Demonstration of Reverse Osmosis Unit for Treatment of Coal-bed Methane Co-produced Water and Its Modeling*
- Temperature-triggered Protein Adsorption and Desorption on Temperature-responsive PNIPAAm-grafted-silica: Molecular Dynamics Simulation and Experimental Validation*
- Adsorptive Thermodynamic Properties and Kinetics of trans-1,2-Cyclohexandiol onto AB-8 Resin
- Tracking Submicron Particles in Microchannel Flow by Microscopic Holography*
- Oxidation of p/o-Cresols to p/o-Hydroxybenzaldehydes Catalyzed by Metalloporphyrins with Molecular Oxygen*