
Performance Evaluation of Public Bus Transportation by Using DEA Models and Shannon’s Entropy: An Example From a Company in a Large City of China
2021-04-13 10:47:22ZichengLiuNaiqiWuFellowIEEEYanQiaoMemberIEEEandZhiwuLiFellowIEEE
Zicheng Liu, Naiqi Wu, Fellow, IEEE, Yan Qiao, Member, IEEE, and Zhiwu Li, Fellow, IEEE
Abstract—The purpose of this paper is to assess the operational efficiency of a public bus transportation via a case study from a company in a large city of China by using data envelopment analysis (DEA) model and Shannon’s entropy. This company operates 37 main routes on the backbone roads. Thus, it plays a significant role in public transportation in the city. According to bus industry norms, an efficiency evaluation index system is constructed from the perspective of both company operations and passenger demands. For passenger satisfaction, passenger waiting time and passenger-crowding degree are considered, and they are undesirable indicators. To describe such indicators, a superefficient DEA model is constructed. With this model, by using actual data, efficiency is evaluated for each bus route. Results show that the DEA model with Shannon’s entropy being combined achieves more reasonable results. Also, sensitivity analysis is presented. Therefore, the results are meaningful for the company to improve its operations and management.
I. INTRODUCTION
AS a part of urban infrastructure, public transport plays an important role in the economic development and every one’s daily life, and has a pilot effect on the urban economy,especially for large cities. For resource-saving, environment protection, sustainable development, and congestion reduction, it is of a high priority to develop public transport.Therefore, efficient operations of a public transportation system are a critical issue. For efficiency, the general purpose of bus operators is to reduce operating expenses while meeting passenger demands. Therefore, on the one hand, in the viewpoint of a bus operator, the performance is reflected by corresponding inputs and outputs, and can be assessed by indicators of overall cost efficiency, vehicle utilization, and labor utilization. On the other hand, in the viewpoint of passengers, a public transport should make passengers feel that their daily travel demands can be met at a lower cost. In other words, the performance should also be measured by service utilization (number of passengers), service satisfaction, and service quality [1]. Thus, to efficiently operate a public transport system, the performances from the viewpoints of both the operator and passengers should be taken into account.
Therefore, for the evaluation of public transport performance, it involves multiple inputs and multiple outputs.Many scholars regard public transportation services as production processes with multiple inputs and outputs.Presently, public transportation operation performance evaluation methods can be mainly classified into two categories: 1) non-parametric analysis methods represented by data envelopment analysis (DEA) [2]–[6], and 2) parametric analysis methods represented by stochastic frontier analysis(SFA) with super logarithm production function models[7]–[10]. In the use of parametric analysis, it is necessary to clarify function structures and there are different function structures in the existing parametric analysis methods. Since there is no corresponding theoretical basis for a cost structure,it is impossible to determine which function setting form is reasonable, leading to that such a type of methods is difficult to be applied. However, there is no such a problem if a nonparametric analysis method is applied. Furthermore, the evaluation problem can be expressed in a physical form when multiple-input and multiple-output descriptions are formulated[11]. Therefore, the non-parametric analysis is widely used for performance evaluation of public transportation systems. In this paper, a non-parametric analysis method is adopted to evaluate the performance for a case problem.
DEA is the typical representative of non-parametric analysis methods. In 1957, economist Farrell proposed a method for measuring the efficiency of decision-making units (DMUs)with single-input and single-output [12]. However, in practical applications, people encounter problems that are essentially of multiple inputs and multiple outputs. To solve this problem, in 1978, the basic C2R model was proposed by Charnes et al.[13]. It extends the engineering efficiency of single-input and single-output to multiple inputs, especially in the evaluation of the efficiency of multi-output DMUs. It uses a corresponding data planning model to evaluate the relative efficiency of departments or units with multiple inputs and multiple outputs. It is judged whether it is efficient based on the observation data of each DMU. Essentially, it is judged whether a DMU is on the frontier of the possible production set. When this method is used to study the multiple-input and multiple-output production function theory, it shows great advantages in avoiding subjective factors, simplifying algorithms, and reducing errors, since it does not need to estimate parameters in advance. The DEA model is then extended further.
In performance evaluation of public transportation operations, a C2R-DEA model is used to obtain positive correlations between different outputs by using data from 256 public transportation systems over the past five years in the United States [2], meaning that the size of the economy depends on the output. In [3], the author uses a BC2-DEA model and the Malmquist productivity index to evaluate the merger of bus companies. The study in [4] uses a C2R-DEA model to evaluate the working day data of 46 bus routes in US public transportation companies. Reference [5] uses a C2RDEA model combined with Tobit regression analysis and truncated regression analysis to evaluate the operational efficiency of public transport companies in 10 cities in India during 1989–2004 and the impact of external indicators on this efficiency. The work in [6] uses a super-efficient C2RDEA model combined with entropy theory to evaluate 13 transportation operators in the Yangtze River Delta region of China. In the above-mentioned studies [2]–[5], traditional DEA models are applied to evaluate the performance of systems. By these models, one cannot compare the indicators when some efficiency scores obtained based on a model are greater than 1. Thus, to solve this problem, this paper adopts the super-efficient DEA model.
Some recent studies focusing on transport performance evaluation by using DEA models are as follows. In [14], it uses a slacks-based measure (SBM) DEA model considering the undesirable outputs to evaluate the changes in the environmental efficiency of the transportation sector in 30 Chinese provinces from 2003 to 2012. In [15], it formulates an SBM DEA model considering undesirable outputs with parallel computing design for the big data to evaluate the environmental efficiency of transportation systems. A DEA model is used in [16] to examine transport modes with data from airlines, transit and freight rails, and it is found that the substitution and transformation of the data have an impact on the result. The work in [17] uses an SBM DEA model combining factor analysis to evaluate the regional transport sustainability efficiency.
Nowadays, transportation companies rely also on government subsidies. Therefore, government subsidies have a significant effect on operations of public transportation [18].For a bus company, government subsidies should be utilized in an efficient and reasonable way. Hence, the management of a public transportation enterprise is very important and there are studies on this issue. These studies are done mainly from the perspective of the management of a bus company[19]–[21]. However, we lack studies on performance evaluation of public transportation companies from the perspective of passengers. Note that it is critical to consider the passengers’ satisfaction when performance is evaluated.This motivates us to conduct this study and this work evaluates the bus company operational performance from the aspects of both bus company management and passengers’satisfaction.
This study is done based on a case study from a very large city in China. The bus company for this case study is one of the major public transport companies of the city. The first bus route in this city was run by this company in 1975. Until September 2017, there are totally 1019 bus routes operated by different public bus companies in the city. Different from most of cities in China, in this city, for public transportation bus routes, there are many different operational modes,including bus routes named as Main-Line, Branch, Express,Inter-City, Night, Peak, and Holidays. Generally, the Main-Line bus routes are operated on the backbone roads with a distance from end to end being more than 10 km and serve for most part of passengers in the city. Hence, these bus routes play an important role in the public transportation for the city.This work focuses on such bus routes.
The efficiency of public transportation operations depends on input and output indicators. Thus, it is crucial to properly choose input and output indicators. There are many indicators that affect the operations of public transportation and indicators that potentially affect bus operations. Traditionally,input indicators for public transportation systems include capital, labor, and energy, while generally output indicators include vehicle mileage, seat mileage, passenger mileage, and passenger income [22]–[26]. Public transportation systems may affect their stakeholders in many different ways. For example, bus operators strive to work under certain financial constraints and passengers mainly care about their travel time and travel expenses. In [6], government’s subsidies are considered to be an input indicator, while passenger satisfaction is taken as an output indicator. In this paper, we make comparisons of various bus routes for the Main-Lines in the city. Since the government gives subsidies to bus companies, the government subsidy cannot be used as an objective and it is the utilization of various resources by bus companies that should be considered. For passenger satisfaction, a survey is presented in [6].
In this paper, we use actual vehicle data for performance evaluation such that the obtained results are more objective. It should be pointed out that undesirable output indicators have significant effect on the performance of public transportation.In order to take undesirable output indicators into account,undesirable DEA models are formulated and they are combined with DEA models without undesirable factors,leading to mixed DEA models. On the other hand, the number of input and output indicators affects the results of the model too. In general, a DEA model with more indicators can make more DMUs efficient (the obtained efficiency scores become larger), but its discrimination ability is reduced. Also, a model with fewer indicators may not adequately evaluate the performance of a system [27]. This means that the value of efficiency score is affected by the number of input and output indicators. On the other hand, it may happen that, with a super-efficient DEA model, the most productive scale size(MPSS) units may not have the best rank among the efficient units [28]. This implies that a mixed super-efficient DEA model is not effective for the case in this paper.
With the above observation in mind, in order to solve this problem, this paper constructs a DEA model with Shannon’s entropy being combined by modifying the mixed superefficient DEA model. This approach has some theoretical and application advantages. When we use this method, the MPSS units get the best rank and the interior points of the smallest production possibility sets (PPSs) which are inefficient in all models get the worse rank [28]. With Shannon’s entropy, if its value is large, the amount of information provided is small, so is its weight. On the other hand, if its value is small, the amount of information provided is large, so is the corresponding weight. Hence, the model here is different from a regular mixed DEA model and it is its modification by embedding Shannon’s entropy that makes such improvements.The proposed approach will be compared with the regular mixed DEA models to show its advantages.
This study contributes to the performance evaluation of public transport services in the following ways: 1) in this paper, we modify a mixed DEA model with undesirable outputs and super-efficiency being considered by embedding Shannon’s entropy into it. With Shannon’s entropy being combined, better evaluation results are achieved; 2) this paper evaluates the performance of the main bus routes operated on the backbone roads by considering the indicators from the perspectives of both operators and passengers. In this way, a comprehensive framework is proposed to consider various indicators; and 3) the results obtained by the proposed model is compared with the regular mixed DEA models to show its advantages.
In this article, the research target is to evaluate public transport system by addressing the main routes from a bus company. The next section introduces the DEA methodology and presents the modified mixed DEA model by embedding Shannon’s entropy into it. Then, Section III constructs the performance evaluation system. With the model, the results and analysis are given in Section IV. Finally, Section V concludes this paper.
II. METHODOLOGY
A. Overview of DEA
DEA is a non-parametric analysis method for measuring efficiency of a system, which originates from the work in [12].In 1978, Charnes et al. proposed a DEA Model called C2R model based on the concept of multiple-input and multipleoutput engineering efficiency [13]. In 1984, without using the cone-like hypothesis, Banker et al. proposed another DEA model called BC2model to evaluate the performance of production technology [29], [30]. Meanwhile, Fare and Grosskopf build a DEA model called FG model that satisfies non-increasing returns to scale [31]. In 1990, Seiford and Thrall developed a DEA model called ST model that satisfies the non-decreasing returns to scale [32]. The above four models are the classic DEA models, which constitute a complete system for the evaluation of returns to scale.
Since a C2R model is a fractional programming, the Charnes-Cooper transformation can be used to normalize a C2R model to an equivalent linear programming formulation.Then, with the dual theory of linear programming, the dual model of a C2R model can be obtained, which is very important and has the following advantages. It is known that it is difficult to judge the efficiency of a system modeled by a DEA in its original form. When its dual model is obtained,Archimedes Infinitesimal is introduced into the model such that the efficiency of a decision unit can be easily judged.
Through the dual programming, the relationship between the DEA model and the corresponding multiple-objective Pareto efficiency of a modeled system can be discussed. In this way, the DEA method offers a possibility to describe the production function theory.
The dual model can be also used to judge whether an input of each decision-making unit is appropriate or not, and to provide the decision-making unit with capability to adjust the input and expand the possible direction and extent of outputs.Therefore, it has a unique advantage.
The basic DEA models described above yield a maximum efficiency score of 1 for some DMUs, while the efficiency score is less than 1 for other DMUs. For DMUs with efficiency score being less than 1, one can rank the DMUs according to their efficiency scores. Thus, one can distinguish the performance of these DMUs. However, for DMUs with efficiency score being equal to 1, one cannot compare the efficiency among them. In order to make a better comparison of efficiency of such individual DMUs, a super-efficient DEA model is proposed in [33] and expanded in [34] to further compare and rank the performance of DMUs. For superefficiency, if the efficiency score is less than 1 for a DMU, the efficiency score is consistent with the results obtained by the corresponding basic DEA model. If the efficiency score of a DMU is greater than 1, the efficiency score is set to be 1 in the corresponding basic DEA model.
When using the DEA method to evaluate the production or operational efficiency of an economic system, it is usually that the larger the output is, the better the performance of a system is. All the above models evaluate the performance based on such a criterion. In this paper, we have output data that are not the expected ones, i.e., there are undesirable outputs. By undesirable outputs, it means that a larger output may not lead to a better performance. For the case of a DEA model with undesirable outputs, article [35] first mentions that the production process may also generate undesirable outputs.This issue is first considered in the DEA model in [36]. The work in [37] summarizes the main methods for treating undesirable outputs. Treating undesirable outputs as inputs has been widely used in research, for example, [38] evaluates resource and environment with 31 mainland Chinese provinces’ data and [39] evaluates the police departments in Taiwan, China, comprehensively. In [14] and [15],undesirable outputs are also treated as inputs.
When super efficiency and undesirable outputs are combined, a model is built in [40] to measure energy efficiency of 11 provinces in west China from 1989 to 2009.To deal with undesirable indicators, the authors in [40]combine the research results in [41] and think that it is better to take an undesirable output as an input variable. The work in[42] estimates the carbon dioxide emission efficiency of 10 coastal areas during 2006–2014, which is also taken an undesirable output as an input variable. In this paper, this idea is adopted to handle undesirable indicators.
B. The Mixed DEA Models
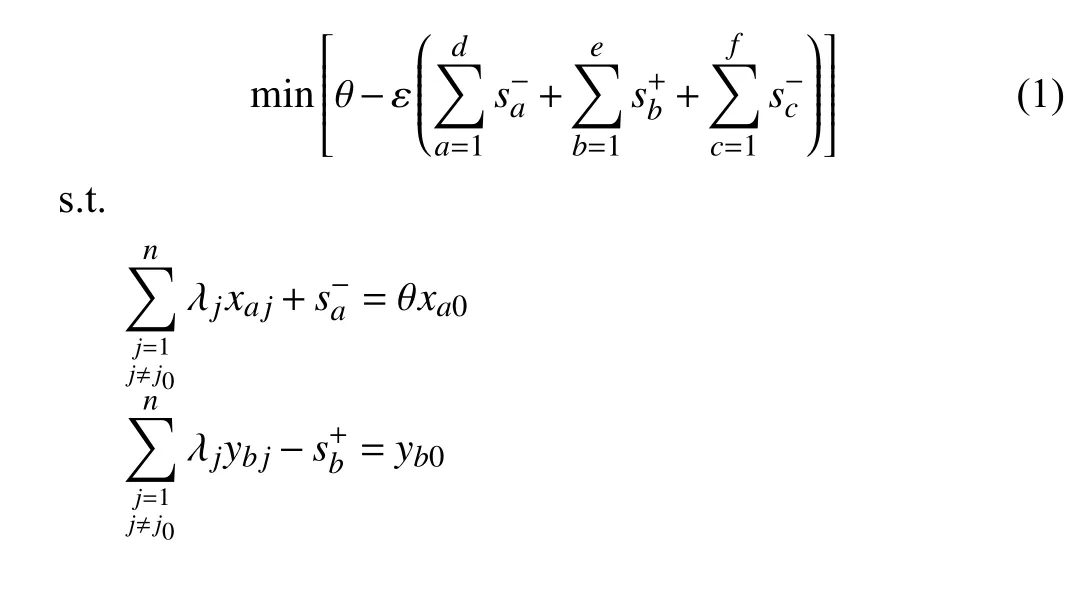
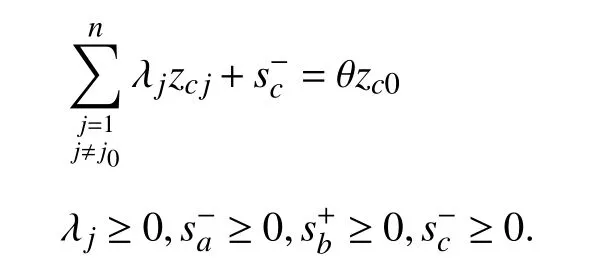
In this paper, in order to better compare the performance of DMUs with higher efficiency scores, a super-efficient DEA model is adopted. However, the output indicators in this paper contain undesirable indicators and the existing super-efficient DEA model is not applicable to such a situation. Thus, a DEA model that can deal with undesirable output indicators is necessary. This paper modifies mixed DEA models presented in [40] to evaluate performance of public bus transportation systems by embedding Shannon’s entropy into them. To present the model, we first introduce the mixed DEA model as follows. Before presenting the model, we give the notation used in this paper.
j ∈{1, 2, …, n}: the index of DMUs,
a ∈{1, 2, …, d}: the index of inputs,
b ∈{1, 2, …, e}: the index of expected outputs,
c ∈{1, 2, …, f}: the index of undesirable outputs,
xaj: the ath input for DMUj,
ybj: the bth expected output for DMUj,
zcj: the cth undesirable output for DMUj,
xa0: the ath input for the selected DMU,
yb0: the bth expected output for the selected DMU,
zc0: the cth undesirable output for the selected DMU,
λj: the non-negative scalars (weight) for DMUj,
With these slack variables, by introducing the Archimedes Infinitesimal, the mixed DEA model is as follows:
C. The Proposed Model With Shannon’s Entropy Being Combined
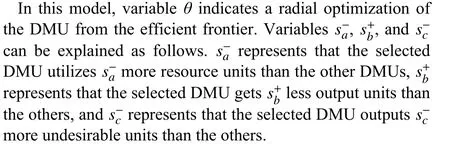
The concept of Shannon’s entropy is established by Shannon [43]. It can be represented as
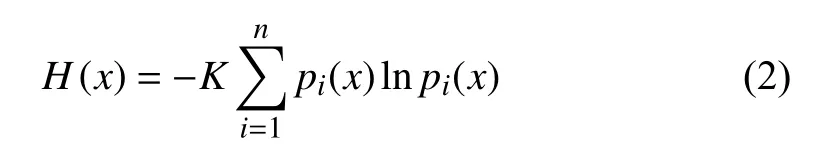
where H(x) represents the information of each signal source,pi(x) is the probability of the ith signal source, lnpi(x)represents the information from the ith signal source, and K is a constant.
Shannon’s entropy plays a central role in information theory, which sometimes is used for uncertainty measure.Based on this theory, each considered model has a weight. If the variation of efficiency score is small, the value of H(x)becomes large. Hence, the information provided by this considered model has a small value. On the contrary, if the variation of the efficiency score is large, the value of H(x)becomes small. Hence, the information provided by this considered model has a significant value. The larger the value provided by the information is, the larger the corresponding weight is, which is used as a measure to evaluate the efficiency of a DMU in this paper by using Shannon’s entropy.
As above discussed, simply using a super-efficient DEA model may result in an unreasonable DMU ranking [28]. Such a model relies entirely on input and output indicators,resulting in a low discrimination ability. As pointed out by the authors in [28], when the super-efficient DEA model is applied, the MPSS units may not be ranked as the best among the efficient units. However, we can take the advantage of Shannon’s entropy in both theory and applications. That is to say, if we embed Shannon’s entropy into the above presented mixed DEA model, we can make the MPSS units rank the best and the inefficient units rank as the worse ones [28].Therefore, in this paper, Shannon’s entropy is combined with a mixed DEA model, which effectively improves discrimination ability and obtains more objective results. We present how Shannon’s entropy is combined with the mixed DEA model as follows.
Based on the above discussion, the idea here is to solve a set of mixed DEA models and, for different mixed DEA models,different subsets of input-output indicators are used. Based on the concept of the information entropy, appropriate weights should be set for each mixed DEA model so as to form a model with Shannon’s entropy being combined. In this way, a more objective evaluation result can be obtained and the formulation of the model is given as follows.
We need to determine an importance degree of each considered mixed DEA model built for different subsets of input-output indicators. There are k subsets and we need to solve k different mixed DEA models denoted as S1, S2, …, Sk.For model Sl( l ∈ {1, 2, …, k}), there is an efficiency score for each DMUj( j ∈{1, 2, …, n}) denoted as Ejlsuch that an n×k matrix E is formed as
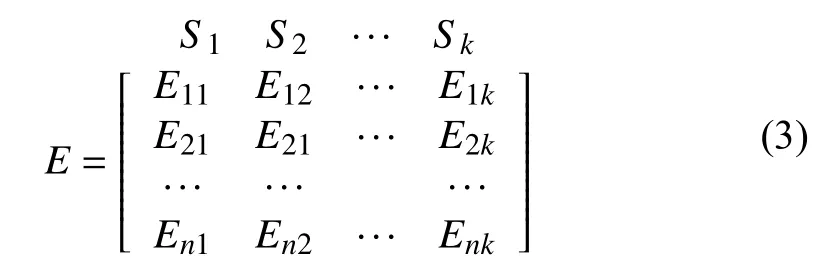
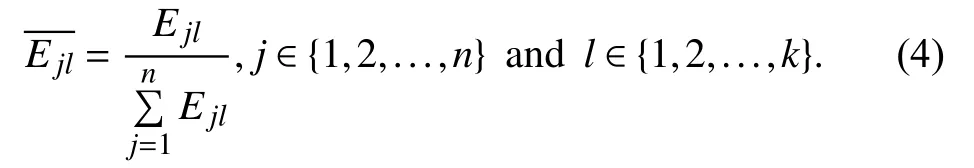
where k = (2d–1) × (2e–1) × (2f–1) with d being the number of inputs, e the number of expected outputs, and f the number of undesirable outputs. Then, we use the following procedure to determine the importance degree of model Sl.
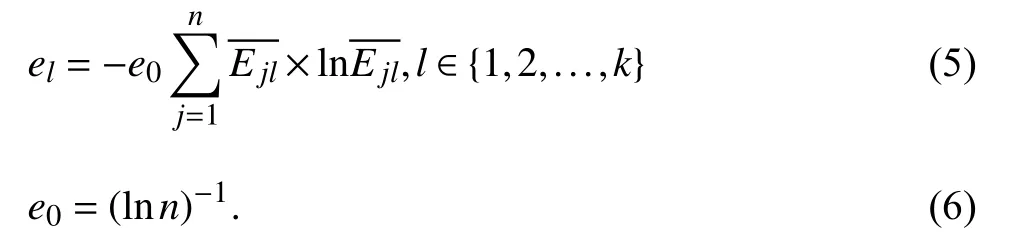
2) Compute the entropy elas
3) Compute the degree of diversification dlas

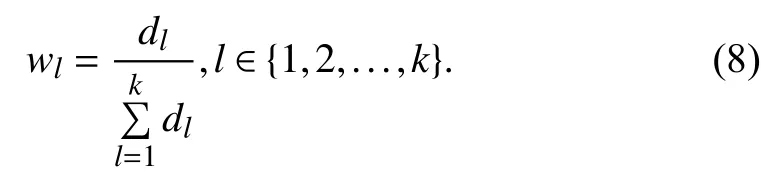
4) Compute the weigh wlof model Slas
Then, the efficiency score βjobtained by the mixed DEA model with Shannon’s entropy being combined can be calculated as
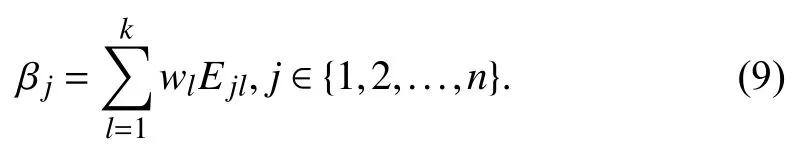
From the above procedure, we can see that, for model Sl, if the efficiency scores for all DMUs are approximately equal,the value of wlis small. With the above results, consider that a solution is obtained for model Slsuch that the scores have the same value and let Ejl= c. Then, for each j ( j ∈{1,2,…,n}),
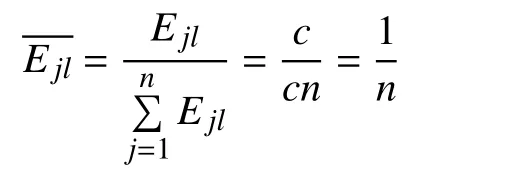
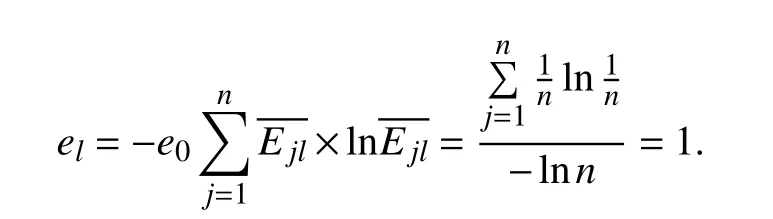
We can obtain dl= 0 and wl= 0, which implies that model Slshould not be considered. Up to now, we have presented the model with Shannon’s entropy being combined and its solution method.
III. PERFORMANCE EVALUATION
The selection of input and output indicators greatly affects the result of efficiency evaluation. Thus, it is critical to determine the input and output indicators. To do so, the following factors should be taken into account: 1) the ability to achieve the purpose of performance evaluation, 2) the purpose of evaluation can be fully reflected, 3) the relationship between inputs and outputs can be revealed, and 4) by the built indicator system for performance evaluation,diversity should be ensured.
A. Input Indicators
The inputs selected in this work are the most commonly used ones in the literature. It is well known that inputs including capital, labor and energy consumption are common input indicators [22]–[26]. In addition, government subsidies also have an impact on bus operations. We treat a bus route in the company as a DMU to evaluate the efficiency of each bus route. This work focuses on the efficiency of utilizing the corporate resources. Since government subsidy is not a resource of a company, it is not treated as an input indicator.With cost factor being taken into account, in the construction of the input indicator system, we take the available fleet size for each bus route and the average frequency of each bus route as inputs in this paper.
Available Fleet Size: To reduce investment and cost, there is an upper limit to the number of buses for each bus route in the company. When the value of this indicator becomes larger,there are more buses available on the corresponding bus route.However, with more buses for a bus route, the corresponding investment becomes higher. Furthermore, for each bus, in addition to the cost resulted from its travelling time, a fixed cost is required, including repair and maintenance cost.
Average Frequency: Average frequency presents the average daily number of trips for a bus route. The more trips a bus company arranges, the higher cost of the company should pay, including the cost of the travelling time and the corresponding drivers’ salaries and wages.
B. Output Indicators
In the studies [22]–[26], the outputs used to measure public transport efficiency are vehicle kilometers, seat kilometers,passenger kilometers, and operating income. In this study, we consider not only the issues which are concerned by the bus operator, but also the issues that are concerned by passengers,which is very important for the performance evaluation of a public transportation system. The output indicators considered in this article are the number of passengers served, revenue of the company and passenger satisfaction. The passengersatisfaction is judged by passenger-crowding degree and passenger waiting time for a bus route.
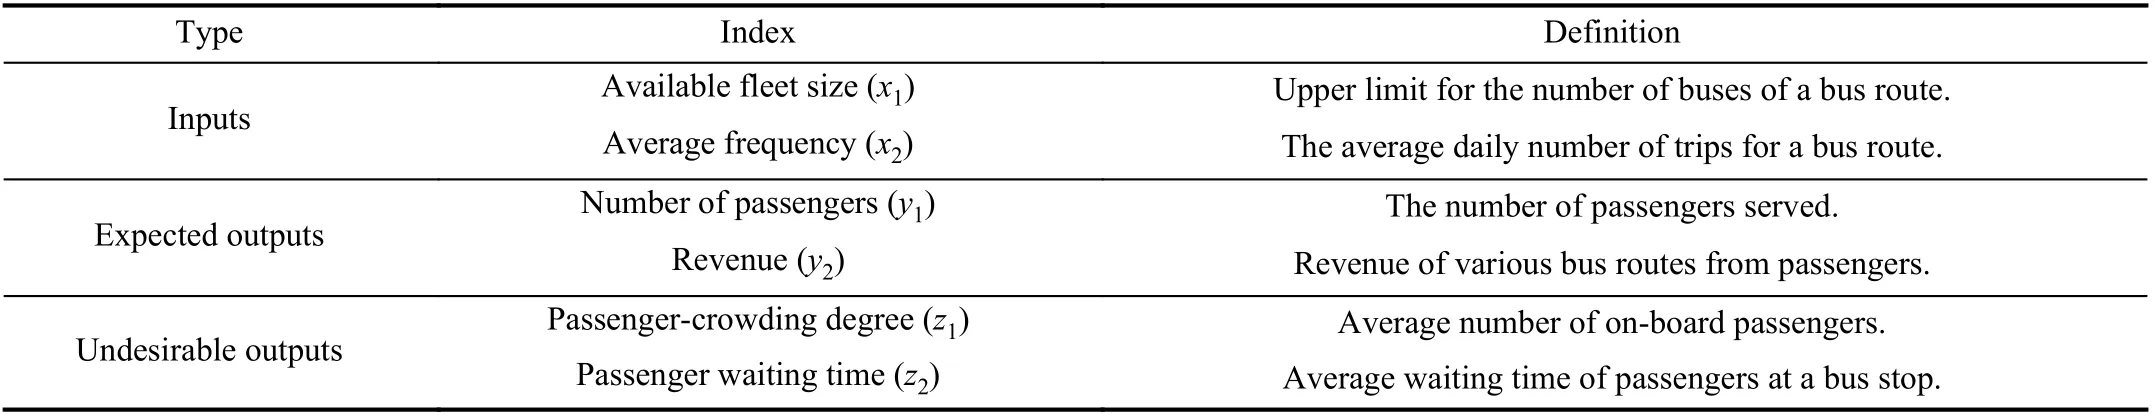
TABLE I INPUT AND OUTPUT INDICATORS AND THEIR DEFINITIONS IN THE MODELS
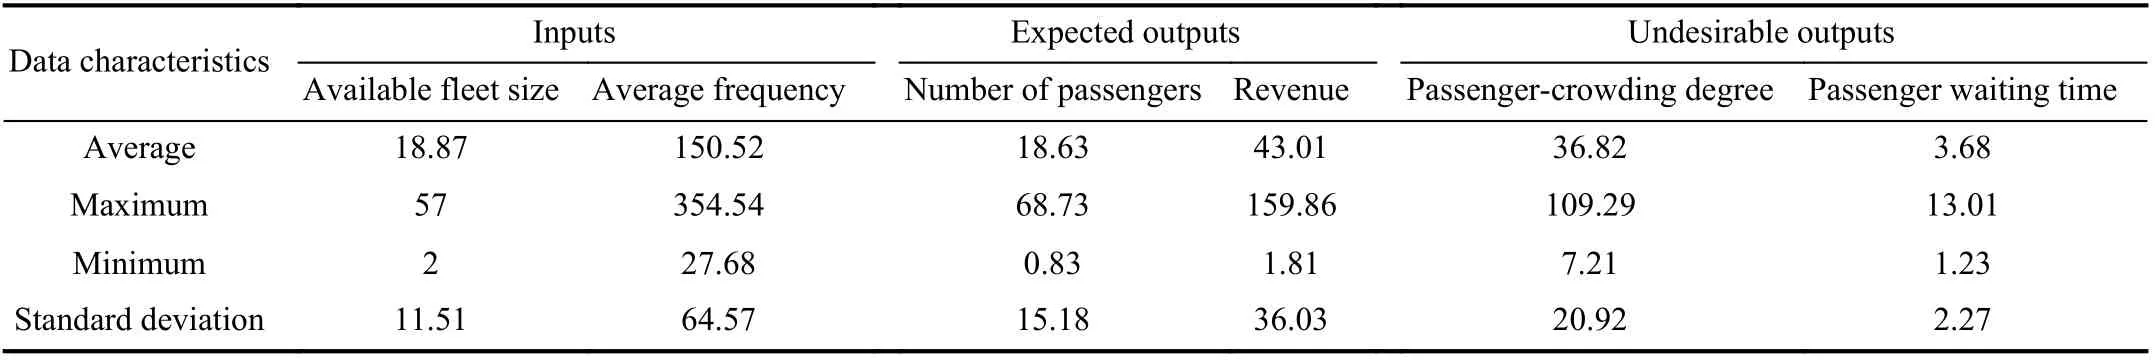
TABLE II INPUT AND OUTPUT DATA CHARACTERISTICS
The Number of Passengers: The number of passengers here is the accumulative number of passengers served by a bus route for the investigation time duration. This indicator is an indicator of expected output.
Revenue: Today, some passengers pay for the bus by using a card, while the others pay it by cash. The revenue of a public bus company contains these two parts during the investigation time. Note that government subsidy is not included in revenue. This indicator is also an indicator of expected output.
Passenger Satisfaction: For passenger satisfaction, this paper selects two indicators for evaluation. They are the passenger-crowding degree for each bus route and the passenger waiting time at a bus stop. Since the buses for the investigating bus routes have approximately the same space,we use the number of on-board passengers to measure the passenger-crowding degree. For the average number of passengers on a bus, it is estimated by frequency and number of passengers. For the passenger waiting time, we estimate the headway by the vehicle operating time and the number of trips. According to the work in [44], it is assumed that the average waiting time of passengers is half of the headway. For these two output indicators, we use the corresponding average to represent them. We notice that these two indicators are undesirable output indicators.
Finally, the input and output indicators for the model are summarized in Table I.
IV. EMPIRICAL ANALYSIS
A. Data Description
The data set used in this investigation was collected during May 2016 from a company in a large city in China. This company operates a large number of bus routes. Among them,there are 37 main routes operating on the backbone roads. The company has a number of branches and its 37 main routes are operated by five branches named Branches 1–5. Each of them operates a number of main routes, respectively. It is meaningful to evaluate the efficiency of different routes. The input indicators include the available fleet size and average frequency for each bus route. Output indicators include expected output indicators and undesirable output indicators.Expected output indicators include the number of passengers served for each bus route and revenue. Undesirable output indicators include passenger-crowding degree and passenger waiting time for each bus route. The input and output data characteristics are summarized in Table II. In Table II,available fleet size is the number of buses for a bus route,average frequency is the average number of round trips per day for a route, the number of passengers is given in ten thousand persons, revenue is given in ten thousand Chinese yuans, passenger-crowding degree is the number of persons in a bus, and passenger waiting time is given in minutes.
B. Results and Analysis
We use the proposed mixed DEA model with Shannon’s entropy being combined developed in Section II to evaluate the performance of the bus routes. There are 37 bus routes under investigation and a bus route is a DMU, leading to 37 DMUs, i.e., j = 37 in the models.
There are two input indicators, i.e., d = 2, two expected output indicators, i.e., e = 2, and two undesirable output indicators, i.e., f = 2. Thus, we have k = (22–1) × (22–1) ×(22–1) = 27. This means that there are 27 models with different indicator subsets that need to be solved. The subsets and their weighs for these models are shown in Table III,where 1 is used to represent that the corresponding indicator is selected in the subset, while 0 is used to represent that the corresponding indicator is not selected in the subset.
With the obtained data, the efficiency scores for the case problem obtained by using these models for all the subsets are shown in Table IV, where MXXX represents a route, Slgives the efficiency scores of the routes obtained by the model forsubset Sl. Thus, the solution obtained by S1is the results for the model given in [40], while βjpresents the efficiency scores of the routes obtained by the model with Shannon’s entropy being combined.
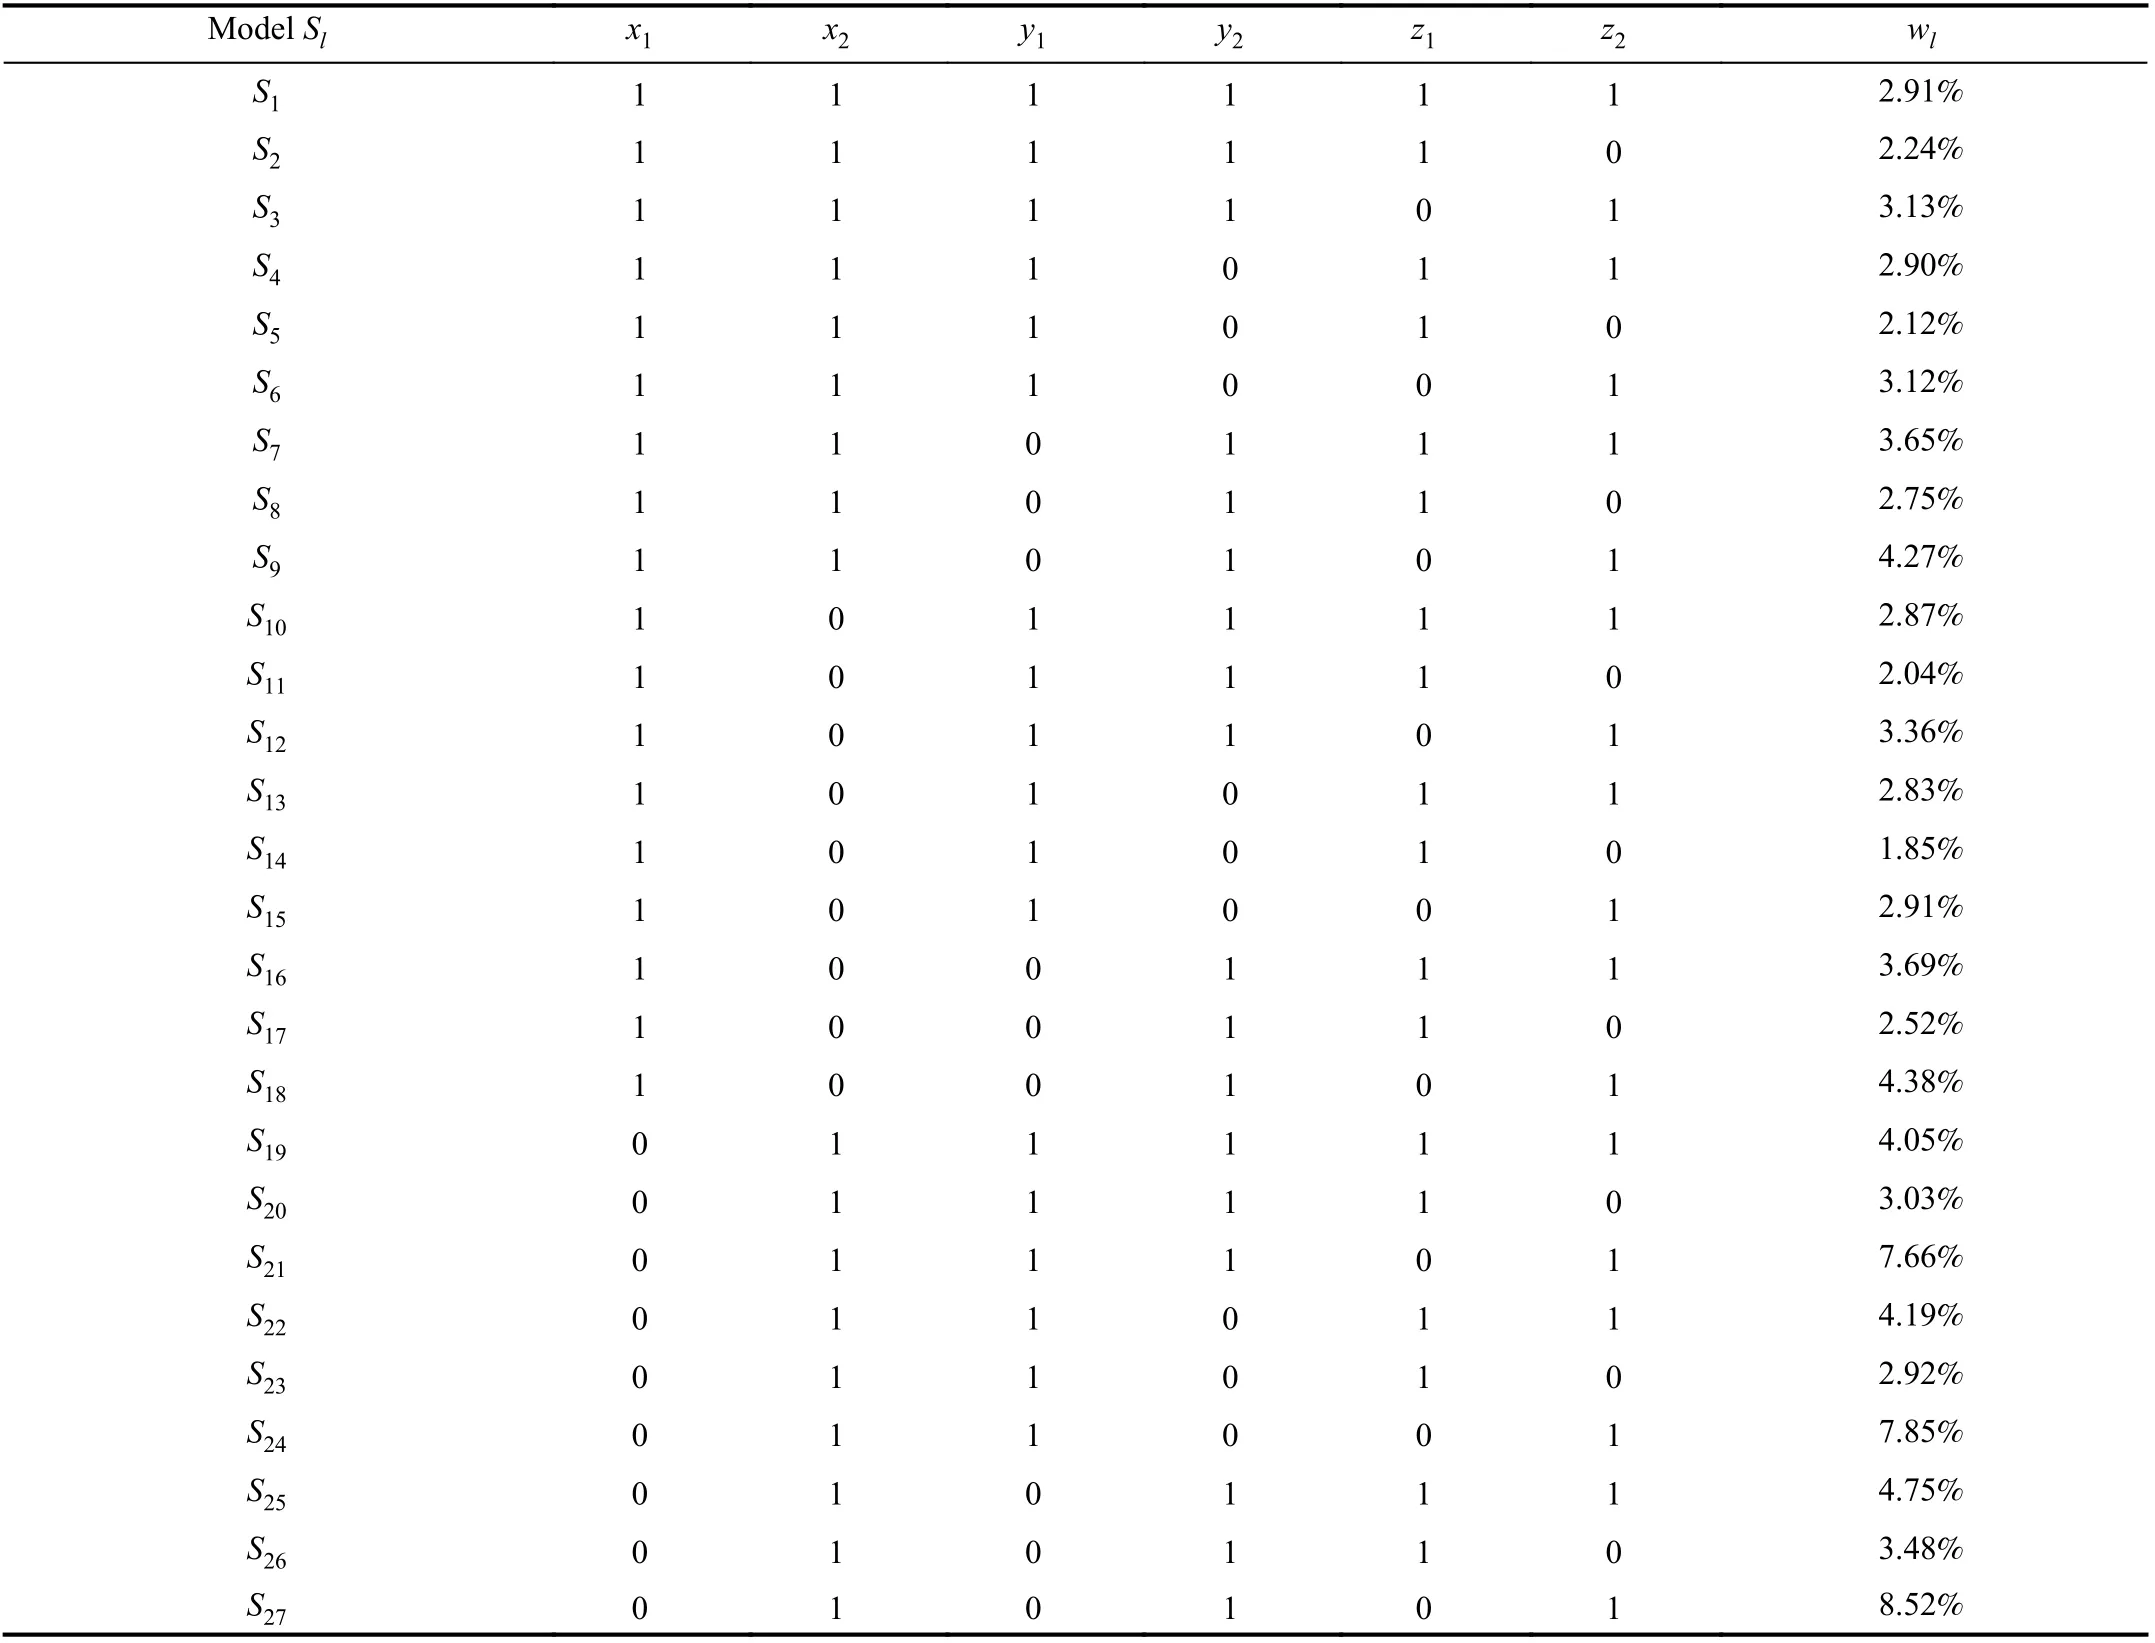
TABLE III THE SUBSETS AND THE WEIGHTS IN THE MODELS

TABLE IV THE EFFICIENCY SCORES OF MODELS

TABLE IV (continued)THE EFFICIENCY SCORES OF MODELS

TABLE IV (continued)THE EFFICIENCY SCORES OF MODELS
As it can be seen from the weights in Table III, there is a tendency that the smaller the selected indicator is, the greater the corresponding weight is. Among the weights, w27= 8.52%and w24= 7.85% are the two highest ones. For them, three indicators are selected. In order to better illustrate this issue,we calculate the average of the weights for the cases where three indicators, four indicators, five indicators, and six indicators are selected, and the results are 4.30%, 3.65%,3.14%, and 2.91%, respectively. This is due to that the efficiency score has a tendency to become large as the number of selected indicators increases. Meanwhile, the variation of efficiency scores has a tendency to become small, so the obtained weight decreases, i.e., the weight is based on the variation of efficiency scores. Also, when the variation is small, the uncertainty of the selected indicators increases and the weight decreases as well, which improves the discrimination capability and vice verse.
From Table IV, we can see that, in column S1, the scores for some routes, such as M290, M370, M403, and M435, are greater than 1, but not 1, due to that we use a super efficiency DEA model. Thus, we can distinguish the efficiency among these routes. Similarly, there are some routes such as M370 and M435 in column βjwhose scores are greater than 1, and we can distinguish their efficiency too. Note that, for the model of subset S1, all the indicators are selected, while the efficiency scores for the model with Shannon’s entropy being combined are obtained by setting the weights for different subsets. Thus, as observed, the efficiency scores in column S1are greater than the corresponding ones in column βj.
Next, we further analyze the efficiency by classifying the efficiency score of a DMU. In [45], the performance of a system is classified into three grades by using the efficiency scores obtained by a DEA model. By this criterion, a system is efficient only when the efficiency score is greater than orequal to 1. If the efficiency score is between 0.6 and 1, then the system is not fully efficient. If the efficiency score is less than 0.6, then the system is inefficient. They are called grades 1, 2, and 3, respectively. Based on this classification, the results for the case problem are shown in Table V. It can be seen that, among the 37 DMUs, there are 13 inefficient DMUs, 20 not fully efficient DMUs, and four efficient DMUs for the mixed DEA model given in [40] and there are 24 inefficient DMUs, 11 not fully efficient DMUs, and two efficient DMUs for the proposed method.

TABLE V CLASSIFICATION OF EFFICIENCY SCORES OF VARIOUS BUS ROUTES
Then, we analyze the characteristics of inputs and outputs for different grades. Table VI provides the average values of inputs and outputs for different grades obtained by different methods.
It follows from Table VI that the efficient DMUs with Grade 1 have more resources, such as available fleet size, and,at the same time, achieve higher revenue, higher passengercrowding degree, and shorter passenger waiting time. The inefficient DMUs with Grade 3 are characterized by less resource availability, less revenue, less passenger-crowding degree, and longer passenger waiting time. For the not fully efficient DMUs with Grade 2, the performance is between theinefficient DMUs and efficient DMUs. From Table VI, we find that the efficiency can be roughly distinguished by the ratio of revenue to available fleet size. The larger the value is,the larger the ratio of output to input is. An interesting observation from the above analysis is that the efficient DMUs have the smallest average frequency for each bus, i.e.,the ratio of average frequency to available fleet size. In order to analyze this phenomenon, we analyze the effect of the length of the routes on the performance as shown in Table VII.

TABLE VI AVERAGE OF CLASSIFIED INPUT AND OUTPUT DATA
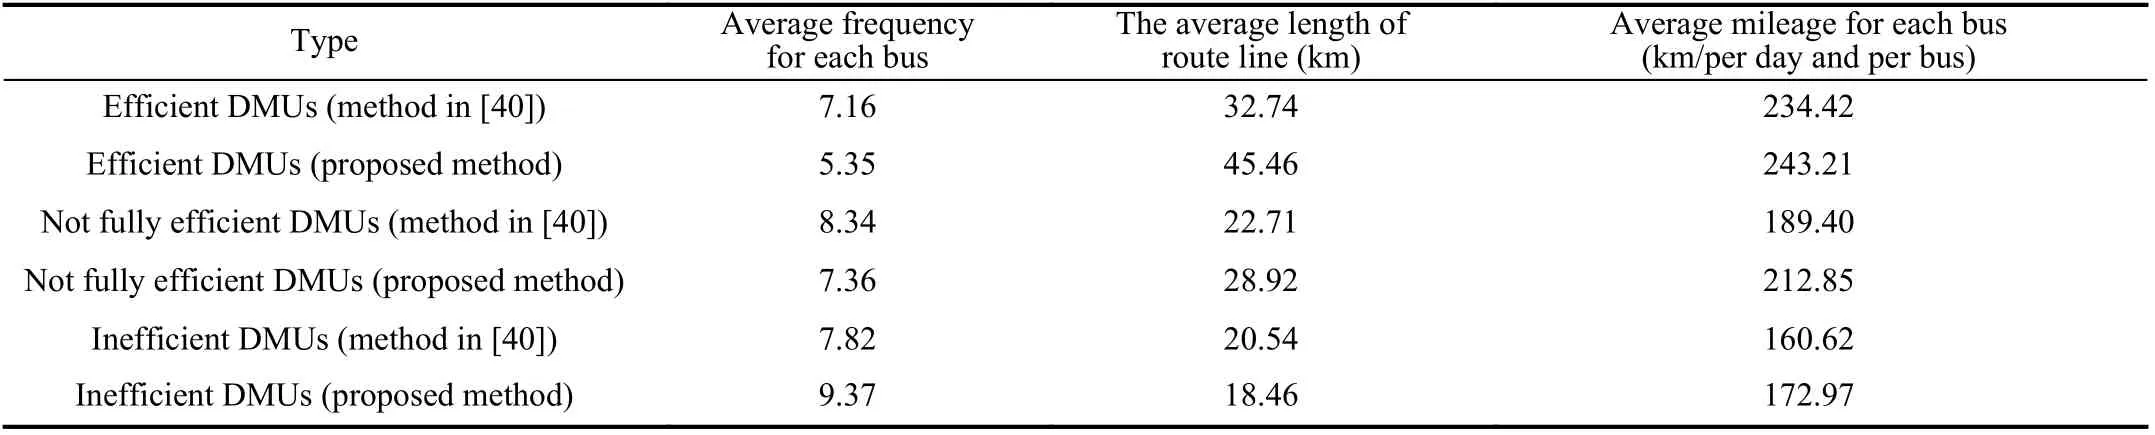
TABLE VII AVERAGE OF CLASSIFIED COMPUTATIONAL DATA

TABLE VIII AVERAGE EFFICIENCY SCORE OF THE BRANCHES
From Table VII, we can observe that the route length of the efficient DMUs with Grade 1 is the longest ones, while the route length of the inefficient DMUs with Grade 3 is the shortest one. By multiplying the average frequency for each bus with the average length of the bus route, we can get the average mileage for each bus. From Table VII, it can be seen that the efficient DMUs do the best, while the inefficient DMUs do the worst in terms of average mileage, leading to the highest utilization of the efficient DMUs and the lowest utilization of the inefficient DMUs. This implies that the efficient DMUs fully utilize the existing resources, while the inefficient DMUs do not make full use of existing resources.
In comparing the proposed method with the regular mixed DEA model presented in [40], we found that the results obtained by the proposed one show more discrimination capability. It can be observed that the difference of average mileage between the second and third grades obtained by the proposed method is greater than that obtained by the method in [40].
Next, we analyze the efficiency of the branches in the company. We can calculate the average efficiency scores for each branch as shown in Table VIII.
The result shown in Table VIII is obtained by using the super efficiency DEA models. With these models, the efficiency scores for some DMUs are greater than 1 as shown in Table IV, which may have significant effect on the efficiency evaluation of a branch. To show that, by replacing the efficiency score values that are greater than 1 by 1, we obtain the average efficiency as shown in Table IX.
From the above result, it can be seen that branches evaluated using these two methods have similar results. From Table X, the ranking of the branches in the performance decreasing order is Branches 3, 2, 4, 1, and 5 for both methods, while from Tables VIII and IX. it is Branches 3, 2,1, 4, and 5 for the mixed DEA model in [40] and it isBranches 3, 2, 4, 1, and 5 for the proposed model. It can be seen that the result in Table X is basically consistent with those in Tables VIII and IX. In general, we can conclude that Branches 3 and 2 are the two best managed ones. Branches 1 and 4 are generally well managed, while Branch 5 is poorly managed.

TABLE IX AVERAGE EFFICIENCY SCORES FOR THE BRANCHES OBTAINED BY THE BASIC DEA MODELS

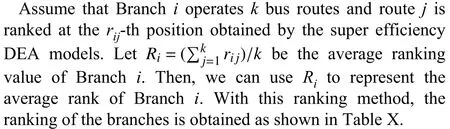
TABLE X AVERAGE RANKING OF DMUS FOR THE BRANCHES
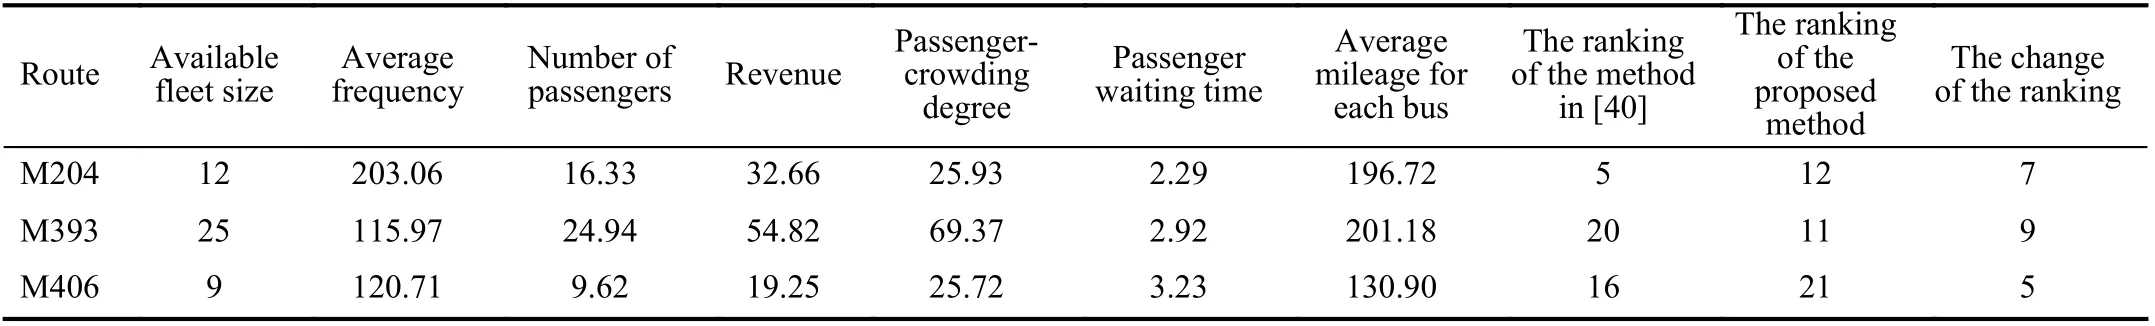
TABLE XI THE RANKING OF EFFICIENCY SCORES FOR DMUS WITH LARGE VARIATIONS IN TwO METHODS
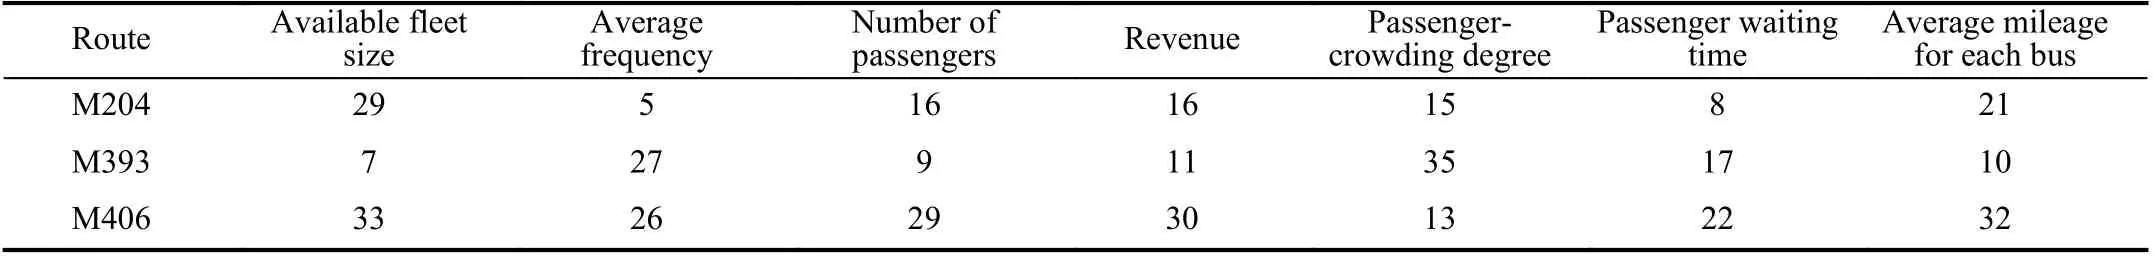
TABLE XII THE RANKING OF THE DATA FOR DMUS IN TABLE XI
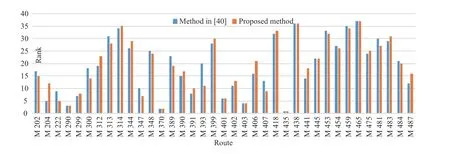
Fig.1. The ranking of efficiency scores for each DMUs.
Compared the proposed method with the one given in [40],it is found that the ranking for Branches 1 and 4 in Tables VIII and IX is different. The value obtained by the proposed method shows a greater degree of discrimination, i.e., it presents a greater difference between the best and worst performing companies than that obtained by the one given in[40].
Finally, we compare the differences between the proposed one and the one given in [40]. In order to better reflect the gap between the results of these two methods, we rank the efficiency scores of each route, and the result is shown in the Fig 1.
From Fig 1, it can be seen that seven DMUs have the same rank and 30 DMUs have different ranks. Among these 30 DMUs, by the proposed method, 15 DMUs have lower ranking, while the other 15 DMUs have higher ranking. Next,we analyze the DMUs with a large difference in ranking,which is equal to or more than 5. The DMUs whose ranks vary greatly for the two methods are shown in Table XI.
In order to better illustrate this situation, Table XII gives the rankings of the input and output of these DMUs and the ranking of average mileage for each bus. In these rankings, for the undesirable output indicators, the smaller the value is, the higher the rank is. While for the expected output indicators and the average mileage for each bus, the bigger the value is,the higher the rank is.
The first and third DMUs in Table XI have lower ranking by using the proposed method, while the remaining DMUs have higher ranking by using the same method. It can be seen that the first and third DMUs are ranked lower by using the proposed method due to the longer passenger waiting time and the lower mileage for each bus, while the other DMUs are ranked higher due to the shorter passenger waiting time and higher mileage for each bus. For M204 and M406, they are ranked as 5 and 16, respectively, when the method in [40] is applied, while they are ranked as 12 and 21, respectively,when the proposed method is applied. Here, we see that their passenger waiting time is ranked as 8 and 22, respectively,and the mileage for each bus is ranked as 21 and 32,respectively. For M393, it is ranked 20 for the method in [40],while its ranking is 11 by the proposed method. Here, we see that its passenger waiting time is ranked as 17 and mileage for each bus is ranked as 10. We can see that if the rank of passenger waiting time and mileage for each bus are better than the rank obtained by the method in [40], then the rank of efficiency score obtained by the proposed method becomes better and vice verse. Therefore, the proposed method emphasizes more on the passenger waiting time and the mileage for each bus than the method in [40].
C. Sensitivity Analysis
Sensitivity analysis provides the sensitivity of a system (or model) state or outputs with respect to the changes in system parameters or surrounding conditions. Sensitivity analysis is often used for testing optimization methods to study the stability of an optimal solution when the original data are inaccurate or changed. Sensitivity analysis also determines which parameters have a large impact on the system or model.Therefore, sensitivity analysis is important in almost all operations research methods as well as in evaluating various programs.
Sensitivity analysis in the DEA model is to test the change of efficiency score by removing one or some input or output indicators. Such changes indicate that whether an indicator has a large impact on the target value or not [46]–[49].
In this paper, we remove one input or output indicator each time to obtain the corresponding efficiency score by the model such that we can know the change of the efficiency value. The results obtained are shown in Table XIII for the method in[40] and Table XIV for the proposed method.
When an indicator is removed from the DEA model, the larger the change of efficiency score is, the greater the influence of the indicator on the system is. In Tables XIII and XIV, the value of the last row gives the average of the absolute value of the difference between the original model and the model with the corresponding indicator being removed. Hence, the larger the value is, the greater the influence of the indicator on the system is. For the method in[40], by observing Table XIII, removing x1results in the largest efficiency score change. The changes in the decreasing order are resulting from removing x1, y1, z1, y2, x2, and z2,respectively, i.e., the sensitivity degree of these indicators in the decreasing order is the available fleet size, the number of passengers, passenger-crowding degree, revenue, average frequency, and passenger waiting time.
For the proposed method, from Table XIV, it is known that removing x1results in the largest efficiency score change. The changes in the decreasing order are resulting from removing x1, x2, z2, z1, y1, and y2, respectively, i.e., the sensitivity degree of these indicators in the decreasing order is the available fleet size, average frequency, passenger waiting time, passengercrowding degree, the number of passengers, and revenue.
The most sensitive indicator for the two methods is the available fleet size. For the passenger-crowing degree and passenger waiting time, the rankings of important degree are 3 and 6, respectively, for the method in [40], and 4 and 3,respectively, for the proposed method, indicating that the use of Shannon’s entropy can better reflect the indicators of passenger satisfaction. To further illustrate this issue, we further remove the undesirable indicators for comparison, and the resulting efficiency scores are ranked and compared with the original ranking of the two methods, as shown in Table XV.
In Table XV, we calculate the sum of columns 8 and 9 to obtain 50 and 82, respectively, indicating that there are more considerations in the use of proposed method to emphasize more on passenger satisfaction.
Next, we discuss the limitations and drawbacks of the proposed method. In the sensitivity analysis, it emphasizes less on the number of passengers and revenue. By the Shannon’s entropy, since the weight (wl) for each subset is different, we can get the weight for each indicator as given in Table XVI.
From Table XVI, we can see that the weight of each indicator is not the same. It is dependent on the weight of the subset (wl).With this difference being taken into account, the ranking of sensitivity degree of these indicators has basically remained unchanged. Public transport services are quasi-public commodity, so passenger satisfaction is more important.
On the other hand, when the number of input and output indicators is small, the value wlwould be relatively close,leading to that the effectiveness of using the proposed method is affected. When the number of input and output indicators increases, according to k = (2d–1) × (2e–1) × (2f–1), the number of subsets increases exponentially, which means that the computation would be increased rapidly. Therefore, the number of input and output indicators should not be too large or too small.
With the above analysis and comparison, we find that there are some differences between the results obtained by the proposed method and the one in [40]. The proposed method emphasizes more on the indicators of passenger satisfaction and resource utilization. Meanwhile, in classification and branch ranking, the proposed method shows greater discrimination ability. Therefore, this model can obtain better results for evaluating bus company’s operational performance.
At last, we present some management implications for thebus company. We analyze the worst DMU, i.e., the one with the rank 37 by both the proposed method and the one in [40].The values of indicators are shown in Table XVII.
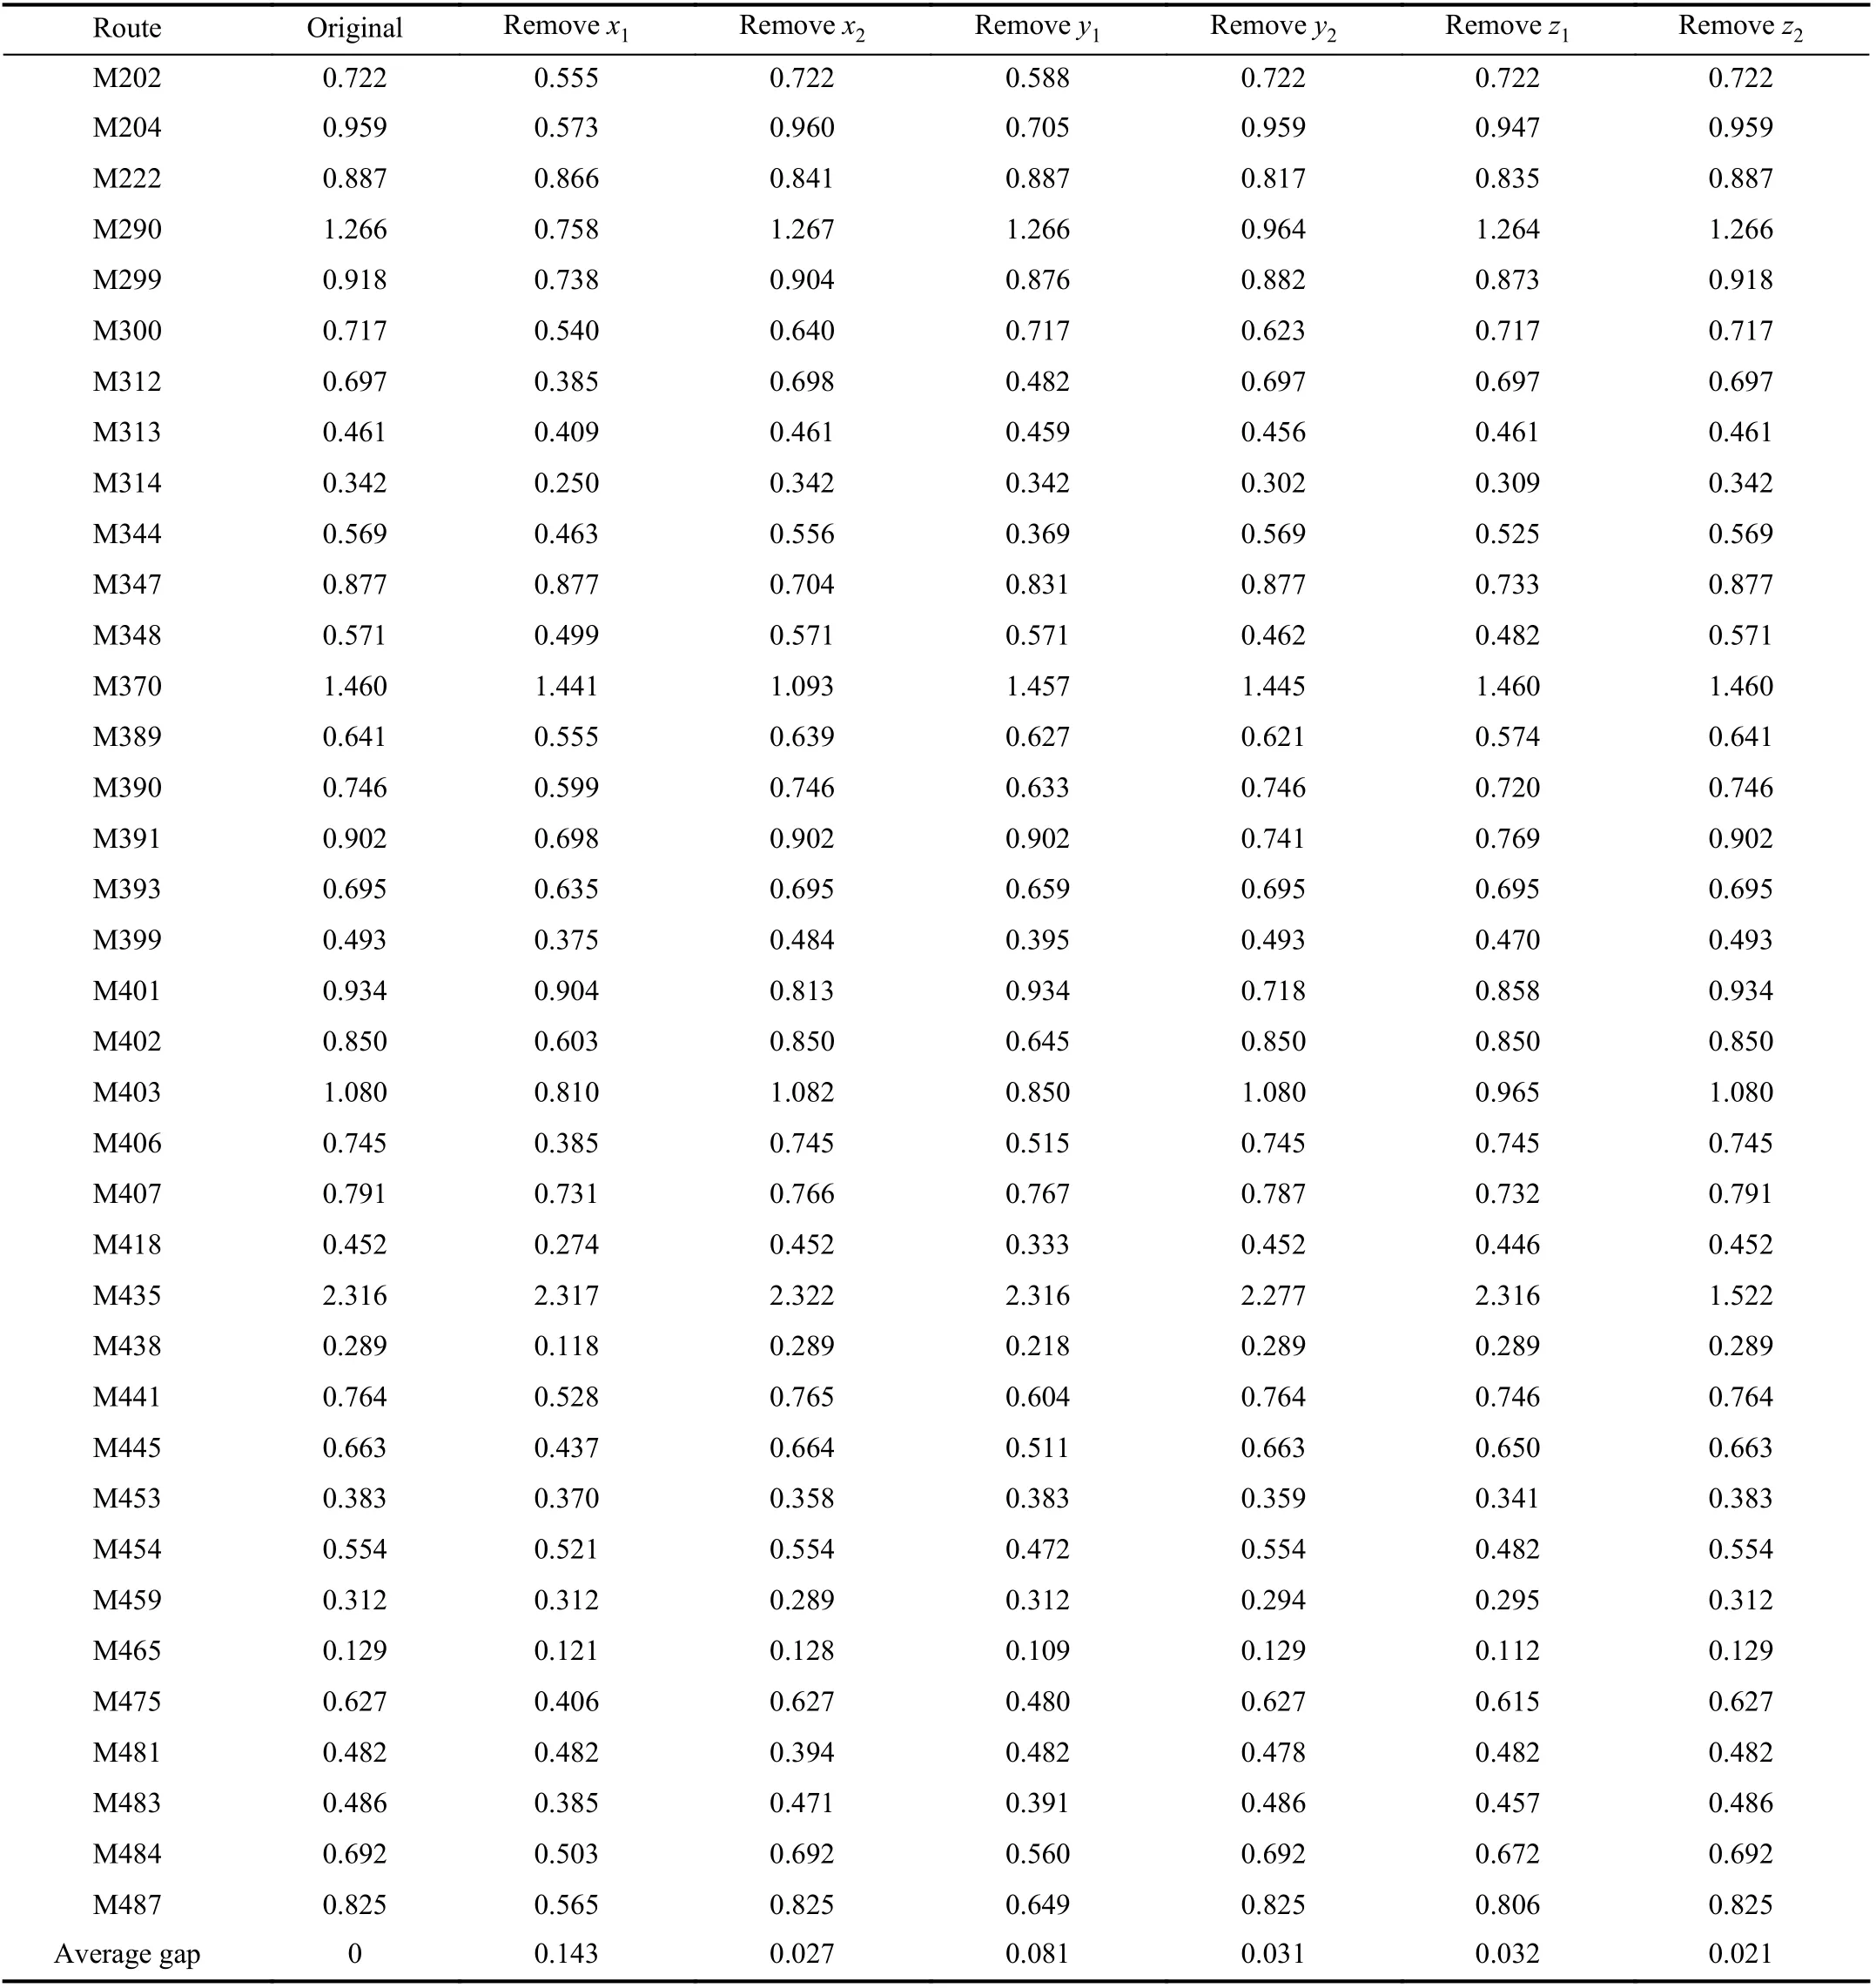
TABLE XIII SENSITIVITY ANALYSIS (METHOD IN [40])
From Table XVII, we can see that, the worst DMU (i.e.,M465) ranks 37 among the 37 bus routes with its average mileage of each bus is 89.39, implying that its ability to use resources is the worst. In addition, there are two ways to improve the efficiency value, i.e., to increase revenue or increase passenger satisfaction. In terms of revenue increase,since public transport services are quasi-public commodity,their fares are regulated by the government. Thus, to increase revenue is to increase the number of served passengers.Therefore, it is necessary to increase the attractiveness of the public transportation system and increase the share of public transportation modes to promote the relief of traffic congestion, environmental protection and energy saving. In terms of passenger satisfaction, the priority is to reduce passenger waiting time. Then, it needs to reduce departureintervals. Hence, a company should make full use of the existing resources such as improving the vehicle utilization.On the other hand, we find that there is a trend that the longer the route length of a bus line is, the better the revenue of a bus company is. However, for M465, the route length is 12.54 km,which ranks 27 on the 37 bus routes. This implies that, in terms of length of a bus line, it is not the shortest one.However, it ranks the worst. Thus, it is important for the bus company to plan the bus routes carefully.
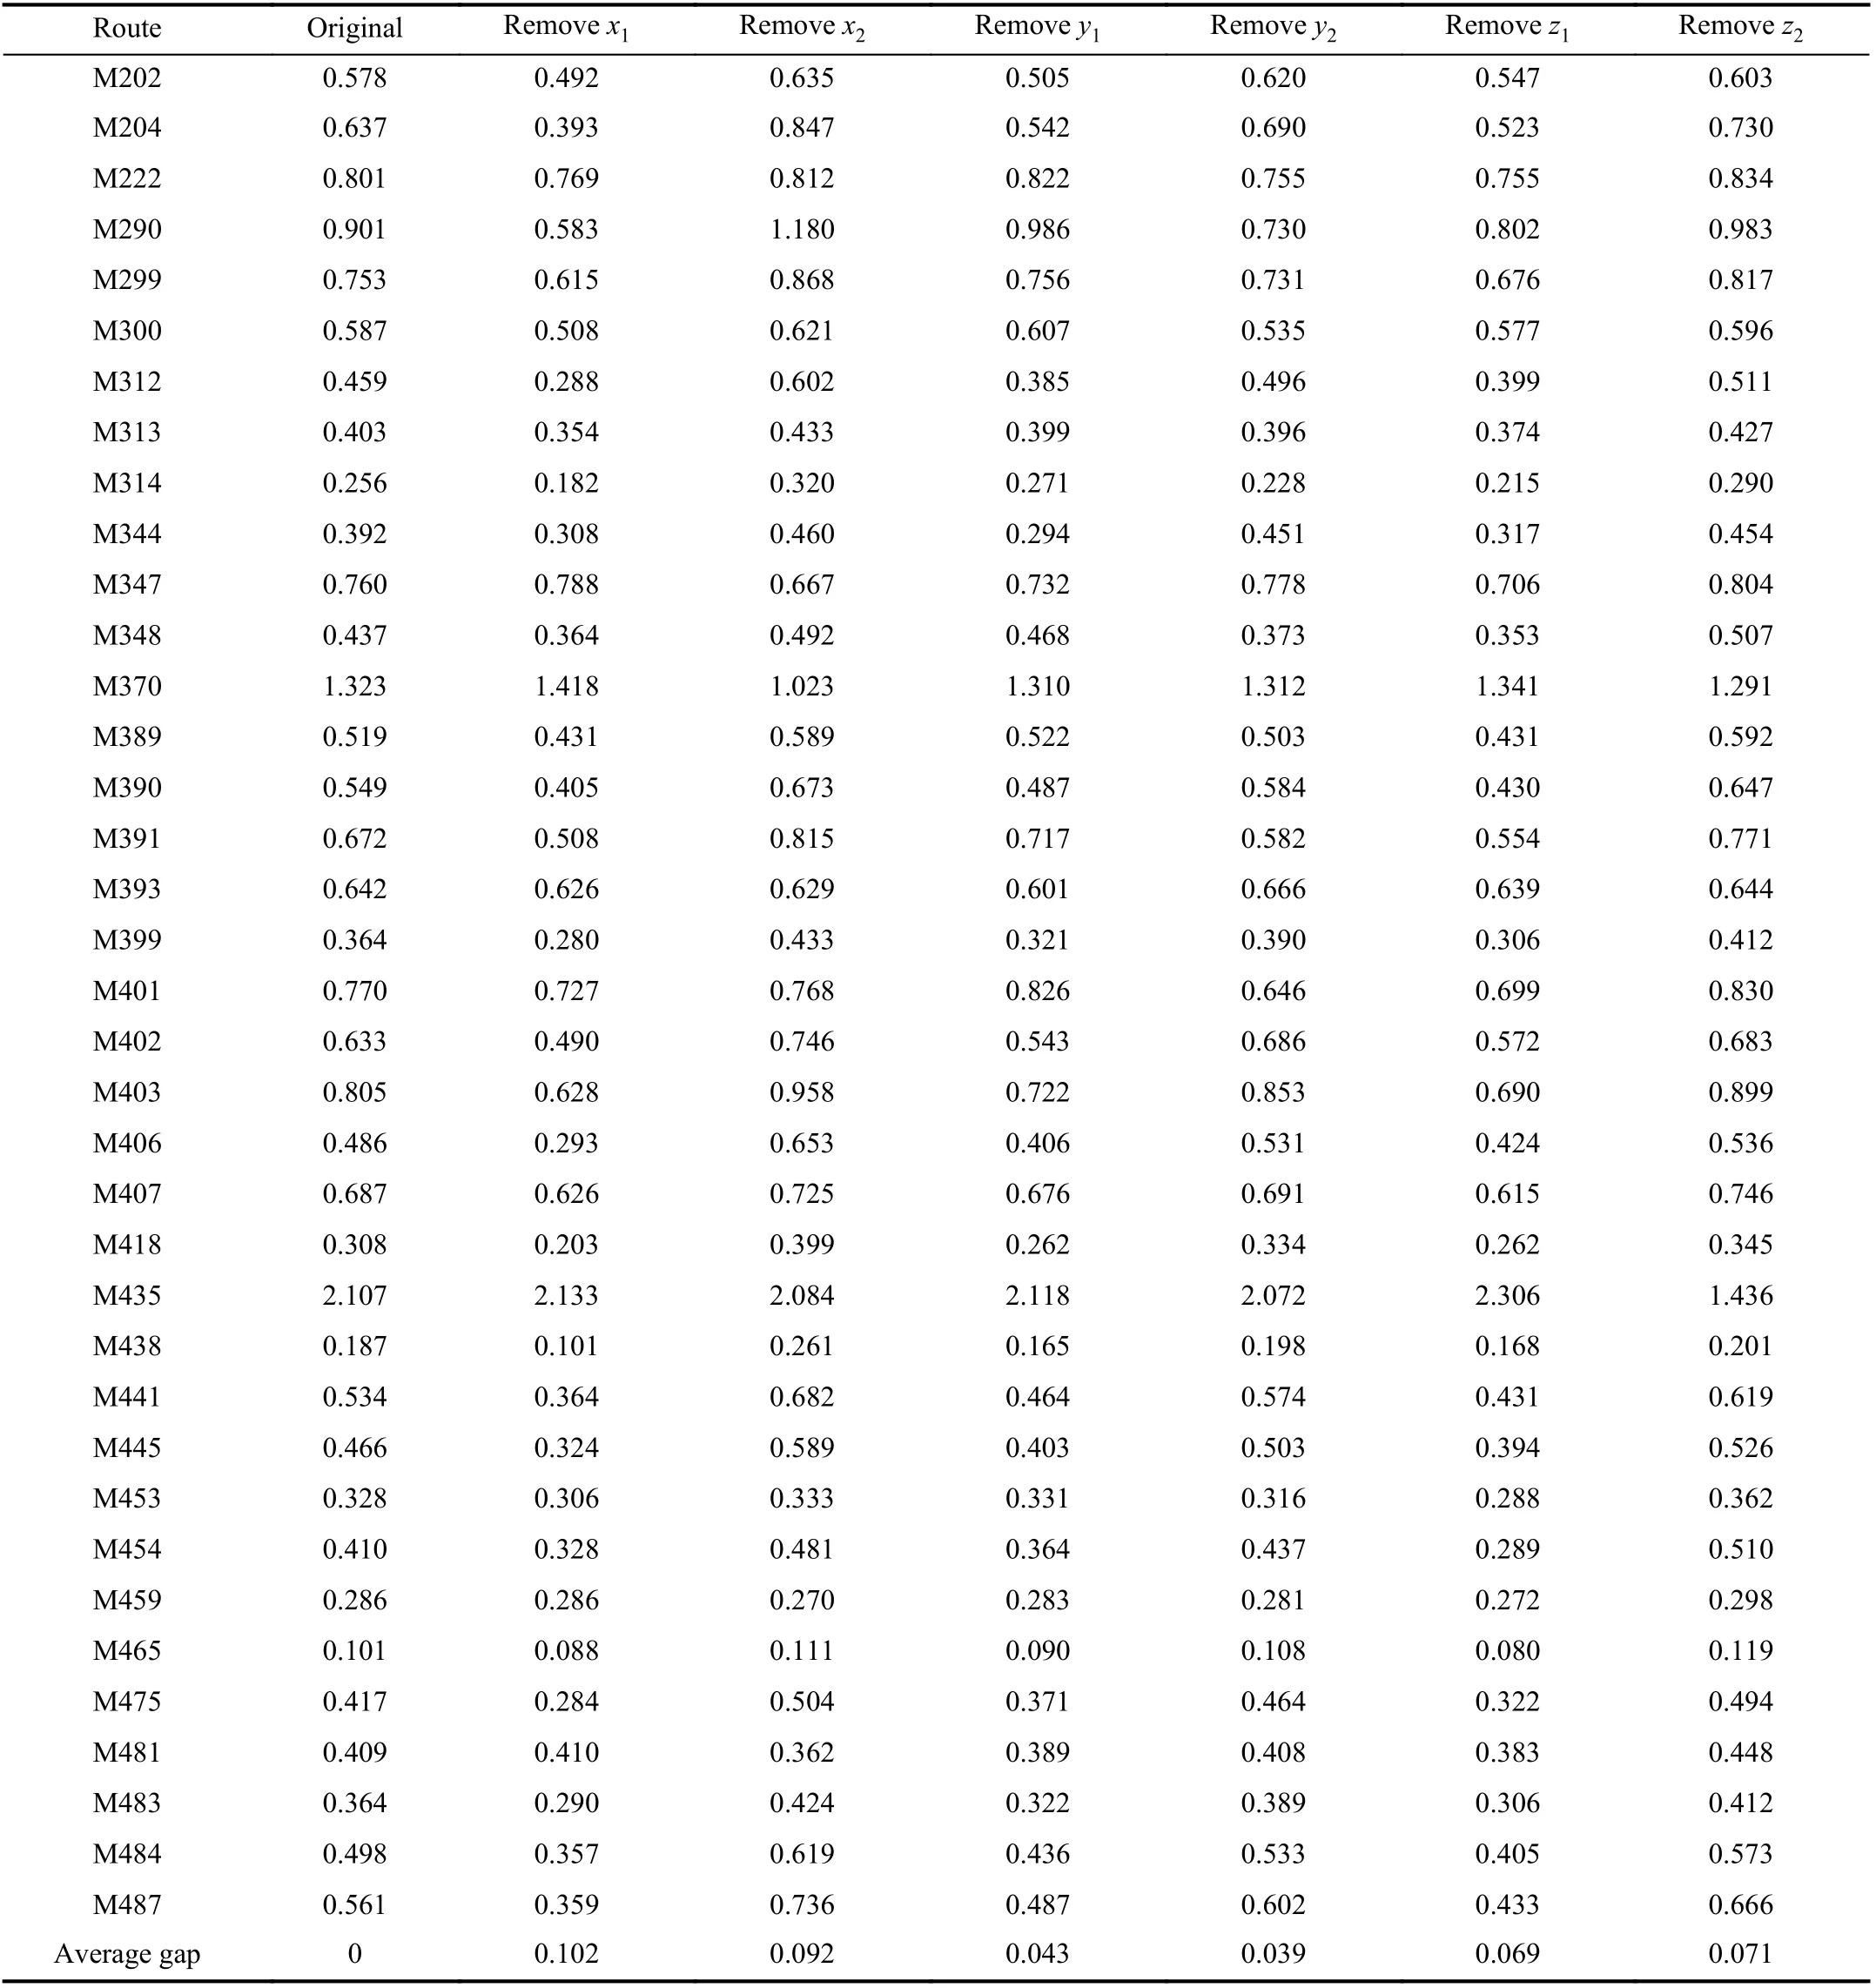
TABLE XIV SENSITIVITY ANALYSIS (PROPOSED METHOD)
V. CONCLUSION
This paper provides a framework for using DEA tools to assess the performance of public transport services. An important feature of the framework is its flexibility and consideration of all aspects of a public transport system by integrating the interests of both bus companies and passengers,which is done by considering various relevant indicators. An indicator system based on passenger satisfaction and operational efficiency is established to measure theperformance of public transport services. Based on this indicator system, super-efficient DEA models with undesirable output indicators are presented. Meanwhile, in order to adapt to the influences of the number of input and output indicators,Shannon’s entropy is embedded into the model for performance evaluation. Then, the models are applied to a case problem with 37 main routes operated by a company with five branches in a large city in China. By using the actual data collected in the company, efficiency is evaluated for each bus route and each branch. Through comparison, it shows that the proposed method can obtain better results in the evaluation of bus company’s operational performance. Results show that some bus routes are efficient, while some others are not. Consider that a bus route is not efficiently operated if its efficiency score is less than 1. Finally, through sensitivity analysis, the degree of influence of each indicator is obtained and it is shown that the proposed method pays more attention to the indicators of passenger satisfaction. Based on the results, an inefficient busroute should make full use of the existing resources and the route with longer line length is better in terms of the revenue of the bus company.

TABLE XV THE ANALYSIS OF THE UNDESIRABLE OUTPUTS
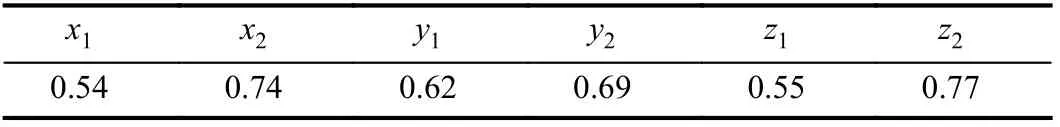
TABLE XVI THE WEIGHTS OF EACH INDICATORS
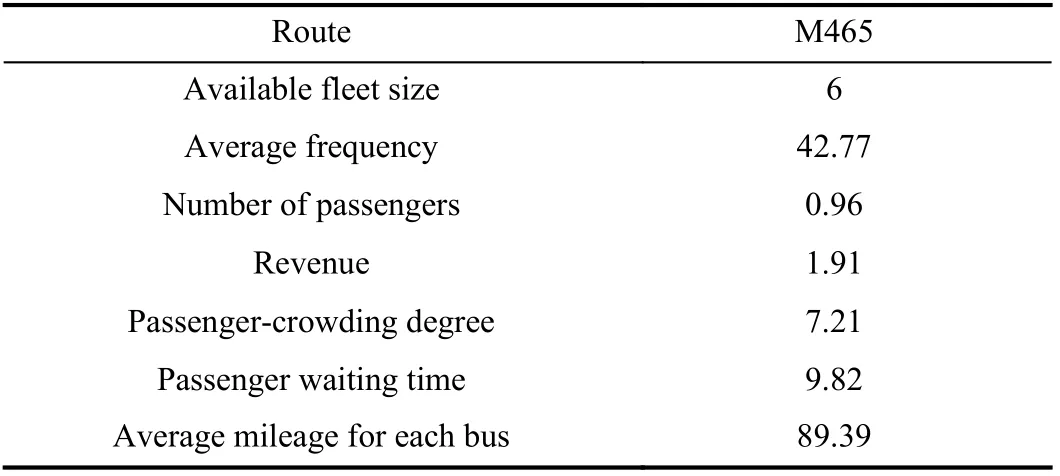
TABLE XVII THE INDICATORS OF THE WORST DMU
In a city, a public transportation system often contains multiple means, such as buses, subways, taxis, etc. Passengers may use multiple means when they are served by the system even for a single trip. They may transfer from one bus route to another, transfer a bus route to a subway, and so on. For its efficiency evaluation of such a public transportation system, it is meaningful to combine these indicators and make a comprehensive performance evaluation. This will be our further work. Efficiency for power systems in cities is very significant [50], its efficiency evaluation is another future work.To efficiently operate a public transportation system under the framework of intelligent transportation systems, it is important to accurately forecast the traffic flows [51], [52], this is also our future work.
 IEEE/CAA Journal of Automatica Sinica2021年4期
- IEEE/CAA Journal of Automatica Sinica的其它文章
- Adaptive Pseudo Inverse Control for a Class of Nonlinear Asymmetric and Saturated Nonlinear Hysteretic Systems
- Property Preservation of Petri Synthesis Net Based Representation for Embedded Systems
- Dynamic Evaluation Strategies for Multiple Aircrafts Formation Using Collision and Matching Probabilities
- Residual-driven Fuzzy C-Means Clustering for Image Segmentation
- Vibration Control of a High-Rise Building Structure: Theory and Experiment
- Task Scheduling for Multi-Cloud Computing Subject to Security and Reliability Constraints