
Effects of Biostimulation-Bioaugmentation on Coastal Microbial Community in an in situ Mesocosm System
2024-03-12 11:14:24YUANFangzhengZHAOYangyongDAIYulaiYANGWenandZHUJinyong
YUAN Fangzheng, ZHAO Yangyong, DAI Yulai, YANG Wen, and ZHU Jinyong,
1) College of Marine Science, Ningbo University, Ningbo 315800, China
2) Zhejiang Easytest Environmental Technology Co., Ltd., Ningbo 315800, China
3) Hangzhou Academy of Agricultural Sciences, Hangzhou 310024, China
Abstract Globally, various types of pollution affect coastal waters as a result of human activities. Bioaugmentation and biostimulation are effective methods for treating water pollution. However, few studies have explored the response of coastal prokaryotic and eukaryotic communities to bioaugmentation and biostimulation. Here, a 28-day outdoor mesocosm experiment with two treatments(bioaugmentation-A and combined treatment of bioaugmentation and biostimulation-AS) and a control (untreated-C) were carried out.The experiment was conducted in Meishan Bay to explore the composition, dynamics, and co-occurrence patterns of prokaryotic and eukaryotic communities in response to the A and AS using 16S rRNA and 18S rRNA gene amplicon sequencing. After treatment,Gammaproteobacteria and Epsilonproteobacteria were significantly increased in group AS compared to group C, while Flavobacteriia and Saprospirae were significantly reduced. Dinoflagellata was significantly reduced in AS compared to C, while Chrysophyta was significantly reduced in both AS and A. Compared to C, the principal response curve analyses of the prokaryotic and eukaryotic communities both showed an increasing trend followed by a decreasing trend for AS. Furthermore, the trends of prokaryotic and eukaryotic communities in group A were similar to those in group AS compared with group C, but AS changed them more than A did.According to the species weight table on principal response curves, a significant increase was observed in beneficial bacteria in prokaryotic communities, such as Rhodobacterales and Oceanospirillales, along with a decrease in autotrophs in eukaryotic communities,such as Chrysophyta and Diatom. Topological properties of network analysis reveal that A and AS complicate the interactions between the prokaryotic and eukaryotic communities. Overall, these findings expand our understanding of the response pattern of the bioaugmentation and biostimulation on coastal prokaryotic and eukaryotic communities.
Key words prokaryotic community; eukaryotic community; bioaugmentation; biostimulation; coastal waters
1 Introduction
Pollution of coastal waters has emerged as a major environmental problem worldwide. With increasing human activities, more terrestrial nutrient inputs are transported to coastal waters (Adyasari, 2021). Pollutant discharge causes large-scale organic pollution (Kurwadkaret al., 2020), petroleum pollution (Denget al., 2014), metal contamination(Cesareet al., 2020) and eutrophication (Malone and Newton, 2020), resulting in serious ecological damage. After years of governance, the world’s marine ecological environment has improved, but polluted seawater remains, especially in coastal waters (Tiquioet al., 2017; Jianget al., 2020;Maúreet al., 2021).
To remediate damaged ecosystems, physical methods such as flocculation (Panet al., 2011) and chemical methods such as chemical oxidation (Qianet al., 2010) have been extensively developed and applied to treat various types of water pollution. Although physical and chemical approaches have achieved certain results, they have obvious disadvantages including high costs, secondary pollution,and lack of targeting. Therefore, bioremediation is gaining more attention because it is more environment-friendly and efficient (Semranyet al., 2012). Currently, bioremediation methods have been widely used in aquaculture (Tuckeret al., 2009), oil pollution remediation (Hassanshahianet al.,2014), and black and odorous water treatment (Yuanet al.,2018). Microbial remediation, an important bioremediation method, reduces ammonium, total phosphorus, and organic matter levels by introducing specific strains of bacteria into the target water, thereby improving the condition of the ecosystem (Higaet al., 1991; Rashid and West., 2007; Liuet al., 2022). In fact, most water bodies have potential for microbial self-purification. However, the lack of nutrients that microorganisms need frequently causes their slow growth and proliferation, which in turn affects the natural process of water self-purification (Al-Mailemet al., 2017).It is often difficult to form stable populations spontaneously after the introduction of bacterial agents in the practice of treatment, which often requires repeated applications. It increases the cost of treatment, and it is difficult to obtain a consistent and effective remediation effect (Herrero and Stuckey, 2015; Sharipet al., 2020). Biostimulation can improve the nutritional conditions of microorganisms by adding specific nutrients or biostimulants to the water (Maldonadoet al., 2022). This approach not only facilitates the colonisation of the applied microorganisms, but also selectively expands the population of beneficial indigenous bacteria, thereby improving the environmental remediation capacity of the microorganisms (Chapelleet al., 2002; Darmayatiet al., 2015; Pavlovaet al., 2019; Chenet al., 2023).
The long-term effectiveness of bioremediation depends largely on the bacterial community. Therefore bacterial community composition and dynamics are considered to be key indicators for evaluating water quality (Yuanet al., 2018).Immobilized microorganisms were applied to polluted water bodies, the microbial composition subsequently changes and is used to evaluate the treatment effectiveness (Zhanget al., 2019). The effect of some bacterial agents, such as effective microorganisms (EM), on the bacterial community in water column has also gained attention (Parket al.,2016). Despite these examples, previous studies have focused more on the impact of treatment method on environmental factors. Meanwhile, few reports have been published on the ecological effects of combination remediation technique on microplankton communities in the water column. The effects of bioremediation techniques on bacterial communities also need to be further explored.
This study aims to investigate the ecological effects of microbial bioremediation on plankton microbial communities. Based on the high-throughput sequencing of 16S rRNA and 18S rRNA genes, the weekly variation of prokaryotic and eukaryotic communities was investigated in the mesocosm system during the bioaugmentation and/or biostimulation to address the research question and test the following hypotheses: 1) the compositions of prokaryotic and eukaryotic communities are expected to be notably different when induced by bioaugmentation and/or biostimulation;2) prokaryotic and eukaryotic communities have different patterns of response to different restoration treatments.
2 Materials and Methods
2.1 Experimental Setup
A mesocosm experiment was carried out in Meishan Bay(29.756?N, 121.916?E) on Meishan Island, Ningbo, Zhejiang Province, China. From 2012 to 2017, two artificially controlled dams were built at the northern and southern ends of the strait between Meishan Island and the mainland. The water in the bay comes mainly from the East China Sea and rivers, and is discharged and exchanged irregularly as requires. Pollution of the rivers and the East China Sea by domestic sewage and aquaculture waste water caused severe eutrophication in the bay. Together with poor water exchange, it led to frequent red tides in the years after the dam was built (Shaoet al., 2020).
An enclosure experiment lasting roughly one month was carried out to investigate the ecological effects of combining bioaugmentation and biostimulation on planktonic microbial communities from July 17 to Augest 6, 2019. Experiments tested the bioaugmentation treatment (A), combined method treatment (AS) and a control (C), with each treatment comprising three replicate enclosures. Each enclosure(5 m × 5 m surface area and 5 m deep) was made of polyvinyl chloride coated fabric, supported by a galvanised steel pipe frame, and enters the deposit by approximately 0.2 m.
2.2 Bioremediation Treatment and Sample Collection
The bacterial agent applied in the bioaugmentation and combined treatment are EM acquired from EMRO Environmental Protection Biotechnology (Nanjing) Co. Ltd. Activated bacteria liquids were prepared by using molasses and distilled water in a ratio of 1:20 at 35℃ under sealed condition until the pH dropped below 3.5. The bacteria solution was sprayed at a volume ratio of 80000:1 in a combined treatment enclosures, equipped with a bioreactor and sustained-release biostimulator supplied by Zhejiang Avocado Environmental Protection Technology Co., Ltd. The bioreactor had openings for water inlet and outlet, water pump and stirring device (Fig.1). The main ingredients of the biostimulant agent were poly (3-hydroxybutyrate-co-3hydroxyhexanoate), poly (butanediol succinate), fulvic acid,diatomaceous earth, humic acid and sea shell powder. The water from the enclosure was pumped into the bioreactor filled with biostimulator and then recycled back into the enclosure (Fig.1). The bioaugmentation enclosures were sprayed with the same amount of bacterial solution as the combined treatment, while the water in the enclosures was recirculated back to them through the vacant bioreactor. The control enclosures were not treated.

Fig.1 Schematic diagram of outdoor mesocosm experiment.
Water samples were collected from each of the enclosures weekly. After the inoculation, a total of 36 water samples (9 enclosure × 4 weeks) were collected from the 0.5 m surface layer using a 1 L water sampler. A 200 μm pore-size sieve was used to pre-filter seawater, and the filtrate was then filtered through a 0.2 μm pore-size membrane (47 mm diameterpolycarbonate, Millipore, USA). The filters were stored at ?80℃ for DNA extraction in the future.
2.3 Measurements on Environmental Parameters
Water temperature (WT), dissolved oxygen (DO) and pH were monitoredin situat 0.5 m with a YSI 6000 Multiparameter (YSI 6000, USA). The chlorophyll a (Chla)content was measured by spectrophotometry (Water and Wastewater Monitoring and Analysis Methods, 4th Edition).The total nitrogen (TN), total phosphorus (TP), nitrate nitrogen (NO3?), nitrous nitrogen (NO2?), phosphate (PO43?),ammonia (NH4+) and chemical oxygen demand (CODMn)were measured using national standard methods (AQSIQ,2007).
2.4 DNA Extraction and PCR Amplification
According to the manufacturer’s instructions, DNA was extracted using a power Soil? DNA Isolation Kit (MO BIO Laboratories, USA). A NanoDrop 2000 spectrophotometer (Thermo Scientific, US) was used to quantify the samples. The V3 – V4 region of the prokaryotic 16S RNA gene was amplified with the primers 338F (5’-barcode-ACTCCTACGGGAGGCAGCA-3’) and 806R (5’-GGAC TACHVGGGTWTCTAAT-3’) by PCR (Renet al., 2017).Additionally, the V4 regions of eukaryotic 18S rRNA genes were amplified using the primer set 528F (5’-GCGGTAA TTCCAGCTCCAA-3’) and 706R (5’-AATCCRAGAAT TTCACCTCCAA-3’) (Cheunget al., 2010). For each sample, PCR amplicons were performed in triplicate and purified using a GeneJET kit (Thermo Scientific, USA). The library was then sequenced on an Illumina NovaSeq platform using the paired-end method for the PCR products from each sample.
2.5 Processing Sequence Data
USEARCH v11 was used to analyze the reads obtained from the sequencing process (Edgar, 2010). Paired reads of 16S rRNA or 18S rRNA gene fragments were merged.The reads were filtered and further analyzed in accordance with the USEARCH tutorial. USEARCH v11 was used to cluster sequences into operational taxonomic units (OTUs)with 97% similarity (Edgar, 2010). Chloroplasts and singleton OTUs were removed. SINTAX in USEARCH determined the taxonomy. RDP 16S database v16 and Silva 18S database v123 served as the reference datasets for SINTAX (Edgar, 2016). OTUs that were present in only one sample were eliminated to avoid artificial diversity inflation.
2.6 Statistical Analysis
All statistical analyses were performed in R (https://www.rproject.org). All biological data were Hellinger transformed and the environmental factors were normalized before analysis. The prokaryotic communities were analyzed at the class (relative abundance > 0.1%) and family (relative abundance > 1%) levels. The eukaryotic communities were analyzed at the class (relative abundance > 0.1%) level. One-way analysis of variance (ANOVA) was used to examine the variations in the prokaryotic and eukaryotic communities among groups. The Principal Response Curves (PRC) based on Redundancy Analysis (RDA) was used to analyze the differences and dynamic processes of the environmental factors, prokaryotic and eukaryotic communities between different treatment groups and control group(Van den Brink and Ter Braak, 1999). The PRC approach was implemented in the VEGAN package, and the microorganisms that responded significantly to the combined treatment were discovered by calculating the species weight in PRC analysis.
We select OTUs in at least 5 samples and greater than 20 sequences to construct the co-occurrence networks in the bacterial and eukaryotic communities, respectively. The‘igraph’ package (Csardi and Nepusz, 2005) was used to select and derive significant (FDR-adjustedPvalue < 0.01) robust Spearman’s rank correlations (|r| > 0.6) between OTUs.These correlations were then visualised using Gephi (Bastianet al., 2009). Topological properties, including edges,nodes, modularity, clustering coefficient (CC), network diameter, average path length (APL) and average degree, were calculated and compared between real and random networks. The role of each OTU was determined by its position in its own module compared to other OTUs, as well as its degree of connectivity to the nodes in other modules. As a result, the role of each OTU in the network was described by its within-module connectivity (Zi) and among-module connectivity (Pi) (Guimerà and Amaral, 2005). Based on simplified criteria, all species were classified into four subcategories: peripherals, connectors, module hubs, and network hubs (Olesenet al., 2007). In addition to peripherals,the remaining three types of nodes are usually categorised as key nodes (Denget al., 2012).
3 Results
3.1 Prokaryotic and Eukaryotic Communities Compositions
Almost 91% of the sequences belong to the seven taxonomic classes of the prokaryotic community (Fig.2A). Synechococcophycideae dominated the prokaryotic community,accounting for 30.2% (The percentage of advantage classes or families of prokaryotic or eukaryotic is the average value across all samples) of the sequences, followed by Alphaproteobacteria (20.1%), Actinobacteria (19.6%), Acidimicrobiia (9.4%), Gammaproteobacteria (4.5%), Flavobacteriia (3.8%) and Saprospirae (3.5%) (Fig.2A). After inoculation, Gammaproteobacteria and Epsilonproteobacteria were significantly increased in the combined treatment compared with the control (P< 0.05), while Flavobacteriia, Saprospirae, Deltaproteobacteria, Betaproteobacteria and Sphingobacteriia decreased significantly in combined treatment enclosures (P< 0.05) (Table 1). Only the Gammaproteobacteria in the combined treatment increased over time. At the family level, Synechococcophycideae (30.1%) was the dominant prokaryotes, followed by Microbacteriaceae (17.1%),Rhodobacteraceae (12.5%), Pelagibacteraceae (4.4%) and Saprospiraceae (3.2%) (Fig.2B). In the compound treatment,Saprospiraceae, Flavobacteriaceae and Cryomorphaceae were considerably reduced (P< 0.05) compared to the control, whereas the changes in the other main families were not significant (Table 1).

Table 1 Comparison of prokaryotic and eukaryotic community compositions at class and family level in three microcosm groups by one-way ANOVA

Fig.2 Relative abundance of prokaryotic and eukaryotic communities at class level (relative abundance > 0.1%) (A, C) and family level (relative abundance > 1%) (B) during the experiment. C, control; A, bioaugmentation treatment; AS, combined treatment.
The dominant eukaryotic community, at class level, were Dinoflagellata (21.7%), Cryptophyta (20.0%), Ciliophora(7.2%) and Diatom (6.9%) (Fig.2C). Compared with the control, Dinoflagellata in the combined treatment reduced significantly (P< 0.05), while Chrysophyta fell significantly (P< 0.05) in both treatment groups (Table 1). Diatom increased at first, then declined in the combined treatment,whereas it increased in the two other groups. In addition,no significant variations in protozoa, such as Cerozoa, Ciliophora and Choanoflagellida, were observed among the three groups.
3.2 Changes in Environmental Factors over Time
The PRC diagram of the environmental factors shows that different treatments affect the dynamics of physicochemical indicators of water bodies (Fig.3). Monte Carlo permutation tests (499 permutation test) showed a statistically significant difference between treatment and control perimeters (F= 12.207,P= 0.013). The model explains 92.4%of total data variability in the different treatments and the contribution of the first canonical axis is 19.7%. No significant differences were shown between treatments in the first week, but the magnitude of the differences between the combined treatment group and the control group was greater thereafter and was maintained until the end of the experiment. Only the CODMnwas found to differ between groups by species weights.
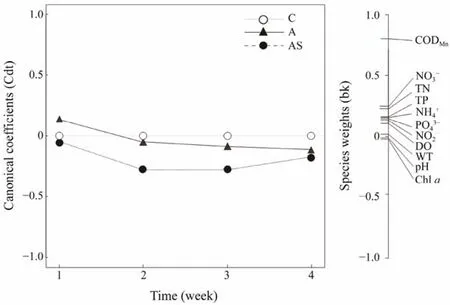
Fig.3 PRC of environmental factors under different treatments. The horizontal solid line at zero represents the control treatment, and all the changes in the environmental factors were explained by PRC for each treatment relative to the control. C, control; A, bioaugmentation treatment; AS, combined treatment.
3.3 Changes in Prokaryotic and Eukaryotic Communities Compositions over Time
The PRC diagrams of the planktonic microorganism dataset shows that the prokaryotic and eukaryotic communities of treatments deviated significantly from that of the control at the start of the experiment (Fig.4). The Monte Carlo permutation test (499 permutations) revealed significant differences among the treatments during the study (F=7.046,P= 0.04 for prokaryotic;F= 3.0714,P= 0.05 for eukaryotic), explaining 58.5% and 60.2% of total data variability respectively, with the first canonical axis accounting for 29.4% and 11.9% of the total variability separately(Fig.4).
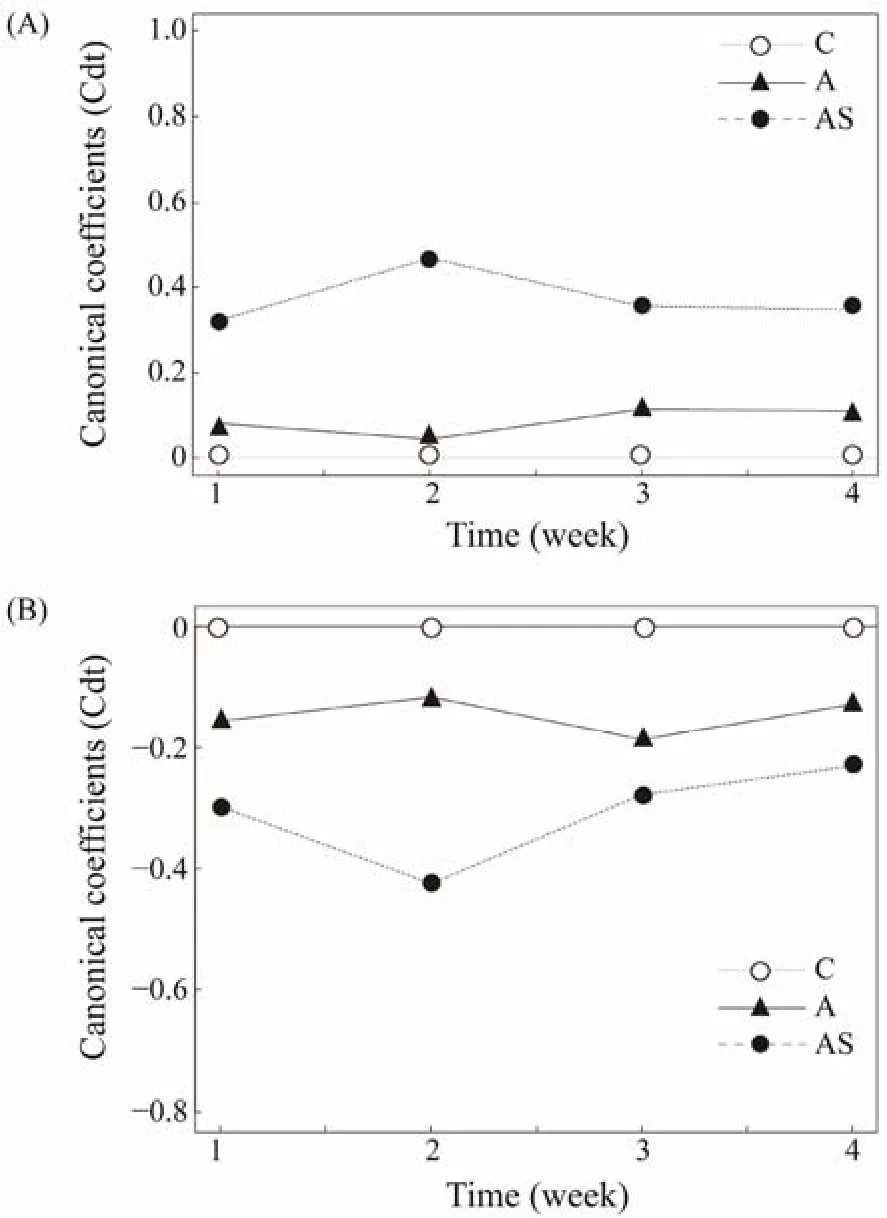
Fig.4 PRC of prokaryotic (A) and eukaryotic (B) communities under different treatments. The horizontal solid line at zero represents the control treatment, and all the changes in the prokaryotic and eukaryotic communities compositions were explained by PRC for each treatment relative to the control. C, control; A, bioaugmentation treatment; AS,combined treatment.
The PRC diagram of the prokaryotic community also revealed the disparity response to the various treatments,which were particularly clear among the treatments, especially in the second week of the experiment (Fig.4A). Although the response of the prokaryotic community to the bioaugmentation was less pronounced in the second week of the experiment, the bioaugmentation and combined treatment differed from the control all the time. Meanwhile, the magnitude of the difference between the combined treatment group and the control group was large in the early stages of the experiment, and started to decrease in the third week. The Rhodobacterales, Oceanospirillales, Rhizobiales,Thiotrichales, Campylobacterales and Alteromonadales showed high positive weights in Table 2, showing an increase in abundance with the treatments. Only Flavobacteria declined in abundance in the treatments.

Table 2 Species weights (bk) of prokaryotic community, which indicates the association of a particular species to the PRCs
The differential reaction to the various treatments was shown in the PRC diagram of the eukaryotic community,and it was notably evident in the second week of the experiment (Fig.4B). Although the magnitude of the difference in the bioaugmentation decreased in the second week,the bioaugmentation and combined treatment remained different from that of the control group. By contrast, the magnitude of the difference was significant in the early stage of the experiment, but the combination treatment tended to revert to the levels of the control after three weeks. Phytoplankton with positive weight were mainly affiliated with Chrysophyta, Dinoflagellate and Diatom (Table 3). The abundance of these taxa declined significantly in the treatments. The protozoa, fungi and diatom had relatively high negative weight, which suggests that their abundance has increased as a result of the treatment.

Table 3 Species weights (bk) of eukaryotic community, which indicates the association of a particular species to the PRCs
3.4 Co-Occurrence Patterns of Eukaryotic and Prokaryotic Communities
Eukaryotic and prokaryotic community co-occurrence networks were constructed based on Spearman’s rank correlation (Fig.5). Roughly 338 nodes linked by 918 edges made up the control network, the bioaugmentation network had around 335 nodes connected by 858 edges, and the combined treatment network had about 335 nodes connected by 1140 edges. The global networks had scale-free degree characteristic (power law:R2= 0.917 for control network,R2= 0.918 for bioaugmentation network, andR2= 0.920 for combined treatment, respectively). Thus, the global networks are different from their relevant random networks(Erd?s-Rényi Model) (Fig.5), reflecting that the three real co-occurrence networks were non-random. Furthermore,the modularity, CC and APL of the real networks were greater than those of their relevant random networks. Accordingly, the three real co-occurrence networks had ‘smallworld’ properties (Fig.5 and Table 4).
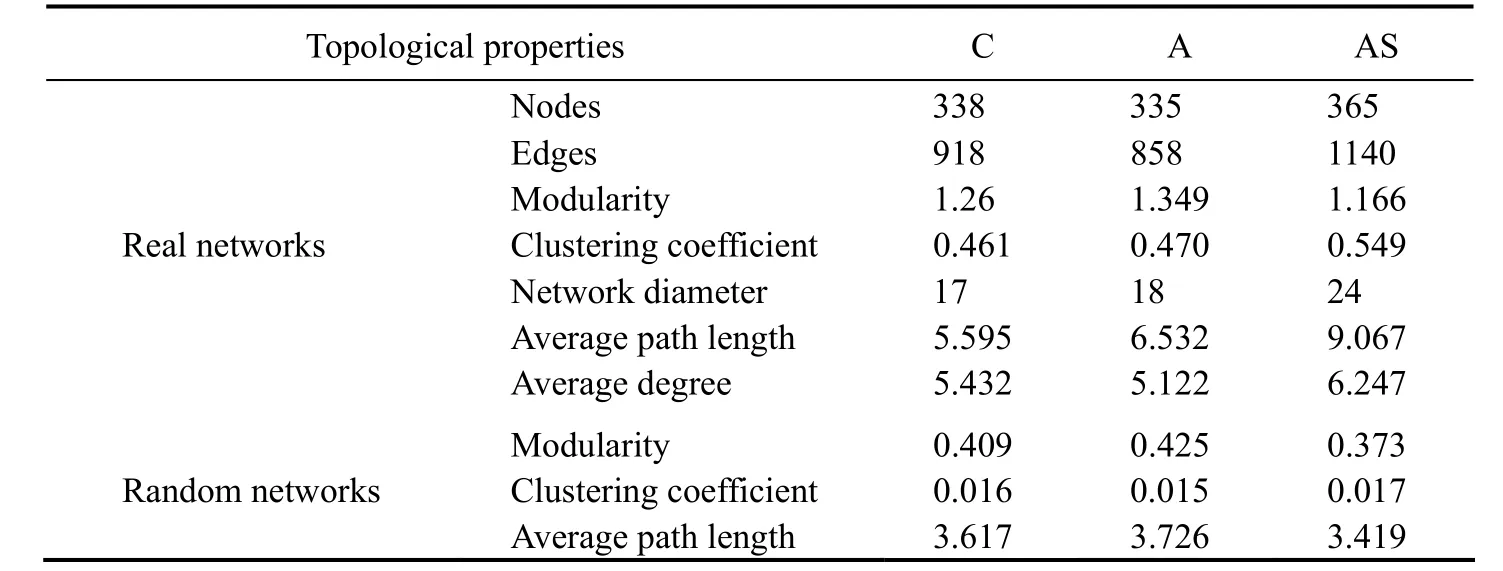
Table 4 Topological properties of co-occurrence network of prokaryotic and eukaryotic communities in three microcosm groups

Fig.5 Co-occurrence patterns of prokaryotic and eukaryotic communities. Node colours show the individual taxa. A connection represents a strong (Spearman’s |q| > 0.65) and significant (FDR-adjusted P < 0.01) correlation. The size of each node varies in direct proportion to the number of degrees. (A), control; (B), bioaugmentation treatment; (C), combined treatment.
For the control network, Rhodobacterales (15.09%), Actinomycetales (10.36%), Flavobacteriales (8.88%), Synechococcales (8.58%), Dinophyceae (8.28%) and Acidimicrobiales (6.80%) dominated the nodes (Fig.5A). Rhodobacterales (13.73%), Synechococcales (10.75%), Actinomycetales (9.55%), Dinophyceae (8.66%), Acidimicrobiales (5.97%) and Flavobacteriales (5.97%) mainly occupied the nodes for the bioaugmentation treatment (Fig.5B). As shown in Fig.5C, the abundance of nodes in the combined treatment network was: Rhodobacterales (21.64%), Synechococcales (10.68%), Acidimicrobiales (8.49%), Dinophyceae (7.67%), Actinomycetales (7.67%), and Flavobacteriales (4.11%).
The combined treatment had the highest nodes and edges compared to the other two groups. Furthermore, the combined treatment had the greatest average clustering coefficient, indicating that its nodes often had strong connections throughout the network.
3.5 Topology of Individual Nodes in Eukaryotic and Prokaryotic Communities
In this study, the complex patterns of interactions between the prokaryotic and eukaryotic communities were described using the topological properties of network analysis (Table 4). Furthermore, by building a co-occurrence network based on Spearman’s rank correlation, we established the topological role of each OTU in the prokaryotic and eukaryotic communities. The majority of the nodes from the networks of the control, bioaugmentation and combined treatment fell into peripherals (335, 331 and 363, respectively), module hubs (2, 2 and 1, respectively), and connectors (1, 2 and 1, respectively). Among these peripherals, 77 peripherals in the control group and the bioaugmentation network had no link outside their own modules. In parallel, 68 of the peripherals had no connection to any other module in the combined treatment network.
Notably, there were two, two, and one module hubs in the control, bioaugmentation and combined treatment networks, respectively (Fig.6). The module hubs (Rhodobacterales and Halomonadaceae) of the control network were derived from phylum Alphaproteobacteria and Gammaproteobacteria, respectively. The Synechococcales, which belongs to the phylum Cyanobacteria, were connected to the bioaugmentation network module hubs. The combined treatment network module hub was connected to the Halomonadaceae, a family of Gammaproteobacteria. The control, bioaugmentation and combined treatment networks,had one, two and one connector, respectively (Fig.6). The connectors of the control, bioaugmentation and combined treatment networks, which were classified as Flavobacteriales, Halomonadaceae, Microbacteriaceae and Bougainvilliidae, respectively, were from the phylum Flavobacteria, Gammaproteobacteria, Actinobacteria and Cnidaria.
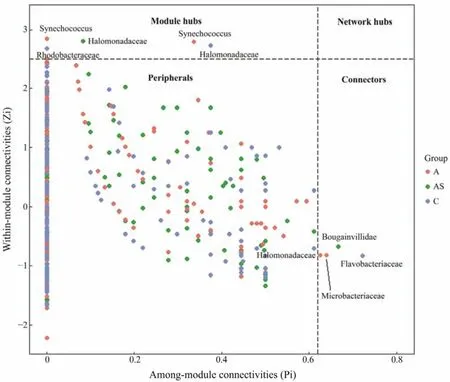
Fig.6 Zi-Pi plot shows the topological role of OTUs in prokaryotic and eukaryotic community networks. The threshold values of Zi and Pi for OTU classification were 2.5 and 0.62, respectively. Each node represented an OTU in the co-occurrence network of prokaryotic and eukaryotic communities. A, bioaugmentation treatment; B, combined treatment; C, control.
4 Discussion
4.1 Composition and Dynamic Response of Prokaryotic Community
In this study, the prokaryotic community structure of the control, bioaugmentation and combined treatment changed over time, and the dynamic changes of prokaryotic community varied among different treatments. Overall, the prokaryotic community structure changed the most at the class level in the combined treatment, followed by the control group, while no significant changes were observed in the bioaugmentation group (Fig.4A). The class Synechococcophycideae was among the most common prokaryotic community class in coastal waters, followed by Alphaproteobacteria and Actinobacteria (Fig.2A). This is consistent with recent findings (Jiet al., 2019). Similar findings were reported in a laboratory experiment, where EM treatment was ineffective in reducing the cyanobacterial growth (Lurlinget al., 2009). Alphaproteobacteria and Gammaproteobacteria as shown in Fig. 2A belong to the proteobacteria phylum, which is the most abundant in surface waters (Techtmannet al., 2015). A significant increase of Gammaproteobacteria was observed in the combined treatment compared to the control. This may be related to the addition of a biostimulant agent. In previous research, the relative abundance of bacteria with denitrification and degradation of organic pollutants, such as Proteobacteria, Bacterroidetes and Nitrospirae, was significantly increased in the remediation treatment with the application of biostimulant agents(Sunet al., 2019).
According to the species weight table (Table 2), Rhodobacterales, Oceanospirillales, Rhizobiales, Thiotrichales,Campylobacterales and Alteromonadales were increased significantly with different treatments, while Flavobacteriales declined in relative abundance. Many of these species are involved in bioremediation, indicating the significance of these communities for coastal waters. In nature,many phytoplankton species need vitamin B (Tanget al.,2010). Rhodobacterales are the second most abundant group of bacteria in the ocean (Giovannoni and Rappé, 2000) and is an important supplier of vitamin B12in the marine environment (Sa?udo-Wilhelmyyet al., 2014). Flavobacteriales can degrade the high molecular weight compounds secreted by algae into lower molecular weight compounds(Pinhassiet al., 2004). Thus, these bacteria may indirectly affect eukaryotes by controlling the abundance of nutrients.Previous studies have shown that Alteromonadales are algicidal bacteria, while Oceanospirillales has been shown to dissolve dinoflagellate cells (Leeet al., 2001; Jeonget al.,2005; Fenget al., 2019). These bacteria have the potential to affect eukaryotes through direct action. Importantly, adding EM to water led to a change in the bacteria community that favours more beneficial types (Padmavathiet al.,2012). Therefore, the growth of these beneficial bacteria in the treatment groups may be related to this result. In addition, a study has proven that EM applications are effective in reducing nutrients when combined with phytoremediation methods (Chenet al., 2013). EM applications combined with activated carbon has also been found effective in purifying polluted water (Joó and F?ldényi, 2012).
4.2 Composition and Dynamic Response of Eukaryotic Communities
The eukaryotes such as Dinoflagellata, Cryptophyta, Ciliophora and Diatom dominated the species during the entire experiment (Fig.2C). However, eukaryotic communities in coastal aquaculture area are mainly composed of Alveolata, Heterokontophyta and Chlorophyta (Acostaet al., 2013;Songet al., 2016), which shows that the major eukaryotic communities are inconsistent with our findings. The PRC indicated that the relative abundance of Chrysophyta,Dinoflagellate and Diatom declined significantly in the combined treatment, while the relative abundance of protozoan and fungi showed an increasing tend over time (Table 3). A similar trend was observed when the ponds treated with products containingSaccharomycesandBacillushad significantly lower phytoplankton abundance and species composition than the untreated group (Lukwambeet al.,2015). Phytoplankton and bacteria have complex patterns of interaction, ranging from mutualism to parasitism (Ramananet al., 2015). The reduced abundance of phytoplankton in the treatment groups in this study may be due to the bacteria and/or biostimulant invested in the treatment group, which promoted the growth of native strains and thus inhibited the phytoplankton. Alternatively, the reason may be that the treatments reduced the nutrient content of the water and thus inhibited the growth of phytoplankton. T weight of CODMnin environmental factors was more than 0.5, and the magnitude of the differences between the combined treatment group and the control group was greater in the second sampling and was maintained until the end of the experiment (Fig.3). EM was also found to reduce the COD in waste water in previous studies (Lee and Cho, 2010).The large increase in protozoa may be related to the added biostimulant agents, which was found in another study with similar results (Abedet al., 2014).
4.3 Co-Occurrence Patterns of Eukaryotic and Prokaryotic Communities
Network analysis is an effective tool for characterising eukaryotic and prokaryotic interactions at different taxonomic levels (Lupatiniet al., 2014). We determined the topological role of each OTU in the prokaryotic and eukaryotic networks by constructing a co-occurrence network based on Spearman’s rank correlation. The remaining three types of nodes except peripherals are typically identified as keystone species (Montoyaet al., 2006; Denget al.,2012; Shiet al., 2016) because of their hub location. These nodes are crucial in preserving the stability of the network structure. The loss of these key nodes may cause the decomposition of modules and networks. Oceanospirillales is one of the key nodes and is a chemoautotrophic bacterium,while some bacteria belonging to this order are algicidal(Fenget al., 2019). Flavobacteriales have a direct effect on algae (Pinhassiet al., 2004).
Overall, three real co-occurrence networks had ‘smallworld’ properties in our study. The co-occurrence network of combined treatment had the most nodes and edges in comparison to the other two groups, suggesting that the interaction between eukaryotes and prokaryotes was more complex. The average clustering coefficient can explain the dense nodes connectivity with its neighbours (Zhouet al.,2011). Nodes with high average clustering coefficient usually have more connections in the network. Consequently,OTUs in the combined treatment were more closely related to each other during our study. As a result, the co-occurrence network of combined treatment was dominated by Rhodobacterales (21.64%). This finding was consistent with the results of PRC, which showed that the relative abundance of Rhodobacterales increased during the study(Fig.4B).
5 Conclusions
The results of this study showed significant changes in prokaryotic and eukaryotic communities’ compositions over time under the bioaugmentation and combined treatment.The combined treatment group had greater and longer effects on the prokaryotic and eukaryotic communities than the control group and bioaugmentation treatment group.Additionally, topological properties of network analysis revealed that treatment complicated the interactions between the prokaryotic and eukaryotic communities. The combined treatment was effective in reducing CODMnand had an impact on the composition of the prokaryotic and eukaryotic communities. Bioaugmentation and biostimulation can be used to restore damaged water bodies in the future.
Acknowledgements
This study was supported by the National Natural Science Foundation of China (No. 42077219), the Ningbo Municipal Natural Science Foundation (No. 2019A610443),the Hangzhou Municipal Agriculture and Social Development Project (No. 2020ZDSJ0697), and the Fundamental Research Funds for the Provincial Universities of Zhejiang (No. SJLY2020011).
 Journal of Ocean University of China2024年1期
- Journal of Ocean University of China的其它文章
- Overview on Mangrove Forest Disaster Prevention and Mitigation Functions
- Comparisons of Wave Force Model Effects on the Structural Responses and Fatigue Loads of a Semi-SubmersibleFloating Wind Turbine
- Long-Term Extreme Wave Characteristics in the Water Adjacent to China Based on ERA5 Reanalysis Data
- Joint Probability Analysis and Prediction of Sea Ice Conditions in Liaodong Bay
- The Variation of Plankton Community Structure in Artificial Reef Area and Adjacent Waters in Haizhou Bay
- Transcriptome Analysis of Heterosis in Survival in the Hybrid Progenies of ‘Haida No. 1’ and Orange-Shelled Lines ofthe Pacific Oyster Crassostrea gigas