
Impacts of Aggregation Methods and Trophospecies Number on the Structure and Function of Marine Food Webs
2024-03-12 11:14:24LIPengchengZHANGChongliangXUBinduoJIYupengLIFanRENYipingandXUEYing
LI Pengcheng , ZHANG Chongliang , XU Binduo , JI Yupeng , LI Fan,REN Yiping , , and XUE Ying ,
1) Laboratory of Fisheries Ecosystem Monitoring and Assessment, College of Fisheries, Ocean University of China,Qingdao 266003, China
2) Field Observation and Research Station of Haizhou Bay Fishery Ecosystem, Ministry of Education, Qingdao 266003, China
3) Shandong Marine Resources and Environment Research Institute, Shandong Provincial Key Laboratory of Restoration for Marine Ecology, Yantai 264006,China
4) Laboratory for Marine Fisheries Science and Food Production Processes, Laoshan Laboratory, Qingdao 266237,China
Abstract Aggregation of species with similar ecological properties is one of the effective methods to simplify food web researches.However, species aggregation will affect not only the complexity of modeling process but also the accuracy of models’ outputs. Selection of aggregation methods and the number of trophospecies are the keys to study the simplification of food web. In this study,three aggregation methods, including taxonomic aggregation (TA), structural equivalence aggregation (SEA), and self-organizing maps(SOM), were analyzed and compared with the linear inverse model – Markov Chain Monte Carlo (LIM-MCMC) model. Impacts of aggregation methods and trophospecies number on food webs were evaluated based on the robustness and unitless of ecological network indices. Results showed that aggregation method of SEA performed better than the other two methods in estimating food web structure and function indices. The effects of aggregation methods were driven by the differences in species aggregation principles,which will alter food web structure and function through the redistribution of energy flow. According to the results of mean absolute percentage error (MAPE) which can be applied to evaluate the accuracy of the model, we found that MAPE in food web indices will increase with the reducing trophospecies number, and MAPE in food web function indices were smaller and more stable than those in food web structure indices. Therefore, trade-off between simplifying food webs and reflecting the status of ecosystem should be considered in food web studies. These findings highlight the importance of aggregation methods and trophospecies number in the analysis of food web simplification. This study provided a framework to explore the extent to which food web models are affected by different species aggregation, and will provide scientific basis for the construction of food webs.
Key words LIM-MCMC model; species aggregation; trophospecies number; aggregation methods; food web indices
1 Introduction
In food web models, species are often aggregated into functional groups to simplify community structure (Austenet al., 1994). These functional groups are also known as‘trophospecies’,i.e., with similar ecological properties (Meyers, 2009). Species aggregation, which includes aggregation methods and trophospecies number, is often applied to address a variety of ecological issues, such as assessing how community composition changes with habitat (Osukaet al.,2018), how fishery exploitation affects the stability of food webs (Houket al., 2018), how fish microplastic intake changes (Garnieret al., 2019), and even to explore different fishing management scenarios (Ricciet al., 2021). Despite the widespread application of species aggregation, this method has some limitations especially when it is applied in marine ecosystems. Selection of aggregation methods is often arbitrary, and inconsistent conclusions often exist due to the application of different aggregation methods in the same research area (Bodiniet al., 2009; Planqueet al., 2014;Benoitet al., 2021). In addition, previous studies have often ignored the trade-off between simplifying food webs and reflecting ecosystem status.
Selection of aggregation methods and the number of trophospecies are the keys to examine the structure and function of food webs, which will affect not only the complexity of modeling process but also the accuracy of models’outputs. Previous studies tended to aggregate species based on one single property of these species, such as reproducetion (Balon, 1975), taxonomic distinctness (Cattinet al.,2004), life history (Blancket al., 2007), diet preference(Frimpong and Angermeier, 2009), habitat characteristics(Froese and Pauly, 2019), morphological traits (Córdova-Tapia and Zambrano, 2016), and so on. In addition, species aggregation can also be multi-dimensional. For example,Winemilleret al. (2015) conducted species aggregation based on five ecological dimensions, including habitat, lifehistory strategy, trophic, defense, and metabolism. Different types of aggregation methods have different implications for simplifying the construction of food web models and subsequent ecosystem analysis. Appropriate aggregation methods, trophospecies number, and reliable model outputs are critically important when analyzing food webs and marine ecosystems. However, few studies have evaluated the effects of different aggregation methods and trophospecies number on the outputs of food web models.
Exploring structure and function variations in food webs will contribute to the understanding of complex processes of marine ecosystems (Malaterreet al., 2019). And the outputs of ecosystem models could effectively reflect the status of marine food webs. Linear inverse model (LIM) is a valuable ecosystem modeling tool for describing the structure and function of food webs at the ecosystem level because of its moderate data requirements and flexibility to accommodate future updates (Leguerrieret al., 2007). It was initially adapted by Vézina and Platt (1988) from the physical sciences to ecology, and subsequently widely used for rebuilding food webs (Juliuset al., 2009; Oevelenet al.,2010), energy flow analysis (Chaalaliet al., 2015; Niquilet al., 2020), and ecological modelling (Koneset al., 2006;Laenderet al., 2010). The LIM has the ability to estimate unknown energy flows from incomplete data sets (Marquiset al., 2007; Olsenet al., 2007; Oevelenet al., 2010), allowing the estimation of difficult-to-measure process in the food web (Anhet al., 2015) to be employed for assessing the structure and function of food webs. Combined with Markov chain Monte Carlo (MCMC) methods, LIM can effectively avoid underestimating the scale and complexity of food webs by providing probabilistic distributions of energy flows in ecosystems (Koneset al., 2006; Johnson and Mcelhaney, 2009). LIM-MCMC model has now been applied in many food web researches (Savenkoffet al.,2004, 2007; Chaalaliet al., 2015).
In this study, three representative aggregation methods,including taxonomic aggregation (TA), structural equivalence aggregation (SEA), and self-organizing maps (SOM),were analyzed and compared in the construction of LIMMCMC model. Impacts of aggregation methods and trophospecies number on the structure and function of food webs were evaluated based on the robustness and unitless of ecological network indices. The status of food webs and different models’ outputs were evaluated and compared with the reference values and the mean absolute percentage error (MAPE). The reference value is the output of the initial model, which is a food web model constructed at the lowest classification level. This study aimed to provide a framework to evaluate different aggregation methods and trophospecies numbers to understand the characteristics of food webs in marine ecosystems, and help to provide scientific basis for the construction of simplified food webs.
2 Materials and Methods
2.1 Study Area
The survey area is Haizhou Bay, which is an important fishing ground and spawning habitat in the Yellow Sea(Zhanget al., 2015). Bottom trawl surveys were conducted in spring (April) and autumn (September) of 2018 by stratified random sampling. The survey area was from 119?20? to 121?20?E and 34?20? to 35?40?N (Fig.1). Detailed description of the survey design is available in the research of Xuet al. (2015). The trawl was towed for about 1 hour at a speed of 2 – 3 knots. The mesh size is 17 mm and the width of the net is 12 m. Catch data were standardized to 1 hour haul at 2 knots.
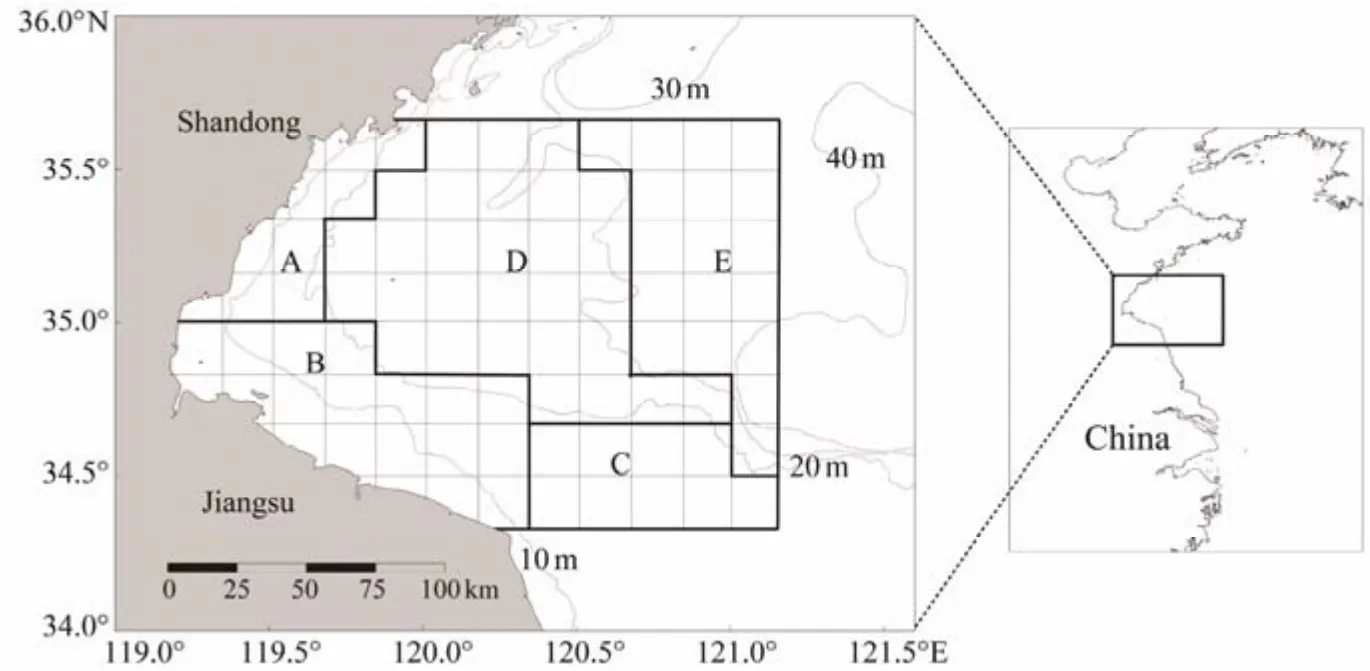
Fig.1 Sampling areas in Haizhou Bay, China.
2.2 Data Sources
Data for each species included biomass (B), diet composition (DC), production/biomass (P/B), consumption/biomass (Q/B), respiration/biomass (R/B) and unassimilated/biomass (U/B).Bwas primarily collected from the fisheryindependent surveys in 2018. DC of most fish species was obtained by the stomach content analysis in samples collected in Haizhou Bay from 2011 to 2018, and others were from published results (Yang and Tan, 2000; Zhang, 2004;Xuet al., 2012; Froese and Pauly, 2019).P/B, Q/B, R/B,andU/Bof groups were from published data of Haizhou Bay and nearby areas (Linet al., 2009; Liet al., 2010;Zhanget al., 2015; Linet al., 2018; Wanget al., 2018;Liuet al., 2019).
2.3 Aggregation of Species
Three representative species aggregation methods are selected in this study, considering the taxonomic resemblance between species, similarity of diet composition, and multiple factors.
2.3.1 Taxonomic aggregation (TA)
TA is based on the taxonomic similarity between species(Hall and Raffaelli, 1991). The similarity can be defined by the length of paths of the standard Linnaean connecting these species (Warwick and Clarke, 2001). Existing descriptions of some taxa are incomplete because they are not defined at the species level. Therefore, species clustering occurs at each taxonomic level, forming six distinct food webs,such as species, genus, family, order, class, and phylum.
2.3.2 Structural equivalence aggregation (SEA)
In SEA, the similarity between species is determined by the Jaccard index (Martinez, 1993), which is defined by the resemblance between preys and predators (Martinez, 1991).The coefficient is decomposed into two simple indices to measure preys, and predators’ similarities, respectively. To reflect the differences, different weights for preys (0.6) and predators (0.4) were assigned (Martinez, 1993). The similarity between species directly affects the aggregation of species and the number of trophospecies. In order to explore the effects of different trophospecies numbers on the structure and function of the food web, we reduced the Jaccard index by 10% successively, and constructed simplified food webs ranging from 90% to 30%.
Jaccard index was calculated as:
whereAirepresents the collection of speciesifeeding on prey, andBjrepresents the collection of prey speciesj.
2.3.3 Self-organizing maps (SOM)
SOM aggregate multidimensional input variables and reduce them to two-dimensional representations. It considers not only diet compositions but also other physiological and ecological characteristics, such as taxonomy of organisms, feeding habits, temperature adaptation, spawning type, suitable habitat, migration, biomass, and other variables. The method implements species aggregation through the ‘Kohonen’ package in R. We used the 26 evaluation indices defined by the ‘Nbclust’ package in R to measure trophospecies. The optimal aggregate was determined by gradually increasing the number of trophospecies.
2.4 Modelling Procedure
2.4.1 LIM-MCMC model
The LIM-MCMC approach provides a more realistic flow estimate by performing stochastic jumps and randomly sampling the LIM solution space using an MCMC algorithm.The model assumes that the energy input and output of each species or trophospecies in the food web are balanced(Tecchioet al., 2016). The equation for energy balance is as follows:
Production (Q) = Output (P) + Excretion (U) + Respiration (R).The model calculates unavailable parameter-constrained energy inputs and outputs through mass balance equations and disequilibrium equations that constrain the values of energy flow (Koneset al., 2006).
LIM-MCMC consists of two matrix equations (Oevelenet al., 2010):
whereE(m×n)andG(c×n)represent the energy flow path coefficient matrix,mrepresents the mass balance of each species or trophospecies, and the known energy flow pathway data is measured experimentally.cmeans the number of inequalities added to the model,nis the number of energy flow paths (x1,x2,???,xn),Fis the matrix of equation values (m×1), andhis the value of inequalities.
2.4.2 Model construction and implementation
The energy flow in the model is based on the biological wet weight of species or trophospecies (t (km2yr)–1) in the ecosystem. In addition, combined with diet composition and Eq. (3), Eq. (4) limits the energy flow range of each species or trophospecies according to parameters such asP/B,Q/B, R/B, andU/B. The presence of multiple difficult-toquantify energy flow paths in the model and the uncertainty inherent in the data inputs are by calculating the mean value of each energy flow path using the MCMC algorithm (Koneset al., 2006). A detailed description of the model construction is available in Niquilet al. (2011). The model is through two package implementations, ‘Lim’ and‘LimSolve’ (Soetaert and Oevelen, 2008; Soetaertet al.,2008) in R (version 3.5.2).
2.4.3 Model error assessment
The model obtained the mean value of energy flow by MCMC algorithm and the calculations of mean value were repeated 1000 times to reduce the chance error. Different food web models were constructed by aggregation methods and trophospecies number. They were used to calculate MAPE of food web structure and function indices with the reference value based on their outputs, respectively. MAPE is a relative measure that can avoid the mutual offset of positive and negative errors and is often used to measure the accuracy of the model prediction. The mean value of MAPE is considered as an error judgment standard for simulating food web structure and function. The formula of MAPE was as follows:
wheredenotes the model predicted values andyidenotes the initial model result. The range ofMvalue is (0, +∞),M= 0% indicates a perfect model, andMgreater than 100%indicates an inferior model. The closer theMvalue is to 0%, the better the model prediction performance is.
2.5 Food Web Evaluation Indices
Combined with relevant references, the selection of robustness (Fedor and Vasas, 2009) and unitless indices (Juliuset al., 2009) are crucial for the analysis and evaluation of the status of different food web models. Evaluation of food webs includes structure and function properties (Chaalaliet al., 2016).
2.5.1 Food web structure indices
Four food web indices were selected to evaluate the effects of aggregation methods and trophospecies number on food web structure, including directed connectance (C), cannibalism (Can), predator-prey ratio (PPr), and Finn cycling index (FCI). Most of these indices are considered robust to aggregation (Jordán and Scheuring, 2004; Dunneet al., 2008). Among them,Cdescribes the proportion of realized links in possible trophic chains, illustrating the complexity of food webs.Canis common in studies of food web structure (Dunneet al., 2008), which measures the proportion of individuals of a species feeding on the same species.PPrmay be robust to Jaccard similaritybased linking standards and aggregation (Landrock and Sambale, 2017).FCIis the ratio of circulating flux to total system flux, which quantifies the proportion of all flows involved in recovery (Finn, 1980).
2.5.2 Food web function indices
We used four unitless ecological network indices (Juliuset al., 2009) to investigate the effects of aggregation methods and trophospecies number on food web function. Extent of development (AC) measures the development (Latham, 2006) and regeneration potential (Ulanowicz, 2000)of the ecosystem. Constraint efficiency (CE) is the extent to which inherent network constraints contribute to maximum network uncertainty (Latham II and Scully, 2002).Realized uncertainty (RUR) compared the degree of restraint across ecosystems (Latham II and Scully, 2004). Synergism index (b/c) is the ratio of positive to negative interactions, describing the degree of positive interactions in a network (Fath, 2004). An index greater than 1.00 means that the ecosystem has more important positive interactions.
Most of these food web evaluation indices (Table 1) were implemented directly or indirectly by NetMatCalc software(Latham, 2006).
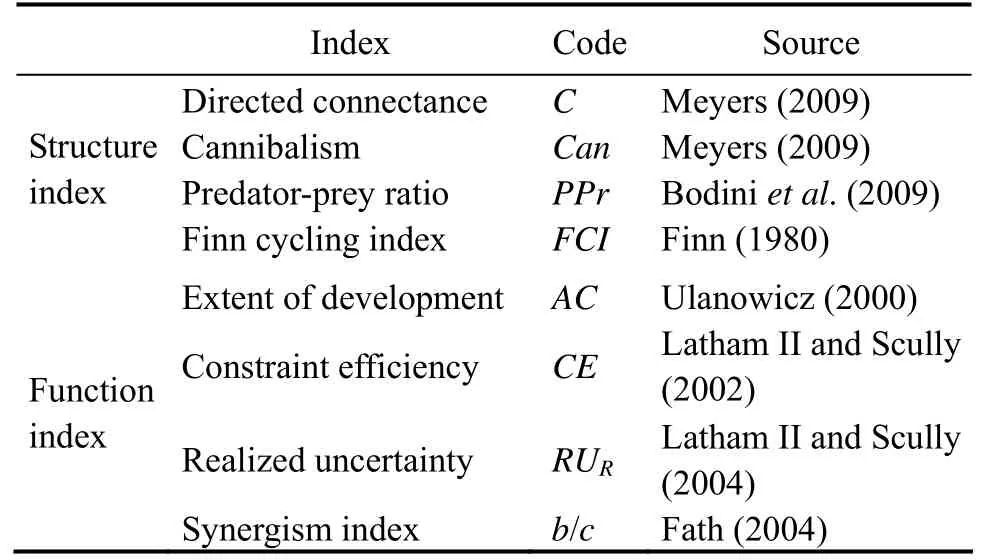
Table 1 Food web evaluation indices used in this study
3 Results
3.1 Species Aggregation Using Different Aggregation Methods
TA defined a similarity classification of phylum, class,order, family, genus, and species based on standard Linnaean path lengths (Table 2). The species-based aggregation is the lowest taxonomic level that serves as reference value. SEA judged the similarity by the Jaccard index and divided by 10% as a gradient, resulting in different levels of ≥ 30%, ≥ 40%, ≥ 50%, ≥ 60%, ≥ 70%, ≥ 80%, ≥ 90% (Table 2). SOM determined the optimal number of aggregations by gradually incrementing once at a time. The optimal number was 5 when the number of trophospecies was between 2 and 60. However, the optimal number became 47 when the trophospecies number was between 61 and 72 (Table 2).
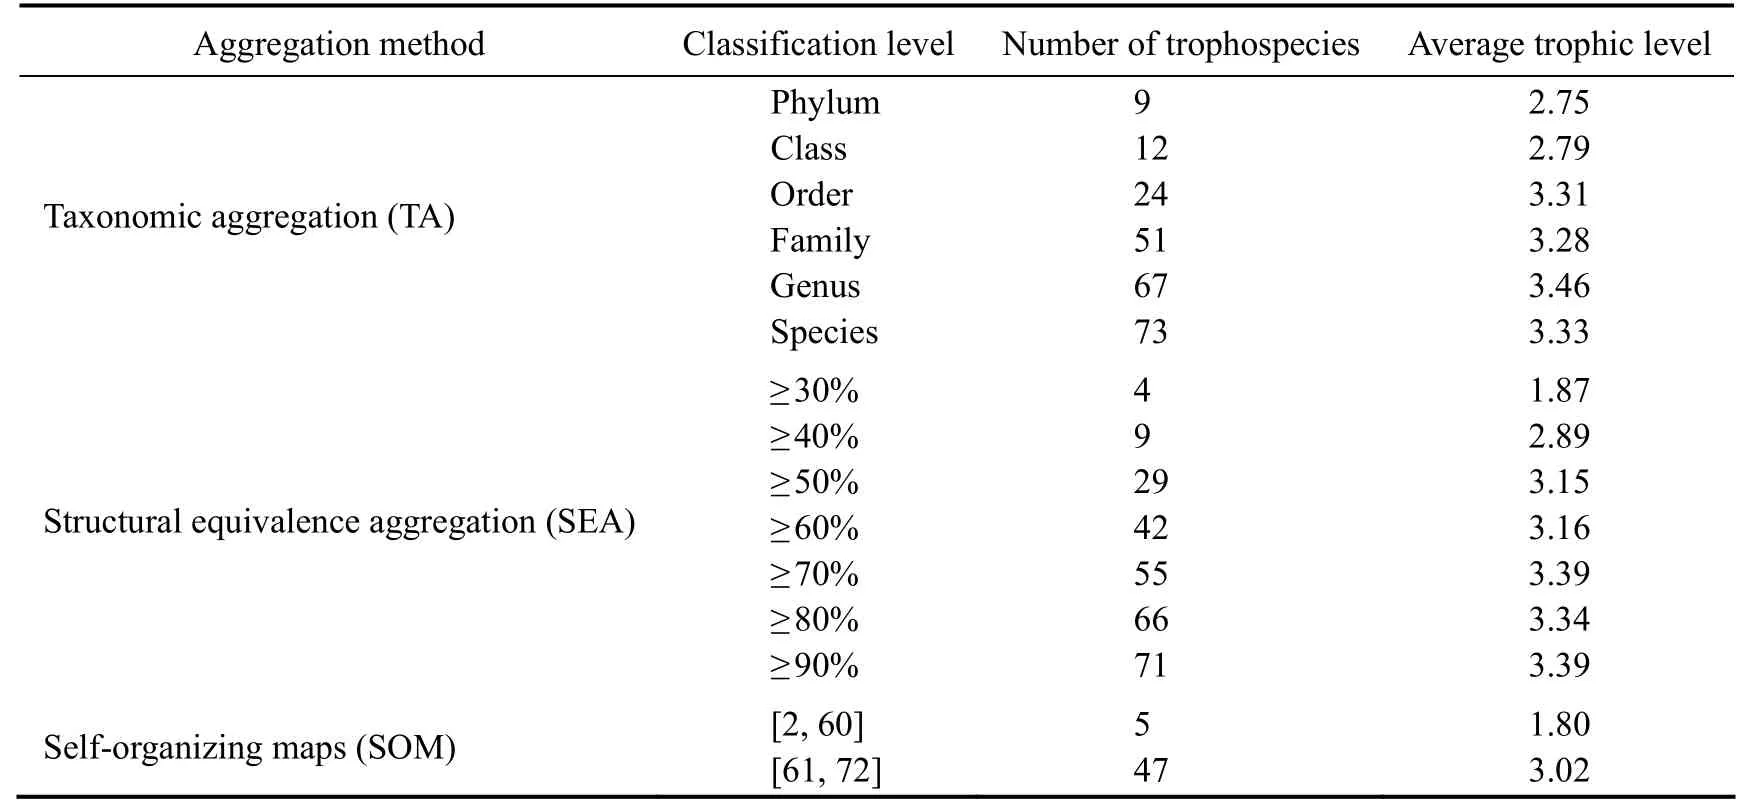
Table 2 Aggregation results of three aggregation methods
3.2 Structure and Function Indices in Food Webs
According to the classification results of different aggregation methods, modeling was conducted, including 14 simplified food web models and 1 initial model (Table 3). The food web structure and function indices simulated by different aggregation methods and trophospecies-driven ecosystem models were showed in Table 3. Taking the output of the initial model as the reference values, the results includeC(0.18),Can(0.14),PPr(1.29),FCI(0.44) of the structure indices andAC(0.50),CE(0.79),RUR(0.68),b/c(0.50) of the function indices, respectively.

Table 3 Food web structures and function indices calculated by different aggregation methods and trophospecies number (in brackets)
There were obvious differences in the estimation of food web structure indices with these aggregation methods. For indicesCandCan, the values calculated by the aggregation method of SEA were closer to the reference value. For the index ofPPr, the value estimated by TA was closer to the reference value than those estimated by the other two methods (SEA and SOM). Notably, the aggregation method of SOM provided better estimates ofFCIin contrast to other food web structure indices (shown in Fig.2 and Table 3).
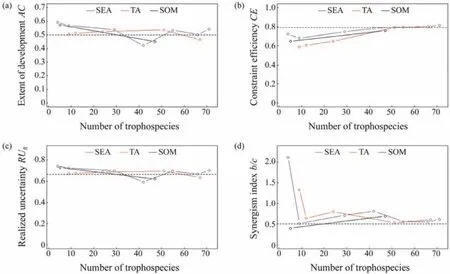
Fig.2 Variations of four food web structure indices calculated by three aggregation methods. The blue, red and black lines indicate structural equivalence aggregation (SEA), taxonomic aggregation (TA), and self-organizing maps (SOM) respectively. The dotted line indicates the reference values.
Compared with food web structure indices, the variations in food web function indices estimated by different aggregation methods were relatively small. For indicesAC, CEandRUR, the values calculated by three aggregation methods fluctuated around the reference values. For indexb/c, the value was influenced mainly by the number of trophospecies, and it was closer to the reference value when the number of trophospecies was greater than 50 (Fig.3, Table 3).

Fig.3 Variations of four food web function indices calculated by three species aggregation methods. The meanings of different lines are the same as Fig.2.
3.3 Error Estimations of Food Web Indices
The MAPE of food web structure indices ranged from 26.01% to 177.63%, decreasing with the number of trophospecies (Table 4). MAPE of food web structure indices exceeded 100% when the numbers of trophospecies were too small for the three aggregation methods. Compared with the structure of the food web, MAPE of the function indices were relatively small, ranging from 3.68% to 89.42%, being less than 100% for three aggregation methods (Table 4).
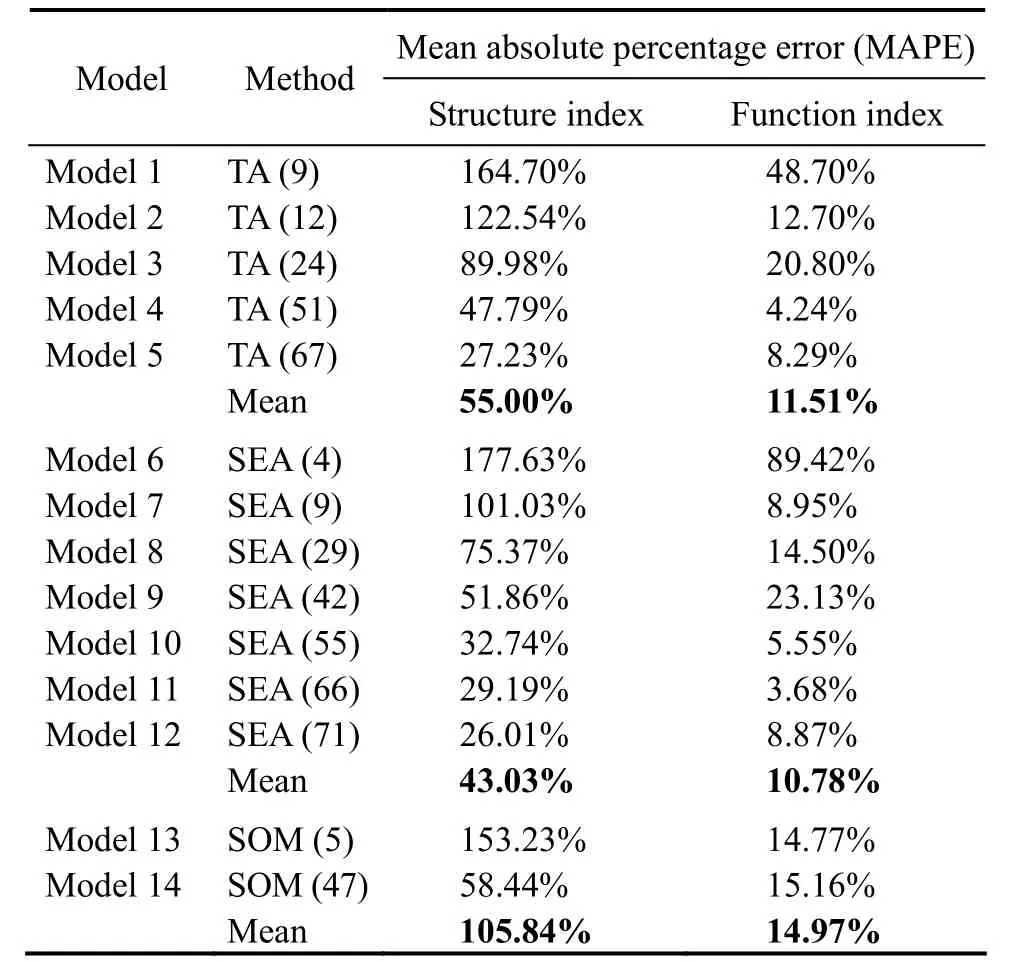
Table 4 MAPE of food web structure and function indices estimated by three aggregation methods
4 Discussion
4.1 Impacts of Aggregation Methods on Food Web Indices
It was found that different aggregation methods were not equally sensitive to missing data, resulting in different biases in describing the structure of the food web. Appropriate aggregation methods are prerequisites for food web researches. We found that the different performance of aggregation methods on the food web structure indices is mainly due to the variation in the principles of species aggregation. MAPE of food web structure indices calculated based on SEA was smaller than the other two species aggregation methods (TA and SOM). For SEA, the similarity between species is determined by the similarity between their preys and predators (Martinez, 1991). The energy flow paths indicate the state of feeding relationships between trophospecies. TA based on the taxonomic similarity between species (Macnaughtonet al., 2016; Linet al., 2017). It has been shown that species with high evolutionary similarity may have similar feeding and ecological niches, as well as morphology, due to exposure to similar pressures (Frimpong and Angermeier, 2009; Bower and Piller, 2015). This approach circumvents differentiation between evolutionarily similarspecies and thus has implications for estimating food web structure indices. In contrast, SOM differs from the other two aggregation methods (SEA and TA) by considering multidimensional factors, ensuring that aggregation is not based on single attributes (Welcommeet al., 2006). Although this method is more stable in estimating food web structure indices, the assignment of weights to multiple dimensional factors may overestimate or underestimate food web indices compared to the results of aggregation methods using a single factor (Kind and Brunner, 2013).
Unlike the food web structure indices, the variations in food web function indices estimated by different aggregation methods were relatively small. Food web function indices can be used to evaluate the condition of ecosystems.However, differences in the aggregation methods (TA, SEA and SOM) defining network nodes may have implications for the food web. This study showed that SEA is more suitable for the estimation of food web function indices than the other two methods (TA and SOM). TA is a general solution to reduce data bias, but information loss will inevitably occur (Patonai and Jordán, 2017). In this network, we integrate the different stages of development of the species.For most fishes, this usually means an uncertain aggregation of both small and large individuals. Individuals have different habitat and feeding preferences at different life stages (Specziár and Rezus, 2009), and these changes have to be taken into consideration during the aggregation process, which will inevitably have impacts on food web function.
SOM’s unsupervised neural network algorithm achieves better classification in a process when high multidimensional attributes make it difficult to classify and distinguish one cluster from another (Crespoet al., 2020). SOM is formed according to the similarity and pattern of a series of attributes in the input data, resulting in high stability. However, SEA is a completely different approach based on topological aggregation (Luczkovichet al., 2003). Based on the network position, the similarity between the positions of network nodesiandjis quantified (Patonai and Jordán,2017). In the process of data aggregation, it is assumed that there are similar nodes in the network, which can be considered functionally equivalent (Giacomuzzo and Jordan,2021). Therefore, aggregation method based on network node similarity can better maintain the function of the food web.
4.2 Impacts of Trophospecies Number on Food Web Indices
The reduction of trophospecies number is often accompanied by the loss of food web information. The results showed that the structure indices of food web were more affected by the number of trophospecies, while the function indices were less affected. Non-linear relationship was found between the loss of food web structural information and the number of trophospecies.Can, CandPPrare commonly used indicators to reflect the structural complexity of food webs (Williams and Martinez, 2000; Dunneet al., 2008).Aggregation of species could lead to the mix of species with distinct ecosystem roles, reduction of network nodes,total number of connections and species, which will result in the alteration of food web structure (Olivier and Planque, 2017). Combined with the correlation error analysis,especially the low number of trophospecies, the model has a large MAPE for estimating the food web structure indices. The MAPE of Models 1 – 2, Models 6 – 7, and Model 13 were >100%, indicating poor quality of models. Taking SEA as an example, the number of trophospecies should not be too small (SEA ≥ 60%) during the merging of species,otherwise there will be a large deviation in the model outputs. In addition, the merging of trophospecies may also change the energy flow and transfer efficiency between trophospecies, such asFCI. Changes in the number of trophospecies will affect the construction of LIM model, directly affect the energy flow path of the model and indirectly affect the change of energy flow value through energy flow limitation (Oevelenet al., 2010).
However, it is worth noting that although complex ecosystems contain many species, major ecological processes may depend on only a small fraction of species (Wardle,2002). The results also showed that MAPE was at a low level under most conditions, especially when the number of trophospecies was more than 50, indicating that the model has high accuracy and could better reflect the function status of the food web. Only under extreme conditions of species aggregation (Model 1 and Model 6), some indices of food web function changed qualitatively. Therefore, the analysis should be carried out from structure and function aspects when exploring the influence of trophospecies number on the status of food web, and different selection criteria should be taken according to the purpose of research.
4.3 Implications for Future Research
Variation in food web indices in different models indicate that species aggregation plays an important role in exploring the structure and function of food webs. In food web research, the trade-off between simplifying food webs and reflecting the status of ecosystems should be considered.It was found that species aggregation could affect the outputs of food web models and reduce the accuracy of some indices. Selecting appropriate aggregation method and trophospecies number are prerequisites to explore the status of food webs.
Although this study determined that SEA was the most appropriate aggregation method (superior to TA and SOM),it may not be suitable for all ecosystems. This study provides a framework for discussing the effects of the simplified food web model constructed by the aggregation of different species on the marine ecosystem, and will provide a scientific basis for the construction of simplified food web.In addition, the framework can provide accurate and knowable indicators of food web structure and function for analyzing the state of marine ecosystems. Meanwhile, a simplified food web model based on a scientific aggregation method and a determined number of trophospecies can enhance the credibility of our results. These findings will help us further understand the importance of selecting suitable aggregation methods and trophospecies number in exploring the structure and function of food webs.
Acknowledgements
We are grateful to the colleagues and graduate students in the Fisheries Ecosystem Monitoring and Assessment Laboratory for their assistance in field sampling and sample analysis. This study was supported by the National Key R&D Program of China (Nos. 2019YFD0901204, 2019YFD 0901205).
 Journal of Ocean University of China2024年1期
- Journal of Ocean University of China的其它文章
- Overview on Mangrove Forest Disaster Prevention and Mitigation Functions
- Comparisons of Wave Force Model Effects on the Structural Responses and Fatigue Loads of a Semi-SubmersibleFloating Wind Turbine
- Long-Term Extreme Wave Characteristics in the Water Adjacent to China Based on ERA5 Reanalysis Data
- Joint Probability Analysis and Prediction of Sea Ice Conditions in Liaodong Bay
- The Variation of Plankton Community Structure in Artificial Reef Area and Adjacent Waters in Haizhou Bay
- Transcriptome Analysis of Heterosis in Survival in the Hybrid Progenies of ‘Haida No. 1’ and Orange-Shelled Lines ofthe Pacific Oyster Crassostrea gigas