
ldentification and validation of a pyroptosis-related prognostic model for colorectal cancer based on bulk and single-cell RNA sequencing data
2024-03-07 04:29:50LiHuaZhuJunYangYunFeiZhangLiYanWanRongLinWeiQingLiu
Li-Hua Zhu,Jun Yang,Yun-Fei Zhang,Li Yan,Wan-Rong Lin,Wei-Qing Liu
Abstract BACKGROUND Pyroptosis impacts the development of malignant tumors,yet its role in colorectal cancer (CRC) prognosis remains uncertain.AIM To assess the prognostic significance of pyroptosis-related genes and their association with CRC immune infiltration.METHODS Gene expression data were obtained from The Cancer Genome Atlas (TCGA) and single-cell RNA sequencing dataset GSE178341 from the Gene Expression Omnibus (GEO).Pyroptosis-related gene expression in cell clusters was analyzed,and enrichment analysis was conducted.A pyroptosis-related risk model was developed using the LASSO regression algorithm,with prediction accuracy assessed through K-M and receiver operating characteristic analyses.A nomogram predicting survival was created,and the correlation between the risk model and immune infiltration was analyzed using CIBERSORTx calculations.Finally,the differential expression of the 8 prognostic genes between CRC and normal samples was verified by analyzing TCGA-COADREAD data from the UCSC database.RESULTS An effective pyroptosis-related risk model was constructed using 8 genes-CHMP2B,SDHB,BST2,UBE2D2,GJA1,AIM2,PDCD6IP,and SEZ6L2 (P < 0.05).Seven of these genes exhibited differential expression between CRC and normal samples based on TCGA database analysis (P < 0.05).Patients with higher risk scores demonstrated increased death risk and reduced overall survival (P < 0.05).Significant differences in immune infiltration were observed between low-and high-risk groups,correlating with pyroptosis-related gene expression.CONCLUSION We developed a pyroptosis-related prognostic model for CRC,affirming its correlation with immune infiltration.This model may prove useful for CRC prognostic evaluation.
Key Words: Colorectal cancer;Pyroptosis;Single-cell RNA sequencing;Immune infiltration;Prognostic model
lNTRODUCTlON
Colorectal cancer (CRC) is the prevalent malignancy and consider the second most common cause of cancer deaths globally[1,2].Genetic,lifestyle,obesity and environmental factors are considered as main causative agents of CRC[3].Besides,changes in the microenvironment of cells also proved to affect the growth development of this disease[4-8].The prognosis for CRC is grim,with nearly 20% of patients progressing to stage 4 and an additional 20%-50% of early-stage patients developing metastatic disease[9].While immunotherapy introduces a promising avenue for CRC treatment,its effectiveness hinges on the intricacies of the immune microenvironment[10-12].Although numerous biomarkers identified through traditional methods based on bulk RNA sequencing,such as methylation[13],lncRNA[14],and IGFBP-2[15],their accuracy in predicting CRC prognosis and the association with the tumor microenvironment (TME) is insufficient.Hence,there is an urgent need to develop a novel prognostic model with advanced technology for effective risk stratification and prediction of immunotherapy outcomes in CRC.
Pyroptosis,defined as gasdermin-mediated programmed cell death,has been established to influence tumor development[16-19].By modulating the immune microenvironment,pyroptosis plays a crucial role in the prognosis of various cancers,including CRC.Notably,pyroptosis-related genes likeIL-18,CASP1,GSDMB,andGASP5have been utilized to construct prognostic models for bladder,ovarian,and gastric cancers[20-22].However,many of these models relied on bulk RNA sequencing levels,and adequate pyroptosis-related prognostic models specifically tailored for CRC are lacking.
To date,single-cell RNA sequencing (scRNA-seq) has emerged as the optimal method for discovering,identifying,and validating new biomarkers,particularly in TME research[23].This technique offers genomic and transcriptomic insights into cancers at the single-cell RNA level,surpassing the limitations of bulk RNA sequencing[24-27].Leveraging scRNAseq,we developed a pyroptosis-related prognostic model for CRC and explored potential correlations between pyroptosis and immune infiltration.This study contributes valuable insights for clinical management and immunization research in CRC.
MATERlALS AND METHODS
Data source
The scRNA-seq dataset GSE178341,obtained from the Gene Expression Omnibus (GEO,https://www.ncbi.nlm.nih.gov/geo/) database[28],encompasses 61 CRC and 27 non-malignant colorectal tissues.This dataset,encompassing diverse clinical conditions,facilitates comprehensive analyses,offering profound insights into the involvement of pyroptosisrelated genes in CRC.Additionally,its widespread use allows for robust comparisons and validation with other studies,augmenting the reliability of our research outcomes.The “The Cancer Genome Atlas (TCGA) biolinks” package of R software (version 2.22.4)[19] was employed to retrieve TCGA-colon adenocarcinoma (TCGA-COAD) and TCGA-rectum adenocarcinoma (TCGA-READ) raw counts expression data and clinical data,comprising 578 CRC tumor samples and 106 paracancer samples.Merging these two expression matrices resulted in a baseline fact sheet with 619 cases containingclinical information (Table 1).Prognostic analyses were conducted on the samples that contained COAD and READ data.
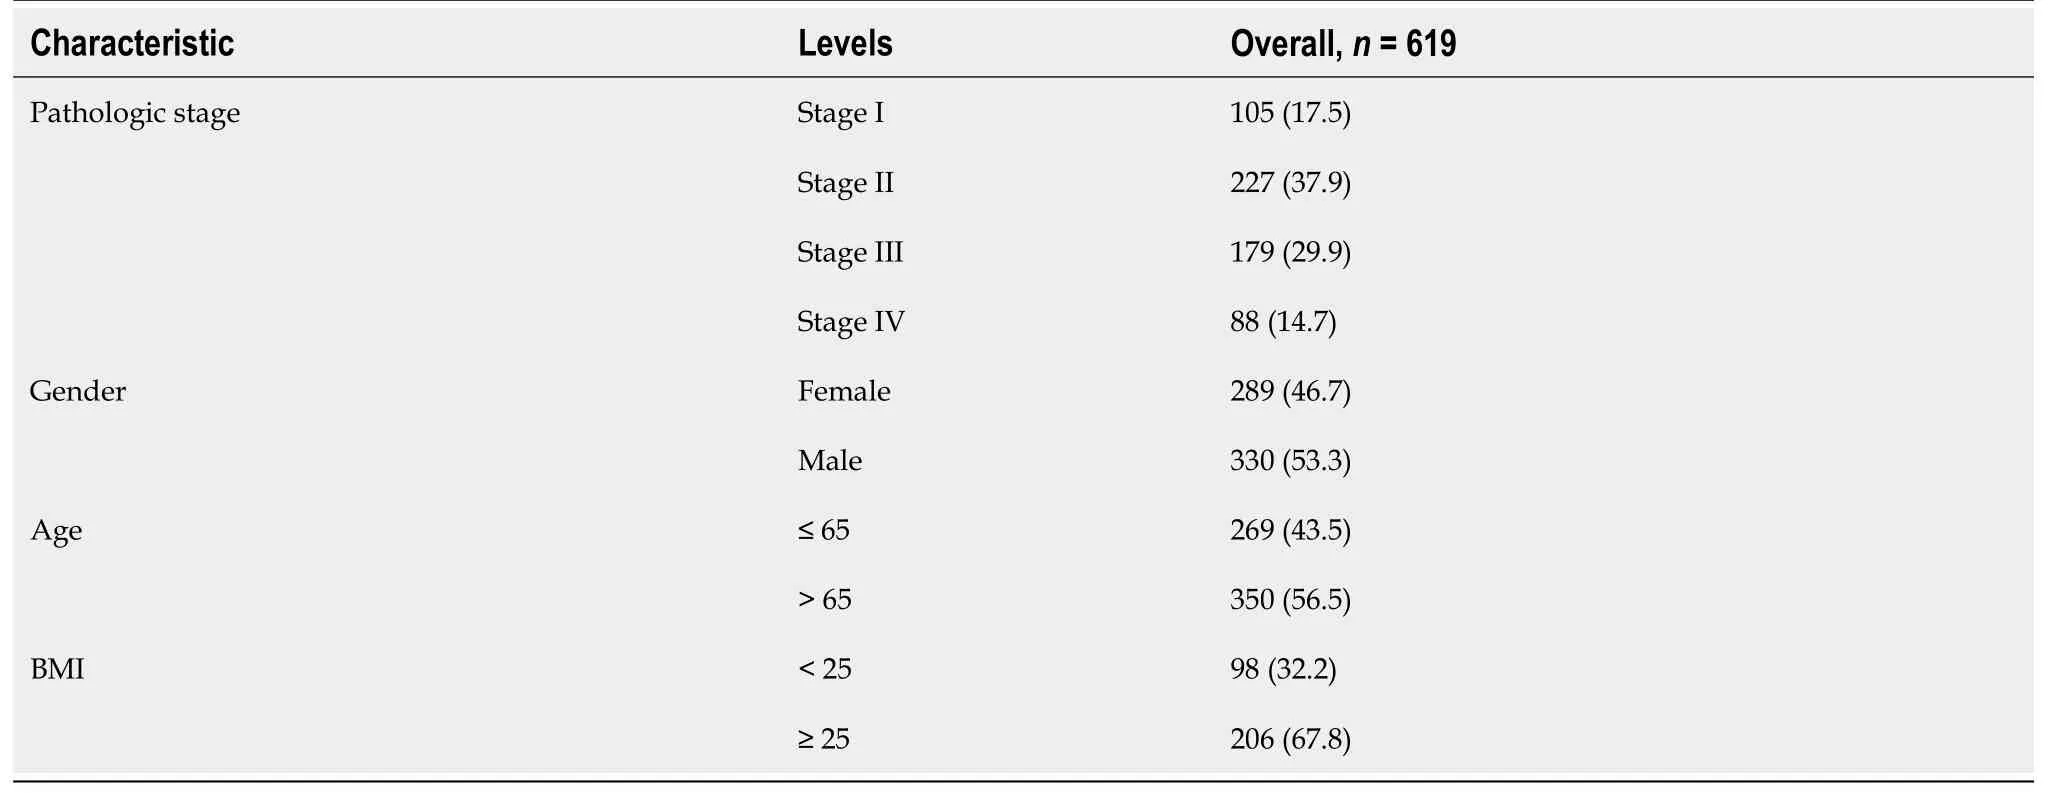
Table 1 Baseline fact sheet,n (%)
Quality control of the data by Seurat
The R software (https://www.r-project.org/,version 4.1) and the R package Seurat (version 4.0.5)[29] were installed,and the expression matrix of the GSE178341 dataset was created as a Seurat object.Cells with > 20% mitochondrial genes,potentially indicating a stressful state,were excluded.Cells with FEATURE < 200 or > 3000 were also filtered,resulting in 115489 cells.
Subsequently,the sequencing depth of the dataset was normalized using the “NormalizeData” function with the default “LogNormalize” standardization method.The “FindVariableFeatures” function,employing the “vst” method,identified 2000 variable features of the dataset.Data scaling,utilizing the “ScaleData” function,mitigated the impact of sequencing depth.Principal Component Analysis (PCA) identified significant PCs[30],and the Elbowplot function visualized thePvalue distribution.For the Uniform Manifold Approximation and Projection (UMAP) analysis,30 PCs were selected.The Louvain algorithm,through the “FindClusters” function,optimized class groups,resulting in 38 different clusters with a resolution of 0.8.Finally,the “RunUMAP” function enabled dimensionality reduction for dataset visualization and exploration.The “FindAllMarkers” function compared gene expression of cell clusters with the gene expression of all other cell clusters.
Cell types annotating
The Blueprint Encode in SingleR (version 1.8.1)[31] was employed to annotate cell types in the single-cell data.Identified cell types included T cells,NK cells,B cells,plasma cells,epithelial cells,myeloid cells (DC,Macrophage,Monocyte),stromal cells,mast cells,and endothelial cells.Differential genes between cell types were identified using the “FindAll-Markers” function.
Pyroptosis-related differently expressed genes among cell clusters
A total of 427 pyroptosis-related genes were obtained from the Gene Cards database (https://www.genecards.org/)[32](Supplementary Table 1).The genes were intersected with marker genes of cell clusters for obtaining the pyroptosisrelated differently expressed genes (DEGs) among cell clusters,A heat map illustrating the expression of DEGs in cell clusters was generated using the “DoHeatmap” function.
Correlation analysis of pyroptosis-related DEGs among cell subclusters
Pyroptosis-related DEGs expressing in specific cell types were visualized using the “FeaturePlot” from Seurat.The Pearson correlation coefficient of pyroptosis-related DEGs between cells was calculated using the corr R package.The correlation network was plotted using the “network_plot” function.
CellChat analysis
The CellChat R package (version 1.1.3)[33] was used to quantitatively infer and analyze the communication network between the identified 11 cell clusters.A circle diagram depicted the interaction between cell groups,while a bubble diagram counted all important ligand pairs during intercellular signaling.
GSVA
The “c2.cp.kegg.v7.5.1.symbols.gmt” geneset was downloaded from the Molecular Signatures Database (MSigDB,https://www.gsea-msigdb.org/gsea/msigdb/)[34].The “gsva” method of the R package GSVA (version 1.42.0) was employed for analyzing CRC single-cell data.Gene expression data from an expression matrix with individual genes as features were transformed into an expression matrix with specific genesets as features.The expression matrix was transformed into an enrichment score (ES) matrix for the pathway,obtaining a GSVA ES for each cell corresponding to each pathway.Using the limma R package (version 3.50.0)[35],pathways with significant differences (P< 0.05) were analyzed,and pathway activity scores for each cell group were compared with all other cell groups.The top 3 pathways in each group,ranked from the largest to the smallestt-value,were selected for plotting the heat map.
Immune infiltration
The TCGA-COAD and TCGA-READ transcriptome data underwent quantitative conversion into absolute abundance of immune and stromal cells using the “CIBERSORTx” method[36,37].This method assessed changes in the proportion of immune cell subsets,including memory B cells,naive B cells,activated dendritic cells,resting dendritic cells,eosinophils,M0 macrophages,M1 macrophages,M2 macrophages,activated mast cells,resting mast cells,monocytes,neutrophils,activated NK cells,resting NK cells,plasma cells,activated memory CD4+T cells,resting memory CD4+T cells,naive CD4+T cells,CD8+T cells,T follicular helper cells,gamma delta T cells,and regulatory T cells (Tregs).Significant differences between groups with high and low risk were assessed using the t-test method,consideringPvalues < 0.05 as significant.
Weighted co-expression network analysis
Weighted co-expression network analysis (WGCNA) was employed to construct co-expression networks and identify modules of highly correlated genes[38,39].The COAD and READ datasets from TCGA were selected as the trait data for WGCNA.
Differential expression of pyroptosis-related genes in TCGA data
DESeq2 (version 1.34.0)[40] from the R software package was used for analyzing the differential expression of pyroptosisrelated genes in TCGA-CRC data.Pyroptosis-related DEGs were identified with a screening threshold ofPvalue < 0.05 and |logFC| > 0.5.Clustered heat maps,volcano maps,and Gene Ontology (GO) functional enrichment maps for the relevant genes were generated.
GO enrichment analysis
In GO enrichment analyses,each term in biological process (BP),molecular function (MF),and cellular component was analyzed for enrichment significance[41].This method was applied to characterize the features of pyroptosis-related genes.
TCGA tumor sample typing
Consensus Clustering,a tool for cancer subtype classification,was used for analysis on the 178 key genes derived from scRNA-seq and TCGA datasets using the ConsensusClusterPlus (Version 1.58.0) package of R software[42].The distance calculation method was Spearman,and the clustering algorithm was PAM (Partitioning Around Medoids).Consistent cumulative distribution function maps,Delta Area Plots,and consistency matrix heat maps were utilized for clustering analysis.
Model construction and evaluation for clinical prognosis
Initially,the pyroptosis-related DEGs underwent univariate Cox analysis to identify genes with significant prognostic value.Subsequently,CRC samples were randomly divided into two parts,with a ratio of 7:3 for training and validation of the prognostic model.The LASSO-COX regression algorithm was applied to establish the prognostic model,and the risk score calculation formula was defined as: RiskScore=∑iCoefficient (genei) × expression (genei).
Where “coef (k)” represents the multivariate Cox regression coefficient;“x (k)” represents the expression value of each single gene,and “n” represents the number of genes.
Evaluation of prognostic models
Initially,the 606 CRC samples were divided into two groups based on high and low risk scores using the median risk score.Subsequently,Kaplan-Meier survival analysis and time-dependent receiver operating characteristic (ROC) analysis were conducted to assess the prognostic accuracy for OS.The risk scores were compared under different clinical feature groups,including age,gender,and TNM stage.
Construction and evaluation of clinical prediction model
To illustrate the predictive ability of risk scores combined with clinicopathologic characteristics for patient prognosis,both were incorporated into the model.A clinical predictive nomogram was constructed to predict risk,and its predictive ability was evaluated using calibration curves by comparing predicted values with actual survival rates.OS of the predicted scores was analyzed using Kaplan-Meier,and the prognostic accuracy of the model was tested using time ROC analysis.
Tumor mutational burden
Tumor mutational burden (TMB),reflecting the quantity of cancer mutations[43],was calculated using the “Maftools”package of R software (version 2.10.0).The somatic mutation levels in TCGA CRC samples were assessed,and the top 10 high-frequency mutated genes were counted to generate a waterfall plot.Subsequently,the impact on survival was explored by grouping according to high or low TMB levels,and comparisons were made between TMB differences in the two groups.
Differential expression of the prognostic genes
To validate the expression of the 8 prognostic genes between CRC and normal samples,we obtained the uniformly normalized pan-cancer dataset of TCGA TARGET GTEx (PANCAN,n=19131,G=60499) from the UCSC (https://xenabrowser.net/) database.Expression data for ENSG00000083937 (CHMP2B),ENSG00000117118 (SDHB),ENSG00000130303 (BST2),ENSG00000131508 (UBE2D2),ENSG00000152661 (GJA1),ENSG00000163568 (AIM2),ENSG00000170248 (PDCD6IP),and ENSG00000174938 (SEZ6L2) in samples from solid tissue normal,primary solid tumor,primary tumor,normal tissue,primary blood derived cancer-bone marrow,and primary blood derived cancerperipheral blood were downloaded.A log2 (x+0.001) transformation was applied to each expression value,and the analysis was restricted to CRC.Expression differences between normal and tumor samples were calculated for each tumor using R software.The significance of differences was assessed using unpaired Wilcoxon Rank Sum and Signed Rank Tests.The expression data of the 8 genes in CRC were provided in Supplementary Table 2.
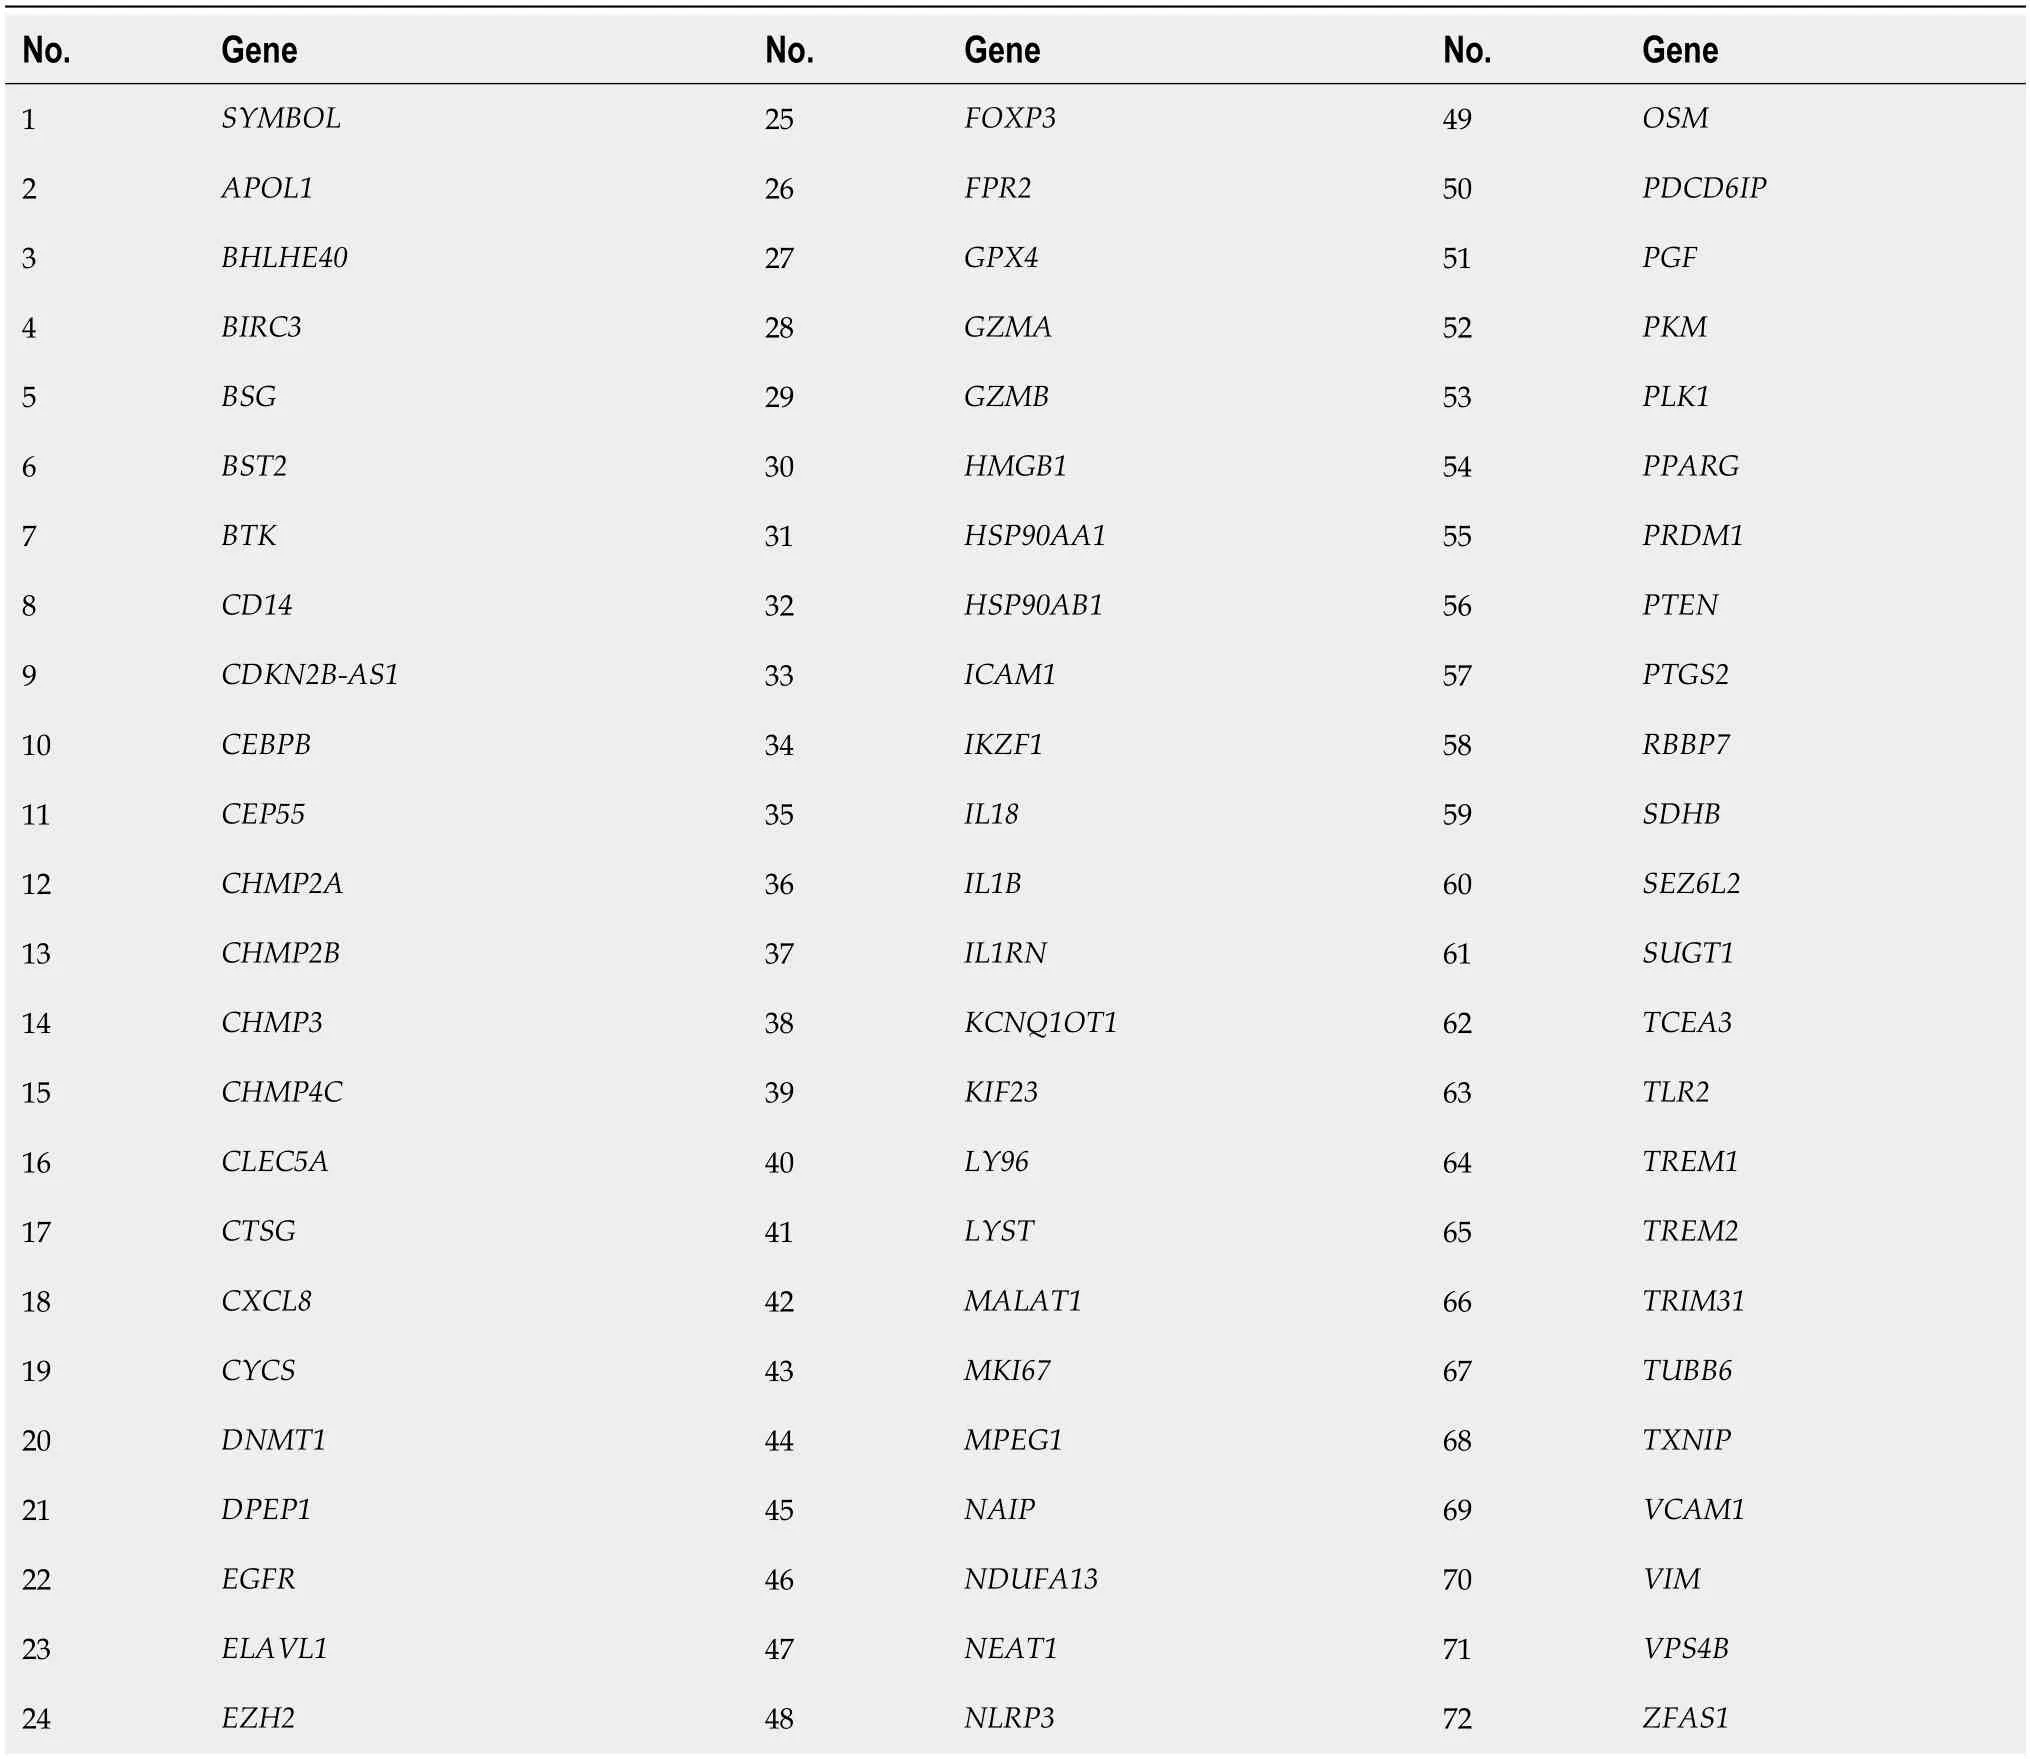
Table 2 lnterSC_RNA.72 genes
Statistical analysis
All calculations and analyses were performed using the R programming language.The risk model was constructed using LASSO and COX regression analyses.
RESULTS
ScRNA-seq data revealed cellular heterogeneity in CRC
The scRNA-seq data from 88 CRC samples underwent analysis,resulting in the identification of 115489 cells after adherence to quality control standards.Standardization and normalization of the data facilitated the extraction of the top 2000 high-variant genes.Subsequently,the selected high-variant genes underwent downscaled by PCA algorithm,followed by clustering analysis using the SNN algorithm.Visualization of the PCA-based downscaling results was achieved through UMAP for single-cell clustering.The successful classification of 115489 cells into 38 independent clusters is depicted in Figure 1A,and differential marker genes for each cluster are outlined in Supplementary Table 3.Using Single R,11 distinct cell subsets (epithelial cell,myeloid cells,macrophage,monocyte,mast cells,endothelial cells,stromal cell,plasma,B cells,NK cells,and T cells) were identified (Figure 1B).Subsequently,expression patterns of selected datasets corresponding to markers in published articles were visually represented through bubble plots(Figure 1C).Violin plots illustrated differentially marked genes for each cell subset (Figure 1D),and heat maps displayed the top 2 differentially marked genes for each cell type (Figure 1E).The distribution of cells in CRC tissues (T) and non-CRC tissues (N) across each cell type is illustrated in Figure 1F.Notably,T cells are more predominant in CRC tissues,while plasma/B cells are more prevalent in non-CRC tissues.A comparative UMAP plot in tumor and normal samples is presented in Supplementary Figure 1.
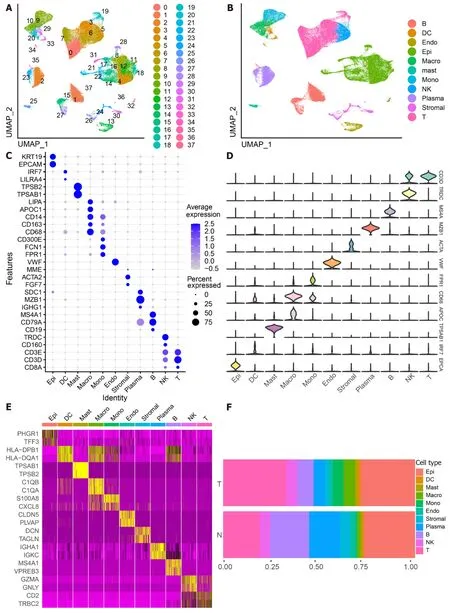
Figure 1 ldentifies 11 cell clusters with different annotations based on single-cell RNA sequencing-seq data,revealing a high degree of cellular heterogeneity in colorectal cancer cells.A: Selection of 88 samples from the GSE178341 dataset,followed by quality control,resulted in the inclusion of 115489 cells in the analysis,which were classified into 38 independent clusters.Different colors denote distinct clusters;B: Uniform Manifold Approximation and Projection distribution highlighting different cell types;C: Dot plot depicting cell type marker genes.Circle size corresponds to the proportion of gene expression in the cell cluster,with darker colors indicating higher average expression;D: Violin plot illustrating differential genes for each cell type;E: Heatmap showcasing the top 2 differential genes for each cell type;F: Proportion of each cell population in different samples,including epithelial cells (Epi,27.79%),myeloid cells (DC,1.55%;Macrophage,Macro,4.86%;Monocyte,Mono,4.16%),mast cells (Mast,1.11%),endothelial cells (Endo,2.28%),Stromal cells (Stroma,3.03%),plasma (Plasma,8.75%),B cells (B,11.85%),NK cells (NK,5.58%),and T cells (T,29.02%).
Pyroptosis-related genes differentially expressed between cell subsets
We intersected the differential genes between cell types and pyroptosis-related genes,resulting in 125 pyroptosis-related DEGs (Supplementary Table 4).Subsequently,we utilized a heat map to depict the expression of these DEGs in each of the 11 cell subsets (Figure 2A).Notably,among the DEGs,GZMAwas specifically expressed in the cluster where NK cells and T cells are located (Figure 2B),whileIL-1Bwas found to be specifically expressed in Monocytes (Figure 2C).The correlation among intersecting pyroptosis-related genes was visualized in Figure 2D.Notably,genes such asAPOE,VIM,andSTAT3exhibited a high degree of correlation.
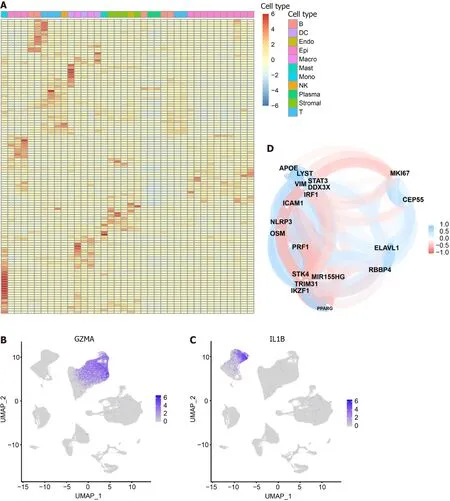
Figure 2 Heat map of 125 pyroptosis-related genes in cell types. The heat map depicts the expression of 125 pyroptosis-related genes across 11 cell types: T cells,NK cells,B cells,Plasma,Epithelial cells,Myeloid cells (DC,Macrophage,Monocyte),Stromal cells,Mast cells,and Endothelial cells.A: The color gradient from blue to red represents the gradual increase in gene expression;B: Specific expression of GZMA in the cluster where NK cells and T cells are located;C: Specific expression of IL-1B in Monocytes;D: Correlation analysis between pyroptosis-related genes in intersecting cells.Blue represents a negative correlation,while red represents a positive correlation.
CellChat and GSVA
We utilized CellChat to construct a graph displaying the total number of interactions among 11 cell subsets and their overall interaction intensity (Figure 3A).The statistical plot depicting cellular interactions identified by CellChat is presented in Supplementary Figure 2.For a clearer examination of interactions among cell subsets,we conducted subset analysis (Figure 3B),resulting in the division of subsets into 27 subclusters (Supplementary Table 5) [B cells: B01,2138,1.85%;B02,1101,0.95%;B03,10239,8.87%;B04,42,0.04%.Plasma 1,8620,Plasma 2,1491,1.29%;Plasmablasts,168,0.15%.Dendritic cells (DC): DC1,568,0.49%;DC2,891,0.77%;pDC,334,0.29%.Endothelial cells (Endo): Endo,2636,2.28%.Epithelial cells: Epithelial Normal (EpiN),10480,9.07%.Epithelial tumor (EpiT): 21614,18.72%.Fibroblasts: FB1,1329,1.15%;FB2,855,0.74%.Macrophages: M01,4020,3.48%;M02,1593,1.38%.Mast,1286,1.11%;Monocytes,4804,4.16%;Mural,1162,1.01%;NK,6448,5.58%;Schwann,159,0.14%;T cells: T01,12099,10.48%;T02,5772,5.00%;T03,7925,6.86%;T04,6071,5.26%;T05,1644,1.42%].Based on the 27 cell subclusters,a CellChat heatmap analysis was performed(Figure 3C),identifying 5 key cell subclusters (M01 Macrophage,T05 T cell,FB2 Fibroblast,Plasmablasts,Schwann) for subsequent analysis.The SPP1 signaling pathway influences the effectiveness of immunotherapy in CRC[44].We individually aligned for CellChat visualization (Figure 3D).It is evident that the M01 subcluster of macrophages was highly active in the SPP1 signaling pathway.Interestingly,the M02 subcluster of macrophages exhibited minimal activity.Additionally,Schwann cells demonstrated significant activity in the SPP1 signaling pathway.Furthermore,γδ T cells(T05) were correlated with the initiation and progression of immune responses.We analyzed the interaction of T05 Ligands and receptors with other cells (Figure 3E and F).Subsequently,CellChat analysis of the 5 key cell clusters mentioned above was performed with tumor cell clusters (Figure 3G).The close interlinking of the key subclusters was observed.We also noted the enrichment of different metabolic pathways among the cell clusters.Gamma-delta T-cells(T05) were enriched in the cell cycle,DNA replication,and base excision repair pathways,aligning with their function in initiating immune responses.Notably,SPP1-macrophage (M01) was enriched in the toll-like receptor signaling pathway and cytokine-cytokine receptor interaction,while M02 was enriched in the pathways of retinol metabolism and linoleic acid metabolism (Figure 3H).
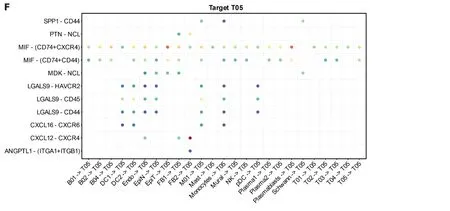
Figure 3 CellChat and GSVA. A: Graph illustrating the quantity and strength of interactions among primary cell clusters;B: Uniform Manifold Approximation and Projection plots displaying 27 subsets.The accompanying legend identifies the subgroups;C: Analysis of cell communication within the 27 subsets;D: Examination of the SPP1 signaling pathway interaction within each cluster;E: Interactions originating from a subset of gamma-delta T cells (T05).The X-axis represents the cell pair,and the Y-axis represents the receptor-ligand pair;F: Interactions of other cell subsets with gamma-delta T cells (T05) subsets;G: Interactions involving key cell subsets (M01,T05,FB2,Plasmablasts,Schwann,and EpiT);H: Presentation of significantly distinct signaling pathways in each cell subset,with the cell subset on the X-axis and the pathway name on the Y-axis.Colors ranging from blue to red indicate higher enrichment of the cell subset.
Immune infiltration analysis
We derived the abundance values of immune cells by utilizing the CIBERSORT online tool to analyze TCGA-COAD and TCGA-READ data.The boxplot visually presents the percentage differences in predicted results among various cell subsets (Figure 4A).Notably,immune cells such as M0 Macrophages,M2 Macrophages,and na?ve B cells exhibited significant percentage differences.Subsequently,we eliminated immune cells with 0 abundance in more than half of the samples and constructed a Pearson correlation heatmap depicting relationships among 14 immune cell types (Figure 4B).The correlation analysis revealed strong associations between T cell subtypes,monocytes,and macrophage subtypes.For instance,negative correlations were observed between CD8+T cells and M0 macrophages (R=-0.4),CD8+T cells and resting memory CD4+T cells (R=-0.38),Monocytes and M0 macrophages (R=-0.37),as well as resting memory CD4+T cells and M0 macrophages (R=-0.28).Conversely,positive correlations were identified between CD8+T cells and M1 macrophages (r=0.21) and resting memory CD4+T cells and Monocytes (r=0.23).
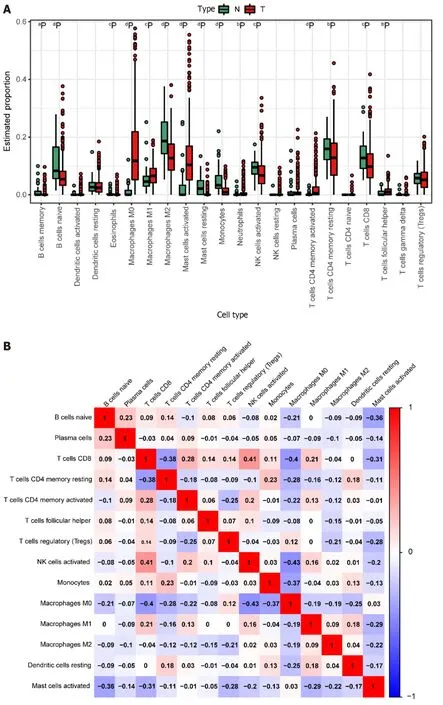
Figure 4 lmmune cell prediction from The Cancer Genome Atlas Dataset. A: Disparities in different immune cell types between tumor and normal samples in the The Cancer Genome Atlas (TCGA) dataset.Normal samples are denoted in green,and tumor samples are denoted in red.Significance levels are indicated as follows: aP < 0.05;bP < 0.01;cP < 0.001;dP < 0.0001;B: Heatmap illustrating the correlation among highly expressing immune cells in the TCGA dataset.The color scale of blue,white,and red denotes the strength of correlation,with darker colors signifying stronger correlations.Red indicates a positive correlation,while blue indicates a negative correlation.
WGCNA
The soft threshold value β was determined to be 16 (Figure 5A and B).Subsequently,we identified 16 modules for further analysis.Hierarchical cluster plots and module correlation heatmaps were generated to visualize the modules (Figure 5C and D).Notably,a significant correlation was observed between the MEcyan module and the M1 Macrophages feature,the MEpurple module and Monocytes and M2 Macrophages features,the MEred module and activated Mast cells,and the Megreen module with M0 Macrophages (Figure 6).From each module,we selected the top 30 genes,resulting in the identification of 120 genes forming the co-expressed gene list (Supplementary Table 6).
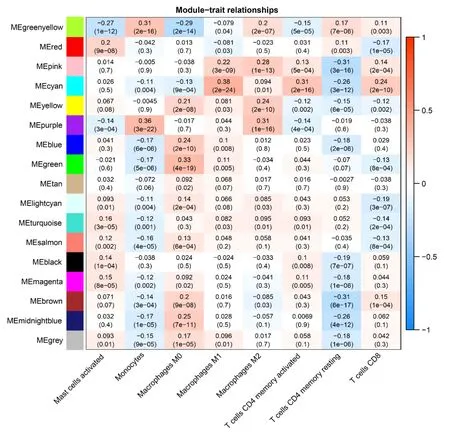
Figure 6 Weighted co-expression network analysis Co-expression Modules and Cell Types. The X-axis represents cell types provided by CIBERSORTx,while the Y-axis represents the Weighted co-expression network analysis co-expression modules.
Differential expression, correlation analysis and enrichment analysis of pyroptosis-related genes
The non-CRC samples from TCGA served as the control group,while the CRC samples were designated as the experimental group for differential analysis (Supplementary Table 7).Among the 125 DEGs,71 core pyroptosis-related DEGs exhibited significant differential expression in the TCGA dataset (|log2 FC| > 0.5,P< 0.05) (Table 2).The top 14 genes were selected for heatmap display (Figure 7A),and the differential analysis volcano plot provided a visual representation of pyroptosis-related DEGs (Figure 7B),including genes such asCDKN2B-AS1,CTSG,MPEG1,GZMB,andDPEP1,etc.,between normal and tumor samples.The Pyroptosis-Related Genes PPI network diagram is presented (Figure 7C,Supplementary Figure 3),with the geneCXCL8also identified in the differential analysis.Additionally,GO enrichmentanalysis revealed that the 71 core pyroptosis-related genes were significantly enriched in functions such as the regulation of inflammatory response,mitotic cytokinesis,etc.(Figure 7D,Supplementary Table 8).
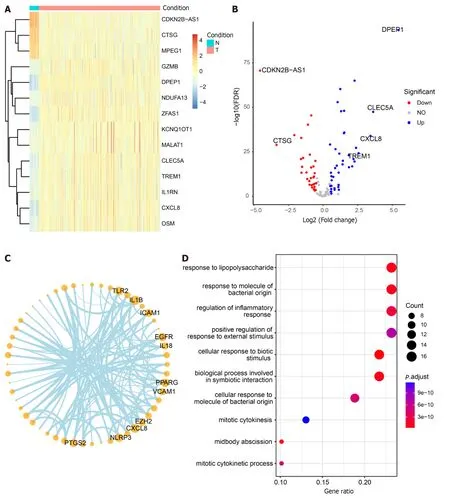
Figure 7 Differential analysis,correlation,and enrichment analysis of pyroptosis-related genes.A: Heatmap illustrating the expression profiles of the top 14 differential pyroptosis-related genes.Colors range from blue to red,indicating a gradual increase in expression levels.The color bar above distinguishes(non-colorectal cancer) non-CRC tissues (N) in blue and CRC tissues (T) in red;B: Volcano plot depicting the results of CRC vs non-CRC differential analysis;C:Correlation network diagram highlighting highly connected pyroptotic genes;D: Results of Gene Ontology enrichment analysis for 125 pyroptosis-related genes.The bubble plot displays the top 10 most significant enriched functions.The X-axis represents Gene Ratio,and the color of the bubbles ranges from blue to red,with red indicating more significant enrichment.The Y-axis denotes the name of the pathway.
Consistent clustering and single-sample gene set enrichment analysis
Tumor samples TCGA were subjected to typing through the consensus clustering method.After a thorough evaluation considering the consistency matrix heatmap,cumulative distribution curve,and delta area curve,we determined the cluster number to be 2 (Figure 8A-C).Subsequently,the tSNE algorithm was employed for cluster visualization(Figure 8D).Finally,we conducted single-sample gene set enrichment analysis (ssGSEA) with a focus on immune cells(Figure 8E) and immune function (Figure 8F).
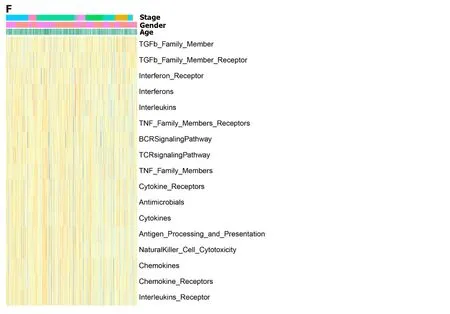
Figure 8 Exploring typing by consensus clustering and single-sample gene set enrichment analysis. A: Heatmap depicting the concordance clustering matrix,with values ranging from 0 (impossible to cluster together) to 1 (always clustered together).Shades of white to dark blue represent the scale of concordance;B and C: Consistent CDF plot and Delta Area Plot;D: Cluster analysis using tSNE algorithm;E: Single-sample gene set enrichment analysis (ssGSEA)of immune cells.Legend includes tumor stage,gender,and age;F: ssGSEA of immune function.Legend includes tumor stage,gender,and age.
Construction and validation of a pyroptosis-related prognostic model
We conducted survival analysis utilizing both single-cell data and TCGA-CRC data,which comprises survival information for 606 samples.In addition to the 71 core genes,we incorporated differential genes specific to single-cell and bulk transcriptomes,resulting in a final set of 178 genes present in the TCGA expression matrix (Supplementary Table 9).Univariate Cox analysis assessed the correlation between these 178 genes and the prognosis of CRC patients,revealing 10 genes significantly correlated with prognosis (Pvalue < 0.05) (Supplementary Table 10).Subsequently,we randomly divided the diseased samples into training and validation sets at a ratio of 7:3.The training set was employed for constructing a prognostic model using LASSO-Cox regression (Figure 9A and B),yielding a risk model composed of 8 genes (CHMP2B,SDHB,BST2,BE2D2,GJA1,AIM2,PDCD6IP,andSEZ6L2).Based on the median value of the risk score,patients were classified into low-risk and high-risk groups.Risk maps and survival states for the training and test sets illustrated an increase in the risk score corresponding to an elevated risk of death and decreased survival time (Figure 9C and D).
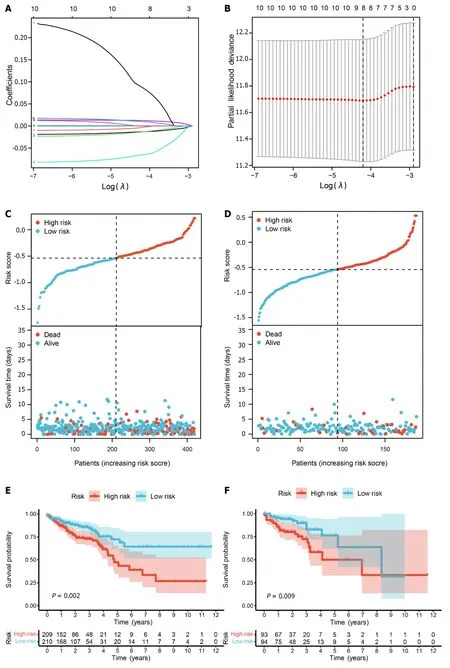
Figure 9 Prognostic model based on pyroptosis-related genes. A: Construction of a fitting model using LASSO regression,illustrating changes in the lambda value of 10 pyroptosis-related genes significantly associated with prognosis.The X-axis represents the Log λ value,and the Y-axis represents the coefficient;B: Cross-validation analysis determining the optimal lambda value for the fitted model.The X-axis represents the logized lambda value,the Y-axis represents the error of the model,and the dashed line on the left signifies the lambda value minimizing the error and the number of screened features;C: Risk map of the training set,where red dots represent high-risk patients,and light blue represents low-risk patients;D: Risk map of the test set;E: Survival curve of the training set (P=0.002),where a smaller P value indicates higher accuracy;F: Survival curve of the test set (P=0.009);G: Receiver operating characteristic (ROC) curve of the training set [area under the curve (AUC)=63.8%],where a higher AUC signifies greater accuracy;H: ROC curve for the test set (AUC=63.6%);I: ROC curve for 1-,3-,and 5-year calculated from the risk score in the training set;J: ROC curve for 1-,3-,and 5-year calculated from the risk score in the test set.
To assess prediction accuracy,we performed a ROC analysis.The results indicated a favorable predictive ability of the risk score for OS in CRC patients,with area under curve (AUC) values of 63.8% and 63.6% for the training and validation sets,respectively (Figure 9E and F).Kaplan-Meier curves demonstrated worse OS in patients with high-risk scores compared to those with low-risk scores (P< 0.05,Figure 9G and H).The 1-,3-,and 5-year AUCs of risk scores based on the prognostic models were all above 0.6 (Figure 9I and J).
Construction of a prediction nomogram
The forest plot (Figure 10A) highlighted strong correlations with clinicopathological features,particularly tumor stage.Additionally,by leveraging clinical data within the dataset,we observed a correlation between pyroptosis-related genes and the age of tumors,with no significant association with gender.Subsequently,by integrating clinicopathological characteristics,a nomogram (Figure 10B) was developed to predict survival probability.The calibration curve indicated accurate results (Figure 10C).
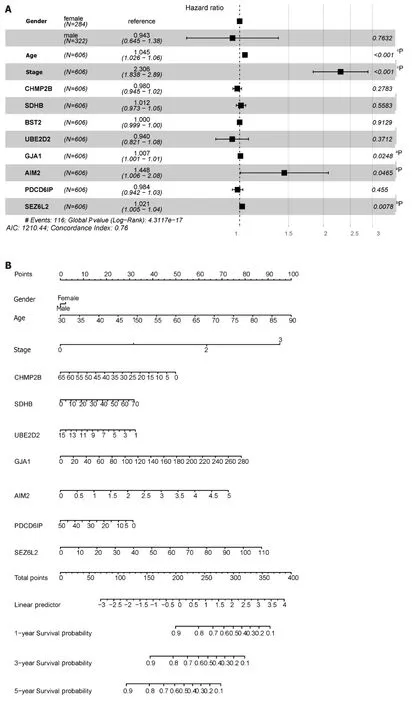
Figure 10 Construction of the nomogram. A: Forest plot illustrating the influence of clinicopathological features;B: Nomogram integrating multi-omics data with clinicopathological features;C: Calibration curve of the overall survival nomogram,where the diagonal dashed line represents the ideal nomogram.aP < 0.05;bP< 0.01;cP < 0.001;dP < 0.0001.
Immune infiltration and the prognostic model
Given the significantly lower survival rate in the high-risk group based on the previous results,we explored potential differences in immune infiltration between the two risk groups.The CIBERSORTx algorithm was employed to calculate immune infiltration in CRC samples from TCGA.The scatterplot depicted correlations between the expression of prognostic genes and immune infiltration in CRC.AIM2expression showed a positive correlation with the cellular abundance of activated memory CD4+T cells,whileUBE2D2expression exhibited a negative correlation with the cellular abundance of Tregs (Figure 11A and B).The risk score demonstrated a negative correlation with the cellular abundance of resting memory CD4+T cells (Figure 11C).Additionally,a significant difference in the abundance of Tregs was observed between the high and low-risk groups (P< 0.05) (Figure 11D).
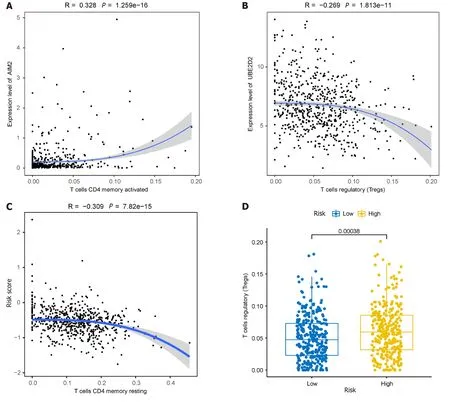
Figure 11 lmmunoassays of prognostic models. A: Positive correlation between AIM2 gene expression and the abundance of activated memory CD4+T cells;B: Inverse correlation between UBE2D2 gene expression and the cellular abundance of regulatory T cells (Tregs);C: Correlation of immune cell infiltration with high and low-risk groups;D: Significant differences observed in the abundance of Tregs between the high and low-risk groups.
TMB
TMB serves as a predictor of immunotherapy response,and we calculated TMB using “maf” files,investigating the relationship between the model groupings and TMB.Waterfall charts were generated for the top 10 frequently mutated genes,revealing common somatic mutation genes such asAPCandTP53in CRC (Figure 12A).TMB was calculated and visualized,with a median TMB of 1.78/Mb (Figure 12B).Subsequently,we explored the impact of TMB on survival(Figure 12C),revealing that TMB had minimal effect on survival in this dataset.Furthermore,no significant difference was observed in TMB between the high-and low-risk groups in the prognostic model (Figure 12D),suggesting that incorporating TMB into the prognostic model for this dataset may not be necessary.Additional studies on the effect of TMB on prognosis may be warranted.
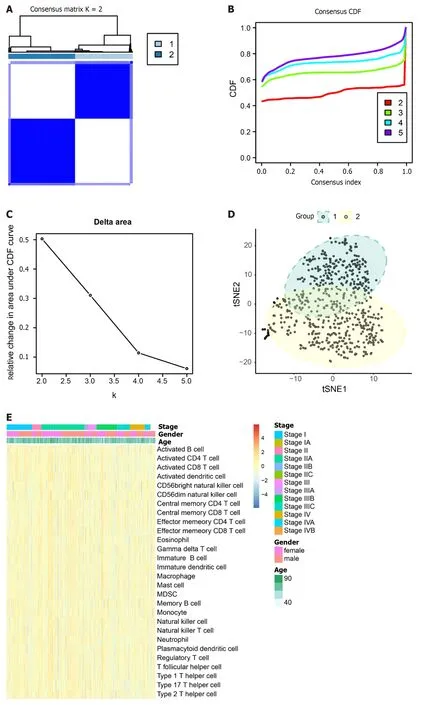
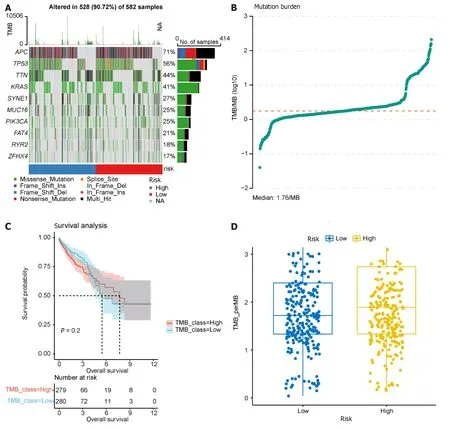
Figure 12 Tumor mutation burden analysis. A: Waterfall plot illustrating the top 10 frequently mutated genes;B: Dot plot presenting the results of tumor mutation burden analysis,with the median tumor mutational burden at 1.78/Mb;C: Survival analysis of high and low tumor mutation burden groups;D: Comparison of tumor mutation burden between high and low prognostic risk groups.
Differential expression of prognostic-related genes in CRC samples
We determined the expression of 8 prognostic genes in CRC samples using TCGA-COADREAD data in the UCSC database.Among them,7 genes were shown differentially expressed in CRC samples and normal samples.The result showed thatCHMP2B,SDHB,UBE2D2,AIM2,PDCD6IP,andSEZ6L2were significantly up-regulated in CRC samples whileGJA1was significantly down-regulated.No significant expression difference was found between normal and tumor samples forBST2(Figure 13).
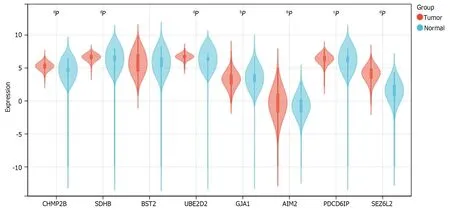
Figure 13 Expression of 8 prognosis-related genes in normal and tumor samples from The Cancer Genome Atlas-COADREAD. aP < 0.05;b P < 0.01;cP < 0.001;dP < 0.0001.CHMP2B,SDHB,UBE2D2,GJA1,AIM2,PDCD6IP,and SEZ6L2 exhibited significant differential expression between colorectal cancer and normal samples.No significant expression difference was found for BST2.
DlSCUSSlON
Several studies have shown that pyroptosis plays a crucial role in tumor growth[17-19,45].It affects prognosis by changing the immune microenvironment and is linked to the effectiveness of immunotherapy[46],Consequently,it has been utilized in building prognostic models for various cancers[21,47,48].However,most of these studies utilized bulk RNA sequencing,whereas scRNA-seq is more advantageous for investigating cancer prognostic models and the immune microenvironment at a single-cell resolution level[49-51].Recognizing the pivotal role of pyroptosis in cancers and the unfavorable prognosis of CRC,we developed a pyroptosis-related prognostic model for CRC using the scRNA-seq method.Notably,this is the initial study applying scRNA-seq technology to identify pyroptosis-related genes for constructing CRC prognostic prediction models and exploring the relationship between pyroptosis-related genes and immune infiltration.
By integrating single-cell transcriptome and bulk transcriptome data,we identified 178 pyroptosis-related DEGs from CRC samples.Subsequently,utilizing univariate COX analysis and the LASSO-Cox regression algorithm,we established a risk model comprising 8 pyroptosis-related genes:CHMP2B,SDHB,BST2,UBE2D2,GJA1,AIM2,PDCD-6IP,andSEZ6L2.The model was then validated.Based on the median risk scores,patients from the TCGA cohort were stratified into high-and low-risk groups,revealing an elevated risk of death and reduced OS among high-risk group patients.The model exhibited high predictive accuracy for CRC survival,as confirmed by ROC analysis and a nomogram,while also demonstrating a strong correlation with clinicopathological characteristics,especially tumor stage.
Among the 8 genes,SDHB serves as the catalytic core component of succinate dehydrogenase (SDH),a mitochondrial metabolic enzyme[52].Mutations inSDHBresult in enzyme dysfunction associated with cancer development[52-54].Wanget al[52] observed that SDHB influences CRC invasion and metastasis through the TGF-β pathway.BST2 (bone marrow stromal antigen 2) is a protein-coding gene overexpressed in several cancers[55].Chianget al[56] identifiedBST2as a biomarker and prognosticator for CRC[56].UBE2D2 (ubiquitin-conjugating enzymes E2),associated with hypoxia,prevents the degradation of HIF1α and 2α by proteasome systems.Leeet al[57] reported thatUBE2D2could predict the OS of CRC.GJA1 (gap junction alpha-1),a member of the GJ family,is the predominant one expressed in epithelial tissues.Huet al[58] demonstrated thatGJA1serves as a prognostic biomarker for CRC.AIM2,an inflammasome sensor,provides cytokine-independent protection,influencing CRC[59].SEZ6L2 (seizure-related 6 homolog/mouse-like 2) of the SEZ6 family is identified as a potential prognosis biomarker and therapy target for CRC[60].The six pyroptosis-related genes above have demonstrated potential impacts on CRC prognosis,aligning with our findings.Notably,the existing prognostic models for these genes relied on bulk RNA sequencing and focused solely on whole tumor cells.In our study,risk models were validated at both bulk RNA and single-cell levels.RegardingCHMP2BandPDCD6IP,their roles in pyroptosis have not been fully explored.We are the first to identify these two genes as potential prognostic biomarkers for CRC.
Immune cells within the TME play a pivotal role in influencing the tumor process[61].Pyroptosis has been demonstrated to actively participate in regulating the immune microenvironment in various tumors[62,63].This study specifically investigated the regulatory function of pyroptosis-related genes on immune infiltration.CD4+T cells are key participants in anti-tumor immune responses and significantly impact CRC prognosis[64-67].Previous studies have highlighted that activated memory CD4+T cells exhibit infiltrative and antitumor effects during the early stages of CRC progression[68],while infiltration of memory resting CD4+T cells is associated with a favorable prognosis[69].The metabolic features and function of intra-tumoral Tregs in CRC remain unclear.To address this,we employed the CIBERSORTx algorithm to analyze immune infiltration results in the high-and low-risk groups.The findings revealed differences in immune infiltration between these groups,correlating with prognostic genes.AIM2expression positively correlated with activated memory CD4+T cell abundance,whileUBE2D2expression negatively correlated with Tregs cell abundance.This suggests that pyroptosis-related genes may impact prognosis by influencing immune infiltration in CRC.This study is potentially the first to establish a connection between pyroptosis-related genes and immune infiltration in CRC,offering insights that may contribute to advancements in immunotherapy.
We explored the relationship between the expression of pyroptosis-related genes and clinical data in CRC using the TCGA dataset.Our findings revealed an association between the expression of these genes and patient age and tumor stage,while no correlation was observed with gender.
Furthermore,we delved into the functional roles of pyroptosis in CRC.Functional analyses indicated significant enrichment of pyroptosis-related genes in the regulation of inflammatory responses.Notably,key intermediate factors such as GSDMD,IL-1β,and IL-18,known for their involvement in the pyroptosis process,were identified as contributors to the regulation of inflammatory responses[70].This underscores our study's demonstration of the regulatory role of pyroptosis in inflammatory responses,thereby impacting tumor progression.
Finally,we validated the differential expression of the eight prognostic genes in CRC and normal samples using TCGA-COADREAD data from the UCSC database.Out of these,seven genes-CHMP2B,SDHB,UBE2D2,GJA1,AIM2,PDCD6IP,andSEZ6L2-showed significant differential expression,with six genes up-regulated and one gene downregulated.This outcome suggests that these seven pyroptosis-related genes could be potential targets for clinical treatment in CRC.However,further data and validation from clinical trials are required.To advance research in this area,additional experiments involving patients,as well asin vitroandin vivostudies,are currently underway in our laboratory.
CONCLUSlON
Leveraging scRNA-seq analysis,we formulated a pyroptosis-related prognostic model for CRC.This model demonstrates efficacy in predicting prognosis,survival OS,and effectively stratifying risk.The eight pyroptosis-related genes comprising the risk score play crucial roles in regulating inflammatory responses,modulating immune infiltration,and influencing the onset and progression of CRC.The insights derived from this study hold promise for enhancing clinical management and immune therapy strategies for CRC patients.
ARTlCLE HlGHLlGHTS
Research background
Pyroptosis impacts the development of malignant tumors,yet its role in colorectal cancer (CRC) prognosis remains uncertain.
Research motivation
To explore the role of pyroptosis in CRC prognosis.
Research objectives
To assess the prognostic significance of pyroptosis-related genes and their association with CRC immune infiltration.
Research methods
Single-cell sequencing combined with Gene Expression Omnibus database and The Cancer Genome Atlas database.
Research results
We constructed a prognostic model and demonstrated that pyroptosis is associated with immune infiltration in CRC.
Research conclusions
We developed a pyroptosis-related prognostic model for CRC,affirming its correlation with immune infiltration.
Research perspectives
This model may prove useful for CRC prognostic evaluation.
ACKNOWLEDGEMENTS
This study is a joint effort of many investigators and staff members,and their contribution is gratefully acknowledged.
FOOTNOTES
Author contributions:Liu WQ,Yang J,and Zhu LH contributed to conception and design;Zhu LH,Zhang YF,Yan L,and Lin WR contributed to provision of study materials or patients;Zhang YF and Zhu LH contributed to collection and assembly of data;Zhu LH,Liu WQ,Yan L,and Yang J contributed to data analysis and interpretation;Zhu LH and Liu WQ contributed to manuscript writing and editing;Zhu LH,Liu WQ,and Yang J contributed to manuscript revising;all authors approved the final of manuscript.
Supported bythe National Natural Science Foundation of China,No.81 960100;Applied Basic Foundation of Yunnan Province,No.202001AY070001-192;Young and Middle-aged Academic and Technical Leaders Reserve Talents Program in Yunnan Province,No.202305AC 160018;Yunnan Revitalization Talent Support Program,No.RLQB20200004 and No.RLMY20 220013;and Yunnan Health Training Project of High-Level Talents,No.H-2017002.
Conflict-of-interest statement:The authors declare that they have no conflict of interest.
PRlSMA 2009 Checklist statement:The authors have read the PRISMA 2009 Checklist,and the manuscript was prepared and revised according to the PRISMA 2009 Checklist.
Open-Access:This article is an open-access article that was selected by an in-house editor and fully peer-reviewed by external reviewers.It is distributed in accordance with the Creative Commons Attribution NonCommercial (CC BY-NC 4.0) license,which permits others to distribute,remix,adapt,build upon this work non-commercially,and license their derivative works on different terms,provided the original work is properly cited and the use is non-commercial.See: https://creativecommons.org/Licenses/by-nc/4.0/
Country/Territory of origin:China
ORClD number:Li-Hua Zhu 0000-0002-9118-1374;Jun Yang 0000-0002-8100-6943;Wan-Rong Lin 0000-0001-5974-765X;Wei-Qing Liu 0000-
0003-0942-4080.
S-Editor:Chen YL
L-Editor:A
P-Editor:Zhang XD
 World Journal of Clinical Oncology2024年2期
- World Journal of Clinical Oncology的其它文章
- Bridging the gap: Predicting brain metastasis in breast cancer
- TM9SF1 is implicated in promoting the proliferation and invasion of bladder cancer cells
- Circulating tumor cells as prognostic marker in pancreatic cancer
- Limonin inhibits the stemness of cancer stem-like cells derived from colorectal carcinoma cells potentially via blocking STAT3 signaling
- TM9SF1 promotes bladder cancer cell growth and infiltration
- Prevalence,risk factors,and BRAF mutation of colorectal sessile serrated lesions among Vietnamese patients