
A Cross-Seasonal Linkage between Arctic Sea Ice and Eurasian Summertime Temperature Fluctuations※
2023-12-26 09:12:04YantingLIUYangZHANGSenGUXiuQunYANGandLujunZHANG
Advances in Atmospheric Sciences 2023年12期
Yanting LIU, Yang ZHANG*, Sen GU, Xiu-Qun YANG, and Lujun ZHANG
1School of Atmospheric Sciences, Nanjing University, Nanjing 210023, China
2College of Meteorology and Oceanography, National University of Defense Technology, Changsha 410073, China
ABSTRACT This study explores the linkage between summertime temperature fluctuations over midlatitude Eurasia and the preceding Arctic sea ice concentration (SIC) by utilizing the squared norm of the temperature anomaly, the essential part of local eddy available potential energy, as a metric to quantify the temperature fluctuations with weather patterns on various timescales.By comparing groups of singular value decomposition (SVD) analysis, we suggest a significant linkage between strong (weak) August 10-to-30-day temperature fluctuations over mid-west Asia and enhanced (decreased) Barents-Kara Sea ice in the previous February.We find that when the February SIC increases in the Barents-Kara Sea, a zonal dipolar pattern of SST anomalies appears in the Atlantic subpolar region and lasts from February into the summer months.Evidence suggests that in such a background state, the atmospheric circulation changes evidently from July to August, so that the August is characterized by an amplified meridional circulation over Eurasia, weakened westerlies, and highpressure anomalies along the Arctic coast.Moreover, the 10-to-30-day wave becomes more active in the North Atlantic–Barents-Kara Sea–Central Asia regions and manifests a more evident southward propagation from the Barents-Kara Sea into the Ural region, which is responsible for the enhanced 10-to-30-day wave activity and temperature fluctuations in the region.
Key words: Arctic sea ice, midlatitude atmospheric circulation, summertime temperature fluctuations, wave train, North Atlantic SST
1.Introduction
The Arctic is one of the regions experiencing evident warming over the past decades (e.g., Serreze and Francis,2006; Screen and Simmonds, 2010; Vihma, 2014).The rapid surface warming in the Arctic is accompanied by dramatic losses in sea ice extent, with a 43% decline over the last four decades, at a rate of 9.7 × 10⁵km2per decade in September (Wang et al., 2022).At the same time, extreme weather and climate events, such as cold surges, heat waves,floods, and droughts, have become more frequent and persistent in the midlatitude of the Northern Hemisphere (e.g., Horton et al., 2016; Luo et al., 2018; Pfleiderer et al., 2019;Zhang et al., 2020; Overland et al., 2021).Many studies have investigated the relationship between the Arctic sea ice change and the midlatitude extreme weather over Eurasia and North America (e.g., Sun et al., 2016; Budikova et al.,2019; Alizadeh and Lin, 2021).Those studies suggest that Arctic warming weakens the poleward temperature gradient with weaker zonal westerlies in mid-high latitudes and more curved atmospheric circulations, which favor the occurrence of extreme weather and climate events (e.g., Liu et al.,2012; Vihma, 2014; Overland et al., 2016; Yao et al., 2017),though there is still intense debate on whether the Arctic warming has caused the extreme events in the midlatitudes(Blackport and Screen, 2020; Cohen et al., 2020).
Previous studies have shown that there is a significant relationship between Arctic sea ice (especially in the Barents-Kara Sea) and wintertime Eurasia weather and climate through the variation of the jet stream and background potential vorticity, the maintenance of blocking, the phase change of North Atlantic Oscillation (or Arctic Oscillation), and the propagation of stationary waves (e.g., Overland et al., 2016;Luo et al., 2019; Li et al., 2019; Xu et al., 2019; Zhang et al.,2019; Xie et al., 2020).Gu et al.(2018) further reveal the connection between changes in Arctic sea ice and wintertime eddy activity in Eurasia from an energy perspective.The authors found that with the reduction of sea ice in early autumn from the Kara to East Siberian seas, the overlying atmosphere experiences enhanced eddy energy in the following winter.With the amplified meridional meandering of the mean flow, an anomalous low-frequency wave train propagates southward into Northern Eurasia, coincident with the increase in low-frequency wave activity and persistent weather.At the same time, reduced baroclinicity causes a decrease in synoptic fast-moving weather disturbances in the region.
As mentioned above, many studies have investigated the connection between the Arctic and wintertime midlatitude weather.In contrast, the Arctic’s influence on the summertime midlatitude weather has received far less attention.However, the summertime atmospheric circulation may be more sensitive to Arctic changes than in winter because of the more significant decline of the meridional temperature gradient at high latitudes (Coumou et al., 2018).Regarding temperature, some recent studies have shown that summertime extreme heat events significantly correlate with the Arctic sea-ice change (e.g., Budikova et al., 2019; Deng et al.,2020; Wu and Li, 2022).Earlier studies also suggested that reduced sea ice may modify the summertime atmospheric circulation by Rossby wave and jet resonance (Francis and Vavrus, 2015; Serreze et al., 2016; Cohen et al., 2018; He et al., 2018), which may provide more conducive environments for extreme summertime weather and climate events in midlatitudes.In addition to the Arctic warm anomaly, Wu and Francis (2019) found a high correlation between Arctic cold anomalies and East Asian heat waves by investigating the second EOF pattern of summer 1000–500 hPa thickness.Despite the studies mentioned above, the connections between the Arctic change and the summertime temperature fluctuations in different timescales still lack systematic investigations.
To quantify the temperature fluctuations with weather patterns, various indices have been defined.Some research investigated temperature fluctuations based on day-to-day temperature variability (e.g., Lewis and King, 2017; Xu et al., 2020),namely the absolute value of the difference between air temperature for two adjacent days, as defined by Karl et al.(1995).Kotz et al.(2021) measured the day-to-day variability as the average intra-monthly standard deviation of daily temperature and deemed it a better measurement than the absolute change between days because this metric is less sensitive to changes in observational procedures and focuses on variability apart from seasonal expectations.A more physical and dynamically meaningful metric for quantifying temperature fluctuations is proposed by Gu et al.(2018), in which the concept of eddy available potential energy (EAPE) is utilized.Applying time filtering to temperature fluctuations as well as the EAPE allows for further decomposition into components with different timescales (e.g., short-term synoptic temperature fluctuations and extended-range or subseasonal temperature variations).Furthermore, since the definition of EAPE was proposed by Lorenz (1955), the energetics, budget, and transfer of EAPE with the Rossby wave propagation have been extensively studied, which enables us to further understand the dynamic mechanisms underlying the temperature fluctuations in the perspective of energy.
Therefore, in this study, we apply EAPE as the metric to quantify the temperature fluctuations within weather patterns and set forth to answer the following questions: (1) Is there any relationship between the Arctic sea ice and summertime temperature fluctuations over Eurasia? (2) If so, what are the possible mechanisms responsible for such connections? Instead of focusing on the long-term trend, as in many previous studies, we explore the above Arctic-midlatitude linkage via their interannual variabilities for temperature fluctuations in different timescales.
The remainder of the paper is organized as follows.Section 2 introduces the data and methods used in the study.Section 3 investigates the linkage between summertime temperature fluctuations and Arctic sea ice in the preceding months and delineates possible processes responsible for the linkage.Conclusions and discussions are provided in section 4.
2.Data and methods
In this study, the monthly sea-ice concentration (SIC)and sea surface temperature (SST) are obtained from the Met Office Hadley Centre observations dataset HadISST.2.2.0.0 (Titchner and Rayner, 2014), with a spatial resolution of 1° × 1° regular latitude-longitude grid from 1991–2020.Compared with previous versions, HadISST.
2.2.0.0 covers a wider range of sea ice.Daily and monthly atmospheric data are obtained from the National Centers for Atmospheric Prediction – National Center for Atmospheric Research (NCEP/NCAR) reanalysis 1 (Kalnay et al., 1996),with a spatial resolution of 2.5° × 2.5° uniform latitude-longitude grid except for the 2-m temperature that is Gaussian grid.The ERA5 dataset (Hersbach et al., 2020) is also used to test the main results of the study, whose results are highly similar to that of NCEP/NCAR data and thus not shown in the manuscript.


Through linear regression analysis and composite analysis, we further investigate the changes in atmospheric circulation, wave energy, sea surface temperature, and Arctic sea ice associated with the coupled mode.We use the wave activity flux (WAF), as defined by Takaya and Nakamura (2001;hereafter TN01), to diagnose wave energy propagation.The WAF describes the wave propagation in a zonally varying basic flow, with its direction parallel to the local group velocity of Rossby waves.The WAF is calculated with the formula below:

3.Results
3.1.Covariation between Arctic SIC and summertime extratropical temperature fluctuations
We first investigate the relationship between Arctic SIC and summertime extratropical temperature fluctuations over Central and East Asia (Caspian Sea–Balkhash Lake–Baikal Lake–Northern China).As the atmospheric states may relate to the Arctic SIC in earlier seasons, the SVD analysis is conducted between the summertime (the JJA and each monthly mean) temperature fluctuations (including components in different timescales) and each monthly SIC from January to the summer months.All results of the conducted SVD analysis are summarized in Table 1, which shows that the most significant covariation occurs between the 10–30 day August temperature fluctuations and the Arctic SIC in earlier seasons, especially in January and February.To intuitively understand the interannual variations of August temperature fluctuations, the time series ofaveragedover mid-latitude Eurasia are displayed in Fig.1.The 10–30 day temperature fluctuations account for about one-third of thetotalT′2andareslightlyweakerthanthe2–10daytemperature fluctuationsNotethat,inadditionto thedatafrom 1991–2020, the same SVD analysis is also conducted using the data of the previous 30 years (1981–2010).However,only the 1991–2020 data provides all of the statistics (SC, R,and SCF) of the SVD mode that exceeds the threshold confidence level, suggesting that the relationship between Arctic sea ice and summertime mid-latitude 10–30 day temperature fluctuations may exhibit decadal variations.This premise is consistent with previous studies (Xu et al., 2019; Liu et al.,2020) suggesting a strengthened Arctic-midlatitude linkage after the late 1990s.

Table 1.Overview of statistics of the first SVD mode between summertime T′2 (including its synoptic and low-frequency component by Lanczos filter) and each monthly mean SIC from January to August from 1991–2020.Statistics include the squared covariance (SC,105 m2 s–2), the temporal correlation (R), and the squared covariance fraction (SCF, %).The cross sign indicates that the statistic is not significant.Values significant at the 90% (black) and 95% (blue) confidence levels according to a Monte Carlo test are listed.

Detailed statistics of the first SVD mode between the August 10–30 day temperature fluctuations and the monthly Arctic SIC in earlier seasons are listed in Table 2.To test the robustness of the result, we also use three different time filters to extract the 10–30 day temperature fluctuations for the SVD analysis, whose results are all included in Table 2 for comparison.As shown in the table, the August temperature fluctuations on the time scale of 10–30 days are significantly correlated with the variation in SIC in late winter and early spring (from January to April).For January and February, the squared covariance and temporal correlation are both significant.The squared covariance passes the significance test at the 99% confidence level, with the temporal correlation between the two fields stronger for February and higher than 0.7.The first SVD mode for February and January SIC accounts for about 60% of the squared covariance, with the percentage for February slightly higher, which is larger than that in other months.The above results are similar no matter which filter extracts the 10–30 day temperature fluctuations.Therefore, the results are not sensitive to the details of the timescale filter, and hereafter we only show the results using the Lanczos filter.
The spatial patterns of the first SVD mode between the February Arctic SIC and subsequent August 10–30 day temperature fluctuations over mid-to-east Asia and their time series are displayed in Fig.2.The first SVD mode shows that when the February SIC in Barents-Kara Sea is above normal, a widespread region of mid-west Asia extending into northwest China experience considerably higher-than-normal temperature fluctuations, with commensurate lower-than-normal temperature fluctuations over and to the east of Baikal Lake including East China, showing a zonal dipolar pattern(Figs.2a, b).This study mainly focuses on the enhanced temperature fluctuations from mid-west Asia into northwest China because the eastern negative anomaly, characterized by weak temperature fluctuations, does not pass the 95% significance test.
Note that, in Fig.2a, the significant sea-ice anomalies appear not only over the Barents-Kara Sea but also over the western and eastern coastlines of Greenland, which may beforced by means of a large-scale atmospheric circulation such as the NAO (Strong, 2012) or oceanic heat transport(e.g., Germe et al., 2011).However, as shown in previous studies and in our analysis, the Barents-Kara Sea is the key region affecting atmospheric circulation in mid-west Asia and northern China region.The SIC anomalies along the coast of Greenland (i.e., the Greenland Sea and Baffin Bay)are instead most related to Greenland blocking as well as weather patterns in North America and Europe (e.g., Chen and Luo, 2021).Furthermore, the Barents-Kara Sea exhibits the most predominant sea-ice variability in the Arctic in boreal winter and spring.The correlation between the time series of February SIC in the SVD mode and the SIC anomalies averaged over the Barents-Kara Sea is 0.91.Therefore,our main focus is the February SIC anomaly over the Barents-Kara Sea region.

Table 2.Statistics of the first SVD mode between August T ′2 on a timescale of 10–30 days and each monthly mean SIC from January to August using harmonic, Lanczos, and Butterworth filters.Statistics include the squared covariance (SC, 105 m2 s–2), the temporal correlation (R), and the squared covariance fraction (SCF, %).The values in blue (bold) indicate statistical significance exceeding the 90%(95%) confidence level according to the Monte Carlo test.

Fig.2.The first SVD mode between August 10–30 day temperature fluctuations and February Arctic SIC with detrended data.Spatial patterns (heterogeneous maps) of (a) February SIC, (b) August temperature fluctuations on the 10–30 days timescale, and (c) the normalized time series of the two fields.The dotted regions denote values statistically significant above the 95% confidence level according to a Student’s t-test.
Therefore, the SVD analysis suggests a significant linkage between the August 10–30 day temperature fluctuations over the mid-west Asia–northwest China region and the preceding February Arctic sea ice in the Barents-Kara Sea.When the Barents-Kara Sea SIC in late winter is above(below) normal, the 10–30 day temperature fluctuations over mid-west Asia into Northwest China in August increase (decrease).
3.2.Atmospheric circulation associated with the SVD mode
The changes in the atmospheric circulation associated with this coupled mode are further investigated.Linear regressions of the August 500-hPa geopotential height (Z500), sea level pressure (SLP), and 300-hPa zonal wind (U300) upon the time series of the August temperature fluctuations are performed.As shown in Fig.3, the atmospheric circulation changes most significantly in the mid-to-high latitudes east of 60°E.In strong temperature fluctuation years, the 500-hPa geopotential height shows a distinct dipolar pattern, which increases in the Arctic, especially around the Barents-Kara Sea, with accompanying decreases to the east of Ural Mountains (Fig.3a).The composites of Z500 and high- and lowtemperature fluctuation years in Fig.3b further illustrate the differences in the atmospheric circulations.In strong temperature fluctuation years, the atmospheric circulation exhibits more meridional meanders coincident with a weak ridge in northern Europe.These configurations are conducive to the formation of blocking, guiding cold surges from the Norwegian Sea into the Ural region through the Barents-Kara Sea.
The change of SLP associated with the temperature fluctuations is consistent with Z500 (Figs.3c, d), suggesting that the change of atmospheric circulation is approximately barotropic.Compared with the upper layer, the decreased SLP area in Eurasia is more significant.As shown in Fig.3e,the changes of zonal wind at 300 hPa display a meridional dipolar structure over the coast of the Barents-Kara Sea and mid-latitude Eurasia.This suggests that the westerly winds along the Arctic coast weaken, especially over the Barents-Kara Sea, with a commensurate and significant enhancement of the mid-latitude westerlies to the north of Lake Barkhash,as shown in the composite analysis in Fig.3f.
The wave energy propagation associated with summer temperature fluctuations is further diagnosed by wave activity flux.Figure 4 shows the composite of WAF on the timescales of 10–30 days in the upper- troposphere in typical strong and weak temperature fluctuation years.In strong temperature fluctuation years (Fig.4a), two branches of wave trains emerge from the Atlantic sector to the Eurasian continent in the mid-to-high latitudes.One propagates from the North Atlantic to the Barents-Kara Sea, then meanders southward through the Ural region before finally reaching the northern side of the Tibetan Plateau.The significant southeastward wave activity flux from the Barents-Kara Sea to Eurasia is in accordance with the increased temperature fluctuations along and to the northeast of the Caspian Sea.The other branch of the wave train propagates eastward from the North Atlantic across Europe into the Ural region before joining the northern branch.In weak temperature fluctuation years (Fig.4b), the eastward wave energy propagation still exists but with weaker strength.However, the one passing through the Barents-Kara Sea propagating southward to the Ural region disappears.The difference in 10–30 day WAF between strong and weak temperature fluctuations years is also displayed in Fig.4c.This figure again confirms that the main differences between WAF lie in the significant southward propagation of wave energy from the Barents-Kara Sea to the northern side of the Tibetan Plateau, which is consistent with the increase of the 10–30 day temperature fluctuations in the region.
In summary, when the August 10–30 day temperature fluctuations over and to the south of the Ural Mountains are active and coupled with the preceding February SIC in the Barents-Kara Sea, the atmospheric background circulation in the Arctic–Eurasian continent (especially to the east of 60°E) features more meridional meanders causing the westerly wind in the region to slows down, which favors the exchange of air masses between Arctic and midlatitudes and the consequent occurrence of cold surges and blocking.Within such a background circulation, strong meridional energy propagating waves with timescales of 10–30 days are observed from the Barents-Kara Sea to the Ural Mountains, coincident with the observed enhanced 10–30 day temperature fluctuations to the east of 60°E.These results support the view that a weaker polar jet stream in high latitudes and slower Rossby waves lead to more persistent and extreme atmospheric conditions (Tang et al., 2014; Coumou et al.,2018; Li et al., 2019).
3.3.Possible mechanism

Fig.3.(left) Regression maps of 500-hPa geopotential height (Z500, units: dagpm), sea level pressure (SLP, units: hPa),and the 300 hPa zonal wind (U300, units: m s–1) in August based on the time series of temperature fluctuations in the SVD mode in Fig.2c (color shading).The dotted regions (contours) denote statistical significance at a greater than 95% (90%)confidence level according to an F-test.(right) Composites of Z500 (intervals: 8 dagpm), SLP (intervals: 5 hPa), and U300(intervals: 4 m s–1) in strong (contours) and weak (shading) temperature fluctuation years.The strong (weak) years are defined as the years whose variations are stronger than 0.8 (weaker than –0.8) standard deviation of the temperature fluctuations time series (strong years: 1996, 1997,1998, 2011, and 2019; weak years: 1993, 1994, 1995, 2000, 2016, 2017,and 2018).The green frame denotes the area of temperature fluctuations from the SVD analysis.

Fig.4.Composite 300-hPa horizontal wave activity flux on the time scale of 10–30 days (arrows, units:m2 s–2) and perturbation stream function (shading, units: 105 m2 s–2) in (a) strong temperature fluctuation years, (b) weak temperature fluctuation years, and (c) their differences, in August based on the time series of 10–30 day August temperature fluctuations, in the SVD mode.Green arrows denote that the wave activity flux in either its x- or y- components is statistically significant above the 95% confidence level as determined by a Student’s t-test.The panel headings WAF_TN01 indicate wave activity flux, as defined by Takaya and Nakamura (2001).
How can the sea ice anomaly in February affect the temperature fluctuations one-half a year later? As atmospheric circulation is a relatively fast process and contains little longterm memory, we first apply regression analysis to explore the evolution of sea surface temperature and sea ice anomalies from February to August (Figs.5, 6) with the coupled mode.Significant SST anomalies (Fig.5a) exist in both the North Atlantic and North Pacific in February.In the North Atlantic, a significant meridional tripolar structure is observed.Meanwhile, the SST anomaly in the Atlantic subpolar region shows a zonal dipolar pattern with warm anomalies near southern Greenland and cold anomalies in the Nordic Seas in strong temperature fluctuation years.In the North Pacific, a warm anomaly in the Bering Sea is observed.Consistent with the SST anomaly, the SIC increases in the Barents-Kara Sea, while decreases are noted to the west of Greenland.From late winter to summer (Figs.5a–d), the SST warm anomaly in the Bering Sea becomes weak, and the tripolar pattern in the Northern Atlantic gradually converts to uniform warming.However, the significant western warm and eastern cold SST anomalies in the Atlantic subpolar region maintain themselves until summer, suggesting their continuous influence on atmospheric circulation as well temperature fluctuations.Meanwhile, in strong temperature fluctuation years, the increased sea ice in the Barents-Kara Sea is prominent in the entire Arctic in the winter and spring (Figs.6a–d).Although the Barents-Kara Sea ice melts in summer,there is still a positive sea ice anomaly in the marginal melting zone.
Wu et al.(2013) investigated the relationship between winter sea ice and summer atmospheric circulation over Eurasia and showed that persistent winter-spring SIC and a horseshoe-like triple pattern of SST anomalies in the North Atlantic act as bridges.In addition, Guo et al.(2014) suggested that the close Arctic-midlatitude relationship is explained by persistent SST anomalies in the Pacific.Although these two anomalous SST signals are also observed in this study, they become less obvious in summer.
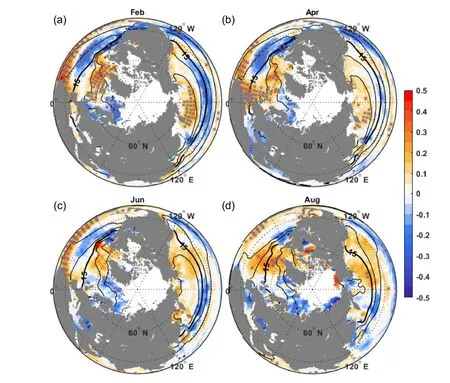
Fig.5.Regression maps of sea surface temperature (SST, units: °C) in February, April, June, and August (a–d,respectively) based on the time series of temperature fluctuations in the SVD mode in Fig.2c (shading).The crossed regions are statistically significant, above the 95% confidence level according to an F-test.The contours represent the climatology (intervals: 5°C).
If the SST and SIC anomalies in subpolar and Arctic regions last from late winter to summer, why are the significant temperature fluctuations only limited to August? To address this question, we first investigate the change in the background atmospheric circulation from July to August.Figure 7 shows the composites of background circulation in the middle and upper troposphere from July to August in strong and weak temperature fluctuation years.In strong temperature fluctuation years, the weak European ridge and trough in high latitudes amplify rapidly and extend southward from July to August, bridging the mid-to-high latitudes with the Caspian Sea area upstream of the deep trough.In contrast, during weak temperature fluctuation years, the circulation in the midlatitude Eurasian continent becomes more zonal in August than in July (Figs.7a, b).Therefore, the evolution of atmospheric circulation between strong and weak temperature fluctuations years significantly differ.The circulation in the upper troposphere is consistent with the lower layers but exhibits a stronger trough in the eastern Ural region in strong temperature fluctuation years (Figs.7c, d).The deepening of troughs and stagnation of ridges are also consistent with the weakening of the jet stream in August.Such changes in atmospheric circulation from July to August favor the meridional propagation of 10-to-30-day wave energy (Fig.4), as suggested by Gu et al.(2018).

Fig.6.Same as in Fig.5., but for sea-ice concentration (SIC).The black curve denotes the ice edge (20% sea-ice area fraction) for the climatology.
The evolution of wave activity flux on timescales of 10–30 days in strong and weak temperature fluctuation years also exhibits evident differences in July and August(Fig.8).In strong temperature fluctuation years, the July WAF is dominated by eastward propagation.In August, the most prominent feature is the evident southeastward wave energy propagation from the Barents-Kara Sea through the southeast Ural region into the Tibetan Plateau, along with the evident meridional meanders contained within the atmospheric circulation.The differences between strong and weak temperature fluctuation years are small in July, existing mainly over the North Atlantic and Eurasian regions, while they become strong and evident in August, which is consistent with the differences between the atmospheric background circulation.In weak fluctuation years, the August WAF is still dominated by zonal eastward propagation and exhibits only slight southeastward propagation in midlatitudes, despite the weak and subtle differences between the strong and weak temperature fluctuation years in July.In this way, the changes in WAF from July to August are consistent with the background circulation.Therefore, compared with subtle difference between strong and weak temperature fluctuation years in July, only in August does the atmospheric circulation and the WAF on timescales of 10–30 days exhibit evident changes and support the Arctic-midlatitude linkage, through which the anomalous thermal state in subpolar and Arctic regions (i.e., the Barents and Kara Seas) is able to affect the mid-latitude temperature fluctuations (Zhao et al., 2004;Cohen et al., 2018; Lee et al., 2019).
In summary, when the SIC in the Barents-Kara Sea increases in February, the SST anomaly in the mid-and-high latitudes shows a dipolar pattern with warm anomalies near southern Greenland and a cold anomaly in the Nordic Seas.These SST anomalies maintain themselves until summer,accompanied by the persistence of excessive SIC in the Barents-Kara Sea.With the distinct adjustment of the atmospheric background circulation from July to August, the European ridge and trough to the east of the Ural region evidently amplify in August, within which the low-frequency (10–30 days) wave energy stored in southern Greenland propagates through the Barents-Kara Sea southeast to the lower latitudes into the Ural region and Tibetan Plateau.Meanwhile,another branch of WAF propagates eastward along the lower latitudes and converges with the northern branch in the Ural region, especially near the Caspian Sea, making this a region with strong wave energy propagation.The above-mentioned background circulation and the WAF strongly promote the invasion of high-latitude cold surges and the formation of blocking.As a result, August temperature fluctuations on timescales of 10–30 days significantly increase in the Ural region, especially around the Caspian Sea.

Fig.7.Composites of 500-hPa (a–b, interval: 4 dagpm, 580 dagpm bold) and 250-hPa (c–d, interval: 8 dagpm, 1072 dagpm bold) geopotential height in July (black) and August (red) in strong and weak (left and right, respectively)temperature fluctuation years.

Fig.8.Same as in Fig.7, but for 300-hPa wave activity flux on a timescale of 10–30 days (magnitude ≥ 3 m2 s–2).
4.Conclusions and discussion
In this study, we useT′2, the essential part of local EAPE, as a metric to quantify the temperature fluctuations with weather patterns.By comparing groups of results from SVD analysis, we show a robust correlation between the August temperature fluctuations on a timescale of 10–30 days over mid-west Asia and the preceding February SIC in the Barents-Kara Sea.
Our study further explores the processes along with the above cross-seasonal Arctic-EurasiaT′2connections.When there is an increase in February SIC in the Barents-Kara Sea,a zonal dipolar pattern of SST anomalies also appears in the Atlantic subpolar region, with warm anomalies near southern Greenland and cold anomalies in the Nordic Seas, which persist from February into summer.In this background state, a European ridge and trough forms and amplifies from July to August, within which the 10–30 day wave energy is enhanced and propagates through the Barents-Kara Sea,then southeast to the lower latitudes before converging with the southern branch of the 10–30 day wave energy flux from the upstream North Atlantic into the Ural region; thus,focusing strong 10–30 day wave activity in this location.Significant changes in the related atmospheric circulation in August also occur in the mid-to-high latitudes to the east of 60°E, with weaker westerlies, higher SLP along the Arctic coast, and amplified meridional meanders of the geopotential height field in Eurasia.With the active 10–30 day wave activity in August, the 10–30 day temperature fluctuations over mid-west Asia significantly increase.The above processes are also summarized in a schematic in Fig.9.
Notably, although the enhanced wave energy in our study comes from the Arctic, the stronger 10–30 day temperature fluctuations do not imply a cooler August.As shown in Fig.10a, there is no clear relationship between the August 10–30 day temperature fluctuations and the August mean temperature.With strong 10–30 day temperature fluctuations,the monthly mean temperature can be either cooler, warmer,or close to the climatology.Although strong 10–30 day temperature fluctuations usually make a stronger contribution to the monthly mean temperature, as shown in Fig.10b, such contribution is much weaker than that of the longer timescale temperature variations.
In our study, Arctic SIC anomalies always occur along with the SST anomalies in the North Atlantic subpolar region, whose effect on the atmospheric circulation is hard to separate and distinguish merely from observations.To further illustrate the relationship between Barents-Kara Sea SIC and SST in the North Atlantic subpolar region, we define the SIC-BKS and SST-DP indices to denote the strength of the regionally averaged SIC and SST anomalies.Their lead-lag correlation in Fig.11 shows that the winterto-spring SST anomaly in the subpolar North Atlantic is significantly related to the BKS SIC anomaly in FMA(Figs.11a–c).In significant temperature fluctuation years(Figs.11d–f), the SIC and SST in the BKS and the subpolar North Atlantic have the strongest correlation at lag 0, which indicates that they may be simultaneously occurring.Moreover, the correlation is enhanced and lasts longer (through summer) than in normal years.However, the causality between SIC and SST anomalies needs to be further delineated by numerical experiments and more sophisticated diagnostics.
Our results support the views that a weaker polar jet stream and a meridionally amplified atmospheric circulation in high latitudes strengthen the linkage between Arctic and summertime mid-latitude weather (Tang et al., 2014; Horton et al., 2016; Coumou et al., 2018); furthermore, our study highlights the important role of the 10–30 day waves for such linkage.Many recent studies (Wu et al., 2013; Li et al.,2019; Deng et al., 2020; Tian et al., 2021) suggest that preceding (or simultaneous) Arctic sea ice and SST anomalies may lead to more frequent Eurasia extreme weather events by enhanced meridional propagation of stationary waves.For example, Tian et al.(2021) suggested that when a spring Bering Sea ice anomaly increases, the excited wave trains help the North Atlantic dipolar SST anomaly maintain itself in summer, thereby further promoting the propagation of zonal stationary waves to East Asia.Different from most existing studies that have focused on the change of stationary waves, our study highlights the role of the 10–30 day low-frequency waves, which warrants further investigation.

Fig.9.Schematic diagram summarizing the linkage between February Arctic sea ice and August Eurasia temperature fluctuations.

Fig.10.Scatterplot of August mean 10–30 day temperature fluctuations against the absolute August mean temperature anomaly (a, units: °C) and absolute August mean 10–30 day temperature (b, units: °C) over the most active temperature fluctuation region in the SVD mode (35°–55°N, 45°–70°E).
Our study also suggests that, compared with the influence on the wintertime atmospheric circulation, the Arctic sea ice may exert a distinctly different influence on summertime circulations.Most studies on winter weather and climate suggest that decreased Arctic sea ice is correlated with stronger wintertime wave activities for both stationary (e.g., Li et al.,2019; Zhang et al., 2022) and low-frequency waves (e.g.,Gu et al., 2018), along with a meridionally amplified atmospheric circulation and weaker westerlies.For summer, such changes in atmospheric circulation seem more likely to occur for increased Arctic sea ice.Therefore, the relationship between the changes in Arctic sea ice and the wave activities in Eurasia in the winter and summer seasons may be complicated and requires further exploration.
Our study helps improve the understanding of Arctic–midlatitude linkage and highlights a possible Arctic influence on 10–30 day temperature fluctuations in August.However, compared with the influence of the Arctic on wintertime circulation, its influence on the summertime climate is greatly confined to the variability on the 10–30 day timescale in a certain month (August) and is mainly evident only in recent decades, suggesting that the influence of Arctic sea ice on the mid-latitude summer circulation seems to require more strict conditions as was suggested in Liu et al.(2020).Although this study suggests a possible mechanism through which the Arctic sea ice can influence the summer temperature fluctuations in midlatitudes, it is still unclear why the atmospheric circulation behaves so differently from July to August and how the Arctic can affect the 10–30 day wave activity in sub-polar regions.Again, this mechanism needs to be further delineated by numerical experiments and more sophisticated diagnostics.Moreover, some recent studies have suggested that Arctic climate change may affect the mid-latitude weather through multiple pathways (Xu et al.,2021; Zhang and Screen, 2021); therefore, in addition to tropospheric low-frequency waves, whether there are other processes through which Arctic changes can affect the summertime extratropical circulations is worthy of future investigation.

Fig.11.The cross-correlation between the SIC-BKS index and the SST-DP index (a, d) and its western (b, e) and eastern(c, f) area components in total (upper panels) and for the significantly anomalous temperature fluctuation years (lower panels)for the detrended data.The negative (positive) numbers on the abscissa indicate the number of months by which the SST leads (lags) the SIC.The solid (dashed) contours denote values statistically significant at the 95% (90%) confidence level.The SIC-BKS index is defined as the SIC anomaly averaged over the Barents-Kara Sea (65°–85°N, 10°–90°E), and the SSTDP index is defined as the SST anomaly difference between the positive (50°–65°N, 60°–10°W) and negative (65°–85°N,10°W–90°E) centers of the dipolar pattern.
Acknowledgements.The authors sincerely thank the Editor and the two anonymous reviewers for their constructive suggestions, which helped improve the quality of the manuscript.This work is supported by the National Key Research and Development Program under Grant 2022YFE0106900, the Strategic Priority Research Program of the Chinese Academy of Sciences under Grant XDA2010030804, and the National Natural Science Foundation of China under Grant No.41621005.
 Advances in Atmospheric Sciences2023年12期
- Advances in Atmospheric Sciences的其它文章
- Toward Quantifying the Increasing Accessibility of the Arctic Northeast Passage in the Past Four Decades※
- Arctic Sea Level Variability from Oceanic Reanalysis and Observations※
- Separation of Atmospheric Circulation Patterns Governing Regional Variability of Arctic Sea Ice in Summer※
- The Arctic Sea Ice Thickness Change in CMIP6’s Historical Simulations※
- Simulations and Projections of Winter Sea Ice in the Barents Sea by CMIP6 Climate Models※
- Evaluation of the Arctic Sea-Ice Simulation on SODA3 Datasets※