
Separation of Atmospheric Circulation Patterns Governing Regional Variability of Arctic Sea Ice in Summer※
2023-12-26 09:12:52ShaoyinWANGJipingLIUXiaoCHENGRichardGREATBATCHZixinWEIZhuoqiCHENandHuaLI
Advances in Atmospheric Sciences 2023年12期
Shaoyin WANG, Jiping LIU, Xiao CHENG*, Richard J.GREATBATCH, Zixin WEI,Zhuoqi CHEN, and Hua LI
1School of Geospatial Engineering and Science, Sun Yat-sen University, and Southern Marine Science and Engineering Guangdong Laboratory (Zhuhai), Zhuhai 519000, China
2Department of Atmospheric and Environmental Sciences, State University of New York at Albany, Albany NY 12222, USA
3GEOMAR Helmholtz Centre for Ocean Research Kiel, Kiel 24105, Germany
4Joint International Research Laboratory of Climate and Environment Change, Nanjing University of Information Science & Technology, Nanjing 210044, China
5Faculty of Mathematics and Natural Sciences, Christian Albrechts University of Kiel, Kiel 24118, Germany
6University Corporation for Polar Research, Zhuhai 519000, China
ABSTRACT In recent decades, Arctic summer sea ice extent (SIE) has shown a rapid decline overlaid with large interannual variations, both of which are influenced by geopotential height anomalies over Greenland (GL-high) and the central Arctic(CA-high).In this study, SIE along coastal Siberia (Sib-SIE) and Alaska (Ala-SIE) is found to account for about 65% and 21% of the Arctic SIE interannual variability, respectively.Variability in Ala-SIE is related to the GL-high, whereas variability in Sib-SIE is related to the CA-high.A decreased Ala-SIE is associated with decreased cloud cover and increased easterly winds along the Alaskan coast, promoting ice–albedo feedback.A decreased Sib-SIE is associated with a significant increase in water vapor and downward longwave radiation (DLR) along the Siberian coast.The years 2012 and 2020 with minimum recorded ASIE are used as examples.Compared to climatology, summer 2012 is characterized by a significantly enhanced GL-high with major sea ice loss along the Alaskan coast, while summer 2020 is characterized by an enhanced CA-high with sea ice loss focused along the Siberian coast.In 2012, the lack of cloud cover along the Alaskan coast contributed to an increase in incoming solar radiation, amplifying ice–albedo feedback there; while in 2020, the opposite occurs with an increase in cloud cover along the Alaskan coast, resulting in a slight increase in sea ice there.Along the Siberian coast, increased DLR in 2020 plays a dominant role in sea ice loss, and increased cloud cover and water vapor both contribute to the increased DLR.
Key words: Arctic sea ice, Arctic circulation patterns, shortwave and longwave radiation, cloud cover, water vapor
1.Introduction
Arctic sea ice has declined dramatically over the last few decades, directly following cumulative carbon dioxide emissions (Notz and Stroeve, 2016).In addition to less sea ice extent, Arctic sea ice is also becoming thinner and younger (Maslanik et al., 2007; Stroeve and Notz, 2018).Feedback processes associated with ice–albedo, water vapor,and clouds are thought to be major contributors to the longterm sea ice decline (Perovich et al., 2007; Kapsch et al.,2013; Goosse et al., 2018; Huang et al., 2019b).Arctic sea ice has been declining in all months, and its decline is particularly strong in summer months (Cavalieri and Parkinson,2012; Stroeve and Notz, 2018).Although greenhouse gas emissions continue unabated, no new record for the annual minimum Arctic sea ice extent has been set since 2012 (Francis and Wu, 2020).For example, the annual minimum sea ice extent reached a record low in 2012 with 3.41 million square kilometers and a second record low in 2020 with 3.74 million square kilometers (National Snow and Ice Data Center, NSIDC).This underscores the importance of internal climate variability in regulating interannual and long-term changes in Arctic sea ice (Shimada et al., 2006; Overland and Wang, 2010; Wettstein and Deser, 2014; Ding et al.,2019, 2022; He et al., 2020; Li et al., 2022).
Numerous studies have addressed the links between summer atmospheric circulation patterns and interannual and long-term changes in September Arctic sea ice extent(Ogi and Wallace, 2007; Stroeve et al., 2008; Ding et al.,2014, 2017; Cai et al., 2018).The Arctic Oscillation (AO)and Arctic dipole anomaly (AD) patterns, defined as the leading and second principal components of Northern Hemisphere sea level pressure north of 20°N and 70°N, respectively (Wang et al., 2009; Overland and Wang, 2010; Cai et al., 2018), are thought to be critical contributors to summer Arctic sea ice variability.Some studies suggest that sea ice extent reduction in September is preceded by anticyclonic anomalies over the Arctic Ocean and a negative AO in summer (e.g., Ogi and Wallace, 2007; Ogi et al., 2016).The high pressure over the Arctic Ocean and Greenland from June to September (resembling the negative AO) is found to explain 30%–50% of the sea ice decline over the past decades (Swart et al., 2015; Ding et al., 2017, 2019).Several studies have also pointed out the importance of the AD pattern on the summer Arctic sea ice decline (Wang et al., 2009;Overland and Wang, 2010).The positive phase of the AD pattern is characterized by high pressure anomalies over the northern Beaufort Sea and low pressure anomalies over northern Siberia.For example, summer 2007 was characterized by a typical AD anomaly with cloudless conditions over the Beaufort Sea, leading to an increase in downward shortwave radiation (DSR) and substantial sea ice decline in summer(Kay et al., 2008; Stroeve et al., 2008).The Greenland high(GL-high) represents the anticyclonic/blocking pattern over Greenland, and variations in the GL-high emphasize local circulation changes of the summer AO or the summer North Atlantic Oscillation (NAO) (Hanna et al., 2016).Over the past few decades, the GL-high has exhibited a significant upward trend in summer, contributing to the Greenland ice sheet melting (Hanna et al., 2014) and Arctic sea ice decline(Huang et al., 2019a).
Feedback processes associated with clouds, water vapor,and radiation are also interwoven within the circulation patterns to exert an enormous impact on Arctic sea ice.The positive phase of the AD pattern is found to enhance water vapor and heat transport from lower latitudes and midlatitudes to the Arctic (Wu et al., 2006; Overland et al., 2012; Wang et al., 2020), enhancing convergence of the energy flux and the increase in downward longwave radiation (DLR) (Francis and Hunter, 2006; Graversen et al., 2011).Similarly, high pressure over Greenland and the Arctic Ocean is associated with a warmer and wetter atmosphere and increased DLR over the Arctic (Ding et al., 2017; Luo et al., 2021).Several studies also have emphasized the role of solar radiation in Arctic sea ice variability.The negative NAO (equivalent to the intensified GL-high) is suggested to reduce cloud cover over the Beaufort Sea in summer, promoting ice–albedo feedback due to increased DSR (Kay et al., 2008; Zhan and Davies, 2017; Huang et al., 2019a; Wang et al., 2022).Therefore, the roles of DSR and DLR in regional Arctic sea ice changes during the summer are still unclear.A separation of circulation patterns and associated Arctic sea ice variability into different regions would elucidate their different roles and feedback processes.The atmospheric circulation patterns also dynamically redistribute Arctic sea ice through surface winds (Wang et al., 2009; Ogi et al., 2010; Bi et al., 2021).The modified surface wind speed associated with cyclonic or anticyclonic anomalies contributes to sea ice break-up via Ekman drift in the Arctic marginal seas (Ogi and Wallace,2012; Kwok et al., 2013).
Overall, low September Arctic sea ice extent is closely associated with anticyclonic circulation over Greenland and the Arctic Ocean.We are interested in whether the two localized anticyclonic centers that are over Greenland and the central Arctic Ocean are separable and play different roles in influencing summer Arctic sea ice.Hence the linkage between regional variability of Arctic sea ice and atmospheric circulation patterns and feedback processes is investigated with the following questions being addressed:
(1) What are the predominant circulation patterns that control the regional variability of Arctic sea ice in summer?
(2) What are the mechanisms underlying the influence?
(3) What are the implications of these predominant circulation patterns and the associated feedbacks on the extremes of summer Arctic sea ice minima, such as those recorded in 2012 and 2020.
This paper examines the relationship between regional Arctic sea ice and circulation patterns and the associated feedback processes.The relationship is estimated based on statistical analysis and case studies.The rest of this paper is arranged into five parts.Section 2 describes the data and methods.Section 3 discusses the partitioning of summer Arctic sea ice variability.Section 4 explores the linkage between the regional Arctic sea ice variability and atmospheric circulation and feedback processes.Section 5 discusses the sea ice and circulation anomalies in two representative years, 2012 and 2020.Conclusions are presented in section 6.
2.Dataset and methods
2.1.Data and indexes
(1) Arctic sea ice concentration and sea ice motion:monthly mean sea ice concentration (SIC) for the period of 1979–2020 is obtained from the National Snow and Ice Data Center (NSIDC).This dataset is derived from the Nimbus-7 Scanning Multichannel Microwave Radiometer(SMMR), the Defense Meteorological Satellite Program(DMSP) Special Sensor Microwave Imager (SSM/I), and the DMSP Special Sensor Microwave Imager and Sounder(SSMIS) sensors using the Nasateam algorithm (Comiso et al., 2017).The data are provided on the polar stereographic projection with a spatial resolution of 25 km.The monthly sea ice motion is obtained from the similar 25-km Polar Pathfinder Equal Area Scalable Earth (EASE)-Grid archived by NSIDC, which is retrieved from Advanced Microwave Scanning Radiometer (AMSR)-E and AMSR-2 passive microwave (Tschudi et al., 2020).Due to the high orbit inclination around the North Pole, satellite-borne instruments do not image a circular area over the North Pole (the so-called Arctic pole hole), which leads to missing values there (Comiso et al., 2017).
(2) ERA5: the monthly data of the ERA5 over the period of 1979–2020 are used in this study (Hersbach et al.,2020), including mean sea level pressure (SLP), zonal and meridional winds, geopotential height and temperature, low cloud cover, total column water vapor, downward longwave and shortwave radiation under all-sky and clear-sky conditions, and net shortwave and longwave radiation.ERA5 reanalysis has a higher resolution and better performance than its predecessor ERA-Interim (Di Biagio et al., 2021).
(3) Radiative fluxes and clouds: monthly surface radiative fluxes and low cloud cover are obtained from the Clouds and the Earth’s Radiant Energy System (CERES)from March 2000 to November 2020 (https://ceres.larc.nasa.gov).The surface radiative fluxes are extracted from the level-2B FLXHR product (Kato et al., 2018); the low cloud cover used in this study is extracted from the level-3 Moderate Resolution Imaging Spectroradiometer (MODIS) product at pressure less than 700 hPa.Those data are provided on a 1°by 1° grid.
(4) Arctic sea ice extent (SIE): Arctic sea ice extent is defined as the total area covered by at least 15% sea ice concentration.Its variability largely reflects the sea ice variability at the marginal ice zone.The daily and monthly Arctic sea ice extent are obtained from the NSIDC (https://nsidc.org/data/seaice_index/).
(5) Following Hanna et al.(2016), the GL-high in this study is defined as the area-averaged geopotential height at 500 hPa over Greenland (60o–80oN and 20o–80oW).
2.2.Methods
(1) Linear regression model: Following Li and Lu(2017), the summer Arctic SIC variability is split into two components through a linear regression model ( ):
y=ax+bone is associated with the GL-high; and the other is the remainder.
(2) Surface radiative budget: the surface radiative budget is formulated as below,
where NetRad, NetSR, and NetLR denote the surface net radiation and net longwave and shortwave radiation; DSR, USR,DLR, and ULR denote the downward and upward shortwave radiation and downward and upward longwave radiation.We define that the surface radiative fluxes are positive downward.
(3) Cloud radiative forcing: the cloud radiative forcing(CRF) at the surface is the sum of the separate shortwave and longwave components (Vavrus, 2006), which are defined as the difference between the all-sky and clear-sky conditions,
Traditionally, the surface CRF is estimated based on the difference between the net fluxes under all-sky and clear-sky conditions.However, the surface albedo exerts a strong influence on the NetSR fluxes, which makes it hard to isolate radiative effect of cloud (Vavrus, 2006).
3.Partitioning summer Arctic sea ice changes into two components
Figure 1a shows the linear trend of summer(June–July–August, JJA) Arctic SIC over the 42-year period 1979–2020.The largest decline in sea ice has occurred in the Arctic marginal seas, and especially in the coastal regions of Siberia and Alaska, at a rate of more than 5% SIC per decade (black contours).Because the sea ice edges are the most fragile, sea ice loss over these Arctic marginal seas largely determines the overall decline in Arctic sea ice extent (ASIE).The summer (averaged for the months of June, July, and August) ASIE shows a rapid decline at a rate of 0.65 million km2decade–1, reaching its second lowest value in 2012 (7.69 million km2) and its lowest in 2020 (7.65 million km2) (Fig.1b, red line).The sea ice decline in September closely follows that of summer at 0.83 million km2decade–1, with its lowest level in 2012 (3.41 million km2) and its second lowest in 2020 (3.74 million km2)(Fig.1b, red line).
Numerous studies (Ogi and Wallace, 2007; Overland and Wang, 2010; Ding et al., 2017) have suggested that in addition to global warming, high-latitude atmospheric circulation anomalies contribute significantly to interannual as well as long-term changes in the summer ASIE.The GLhigh is one of the most important circulation patterns in the high latitudes.As shown in Fig.1b, the summer GL-high shows a significant positive trend, which is overlaid by a strong interannual variability.After detrending, the GL-high is highly correlated with the summer ASIE and September ASIE with correlations of about –0.52 and –0.50, respectively(Table 1).The interannual variability of the GL-high accounts for about 30% of the interannual variability of the summer ASIE.However, the GL-high only accounts for part of the variance.The remaining fraction cannot be explained by the GL-high.
To understand the summer sea ice variability, we divide the time series of summer ASIE into that part that is linearly dependent on the GL-high and the remainder, the latter being linearly independent of the GL-high, both times series(ASIE and GL-high) being first linearly detrended.The correlation coefficients between the summer ASIE, these two components of the summer ASIE, and the summer sea ice concentration are shown in Figs.2a–c.Clearly, the interannual variability of the summer ASIE consists of significant marginal sea ice changes: largely over the Barents, Kara, Laptev, and East Siberian Seas of the Siberian Arctic (Fig.2a, red box),and over the Chukchi and Beaufort Seas (Fig.2a, blue box).These are also consistent with the regions of largest sea ice decline (Fig.2a vs.Fig.1a).The intensified GL-high is strongly correlated with reduced sea ice along the Alaskan coast with correlations greater than 0.40, significant at the 99% confidence level (Fig.2b).There is also a significant sea ice decrease (increase) over the Baffin and Hudson Bays(western Greenland), which is due to the anticyclonic anomaly over Greenland that transports warm and moist(cold and dry) air masses northward (southward) over western(eastern) Greenland (Wang et al., 2020).The component linearly unrelated to the GL-high is correlated with substantial sea ice loss along the Siberian coast and around Svalbard Island.Therefore, summer Arctic sea ice variability shows different patterns: sea ice changes along the Alaskan coast,which are significantly affected by the GL-high, and sea ice changes along the Siberian coast, which are unrelated to the GL-high.In the following (see Fig.2), the Siberian coast is defined as the area encompassing the Barents–Kara Seas,the Laptev Sea, and the East Siberian Sea; and the Alaskan coast is defined as the area encompassing the Chukchi Sea(part of it) and the Beaufort Sea.We then calculated the SIE along the Alaskan coast (Ala-SIE) and along the Siberian coast (Sib-SIE) (defined as areas with at least 15% SIC).
Figures 2d–e show the time series of the summer ASIE,Ala-SIE, and Sib-SIE over the period 1979–2020.The Sib-SIE displays a declining trend at a rate of 0.22 million km2(10yr)-1(Fig.2d, red line); the Ala-SIE at a rate of 0.11 million km2(10yr)-1(Fig.2e, blue line).In 2012, the summer Ala-SIE reaches its lowest level, corresponding to the lowest annual minimum ASIE (contributed by both); in 2020, the summer Sib-SIE reaches its lowest level, corresponding to the second-lowest annual minimum ASIE (contributed primarily by Sib-SIE).After detrending, the correlation coefficients among JJA (and Sep) ASIE, Ala-SIE, and Sib-SIE and the GL-high are shown in Table 1.In terms of interannual variability, the Sib-SIE variability accounts about 65% of the summer ASIE variability, and the Ala-SIE accounts for about 21%.Note that the correlation between the Sib-SIE and Ala-SIE is relatively low (R = 0.22), suggesting that their interannual variability is largely independent of each other.Therefore, the sea ice over the two regions contributes separately and also highly to the variability of the summer ASIE and Sep ASIE.In the following section, we investigate the interannual connections between the summer SIE, Ala-SIE, and Sib-SIE and the atmospheric circulation.
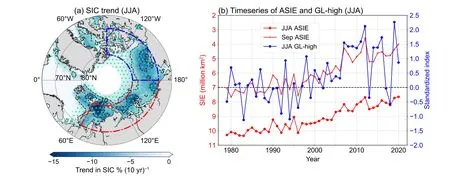
Fig.1.(a) Linear trend of summer (JJA) Arctic sea ice concentration (SIC) over the period 1979–2020.Stippling denotes that the linear trends are significant at the 95% confidence level.Black contours denote the SIC trends of 10%(10 yr)–1 and 5% (10 yr)–1.(b) Time series of the summer Greenland high index (GL-high) (blue), summer and September (Sep) Arctic sea ice extent (ASIE) (red) (ordinate reversed) over the period 1979–2020.After detrending,the correlations between the GL-high and JJA ASIE and September ASIE are –0.52 and –0.50, respectively.The Siberian (60°–180°E and 70°–80°N) and Alaskan coastal boxes (180°–270°E and 70°–80°N) used for analysis are marked by the dashed-red and dashed-blue lines, respectively, in (a).

Fig.2.Upper panel: partition of summer Arctic sea ice changes according to their relationship to the GL-high.Correlations over the period 1979–2020 between the linearly detrended summer Arctic SIC and ASIE (a), the GLhigh component (b), and the component independent of the GL-high (c).Stippling denotes that the correlations are significant at the 95% confidence level (R > 0.30).The Siberian and Alaskan coastal boxes are marked by the red and blue lines, respectively.Lower panel: (d) timeseries of anomalous summer (JJA) ASIE (black line), Sib-SIE (blue line), and Ala-SIE (red line) over the period 1979–2020.(e) is the same as (d) but for the detrended time series of ASIE (black), Sib-SIE (blue), and Ala-SIE (red).

Table 1.Correlations between summer ASIE, September (Sep) ASIE, summer GL-high, summer Ala-SIE, and summer Sib-SIE over the period 1979–2020.The linear trends of the time series have been removed prior to correlation analysis.The correlation coefficients that are statistically significant at the 95% confidence level are printed in bold.
4.Separating atmospheric circulation patterns for Siberian and Alaskan sea ice changes on interannual time scales
To examine the linkage between total SIE, Ala-SIE,and Sib-SIE and atmospheric circulation patterns on interannual time scales, long-term trends in the atmospheric fields and SIE time series are removed by linear fitting prior to regression and correlation analyses.Figure 3 shows linear regression maps between the detrended summer ASIE, Ala-SIE, and Sib-SIE and geopotential height at 500 hPa(GPH500).The time series of summer ASIE, Ala-SIE, and Sib-SIE are sign-reversed before regression analysis.Associated with the decreased ASIE, there are positive GPH500 anomalies over Greenland and the Siberian side of the Arctic Ocean (Fig.3a).The association is similar to the surface geopotential anomalies (not shown), suggesting an equivalent barotropic structure.Associated with the decreased Ala-SIE,there is an enhanced GPH over Greenland (Fig.3b), consistent with a significant correlation between the GL-high and Ala-SIE (Fig.2).Associated with the decreased Sib-SIE, there is an enhanced GPH over the central Arctic Ocean (Fig.3c).Comparing Figs.3b–c with Fig.3a, it is clear that the GPH anomalies related to the interannual variability of the ASIE can be divided into two parts: the GL-high that is related to the Ala-SIE and GPH anomalies over the central Arctic Ocean (referred to as the CA-high) that are related to the Sib-SIE.A reduced ASIE on interannual time scales is associated with significant warming over the Pan–Arctic regions,including the Siberian Arctic, Greenland, the Canadian Archipelago, and the Arctic marginal seas (Fig.3d).A reduced Ala-SIE is associated with substantial warming over the Canadian Archipelago and Canadian Basin (Fig.3e);while the decline in Sib-SIE is associated with warming over the Siberian Arctic (Fig.3f).This implies that the extensive interannual sea ice melting in the Arctic marginal seas is generally coincident with warm temperatures over the Arctic land.

Fig.3.Upper panel: regression maps between the summer geopotential height at 500 hPa (shading; units: 10 m s–1), wind field at 850 hPa (vectors), and the standardized and detrended time series (sign-reversed) of summer ASIE, Ala-SIE, and Sib-SIE over the period 1979–2020.The time series of summer ASIE, Ala-SIE, and Sib-SIE are sign-reversed.Lower panel: the same as the upper panel, but for 2-meter air temperature.The linear trend in the time series has been removed prior to regression analysis.Stippling denotes the regression coefficients are significant at the 95% confidence level.
Water vapor and cloud cover are both key factors for regulating the radiation reaching the surface (Curry et al.,1996; Kay and Gettelman, 2009; Liu and Key, 2014).Figure 4 shows the regression maps between the detrended summer ASIE, Ala-SIE, and Sib-SIE and total column water vapor, northward water vapor transport, and low cloud cover (LCC).Associated with a reduced summer ASIE on interannual time scales, there is a significant increase in water vapor over the Siberian side of the Arctic Ocean, particularly over the Laptev Sea, and western Greenland (Fig.4a).Associated with the decreased Ala-SIE, a significant increase in water vapor appears over western Greenland and part of the central Arctic (Fig.4b); while a reduced Sib-SIE is associated with a significant increase in water vapor over the Siberian side of the Arctic Ocean, which is very similar to the pattern associated with a reduced ASIE overall (Figs.4c vs.4a).The increased water vapor over western Greenland is because of the enhanced northward water vapor transport (Figs.4d–f) associated with the anticyclonic anomalies over Greenland (Fig.3a).The increased water vapor over the Siberia side of the Arctic Ocean is partially due to northward water vapor transport through the Siberia pathway (Figs.4d and 4f).However, there is little (or no)increase in water vapor over the Canadian Basin, indicating that the water vapor is not the key for the sea ice melting over that region (Figs.4a and 4b).The comparison of Figs.4b–c with Fig.4a clearly demonstrates that an interannual decrease in sea ice along the Siberian coast is closely linked to the increased water vapor there, while an interannual decrease in sea ice along the Alaskan coast is not closely related to water vapor.In terms of cloud cover, as shown in Fig.4d, low cloud cover associated with reduced summer ASIE is reduced significantly over the Canadian Archipelago and Canadian Basin and increased over the central Arctic and eastern Svalbard Island.Reduced Ala-SIE is associated with significantly less cloud cover over the Canadian Archipelago and Beaufort Sea, which is consistent with that associated with reduced ASIE.Both reduced Sib-SIE and Ala-SIE are associated on interannual time scales with a significant increase in cloud cover in the central Arctic.

Fig.4.The same as Fig.3, but for total column water vapor (upper panel), vertical integral of northward water vapor flux (middle panel), and low cloud cover (lower panel).Stippling denotes the regression coefficients are significant at the 95% confidence level.

Fig.5.Upper panel: regression maps between summer DLR and (sign-reversed) summer ASIE (a), Ala-SIE (b), and Sib-SIE (c).Middle panel: the same as the upper panel, but for summer DSR.Lower panel: the same as the upper panel, but for NetRad.Stippling denotes the regression coefficients are significant at the 95% confidence level.
The surface radiative budget is important for Arctic sea ice melting (Kay et al., 2008; Kay and L'Ecuyer, 2013).Associated with reduced summer ASIE on interannual time scales, there is a substantial increase in DLR over Greenland, western Greenland, and the Siberian side of the Arctic Ocean (Fig.5a).A reduction in ASIE by 1 standard deviation is associated with an increase in DLR of over 6 W m–2on the Siberian side of the Arctic Ocean.The pattern of increased DLR over the Arctic Ocean bears a considerable resemblance to that of the increased water vapor associated with a reduction in ASIE (Figs.5a vs.4a).Associated with reduced Ala-SIE, there is little change in DLR over the Beaufort Sea and Canadian Archipelago, indicating that the DLR plays a minor role in the interannual variability of the Ala-SIE (Fig.5b).The DLR is increased over western Greenland, which is coincident with the enhancement of the water vapor as well as northward water vapor (northward heat, not shown) transport.Associated with reduced Sib-SIE, there is a substantial increase in DLR over the Siberian side of the Arctic Ocean, which is very similar to that associated with reduced summer ASIE (Figs.5c vs.5a).By contrast, associated with a decrease in ASIE by 1 standard deviation, there is an up to 10 W m–2decrease in DSR over the Siberian side of the Arctic Ocean (Fig.5d).The decreased DSR is mainly due to a substantial increase in water vapor there that obstructs the incoming solar radiation, associated with the reduced summer ASIE.Similarly, a reduction in DSR is also seen over western Greenland (Baffin Bay and Baffin Island), consistent with the increased water vapor content there.Over the Canadian Basin and Archipelago, a reduced summer ASIE is associated with a substantial increase in DSR.The DSR anomalies association with the Ala-SIE are consistent with those associated with the ASIE (Figs.5d and 5e).This suggests that radiative feedbacks along the Alaskan coast are quite different from those along the Siberian coast, where the water vapor increase and the accompanied enhancement of DLR dominate.Associated with reduced Ala-SIE, there is an increase in NetRad of over 10 W m–2along the Alaskan coast (Fig.5h).Compared to the positive NetRad anomalies associated with reduced Ala-SIE, reduced Sib-SIE is related to a weaker increase in NetRad (Figs.5h vs.5i), partly due to the decreased DSR along the Siberian coast (Fig.5f).Likewise, reduced Sib-SIE is also related to a weaker reduction in surface albedo along the Siberian coast than that associated with the decline in Ala-SIE (not shown).
The direction and strength of surface winds are important drivers for Arctic sea ice (Graversen et al., 2011; Ogi and Wallace, 2012; Kwok et al., 2013).Associated with reduced summer ASIE, the surface wind speed is generally increased over the Arctic marginal seas, but not significantly.Associated with reduced Ala-SIE, the wind speed is significantly increased over the Beaufort Sea (Fig.6b).In conjunction with the westward wind anomalies, these wind anomalies drive westward sea ice drift (Fig.6e), leading to sea ice decline there.Similarly, reduced Sib-SIE is also associated with a significant increase in wind speed along the Siberian coast, particularly over the Laptev Sea.The increased wind speed acts to break up sea ice, leading to more open water areas in the Arctic marginal seas; meanwhile, the decreased sea ice and increased open water areas also affect the wind speed by reducing the surface drag (Mioduszewski et al., 2018; Waseda et al., 2018).The anticyclonic surface wind anomalies associated with reduced summer ASIE drive similar anticyclonic sea ice motion over the Arctic Ocean (Fig.6d).Together with the intensified westward wind anomalies, reduced Ala-SIE is associated with a significant increase in westward sea ice drift, transporting sea ice out of the Beaufort Sea (Figs.6b and 6e).Associated with reduced Sib-SIE, the zonal component of sea ice motion anomaly along the Siberian coast is similar to that of Ala-SIE, but stronger (Figs.6e and 6f).

Fig.6.Upper panel: regression maps between 10-meter wind speed (shading), 850-hPa wind vectors and the detrended (signreversed) summer ASIE (a), Ala-SIE (b), and Sib-SIE (c).Lower panel: the same as the upper panel but for the zonal component of sea ice motion.Stippling denotes the regression coefficients are significant at the 95% confidence level.
The actual impact of atmospheric circulations on sea ice variability depends heavily on feedback processes.Based on the datasets of ERA5 and CERES, the relationship between the feedback processes and an interannual reduction in sea ice extent is estimated from the correlations between the area-averaged quantities and the summer ASIE, Ala-SIE,and Sib-SIE (Fig.7).Note that the time series of ASIE, Ala-SIE, and Sib-SIE are detrended and inverted.Firstly, the Ala-SIE is negatively correlated with the overlying LCC both in ERA5 and CERES with R > 0.40 (exceeding the 95%confidence level) (Figs.7a and 7b), consistent with Fig.4h.The Sib-SIE in CERES shows significant positive correlations with the overlying LCC, but not in ERA5 (Figs.7a and 7b).The cloudier (also wetter) Arctic associated with the decreased Sib-SIE generally serves to increase the DLR,but reduce the DSR, which is manifested as strong correlations between the Sib-SIE (ASIE) and DLR, DSR.Overall,the CRF_SR is stronger than the CRF_LR, resulting in a cooling effect with the presence of clouds in summer (Figs.7a and 7b).The cloudless conditions associated with the decreased Ala-SIE, on the other hand, favor the increase of the DSR through a shortwave cloud effect.But, in ERA5 and CERES, correlations between summer Ala-SIE, and summer DSR, CRF_SR, and CRF are small and insignificant.However, these correlations become larger and significant,especially in ERA5, when July DSR, CRF_SR, and CRF are correlated with the summer Ala-SIE (Figs.7c and 7d).This is because in July, when incoming solar radiation is strongest, the shortwave forcing of clouds reaches a maximum, which contributes to the increase in DSR.

Fig.7.Upper panel: (a) Correlations between the summer ASIE, Ala-SIE, Sib-SIE (sign-reversed) and local summer thermodynamic variables: low cloud cover (LCC), downward longwave radiation (DLR), downward shortwave radiation (DSR), shortwave cloud radiative forcing (CRF_SR), longwave cloud radiative forcing (CRF_LR), total cloud radiative forcing (CRF), and Net radiative flux (NetRad).These quantities are area-averaged for the Arctic region (northward of 65°N) (green bar), Siberian (60°–180°E and 70°–80°N) (red bar) and Alaskan coasts (180°–270°E and 70°–80°N) (blue bar).The linear trends of both time series are removed prior to correlation analysis.(b) is the same as the (a), except for CERES.The gray-dashed lines denote correlation coefficients of 0.43, exceeding the 95%confidence level.The lower panel is the same as the upper panel but for July thermodynamic variables.
5.Arctic sea ice and circulation anomalies in summer 2012 and 2020
The years 2012 and 2020 correspond to the lowest and second-lowest annual minimum ASIE (NSIDC) ever recorded.Figure 8a shows the annual cycle of ASIE in 2012 and 2020.The ASIE in 2020 begins to deviate from the climatology from early spring, which is likely due to the prolonged heatwave in Siberia that spring (Overland and Wang, 2021).The SIE in September 2020 is slightly higher than that in 2012, but the SIE in July 2020 is lower than that in 2012.The anomalous ASIC in summer 2012 relative to 1979–2018 is characterized by more than 20% of SIC reduction over the Beaufort Sea as well as along the Siberian coast (Fig.8b).The anomalous ASIC in summer 2020 is characterized by substantial sea ice loss only along the Siberian coast, and there are relatively small changes over the Beaufort Sea (Fig.8c).There is also significant sea ice loss over the Atlantic side of the central Arctic, reaching a record-low Arctic SIC in the Wandel Sea (Schweiger et al., 2021).The substantial sea ice loss over the Beaufort Sea contributes to the lowest Ala-SIE in 2012.On the other hand, the annual minimum Arctic sea ice extent reaches its second lowest in 2020,characterized by substantial sea ice loss only along the Siberian coast, particularly over the Laptev and East Siberian Seas, and the sea ice loss is greater than that in 2012.This contributes to the lowest Sib-SIE in summer 2020 (Fig.2d).Compared to 2012, there is more sea ice in 2020 over the Beaufort Sea but less sea ice over the Laptev and East Siberian Seas.This indicates that although similar low levels of the annual minimum ASIE were reached in both 2012 and 2020, the spatial distributions of the sea ice anomalies in the two years were different: 2012 shows a substantial sea ice loss over the Beaufort Sea; 2020 shows a substantial sea ice loss over the Siberian coast (Fig.8d).An examination of the two representative years can help elucidate the role of circulation patterns in shaping the different sea ice distributions.
Figure 9 (first row) shows the GPH500 anomalies in summer 2012 and 2020 and their difference.The year 2012 was associated with strongly elevated GPH (above 50 meters)over Greenland (Fig.9a), while the year 2020 was associated with elevated GPH over the Arctic Ocean (Fig.9b).Compared to 2012, the GPH500 anomaly in 2020 shows a much stronger GPH over the Siberian side of the Arctic Ocean(Fig.9c).The year 2012 corresponds to the second largest GL-high value over the summers 1979–2020 (Fig.1b).Therefore, the two years nicely demonstrate the association between GPH anomalies and the spatial pattern of sea ice anomalies, as shown in the section above (e.g., Figs.3b–c).For the surface air temperature (Fig.9, second row), an increase of more than 3 K is observed over the Beaufort Sea and northern Greenland and of more than 1 K over the western-and-central Siberian Arctic in summer 2012; greater warming was observed over the Siberian Arctic (more than 3 K) in summer 2020, while no temperature increase was observed in the Beaufort Sea.The anomaly patterns are again consistent with those in Figs.3e–f.

Fig.9.Upper panel: Anomalies of geopotential height at 500 hPa (shading; units: 25 meters) and wind vectors at 850 hPa in summer(a) 2012, (b) 2020, and (c) their difference.The anomalies are defined as deviations from the climatology 1979–2018.Lower panel:the same as the upper panel but for 2-meter air temperature anomalies.Stippling denotes that the circulation anomalies exceed 1 standard deviation of the climatology 1979–2018.
In 2012, the water vapor anomaly shows a small but significant increase over the central Arctic and the Beaufort Sea.Over Baffin Bay and Baffin Island, there is a substantial increase in water vapor which is due to the northward advection of water vapor from the Atlantic Ocean (Fig.10a); on the other hand, in 2020, a substantial increase in water vapor appears over the central Arctic and along the Siberian coast (Figs.10a–b).Compared to 2012, the increased water vapor over the Atlantic side of the Arctic Ocean and Siberian coast is stronger in 2020 (Fig.10c).Overall, the water vapor anomaly patterns in 2012 and 2020 are consistent with those shown in Figs.4b–c.In 2012, there is significantly decreased low cloud cover over the Beaufort Sea and Canadian Archipelago (Fig.10d).On the contrary, the year 2020 shows significantly increased low cloud cover over the Canadian Basin (including the Beaufort Sea) (Fig.10e).
The anomalous radiative flux anomalies for the two years are shown in Fig.11.In 2012, the DLR is significantly increased with more than 15 W m–2over Greenland and Baffin Island.Over the central Arctic and Kara Sea, there is an increase in DLR of about 5 W m–2, which corresponds well to the substantial sea ice loss over the Kara Sea (Figs.11a vs.8b).In 2020, significantly increased DLR (> 10 W m–2)appears over most of the Arctic regions, particularly over the Siberian coast and the central Arctic.This anomaly pattern bears large resemblance to the water vapor anomalies found previously (Figs.11b vs.10b).Therefore, compared to 2012,summer 2020 has stronger DLR along the Siberian coast and over the Atlantic side of the Arctic Ocean, which contributes to stronger sea ice loss over these regions (Figs.11c vs.8d).For the DSR in 2012, there is significantly decreased DSR over the Kara and East Siberian Seas but a substantial increase over the Beaufort Sea and Canadian Archipelago (Fig.11d).The decreased DSR over the Siberia side of Arctic Ocean is mainly due to the increased water vapor that obstructs the incoming solar radiation.Similar to 2012, the DSR anomaly in 2020 is greatly decreased over the Arctic regions (Fig.11e).

Fig.10.The same as Fig.9, but for total column water vapor (upper panel) and low cloud cover anomalies (lower panel).Stippling denotes that the circulation anomalies exceed 1 standard deviation of the climatology 1979–2018.
The CERES data are further applied to facilitate the comparison of the two extreme years.The difference between summer 2020 and 2012 in low cloud cover, DSR, DLR,CRF_SR, CRF_LR, CRF, and albedo are shown in Fig.12.Compared to summer 2012, summer 2020 shows a substantial increase in cloud cover over the Beaufort Sea and along the Siberian coast (Fig.12a).Consistent with the increased cloud cover, there is a substantial increase in DLR but a decrease in DSR over the Beaufort Sea and along the Siberian coast (Figs.12b and 12c).Over the Beaufort Sea,the cloud shortwave radiative effect outpaces the longwave radiation effect.Consequently, summer 2020 has stronger(weaker) albedo and more (less) sea ice along the Alaskan coast (Siberian coast) compared to summer 2012 (Figs.12g,h).These differences are largely consistent with those in ERA5 (e.g., Figs.12a vs.10f), confirming that the extreme sea ice declines in the two years are associated with dissimilar feedback processes.
Finally, it should be noted that there was a significant increase in surface wind speed over the Beaufort Sea during the summer of 2012, consistent with the intensified GL-high in 2012 (Figs.13a vs.6b).In contrast, a significant decrease in surface wind speed is observed over the Beaufort Sea during the summer of 2020 with a slight increase along the Siberian coast (Fig.13b).The increased easterly winds along the Alaskan coast in summer 2012 drive westward sea ice drift away from the coast (the climatological sea ice motion in summer is westward along the Alaskan coast), leaving extensive open water and promoting ice–albedo feedback.In summer 2020, there are northward wind anomalies and an increase in wind speed over the Laptev Sea (Fig.13b),driving northward sea ice motion (Fig.13h) and resulting in extensive sea ice loss over the Laptev Sea (Fig.8c).
6.Conclusions

Fig.11.Anomalous radiative fluxes in summer 2012, 2020, and their difference.Upper panel: downward longwave radiation: (a)2012, (b) 2020, and (c) their difference.(d), (e), and (f) are the same as the upper panel but for downward shortwave radiation.(g),(h), and (i) are the same as the upper panel but for net radiative flux.
Overlying the long-term declining trend of summer Arctic sea ice, there is strong regional and interannual variability that largely depends on the atmospheric circulation patterns.Previous studies (Ding et al., 2017; Wernli and Papritz,2018; Luo et al., 2021) indicate that the interannual variability of summer/September ASIE is associated with anticyclonic circulation anomalies over Greenland and the Arctic Ocean.In this study, we find that the Arctic Sea-Ice Extent (ASIE)–circulation linkages in summer are separable.Regional Arctic sea ice changes are associated with different circulations patterns and thus dissimilar feedback processes.

Fig.12.Difference (2020 minus 2012) between summer 2020 and summer 2012 in (a) LCC, (b) DSR, (c) DLR, (d) CRF_SR, (e)CRF_LR, (f) CRF, (g) NetRad, and (h) albedo.The units for each variable are given in the brackets.Stippling denotes that the anomalies exceed 1 standard deviation of the climatology over the period 2000–20.Note that the data over the polar cap (north of 80°N) are masked.
Firstly, the summer Greenland High (GL-high) is mostly correlated with the sea ice loss along the Alaskan coast with correlation coefficients above 0.50.We then divide the summer Arctic sea ice variability into two components: 1) Alaskan coast and 2) Siberian coast.On interannual time scales, the variability of SIE along the Alaskan coast(Ala-SIE) accounts for 21% of the variance in summer ASIE, and that along the Siberian coast (Sib-SIE) accounts for 65% of the variance in summer ASIE.The interannual variability of Ala-SIE is associated with the height anomalies over Greenland (GL-high), while the interannual variability of the Sib-SIE is associated with the height anomalies over the central Arctic (CA-high).This demonstrates the successful separation of the relationship between regional sea ice variability and circulation patterns.The associated mechanisms of the two regions are therefore treated separately.
Secondly, the decreased Ala-SIE is associated with significantly decreased cloud cover along the Alaskan coast and little changes in water vapor, which are prone to increase the DSR, promoting ice–albedo feedback.Meanwhile, the decreased Ala-SIE is also associated with increased easterly winds along the Alaskan coast, pushing sea ice away from the coast and amplifying ice–albedo feedback.In contrast,the decreased Sib-SIE is associated with a significant increase in water vapor and DLR along the Siberian coast with a concurrent decrease in DSR.Overall, the summer ASIE variability is largely explained by the variability of the Sib-SIE, which is closely related to a wetter and warmer atmosphere (Boisvert and Stroeve, 2015), consistent with the increase in moist static energy and DLR (Luo et al.,2021).
Thirdly, the years 2012 and 2020 correspond to the lowest and second lowest annual minima of ASIE, respectively.We find that summer 2012 is characterized by a significantly enhanced GL-high, with more sea ice loss along the Alaskan coast compared to summer 2020, while summer 2020 is characterized by an enhanced CA-high with more sea ice loss along the Siberian coast compared to summer 2012.In 2012, the lack of cloud cover along the Alaskan coast contributes to the increased incoming solar radiation,amplifying the ice–albedo feedback there; 2020 is opposite to that, with an increase in cloud cover along the Alaskan coast, resulting in a slight increase in sea ice there.The surface wind anomalies in 2020 are also opposite of 2012 with significantly decreased wind speed along the Alaskan coast, serving to preserve the sea ice in the Beaufort Sea.Along the Siberian coast, there is a substantial increase in water vapor in conjunction with the enhanced DLR in 2020, leading to substantial sea ice loss.Therefore, the two exemplary years further confirm that regional Arctic sea ice changes are governed by different circulation patterns and are therefore associated with dissimilar feedback processes.
Lastly, although our conclusions are primarily based on the results from ERA5, a comparison with CERES is also examined.For example, the decreased Ala-SIE is significantly related to the decrease in LCC both in CERES and ERA5, but only CERES shows that the Sib-SIE is significantly related to the increase in (low cloud cover) LCC.The discrepancy also comes from the DSR.Associated with the decline in Ala-SIE, DSR shows a significant increase in ERA5 in July, but not in CERES.We recognize that the uncertainty in cloud and radiation data over the Arctic remains an unsettled issue (Di Biagio et al., 2021).Future work will incorporate both in situ observations and modeling experiments to better characterize the spatial differences associated with atmospheric circulations.

Fig.13.Upper panel: 10-meter wind speed anomalies in summer (a) 2012 and (b) 2020 and (c) their difference (units: 0.2 m s–1).Middle panel: zonal component of sea ice motion anomalies in summer (d) 2012 and (e) 2020 and (f) their difference (units: 1 km d–1).Lower panel: meridional component of sea ice motion anomalies in summer (g) 2012 and (h) 2020 and (i) their difference (units:1 km d–1).Stippling denotes that the wind speed anomalies exceed 1 standard deviation of the climatology 1979–2018.
In recent decades, it has been recorded by satellite that the overall Arctic sea ice cover has decreased rapidly in combination with high regional and interannual variability.A clear separation of the two anticyclonic patterns and the associated feedback processes in governing local sea ice changes benefits the understanding of regional sea ice variability.Current earth system models prevalently underestimate GL-high variability (Hanna et al., 2018), which may be an important source of uncertainty in Arctic sea ice projections.Future research will endeavor to analyze the origin of these anticyclonic patterns and their representation in earth system models.
Acknowledgements.This work was supported by the National Key Research and Development Program of China (Grant Nos.2021YFC2802504 and 2019YFC1509104) and the Innovation Group Project of Southern Marine Science and Engineering Guangdong Laboratory (Zhuhai) (Grant No.311021008).
 Advances in Atmospheric Sciences2023年12期
- Advances in Atmospheric Sciences的其它文章
- Toward Quantifying the Increasing Accessibility of the Arctic Northeast Passage in the Past Four Decades※
- Arctic Sea Level Variability from Oceanic Reanalysis and Observations※
- The Arctic Sea Ice Thickness Change in CMIP6’s Historical Simulations※
- Simulations and Projections of Winter Sea Ice in the Barents Sea by CMIP6 Climate Models※
- Evaluation of the Arctic Sea-Ice Simulation on SODA3 Datasets※
- Influence of Surface Types on the Seasonality and Inter-Model Spread of Arctic Amplification in CMIP6※