
An Extreme Gale Event in East China under the Arctic Potential Vorticity Anomaly through the Northeast China Cold Vortex※
2023-12-26 09:11:58WeiTAOLinlinZHENGYingHAOandGaopingLIU
Advances in Atmospheric Sciences 2023年12期
Wei TAO, Linlin ZHENG, Ying HAO, and Gaoping LIU
Anhui Meteorology Observatory, Hefei 230031, China
ABSTRACT Arctic changes influence not only temperature and precipitation in the midlatitudes but also contribute to severe convection.This study investigates an extreme gale event that occurred on 30 April 2021 in East China and was forced by an Arctic potential vorticity (PV) anomaly intrusion.Temperature advection steered by storms contributed to the equatorward propagation of Arctic high PV, forming the Northeast China cold vortex (NCCV).At the upper levels, a PV southward intrusion guided the combination of the polar jet and the subtropical jet, providing strong vertical wind shear and downward momentum transportation to the event.The PV anomaly cooled the upper troposphere and the northern part of East China, whereas the lower levels over southern East China were dominated by local warm air, thus establishing strong instability and baroclinicity.In addition, the entrainment of Arctic dry air strengthened the surface pressure gradient by evaporation cooling.Capturing the above mechanism has the potential to improve convective weather forecasts under climate change.This study suggests that the more frequent NCCV-induced gale events in recent years are partly due to highlatitude waviness and storm activities, and this hypothesis needs to be investigated using more cases.
Key words: PV anomaly, Arctic storm, Northeast China cold vortex, convection, extreme gale
1.Introduction
In recent years, severe gales have happened frequently,destroying buildings and facilities, and threatening lives(Ma et al., 2019; Wei et al., 2022).In China, a gale refers to an event consisting of several convective gusts (sudden brief rushes of wind) with the maximum surface wind speed exceeding 17.2 m s-1.The large-scale circulation background of thunderstorm gales in East China could be categorized into three types: Type I, in front of an upper-level trough;Type II, on the edge of the Subtropical High; and Type III,around the Northeast China cold vortex (NCCV) (Ding et al., 1982; Meng et al., 2013; Sun et al., 2019; Wu et al.,2019).The gales induced by the NCCV have been anomalously active over the last four years.There were no more than four spring gale processes of Type III per year on average before 2016 (Yu et al., 2012; Sun et al., 2019; Wu et al.,2019), but this number increased to six in 2019 and eight in 2022.The severe gale in April 2021 broke the record for the maximum wind speed at some stations in Jiangsu Province.The NCCV is formed under the background of the weakening of the westerlies and the southward deepening of the upper cold trough (Palmén and Newton, 1969; Nieto et al., 2005).Hoskins et al.(1985) pointed out that the cold vortex corresponded to the high potential vorticity (PV) region near the tropopause.Because Arctic circulation could shape the westerlies, and Arctic upper air is the source of the high PV, how changes in the Arctic impact the NCCV and further force severe gale events in East China becomes an important question.
Exploration of the midlatitude response to Arctic changes has been a hot topic in recent decades.The four leading forcing factors are the jet stream, amplified waves, stratosphere-troposphere coupling, and storm tracks (Zhang et al.,2008; Cohen et al., 2012; Kim et al., 2017; Zhang et al.,2018).Arctic warming dilates the equator–pole geopotential height gradient, resulting in a decrease and equatorward shift of the midlatitude westerly winds accompanied by a strengthening of the subtropical jet stream (Barnes and Screen, 2015; Cheung et al., 2018).Consequently, cold air previously trapped near the pole is displaced to the midlatitudes (Cohen et al., 2020).As the polar jet stream slows down, the enhanced meridional amplitude of planetary waves increases the waviness of the jet stream, as well as the likelihood of high-latitude blocking and meridional transport of air mass associated with extremes.For example,strong ridges contributed to record heat waves in Europe and North America in recent summers (Francis and Vavrus,2012; Coumou et al., 2018).In addition to tropospheric processes, Arctic Amplification influences midlatitude circulation through stratospheric–tropospheric pathways (Kim et al., 2014; Barnes and Screen, 2015).Tropospheric waves propagate to the lower stratosphere in response to sea ice loss (Cohen et al., 2014) and lead to a weakening and a shifting of the polar vortex (Limpasuvan et al., 2004; Cohen et al.,2020; Chripko et al., 2021).In turn, when the stratospheric circulation anomaly moves downward, the troposphere demonstrates several responses, including a weakening of the jet streams, which forces a negative phase of the Northern Annular Mode, and an intensification of the Ural Ridge and East Asia Trough, which contributes to cold events (Jaiser et al., 2013; Zhang et al., 2018 ).Arctic warming has two impacts on storm activity.First, it reduces vertical stability,which tends to intensify storm systems over the Arctic(Basu et al., 2018).Second, it reduces baroclinicity between the Arctic and midlatitudes, and shifts storm tracks equatorward (Oudar et al., 2017; Cohen et al., 2020).Storms impact the growth and phasing of planetary waves by transporting moist and warm air mass to the Arctic.For example,the strong storm Frank led to a prolonged blocking period on the Eurasian northern coast (Kim et al., 2017).In warm seasons, with weaker storm tracks, moist air transformation is suppressed, and North America and western Europe experience less precipitation (Cheung et al., 2018; Coumou et al.,2018; Han et al., 2018).Arctic frontal zones and stratosphere vortexes are connected by storms, concurrent with a PV downward anomaly (Tao et al., 2017).The distribution of isentropic PV reflects the activity of polar air mass, which strongly indicates the thermodynamic characteristics of the environmental field (Tao and Zheng, 2012).However, the PV view has rarely been utilized to study the Arctic impact on midlatitude extreme weather.
Although many studies have investigated the link between Arctic changes and midlatitude extreme weather,most are focused on temperature and precipitation (Wu et al., 2013; Vihma, 2014; Coumou et al., 2018; Cohen et al.,2020).For example, some researchers have proposed the warm-Arctic–cold-midlatitude pattern in winter time(Cohen et al., 2012; Kug et al., 2015; Sorokina et al., 2016),whereas others have suggested that Arctic Amplification and the associated sea ice reduction have minor impacts on atmospheric wave amplification, which drives cold and drought events (Barnes, 2013; Screen et al., 2018; Blackport et al., 2019; Blackport and Screen, 2020; Chripko et al.,2021).However, extreme weather is not confined to temperature and precipitation.Severe convective weather, such as thunderstorms, gales, and hail also present high social risks.Although a few studies have explored the statistical correlations between Arctic sea ice and tornados in the US (Trapp and Hoogewind, 2018), the impacts of Arctic changes on Asian convective weather, especially severe gales, remain poorly understood and require further investigation.
The favorable conditions for gale development under the NCCV have been studied in many works (Zheng et al.,2014; Cai et al., 2019; Ma et al., 2019; Zhang et al., 2019;Yang et al., 2020).The thermal background requires strong hydrostatic instability, which is quantified by the temperature difference between 850 hPa and 500 hPa.There is a cold and dry air intrusion in the middle levels (400–700 hPa),whereas in the lower levels, the water content may be less compared to conditions during the gales in front of an upperlevel trough.In terms of dynamic conditions, there is strong vertical wind shear accompanied by a convergence line or dry line at the lower levels and a westerly jet at 400–500 hPa (Zheng et al., 2014; Cai et al., 2019; Ma et al.,2019; Zhang et al., 2019).Under such conditions, strong downdrafts, cold-pool density flow, and downward momentum transportation are the main drivers of strong gusts(Wang et al., 2013; Zheng et al., 2014; Zhang et al., 2018;Yang et al., 2020).
This study aims to explore the impacts of an Arctic PV anomaly intrusion on a severe gale event in East China.On 30 April 2021, the NCCV induced an extreme gale event in the Yangtze–Huaihe River region (YHR), the central part of East China (114°-122°E, 28.5°-35.5°E).This gale event broke the maximum wind record at two stations and caused 11 deaths.Through analyzing this case from the PV view and applying the maximum convective gusts estimation algorithm (Yeung et al., 2008), this work investigates the following questions: (1) How does the coupling of storms and the polar vortex contribute to the Arctic PV anomaly intrusion?(2) How does the NCCV with a PV anomaly drive the extreme gale?
2.Data and method
The 5th generation ECMWF atmospheric reanalysis of the global climate (ERA5) with a grid spacing of 0.25° at one-hour resolution was applied to analyze the general circulation of this case.There are 20 vertical pressure levels in increments of 50 hPa from 1000 hPa to 50 hPa.The wind speed was observed at one-hour resolution by 7568 regional surface meteorological stations in the YHR.We also applied a radar combined reflectivity mosaic at 6-minutes resolution and 3-km grid spacing to locate the convective system.Both the station observations and the radar combined reflectivity mosaic were provided by China Integrated Meteorological Information Service System (CIMISS).
The maximum convective gusts estimation algorithm was first proposed by Yeung et al.(2008).Pistotnik and Kann modified the algorithm and applied it to compute convective gusts in the operational analysis and nowcasting system Integrated Nowcasting through Comprehensive Analysis(INCA) at the Austrian national weather service (Haiden et al., 2011).According to the algorithm, the kinetic energy of the wind gust is estimated as follows:
where vsrefers to the surface maximum wind speed.The four terms on the right-hand side of Eq.(1) correspond to the downdraft convective available potential energy due to negative buoyancy, the gravitational potential energy gained through the precipitation loading effect, the vertical transport of momentum, and the background kinetic energy due to the pressure gradient force near the surface, respectively.In general, the first two terms are linked to the strong downdrafts,and Umandv2backare related to the downward momentum transportation and cold-pool density flow introduced in section 1.The calculation of the four terms is shown in the Supplemental Materials.
3.Overview of the extreme gale event
The extreme gale event was observed in the evening of 30 April 2021.The evolution of the gale event is presented in Fig.1.The maximum wind speed was observed by surface stations, and the locations of the convective systems were determined by the radar combined reflectivity mosaic.Around 1600 local standard time (LST, LST=UTC+8), con-vective cells were triggered, and they developed rapidly at the boundary of Shandong and Jiangsu provinces.The associated gust was around scale 7–9 (13.9–20.8 m s-1).Around 1800 LST, the convective cells developed into supercells around 33°N.A strong wind of 36.2 m s-1was measured at Huai’an station, breaking the historical extreme value record at that station.Then, the convective cells moved southward guided by the synoptic-scale steering flow, and their outflow generated a gust front.Around 2000 LST, the gust front was located in southern Jiangsu.The rear of the gust front caused a large area of strong wind above scale 9.At 2100 LST, the original strong echo band tended to decay,but as its eastern part moved to the ocean, an extreme wind speed (47.9 m s-1) was produced on the southeast coast of Jiangsu.

Fig.1.Maximum wind speed during the extreme gale event.The blue lines represent the location of the convective system at the specific local time, the cyan line is the coastline, and the black stars are the stations that broke their previous wind speed record.
During this gale event, 1325 stations in 630 townships experienced extreme wind above scale 8 (17.2 m s-1).Among them, 233 stations in 153 townships suffered extreme gusts of more than scale 10 (24.5 m s-1).The maximum wind speed was 47.9 m s-1(scale 15).More than 10 000 people were impacted by the severe convective weather, resulting in 11 deaths, 66 injuries, and more than 3000 emergency relocations.
4.Arctic impact on the extreme gale event
4.1.Arctic circulation background
The Arctic circulation background in late April 2021 is shown in Fig.2.The coupling of the stratosphere polar vortex and troposphere cyclone activity played a vital role in Arctic PV intrusion and forming the NCCV, which was believed to be the driving system of the extreme gale event in East China.
This study focuses on two cyclones near the Eurasian northern coast: one located on the coast of the Barents Sea around 70°N, 60°E (hereinafter referred to as the west cyclone), and the other extended from 80°N to 60°N along 120°E (hereinafter referred to as the east cyclone).Benefitting from the meridional orientation of the east cyclone, strong cold advection occurred just behind the cyclone, and warm air was transported to the Arctic on the east side of the cyclone.Warm advection was also identified ahead of the west cyclone, although it was not as strong as that of the east cyclone.According to the barometric height formula, a warm anomaly ahead of the two cyclones indicated the ridges’ development on 500 hPa.Meanwhile, the cold advection deepened down the trough near 120°E.The stratosphere polar vortex exhibited a dipole structure, and the two storms coupled with the East hemisphere center of the polar vortex and the associated troughs locating along 30°E,100°E, and 150°E.The temperature distribution in the stratosphere was opposite to that in the troposphere, with warm cores in the polar vortex.Therefore, their temperature advection steered by the storms was opposite.According to the potential tendency equation, if warm advection decreases with height, the geopotential height increases, and vice versa.Therefore, the trough near 150°E decayed during 26–28 April, whereas the trough near 100°E extended toward the southeast.

Fig.2.Arctic stratosphere and troposphere circulation during the extreme gale in April 2021.(a)–(c) stratosphere circulation:100-hPa temperature (color bar), 100-hPa geopotential height (red contours), and sea level pressure below 1008 hPa (black contours); (d)–(f) troposphere circulation: 500–850-hPa mean temperature (color bar), 500-hPa geopotential height, and sea level pressure below 1008 hPa (black contours).
On 28 April, the west cyclone expanded southeastward due to positive vorticity advection ahead of the upper-level trough near 30°E.The cyclone, in turn, strengthened the warm advection over 80°–100°E, 50°–80°N, which enhanced the ridge in this region.Owing to the negative vorticity of the ridge, the northern part of the east cyclone decayed, and its southern part became an isolated low, presenting a cut-off cold vortex from the surface to 500 hPa,but it continued to engage in stratosphere circulation.The lower stratosphere part of the vortex split from the polar vortex on 30 April.From mid-troposphere to low-stratosphere,a vortex tube lingered around 120°E, 50°N, with a central geopotential height of 5185 m on 500 hPa and 15 653 m on 100 hPa.The vortex had a cold core in the troposphere and a warm core in the stratosphere.Such circulation and temperature structures indicated the NCCV featuring a PV anomaly(defined as the localized PV maximum).
The mechanism of the PV anomaly intrusion southward to form the NCCV could also be expressed by the temporal and latitudinal evolution of temperature advection (Fig.3).From 26 April to 28 April, cold advection propagated from 70°N to 50°N in the troposphere, while warm advection spread in the same direction in the stratosphere.Such an upper warm and lower cold pattern indicated that the PV anomaly was intruding into Northeast China.Since 28 April,the area around 70°N was occupied by warm advection in the troposphere and cold advection in the stratosphere.This temperature advection developed ridges over 70°–80°N,100°–120°E, and cut off the trough from the polar vortex.Therefore, the NCCV associated with the Arctic PV anomaly matured.
4.2.PV anomaly evolution
The PV evolution was presented by its horizontal distribution on the tropopause and its vertical cross section along 120°E (Fig.4).As the vertical gradient of potential temperature increased intensively above 300 hPa (Figs.4d–f),300 hPa was treated as the tropopause.

Fig.3.Temporal evolution of mean temperature advection along 120°E in the troposphere (a, 850–500 hPa) and stratosphere (b, 300–50 hPa).The two digits on the horizontal axis indicate the day in April.
On 26 April, in the Eastern Hemisphere, high PV(higher than 4 PVU (Potential Vorticity Unit)) was present in the polar vortex and associated three troughs.The PV was 5 PVU in the middle trough (Fig.4a).As shown in the cross section, along 120°E, 300-hPa high PV was restricted to the Arctic region.To the south of 60°N, the dynamic tropopause was above 200 hPa, and the isentropic surface in the troposphere slid down gently (Fig.4b).Beneath the stratosphere high PV, positive vorticity extended from 300 hPa to near the surface.Although the maximum vorticity reached 13 × 10-5s-1, its diameter was less than 100 km.The upperlevel jets exhibited two centers located at 60°N and 30°N, representing polar and subtropical jets, respectively.
On 28 April, the trough propagated towards Northeast China.The development of the ridge near 100°E tended to cut off this trough from the polar vortex, leaving a narrow tunnel of high PV around 7 PVU (Fig.4b).A remarkable positive PV anomaly occurred along the vertical cross section around 50°N (Fig.4e), where the high PV dropped down to 350 hPa.This illustrated the southward and downward intrusion of the Arctic stratosphere high PV into the midlatitude troposphere.Accompanying this anomalous PV intrusion, a strong vertical potential temperature gradient also appeared at the center of the PV anomaly, resulting in a potential temperature trough from 100 hPa to 300 hPa and a ridge below 400 hPa (Fig.4e).At the same time, cyclonic winds occurred surrounding the PV anomaly and along the tropopause with maximum wind speeds located at 200–400 hPa.The original polar jet disappeared, and the subtropical jet intensified to 50 m s-1.It was also considered to be the combination of the polar jet and subtropical jet.There were three high positive vorticity regions located over 75°N,62°N, and 50°N.The middle one was as strong as 14 ×10-5s-1, but it mainly occurred above 600 hPa.The other two vorticity tubes almost dominated the whole troposphere with an intensity of 8 × 10⁻⁵s-1.The north one was the original polar vortex, the south one indicated the newly established NCCV, and the middle one represented the tunnel that connected the polar vortex and NCCV.
The lower stratospheric part of the middle trough split from the polar vortex on 30 April.The closed vortex tube extended from 100 hPa to near the surface in Northeast China, with its central PV of 10 PVU on 300 hPa (Fig.4c).From 28 to 30 April, the stratosphere vortex continued moving downward.The high PV in the vortex center intruded down from 350 hPa to 400 hPa, and the south edge of the high PV region extended from 32°N to 29°N.In the northern part of the PV anomaly, the troposphere cold core stretched upwards to 400 hPa.The south side of this cold ridge was deformed by the warm trough originating from the stratosphere.The confrontation of troposphere and stratosphere air confirmed that the tropopause intruded down to 400 hPa.On the south side of the PV anomaly, the isentropic surface subsided drastically.For example, the surface of 300 K fell from 400 hPa to 900 hPa as the cold Arctic air confronted the warm midlatitude air over 45°-30°N.Such structure indicated large baroclinicity and vertical motion, which favored strong convection (Fig.4f).Within the PV anomaly, the positive vorticity achieved 14 × 10-5s-1on 400 hPa and stretched two branches down to the lower troposphere.The south branch matched well with the baroclinic zone and drove convection.As the vortex expanded, the westerly jet propagated to 30°N and contributed to the downward momentum transportation during the gale event (Fig.4i).
4.3.The impact of the PV anomaly intrusion on the environment of the YHR gale

Fig.4.The evolution of PV structure during 26–30 April.(a)–(c) 300-hPa PV (color bar) and geopotential height (contours);(d)–(f) vertical cross section of PV (color bar) and potential temperature (contours) along 120°E; (g)–(i) vertical cross section of relative vorticity (color bar) and zonal wind (contours) along 120°E.
The impact of the PV anomaly intrusion and the associated NCCV on the extreme gale in the YHR is investigated through the change of the local thermal, humidity, and dynamic conditions.To investigate the interaction between the Arctic air mass and local environment, some of the analyses are conducted on the 300-K isentropic surface, which was located near the frontal zone and was close to the tropopause (Fig.4).
On the 300-K isentropic surface, a band of dense isobars and a strong northwest jet were situated from central Mongolia (50°N, 100°E) to the YHR (30°N, 120°E) on 30 April.It was the frontal zone of the air mass between the Arctic and midlatitudes.The pressure of the isentropic surface on the northeast side of the jet stream was lower than 400 hPa, indicating the tropopause of the Arctic air mass.The air pressure was above 800 hPa on the west and south sides of the jet, indicating the region governed by the midlatitude air mass(Fig.5a).
According to previous research, the temperature difference between 500 hPa and 850 hPa serves as a metric of the convective environment instability.As shown in Figs.5b–c,from 26 to 28 April, 500-hPa cold air spread from 45°N to 30°N, and after that, the temperature was around 256 K over 30°–35°N.However, the cold air within the vortex did not touch the 850-hPa level to the south of 35°N.During 29–30 April, the temperature on 850 hPa rose from 280 K to 289 K.On 30 April, the temperature difference between 500 hPa and 850 hPa was larger than 30 K over 30°–35°N,which exceeded the mean hydrostatic instability of extreme gales in China (Zheng et al., 2014; Ma et al., 2019).
The PV anomaly intrusion not only transported cold air to the YHR but also contributed to local warming through dynamic effects.According to thermodynamics [Eq.(2)],the temperature changes were attributed to four factors: horizontal advection(-V·?T), diabatic effects (Q), vertical advection (- ω?T/?p), and adiabatic processes due to pressure changes ( dp/(ρCPdt)).In this case, the diabatic effects were small (< 10-5K s-1).

Fig.5.The thermal impact of the PV anomaly intrusion on the extreme gale event.(a) pressure (color bar) and wind (vectors)on the 300-K isentropic level at 1400 LST on 30 April; (b) temporal–latitudinal evolution of 500-hPa temperature along 120°E [purple line in (a)]; (c) temporal–latitudinal evolution of 850-hPa temperature along 120°E [purple line in (a)].The four digits on the horizontal axis indicate month and day.
The temperature change rate due to horizontal advection and the integrated effects of vertical advection and adiabatic processes during the above three periods are quantified in Figs.6g–l.Their heating balances are shown in Fig.6m.The vertical cross section was established by the meridional mean of wind and heating rate between 30°–35°N (purple rectangle in Figs.6d–f).On 28 April, the cyclonic circulation around the PV anomaly governed the upper level of the region to the north of 30°N, with a temperature trough around 115°E (Fig.6a).In the upper troposphere, the northwest jet induced cold advection around 27 × 10-5K s-1(Figs.6d, g).On 29 April, with the downward and southward intrusion of high PV (Fig.4), the trough extending from the NCCV shifted southeast (Figs.6b, e).The horizontal temperature advection decayed on 400–600 hPa as the wind direction was parallel to the temperature trough (Figs.6h, e).Meanwhile, the downward-motion-induced adiabatic heating became pronounced (Fig.6k).In the troposphere, the outer boundary of the jet around the PV anomaly was located over 30°–35°N, 110°–115°E, and the anticyclonic wind shear motivated downward motion (Fig.6e).The downward motion resulted in cold vertical advection and adiabatic heating, and the net heating rate exceeded 10-4K s-1.With the circulation adjustment, the 400–600-hPa horizontal cold advection intensified again on 30 April.Meanwhile, at the lower levels, warm air was transported to 115°–120°E by the west and south winds (Fig.6i).Such an upper-cold and lower-warm structure strengthened the convection.As a result, the upward motion was motivated, resulting in adiabatic cooling (Fig.6l).
The vortex split from the Arctic also brought dry air to the convection in East China.On the 300-K isentropic layer,the specific humidity was lower than 4 g kg-1in the region dominated by the Arctic air mass, whereas the local humidity was approximately 10 g kg-1(Fig.7a).The northwest jet continuously transported dry air to the YHR.Taking 600 hPa for example, the dry region extended from 40°N to 25°N during 27–29 April, and relative humidity decreased from 80% to 30% (Fig.7b).Because there was little water vapor in the upper air, with the PV downward intrusion, the 1 g kg-1isohygromen (contour with the equivalent special humidity) dropped from 400 hPa to 700 hPa (Fig.7c).When convection was motivated in the afternoon, hydrometeors evaporated in the dry conditions, and the associated cooling effects generated a mesoscale high and forced isallobaric wind.
The favorable dynamic conditions for the severe gale included low-level convergence, a middle-upper level jet,and vertical wind shear (Fig.8).Cyclonic convergence occurred in the baroclinic zone between the cold dry Arctic air mass and the warm wet local air on 925 hPa (Fig.8a).On 400 hPa, two belts of positive vorticity swirled from the NCCV (Fig.8b), one of which approaching the YHR with an intensity of 8 × 10⁻⁵s-1.The jet surrounding the vortex had two effects.First, it pushed positive vorticity advection to the YHR, which intensified convection by motivating upward motion.Second, it contributed to vertical wind shear and downward momentum transportation.The temporal evolution of the vertical wind shear in the 33°-35°N, 119°-121°E region (purple rectangle in Fig.8a) is presented in Fig.8c.The vertical wind shear here was defined as the vector difference of the wind vectors between the specific pressure level and 10 m above the ground.The maximum wind shear located around 200 hPa and the strong shear (30 m s-1)intruded downward from 300 hPa to 800 hPa during 26-30 April.Before 28 April, the jet was confined above 400 hPa,which was too high to drive low-level convection.After 28 April, the PV anomaly steered cyclonic flow from the stratosphere to 800 hPa.The surrounding northwest wind reached 20 m s-1on 700 hPa.As a result, the 0–3-km vertical wind shear exceeded 28 m s-1, and the 0–6-km vertical wind shear achieved 35 m s-1.Both of these parameters exceeded the thresholds of extreme gale proposed by Ma et al.(2019).

Fig.6.The temperature change mechanism.(a)–(c) 200-hPa temperature and wind at 1400 LST on 28–30 April; (d)–(f)the same as (a)–(c) but for 500 hPa; (g)–(i) the zonal cross section of the mean horizontal temperature advection and wind between 30°–35°E [purple rectangle in (d)–(f)]; (j)–(l) the same as (g)–(l) but for the net heating rate of vertical motion induced temperature advection and adiabatic heating; (m) the temporal evolution of the heating balance at the key locations: 850 hPa, 33°N, 110°E; 850 hPa, 33°N, 120°E; and 500 hPa, 33°N, 120°E.

Fig.7.The humidity impact of the PV anomaly intrusion on the extreme gale event.(a) Specific humidity (color bar) and wind (vectors) on the 300-K isentropic level at 1400 LST 30 April; (b) temporal–latitudinal evolution of 600-hPa relative humidity along 120°E [purple line in (a)]; (c) the temporal evolution of mean specific humidity in zone 33°–35°N, 119°–121°E ; [purple rectangle in (a)].The four digits on the horizontal axis indicate month and day.

Fig.8.The dynamic impact of the PV anomaly intrusion on the extreme gale event at 1400 LST on 30 April 2021.(a) the virtual potential temperature (color bar) and wind (vector) on 925 hPa; (b) the vorticity (color bar) and wind (vector) on 400 hPa.(c) the temporal evolution of the vertical wind shear from the surface (color bar) and horizontal wind (barb) in zone 33°–35°N, 119°–121°E [purple rectangle in (a)].The four digits on the horizontal axis indicate month and day.
On the whole, the PV anomaly intrusion and associated NCCV directly impacted the extreme gale through the jet stream, which provided positive vorticity, vertical wind shear, and high momentum.Meanwhile, favored by local environmental conditions, it enhanced instability, baroclinicity,and isallobaric wind.The primal processes included temperature advection, adiabatic heating of the downdraft, and evaporation cooling induced by dry air entrainment.
4.4.Estimation of the maximum gust
The above environmental conditions forced extreme gusts mainly through three processes: the downdraft generated by negative buoyancy, downward momentum transportation, and surface pressure gradient.
The downdraft generated by negative buoyancy was quantified by DCAPE (downdraft convective available potential energy) [Eq.(1)].There were two belts of high DCAPE (Fig.9a).One was the frontal region to the south of the NCCV, which presented a tilt structure, with Arctic cold dry air on the upper level and warm wet local air on the lower level.As the cold dry air was heavier, such a structure caused substantial negative buoyancy, which drove the downdraft.The other high DCAPE belt was along 25°N, which was mainly attributed to the dry belt on the right-hand side of the subtropical jet.DCAPE in the YHR was around 1100 J s-1, achieving the gale threshold in East China.Theoretically, the resultant downdraft could achievebut Yeung et al.(2008) pointed out that the kinetic energy theorem tended to overestimate the gust generated by DCAPE.Following the operational gust estimation work in INCA,this study parameterizes that 50% of the DCAPE transforms into the near-surface gust (approximately 23 m s-1).The other term related to the downdraft in Eq.(1) is the precipitation load.However, the environment in this case was too dry to produce sufficient vertically integrated rain water(5 mm).Therefore, Uloadwas neglected here.
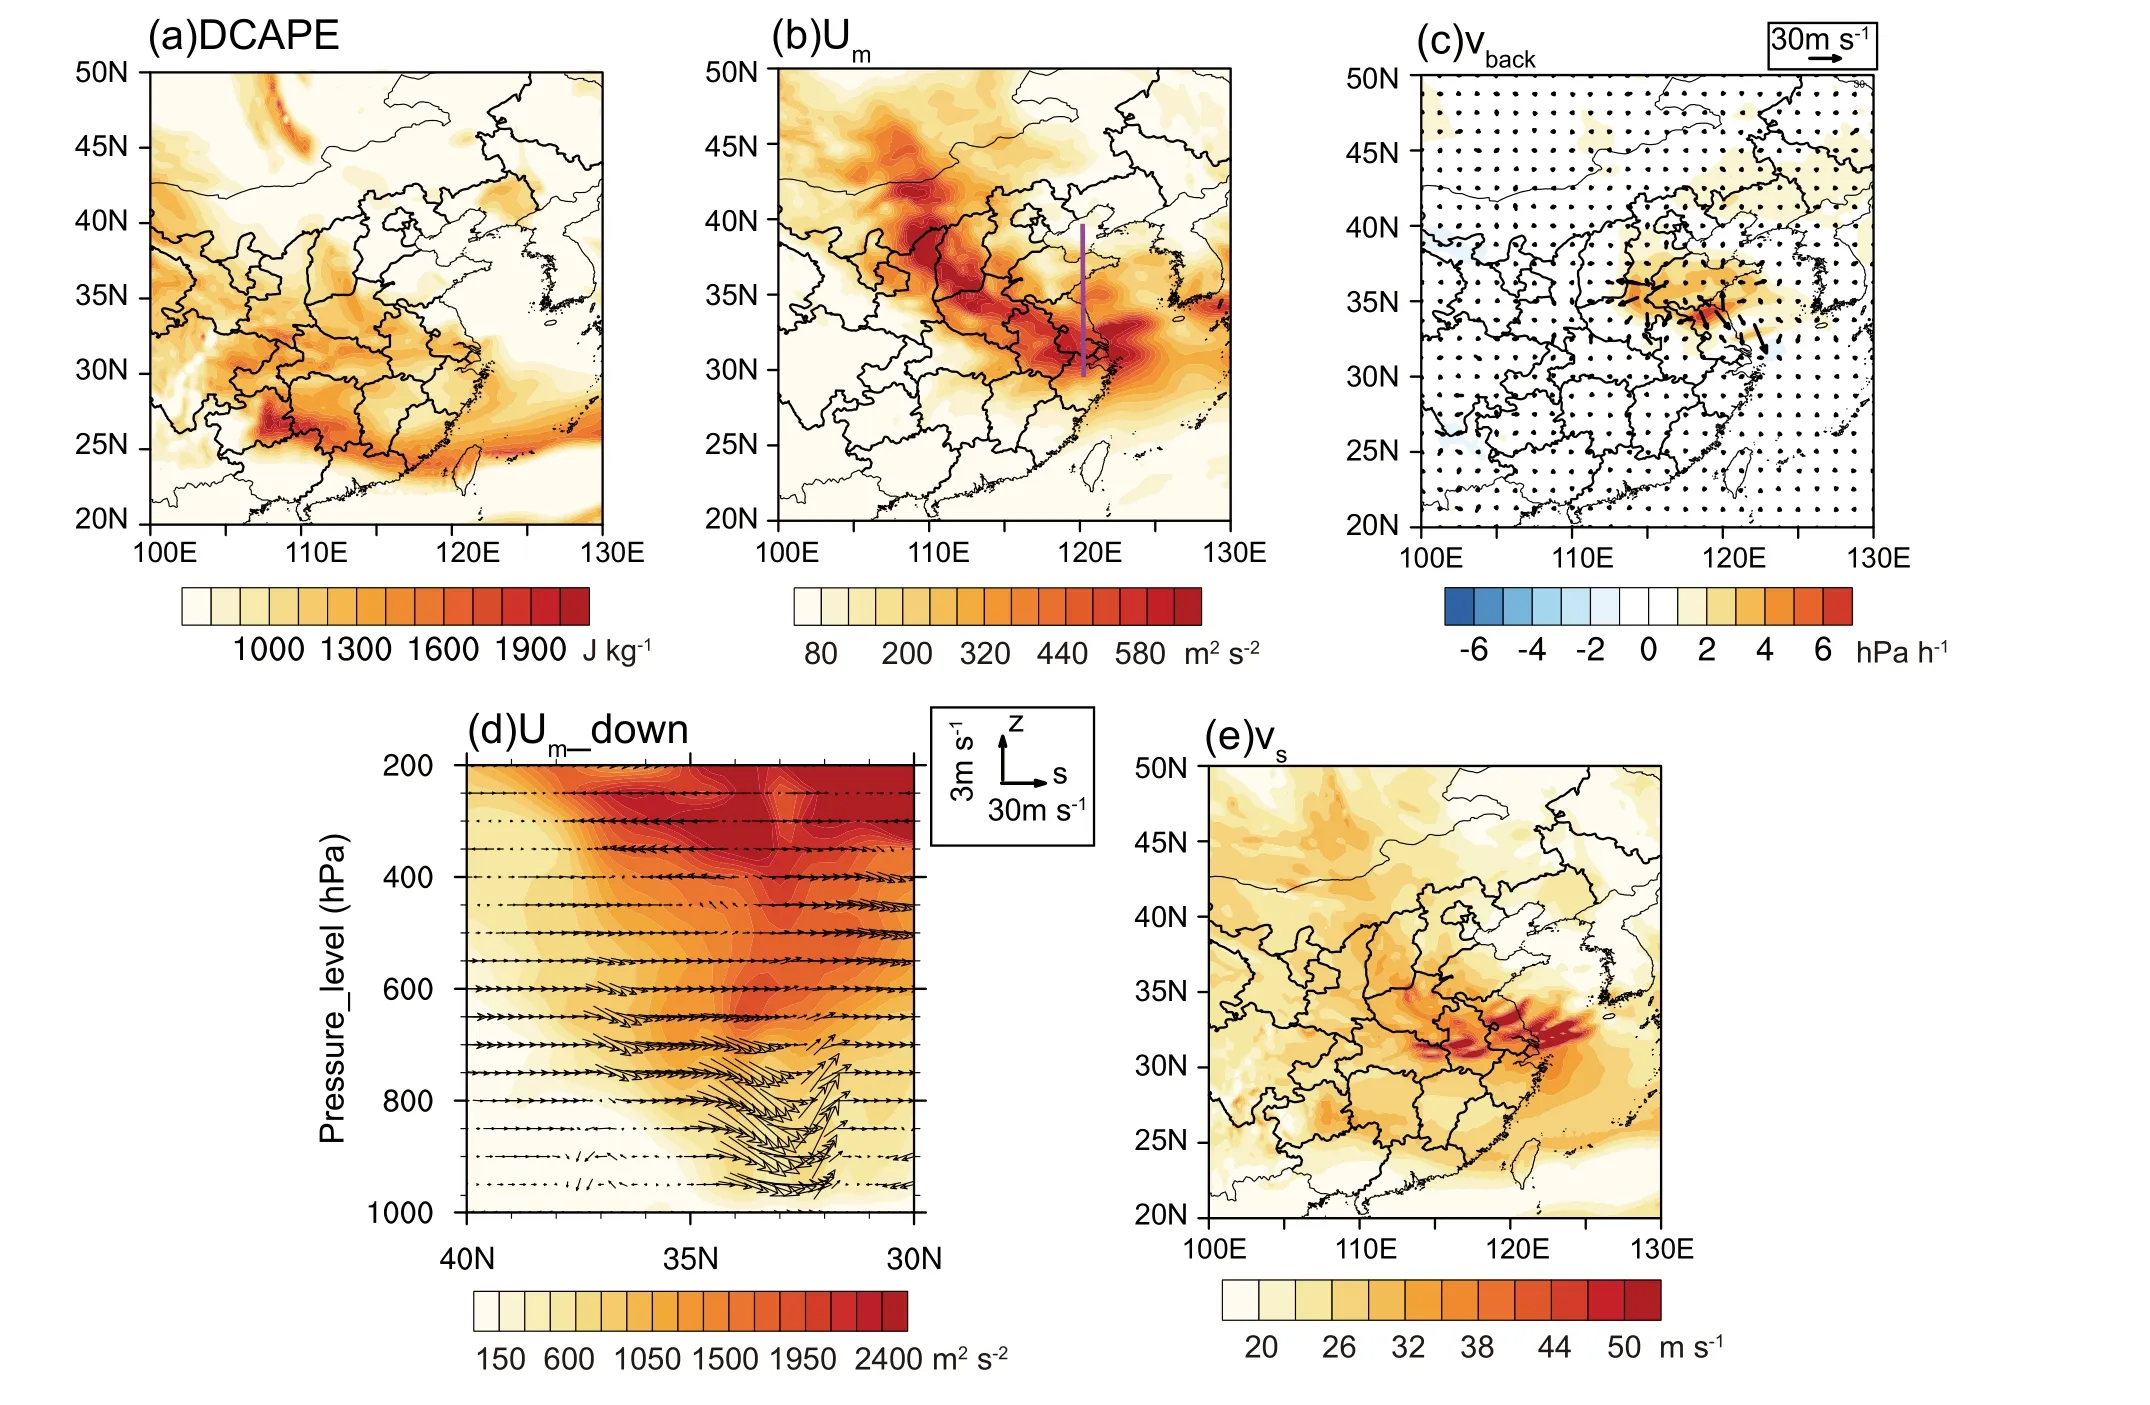
Fig.9.Factors contributing to the maximum gust at 2000 LST on 30 April 2021.(a) DCAPE; (b) downward kinetic energy transportation; (c) hourly surface pressure change rate (color bar) and isallobaric wind (vector); (d) kinetic energy (color bar),vertical motion and meridional wind along 120°E; (e) estimation of the maximum gust.
The second contributor to the extreme gust was the downward momentum transportation from the upper levels.Momentum was estimated by the kinetic energy in Fig.9d.The downward motion started on 400 hPa.Following the downdraft, upper-level high momentum intruded down in the afternoon of 30 April.The high momentum occurred along the south boundary of the PV anomaly, in consensus with the upper-level jet (Fig.9b).The maximum Umwas around 500 m2s-2, corresponding to a gust of 22.3 m s-1.
Besides upper-level forcing, the surface pressure gradient also intensified the gust.The surface pressure within 33°-37°N, 115°-123°E increased by 3–6 hPa during 1900–2000 LST.The resultant isallobaric wind (vback) intensified drastically from 8 m s-1to 18 m s-1(Fig.9c).The high pressure was mainly attributed to the evaporation cooling induced by dry air entertainment at 500–700 hPa.Based on the above factors, the maximum gusts were estimated according to Eq.(1).The maximum wind speed (vs) reached 50 m s-1in the YHR, which agreed with the observed maximum wind of 47.9 m s-1(Fig.9e).It is worth noticing that vswas the ceiling of the surface wind speed.Inhibited by turbulent mixing, friction, and the energy transformation ratio,the observed wind should be less than vs.In addition, the convection initiation conditions were also important.The vswas high over 30°N, 116°-118°E, but in the absence of lowlevel convergence, convection could not be excited, and thus an extreme gust did not occur.
5.Summary and discussions
This study investigated the impacts of an Arctic PV anomaly intrusion on an extreme gale event in East China.The southeastward intrusion of the Arctic PV anomaly was mainly attributed to the temperature advection steered by the coupling of the polar vortex and pan-Arctic storms.The PV anomaly and associated NCCV directly strengthened the gale in the YHR by positive vorticity advection, wind shear,and downward momentum transportation.In addition,favored by the local environmental conditions, the outer boundary of the PV anomaly enhanced instability, baroclinicity, and the isallobaric wind.The whole process is summarized as follows (Fig.10):
Incipient stage: The polar vortex and associated PV anomaly dominated the stratosphere and upper troposphere of the Eurasian northern coast and stretched out three troughs.The polar jet surrounded the PV anomaly.Meanwhile, the stratosphere subtropical jet flew along 30°N.Two storms lingered over Russia, with the associated temperature advection deforming the polar vortex and PV distribution.The east storm expanded from 45°N to 70°N and steered cyclonic circulation from the surface to the upper levels.The north wind induced cold advection in the troposphere and warm advection in the stratosphere, which caused the southward extension of the middle trough and associated PV anomaly.On the east side of the storm, the south wind transported tropospheric (stratospheric) warm (cold) air to the Arctic and thus amplified the ridge.As the ridge intruded into the Arctic Ocean, the trough was prone to cut off from the polar vortex.
Development Stage: The middle trough split from the polar vortex and exhibited a closed circulation, known as the Northeast China cold vortex (NCCV) in the upper troposphere, but its stratospheric part was still connected with the polar vortex.The NCCV presented a northwest tilted structure, with the PV anomaly center at 50°N, 120°E in the upper troposphere and 60°N, 110°E in the stratosphere.As a result, the northwest jet steered by the vortex reached 35°N in the troposphere, whereas the stratosphere over this region was dominated by the subtropical jet.As the NCCV intruded southward, the northwest wind transported Arctic air to North China.The Arctic air was cold and dry in the troposphere and warm in the stratosphere.Meanwhile, the midlatitude air flew to the Arctic on the east side of the vortex and intensified the upper-level ridge.In response, the east storm moved to Northeast China.The west storm expanded,and its temperature advection cut off the NCCV from the western side.
Mature Stage: The lower stratospheric part of the NCCV was also isolated from the polar circulation.As the vortex propagated southeastward, the strong northwest jet behind the vortex dominated the area to the north of 30°N in East China and switched to a westerly jet at the bottom of the vortex.In the stratosphere, this jet confronted the subtropical jet at 35°N, 110°E, and the convergence generated downward motion.In the troposphere, the anticyclonic wind shear on the southwest side of the jet also favored a downdraft, where adiabatic heating occurred over 110°-115°N,30°-35°E.In the lower levels, this warm air was transported to the YHR by southwest wind, whereas the upper levels were still affected by cold advection and therefore generated strong instability.The baroclinic zone in the YHR was established by the cold advection to the north of 35°N, as well as the above heating processes on the southwest boundary of the PV anomaly.Once the convection was generated, the positive vorticity advection at the bottom of the vortex, the wind shear between the upper-level jet, and the cyclonic convergence in the lower-level baroclinic zone all enhanced the system.The extreme gust was attributed to three factors: the downward momentum transportation from the jet, the negative buoyancy induced by instability, and the surface pressure gradient caused by the evaporation cooling associated with dry Arctic air entrainment.
In summary, the pan-Arctic storms led to the Arctic PV anomaly intrusion by shaping the jet streams and steering temperature advection.Equipped with the Arctic PV anomaly,the NCCV impacted the YHR gale event in four ways.First,its mid-level cold core cooperated with outer and lowerlevel warm conditions to generate the baroclinic zone and strong instability.Specifically, the upper tropospheric cold and dry air indicated large negative buoyancy, which induced a downdraft.Second, the jet around the PV anomaly contributed to the downward momentum transportation and vertical wind shear.Third, the positive vorticity advection further enhanced the convection.Lastly, evaporation in the dry environment established the near surface mesoscale high, and the resulting pressure gradient drove the extreme gust.
The above processes coincided with the integrated effects of the Arctic change factors described in section 1,including the southward shift of the jet stream, the amplified waves, and the interaction between stratosphere and troposphere via storm activity.Under normal circumstances,severe gales occur under strong southwest jet streams originating from the South China Sea, which provides warm and moist air.This study provided an idea for forecasting NCCV-induced severe gales from an Arctic perspective.Split from the Arctic, the NCCV featured a large meridional amplitude, cold upper troposphere and warm boundary layer, strong instability, and the combination of a polar jet and subtropical jet.The anticyclonic wind shear on the boundary of the jet intensified the local heating.This process made up the warm conditions to some extent, but the Arctic air was lacking in water vapor; thus, precipitation was limited.
This research investigated a case where an Arctic PV anomaly intruded southward and generated severe convection.Such an event has happened 1–3 times annually in the last four years.With the enhanced waviness and storm activity, these events may occur frequently.However, this hypothesis should be investigated via composite analysis among more cases.We also need an advanced numerical model to precisely simulate extreme convection.
Acknowledgements.We thank Georg PISTOTNIK and Alexandar KANN for their help with maximum gust estimation.This work was supported by the China National Science Foundation(Grant No.41705029), Anhui Joint Foundation (Grant No.2208085UQ11), China Meteorological Administration special grants on innovation and development (Grant No.CXFZ2023J017)and China Meteorological Administration special grants on decision-making meteorological service (Grant No.JCZX2022005).Gaoping Liu also received support from the innovation team at Anhui Meteorological Bureau.Computational resources were provided by the Hefei Advanced Computing center.
 Advances in Atmospheric Sciences2023年12期
- Advances in Atmospheric Sciences的其它文章
- Toward Quantifying the Increasing Accessibility of the Arctic Northeast Passage in the Past Four Decades※
- Arctic Sea Level Variability from Oceanic Reanalysis and Observations※
- Separation of Atmospheric Circulation Patterns Governing Regional Variability of Arctic Sea Ice in Summer※
- The Arctic Sea Ice Thickness Change in CMIP6’s Historical Simulations※
- Simulations and Projections of Winter Sea Ice in the Barents Sea by CMIP6 Climate Models※
- Evaluation of the Arctic Sea-Ice Simulation on SODA3 Datasets※