
Molecular Dynamics Simulation of Hydrate Decomposition Under Action of Alcohol Inhibitors
2023-12-10 12:19:24ShuyanWangXuqingZhaBaoliShaoJingWangXiChenandJiaweiFan
Shuyan Wang, Xuqing Zha, Baoli Shao, Jing Wang, Xi Chen and Jiawei Fan
(School of Petroleum Engineering, Northeast Petroleum University, Daqing 163318,Heilongjiang,China)
Abstract: The molecular dynamics method is used to investigate decomposition of methane hydrate at different temperatures, pressures and concentrations of inhibitor. By analyzing the parameters of system conformation, mean square displacement and radial distribution function, the decomposition of hydrate in the presence of alcohol inhibitors ethylene glycol and glycerol is explored. The results show that the hydroxyl groups in alcohol molecules can destroy the cage structure of hydrate, and form hydrogen bonds with nearby water molecules to effectively prevent the reformation of hydrate. Therefore, ethylene glycol and glycerol serve as inhibitors of methane hydrate, furthermore, in terms of inhibition effect, glycerol is better than ethylene glycol by comparing rate of hydrate decomposition.
Keywords: methane hydrate; alcohol inhibitors; molecular dynamics simulation; decompose
0 Introduction
Natural gas hydrate, also known as combustible ice, is a special crystalline solid compound composed of water molecules and gas molecules under a low temperature and a high pressure[1]. It is considered to be one of the new energy sources in the 21st century. In addition, the existence of natural gas hydrate will seriously threaten the safe production of petroleum industry, it is necessary to study the decomposition of natural gas hydrate, and the development process of natural gas hydrate resources includes the decomposition process of solid hydrate. At present, the conventional hydrate decomposition methods mainly include heat injection method, depressurization method and chemical reagent injection method. However, at present, there is no great breakthrough in the development of natural gas hydrate due to the lack of in-depth research on the micro mechanism of hydrate formation and decomposition[2].
The main component of natural gas hydrate is methane[3], therefore, natural gas hydrate with more than 99% methane molecular is usually called methane hydrate. Generally, there are three main types of hydrate structures: sI, sII, and sH, depending on the size and properties of gas molecules called guest molecules. Among them, water molecules called host molecules form crystal cavities through hydrogen bond interaction, and guest molecules are filled in the crystal cavities, in which van der Waals force is dominant role between host and guest molecules[4]. The structural diagrams of these three crystal forms are shown in Fig.1.
Chemical reagents can be classified into thermodynamic inhibitor, kinetic inhibitor and anti-polymerization agent. In terms of their application, thermodynamic inhibitors cost too much due to large usage[5], while kinetic inhibitors with a low concentration meet demands under the same conditions[6]. However, some studies have shown that kinetic inhibitors with low mass fraction cannot inhibit hydrate formation, but accelerate the rate of hydrate formation. Therefore, thermodynamic inhibitors are still widely used at present. The anti-polymerization agent is characterized by preventing the generated gas from agglomerating, not forming gas hydrate in the pipeline[7]. Alcohol inhibitors, including ethylene glycol and glycerol, are typical thermodynamic inhibitors. Li et al.[8]studied the decomposition process of propane hydrate with or without methanol additive at different temperatures. The results showed that the hydroxyl group of methanol can form hydrogen bond with partial liquid water and destroy the original structure of hydrate. Zhou et al.[9]studied the effect of ethanol concentration on methane hydrate decomposition under different conditions based on angular order parameters, radial distribution function, mean square displacement, diffusion coefficient and system energy. The results showed that hydrate decomposition increased with the increase of ethanol concentration. Florianne et al.[10]studied the decomposition of hydrate under the action of two hydrate inhibitors such as methanol and ethylene glycol, and found that the inhibitor can form hydrogen bond with water molecules, caused in the competition between inhibitor and hydrate water molecules against free liquid water molecules.
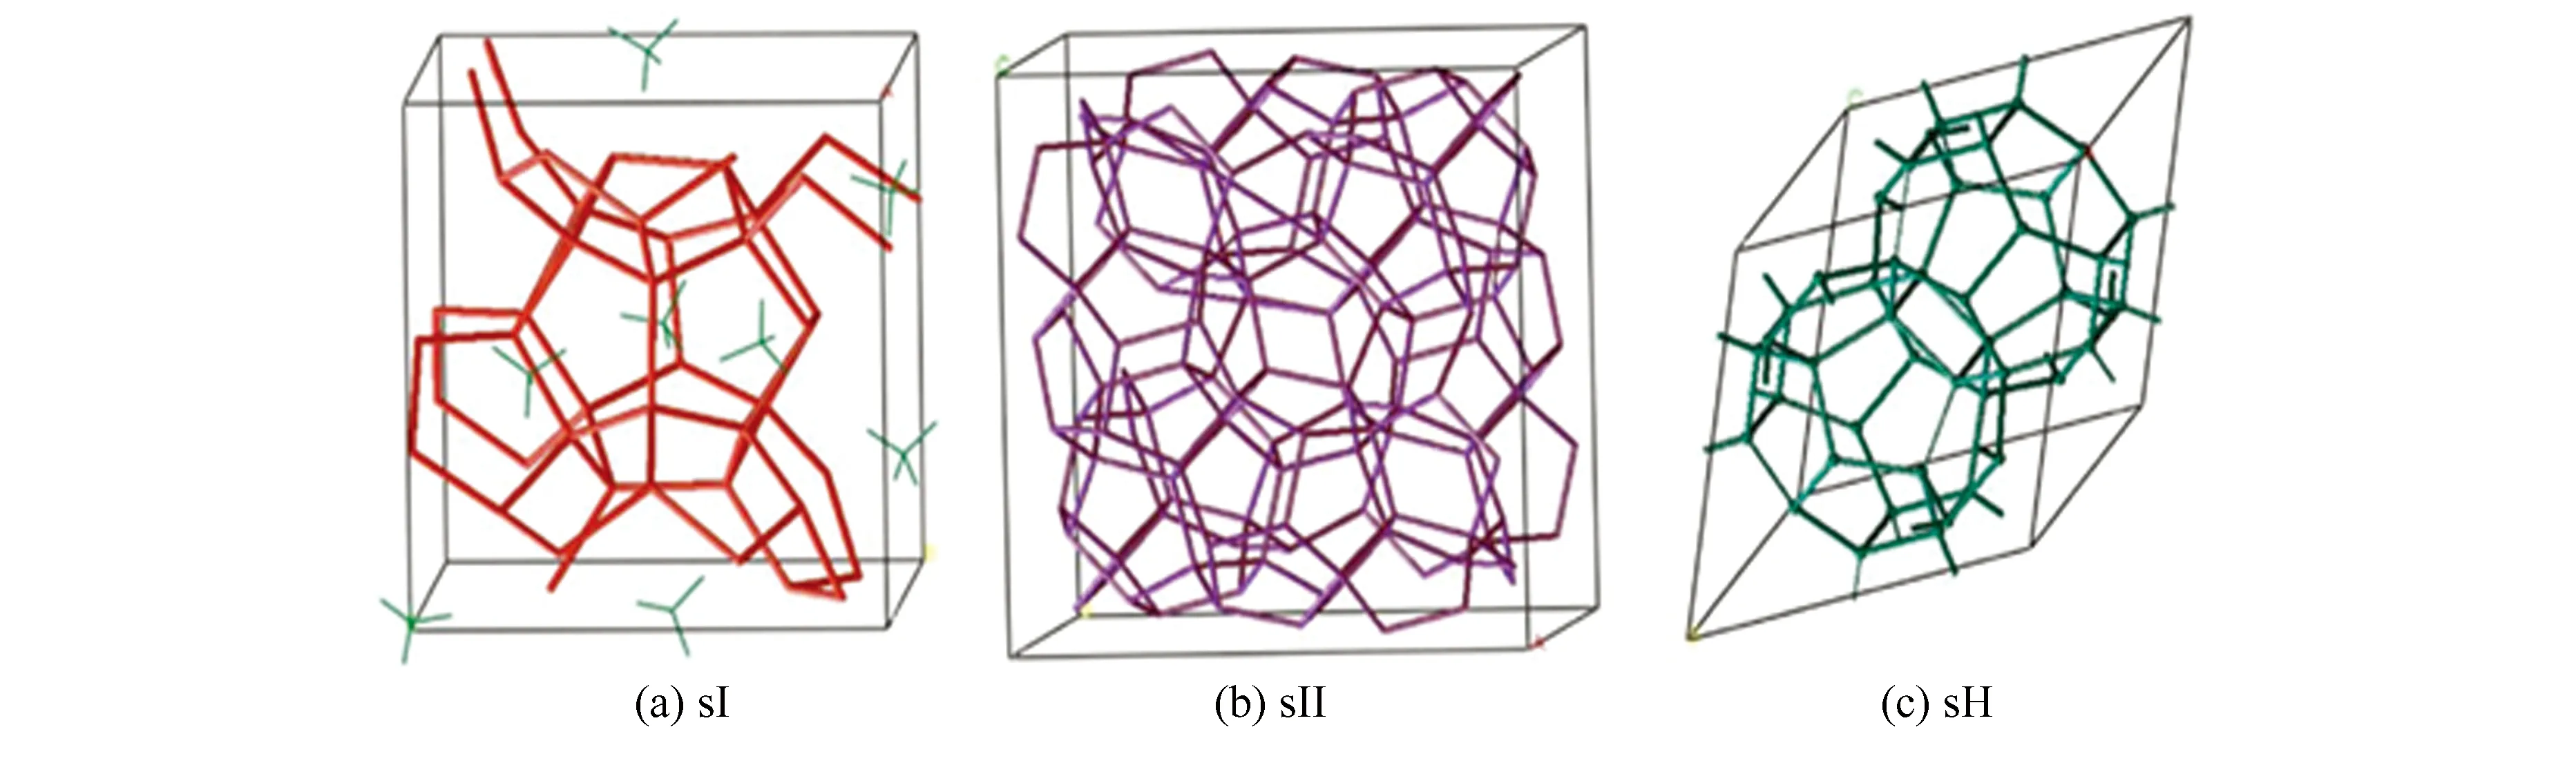
Fig.1 Hydrate cell of sI, sII, and sH
Molecular dynamics simulation is a calculation method according to the principle of Newtonian mechanics. Its basic principle is to obtain the trajectory of two atoms in the physical system through Newton's classical mechanics, and then calculate the mechanical, thermodynamic and dynamic properties of the system by using the fixed statistical method[11]. Sun et al.[12]studied the decomposition process of methane hydrate in pure water and methanol solution by molecular dynamics, and discussed the effects of temperature and pressure on the decomposition rate. Their results showed that heating and depressurization could significantly improve the decomposition rate of methane hydrate . Dai et al.[13]studied the effects of alcohol chain length, hydroxyl position and hydroxyl number on methane hydrate decomposition by means of molecular dynamics simulation, obtaining potential energy, radial distribution function and mean square displacement. The results showed that shortening alcohol chain length and increasing alcohol hydroxyl number were conducive to methane hydrate decomposition. Fan et al.[14]studied the decomposition of hydrate under the action of ethylene glycol by molecular dynamics and found that the concentration of ethylene glycol aqueous solution has an important influence on the decomposition rate of hydrate. Sujith and others[15]used classical molecular dynamics simulation to study the evolution of dissolved methane in hydrate in the presence of two thermodynamic hydrate inhibitors NaCl and CH3OH. It was found that the increase of hydrate inhibitor concentration promoted the nucleation of methane nanobubbles in hydrate melt, and CH3OH molecules gathered around the core, resulting in the decrease of surface tension at the interface between hydrate and water.
In this paper, the decomposition of methane hydrate under the action of ethylene glycol and glycerol aqueous solution will be simulated by molecular dynamics. The final conformations of ethylene glycol-hydrate system and glycerol-hydrate system at different temperatures, pressures, alcohol solution concentrations and ensembles are obtained. The distributions of mean square displacement and radial distribution function are analyzed to explore the effects of temperature, pressure and inhibitor concentration on hydrate decomposition.
1 Simulation System and Method
1.1 Construction of sI Methane Hydrate
In this simulation, sI methane hydrate model is adopted, and the hydrate model is built in Materials Studio software. Referring to the X-ray single crystal diffraction data in Table 1, the initial positions of oxygen atoms in sI methane hydrate and carbon atoms in methane molecules are determined[16-18], The interaction of water molecules is described by SPC potential energy model. Due to the random distribution of hydrogen atom positions in the cell, the optimization of hydrogen atoms in the cell needs to be completed according to Bernal-Fowler rule[18].

Table 1 Atomic coordinate information
The formula of potential energy includes two terms, long-range electrostatic interaction and short-range Lennard-Jones interaction, as calculated by

(1)
whereUij(rij) is the molecular pair interaction potential energy;AandBare respectively represented asAandBatoms cycling oniandj;qA,qBrepresent the charge ofAandBatoms respectively;rABis the distance between atoms;rOOis the interaction distance between oxygen atoms of two molecules;σ,εis the Lennard-Jones action parameter of oxygen atom.
The hydrate structure with minimal intermolecular energy is the most stable, so the optimal structure is established based on the Forcite module. Initially, methane is located in the center of the water cage crystal cavity. Consistent Valence Force Field(CVFF)is selected due to its accuracy in calculating binding energy of the force field , and providing reasonable configuration energy and vibration frequency .
The CVFF potential function is expressed by:

(2)
The first four terms describe the bond length stretching energy, bond angle bending energy, dihedral angle torsion energy and out of plane vibration energy, respectively, and together with the last five cross interaction terms form the expression of intramolecular interaction; the last two terms represent van der Waals interaction and electrostatic Coulomb interaction, indicating intermolecular interaction.
Methane hydrate is composed of water molecules and methane molecules. The intramolecular interactions mainly show the stretching of C-H and O-H bond lengths, the bending of O-H-O and C-H-C bond angles and their related coupling terms; The intermolecular interactions are mainly van der Waals force and electrostatic force between water molecules, between water molecules and methane molecules, and between methane molecules. Table 2 and Table 3 respectively show the interaction parameters of methane hydrate within and between molecules under CVFF force field.

Table 2 Intramolecular interaction parameters of methane hydrate under CVFF

EθHθ(kcal/mol/rad2)θ0(rad)O-H-O100104.5H-C-H79106.4Ebb'Fbb'(kcal/mol/?2)b0(?)b0'(?)H-O-H-14.50.960.96Ebθ'Fbθ'(kcal/mol/?/rad)b0(?)θ0(rad)H-O-H31.30.96104.5

Table 3 Intermolecular interaction parameters of methane hydrate under CVFF
In present study, Ewald method is applied to electrostatic summation. The charged amounts of hydrogen atom and oxygen atom in water molecule are + 0.41e and -0.82e, while the charged amounts of hydrogen atom and carbon atom in methane molecule are +0.1e and -0.4e, respectively. Optimized single crystal cell without hydrogen bond and with hydrogen bond are shown in Figs.2(a) and (b), where the initial cell size is 22.38? × 22.38? × 22.38 ?, 64 CH4and 368 H2O in the optimized 2×2×2 supercell.
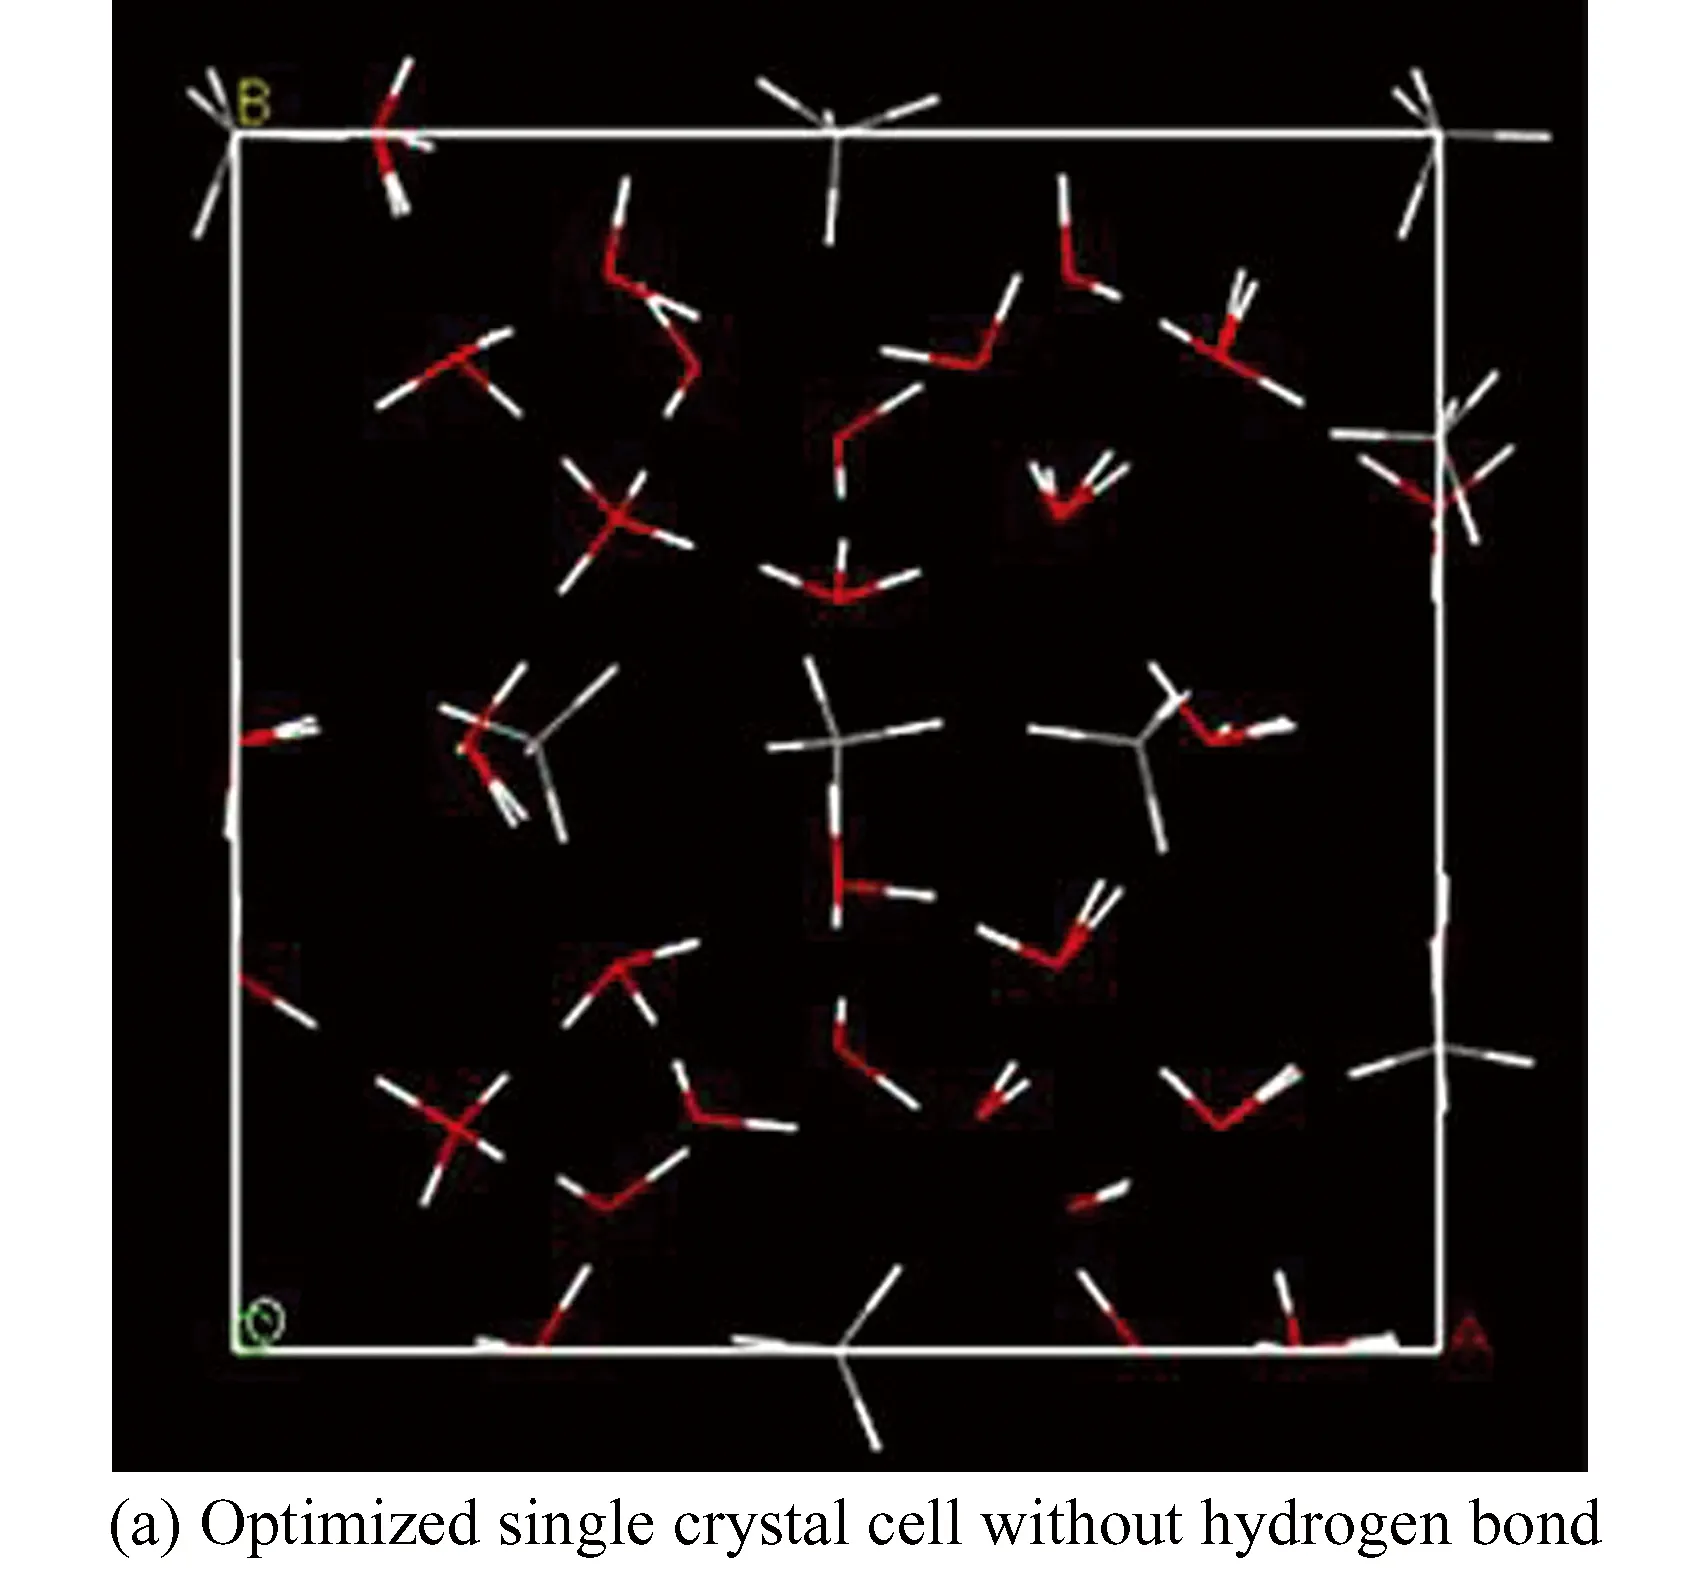
Fig. 2 Hydrate cell(Gray bead represents carbon atom, red bead represents oxygen atom, and blue dotted line is hydrogen bond)
There are two difficulties in computer simulation of charged particles. One is that the calculation amount is large because it cannot be cut off. On the other hand, the sum is conditional convergence. Ewald sum gives a solution: Disassemble this long-range force into two parts. One part decays rapidly whenris small, and the other part decays slowly with largerr, this is achieved by skillfully selecting anf(r).
(3)
The first partf(r)/ris zero or can be ignored outside the truncation distancermax, just like the short-range interaction force, it can be directly summed;
After the linear superposition of these two parts, the solution of the required problem can be obtained. Ewald[19]selected complementary error function (erf()) for summation:
which results in the well-known Ewald formula for the electrostatic energy of the box:
E=E(r)+E(k)+E(s)+E(d)
(4)
whereE(r)is real space energy,E(k)is reciprocal space energy,E(s)is self-energy andE(d)is di-pole correction energy.
1.2 Construction of Simulation System
The application concentration of thermodynamic inhibitor is generally 20wt%-60wt%. Five different concentrations of ethylene glycol aqueous solution and glycerol aqueous solution were selected. The solution system parameters are shown in Tables 4 and 5. The layered structures of methane hydrate and two alcohol solutions are shown in Fig.3, Fig.3(a) is ethylene glycol-hydrate system and (b) is glycerol-hydrate system, where the lower layer is the super cell of sI methane hydrate 2 × 2 × 2, containing 64 CH4molecules and 368 H2O molecules, and the upper layer is alcohol solution at different concentrations. The SPC model (water rigid model) is selected for the water molecular force field[20]. Lennard-Jones potential energy model is used to describe the interaction between methane molecules, water molecules and methane molecules[21-22]. In the CVFF force field, the charge of oxygen atom in hydrate is -0.82e, and the charge of carbon atom in methane molecule is -0.4e. In the next step, the established model is geometrically optimized by the smart algorithm, namely the steepest descent method combined with conjugate gradient method, and the process of minimizing the energy of the system is done. Fig.4 represents the energy change and convergence diagram of geometric optimization of ethylene-glycol hydrate and glycerol-hydrate systems. It can be seen from the figure that the energy is basically unchanged after iteration to step 350, the convergence degree is good, and the energy is minimized.
The iterative formula of the steepest descent method is:
(1)Pickx(0)∈Rn;
(2)Fork=0,1,2,……;
(5)
x(k+1)=x(k)+akr(k)

Table 5 Parameters of Glycerol solution systemm
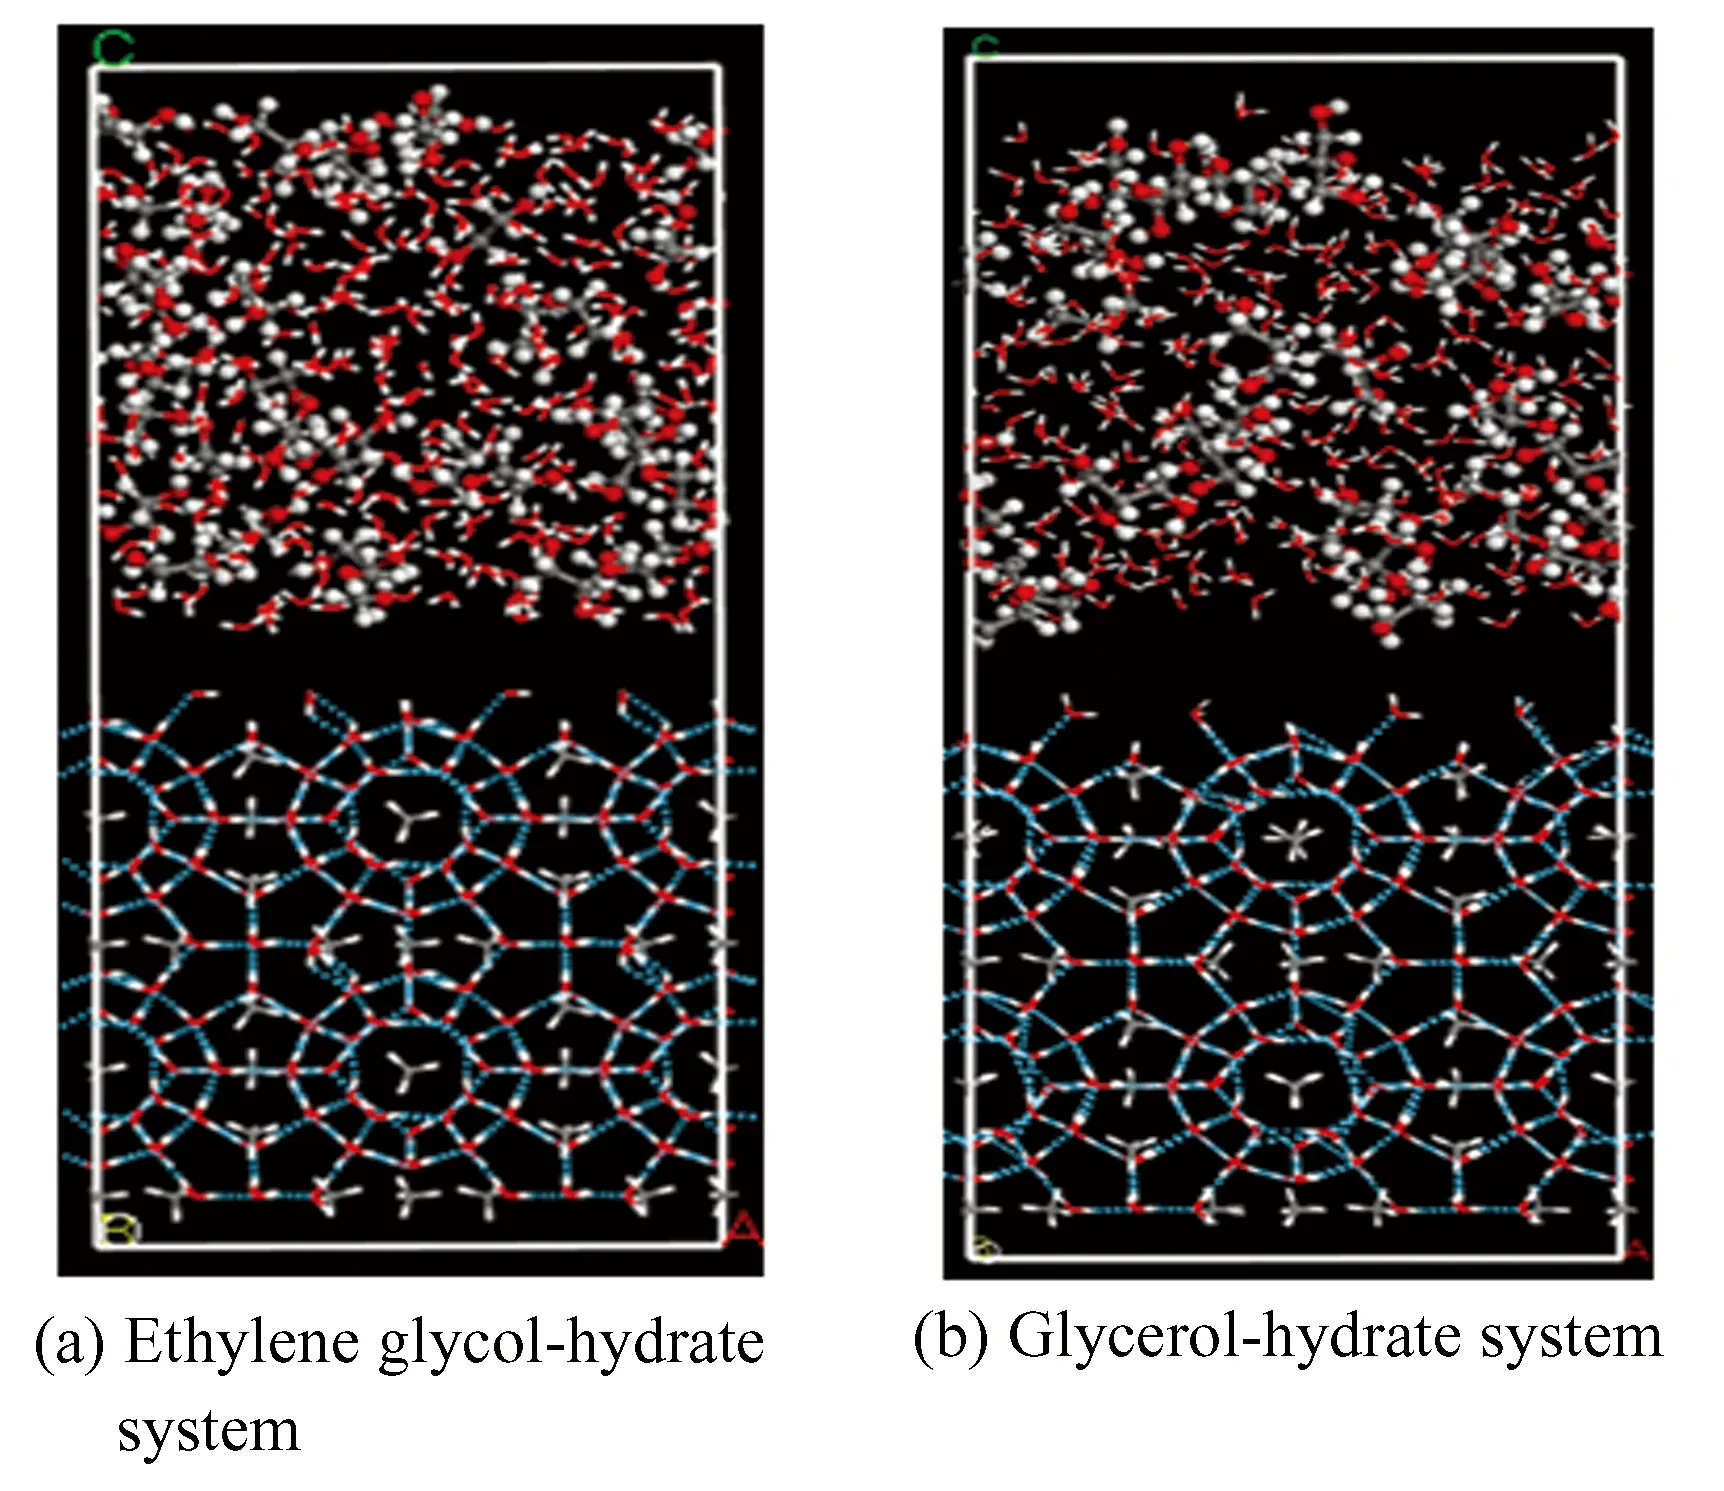
Fig. 3 Simulation system under two inhibitors

Fig .4 Energy change and convergence diagram for geometric optimization of ethylene-glycol hydrate and glycerol-hydrate system
(3) When ‖x(k+1)-x(k)‖<ε, the iteration is terminated.
The above algorithm format is simple, and its search directionp(k)is the residual directionr(k). The entire iterative process only requires some matrices and vectors for algebraic operation.
The iterative formula of conjugate gradient method is:
(1) Pickx(0)∈Rn,r(0)=b-Ax(0);
(2) Fork=1,2,……;
p(k)=r(k)+βk-1p(k-1)
x(k+1)=x(k)+akp(k)
(6)
r(k+1)=r(k)-akAp(k)
(3) When ‖x(k+1)-x(k)‖<ε, the iteration is terminated.
1.3 Simulation Method
Through investigating a large number of documents, it is found that the molecular dynamics method is feasible and widely used in this research. Therefore, this method is also applied in this paper. Molecular dynamics simulation is carried out in Materials Studio[23]software. The time step is set to 1 ps, and the total simulation time is 800 ps. The temperature is set to 250, 273, 298 and 320 K, and the pressure is set to 15, 25, 35, 45 and 50 MPa. To study the effects of temperature and pressure on hydrate decomposition rate, canonical ensemble (NVT)[24], the particle number and volume of each system are fixed and constant-pressure, constant-temperature (NPT)[24]ensemble are selected respectively. In addition, NVT ensemble is selected to test the influence of the Alcohol solution concentration on hydrate decomposition at the temperature of 273 K and the pressure of 15 MPa. In previous studies, it was found that the decomposition effect of inhibitors on hydrate was usually analyzed by calculating the radial distribution function and mean square displacement of atoms. Therefore, in this paper, the final simulated conformation of the system was analyzed, and the MSD and RDF of atoms were calculated to discuss the results.
The radial distribution function (RDF) is given by:
(7)
whereVrepresents the volume of lattice volume;NαandNβare the number ofαandβparticles, respectively;niβ(r) is the number ofβparticles in the space between concentric spheres.
The mean square displacement (MSD) is calculated by:
(8)

2 Results and Discussions
2.1 Ethylene Glycol
Ethylene glycol (CH2OH)2is abbreviated as EG. It is generally believed that ethylene glycol can decompose hydrate due to that its dihydroxy structure can destroy the hydrogen bond in hydrate. The molecular structure of ethylene glycol is shown in Fig.5, and 30.4% ethylene glycol is selected.

Fig. 5 Molecular structure of ethylene glycol(Red ball represents oxygen atom, gray ball represents carbon atom and white ball represents hydrogen atom)
2.1.1Effectoftemperatureonhydratedecompositionrate
After 800 ps kinetic simulation, the conformation of the ethylene glycol system at different temperatures is shown in Fig.6. It can be seen that ethylene glycol molecules can be attached to the hydrate surface and form the hydrogen bonds with the hydrate surface, which can prevent methane from entering the crystal cavity again to form methane hydrate. In addition, the high temperature facilitates hydrate decomposition, at this moment, methane molecules exist in the form of gas.

Fig. 6 Conformations of ethylene glycol-hydrate system at different temperatures(Concentration of ethylene glycol is 30.4%)
The mean square displacement (MSD) is the deviation of a particle’s position relative to its reference position which is a measure of the activity level of particles. With regard to a solid system, an upper limit of the mean square displacement is available, while the mean square displacement is linear with time in a liquid system. The MSD diagram of oxygen atom at different temperatures is shown in Fig.7. The profiles show that the slope becomes great with the increase of temperature, indicating that the methane molecules escape from the hole, and the system changes from solid phase to gas-liquid phase at a higher temperature, thereby the degree of decomposition is increased.
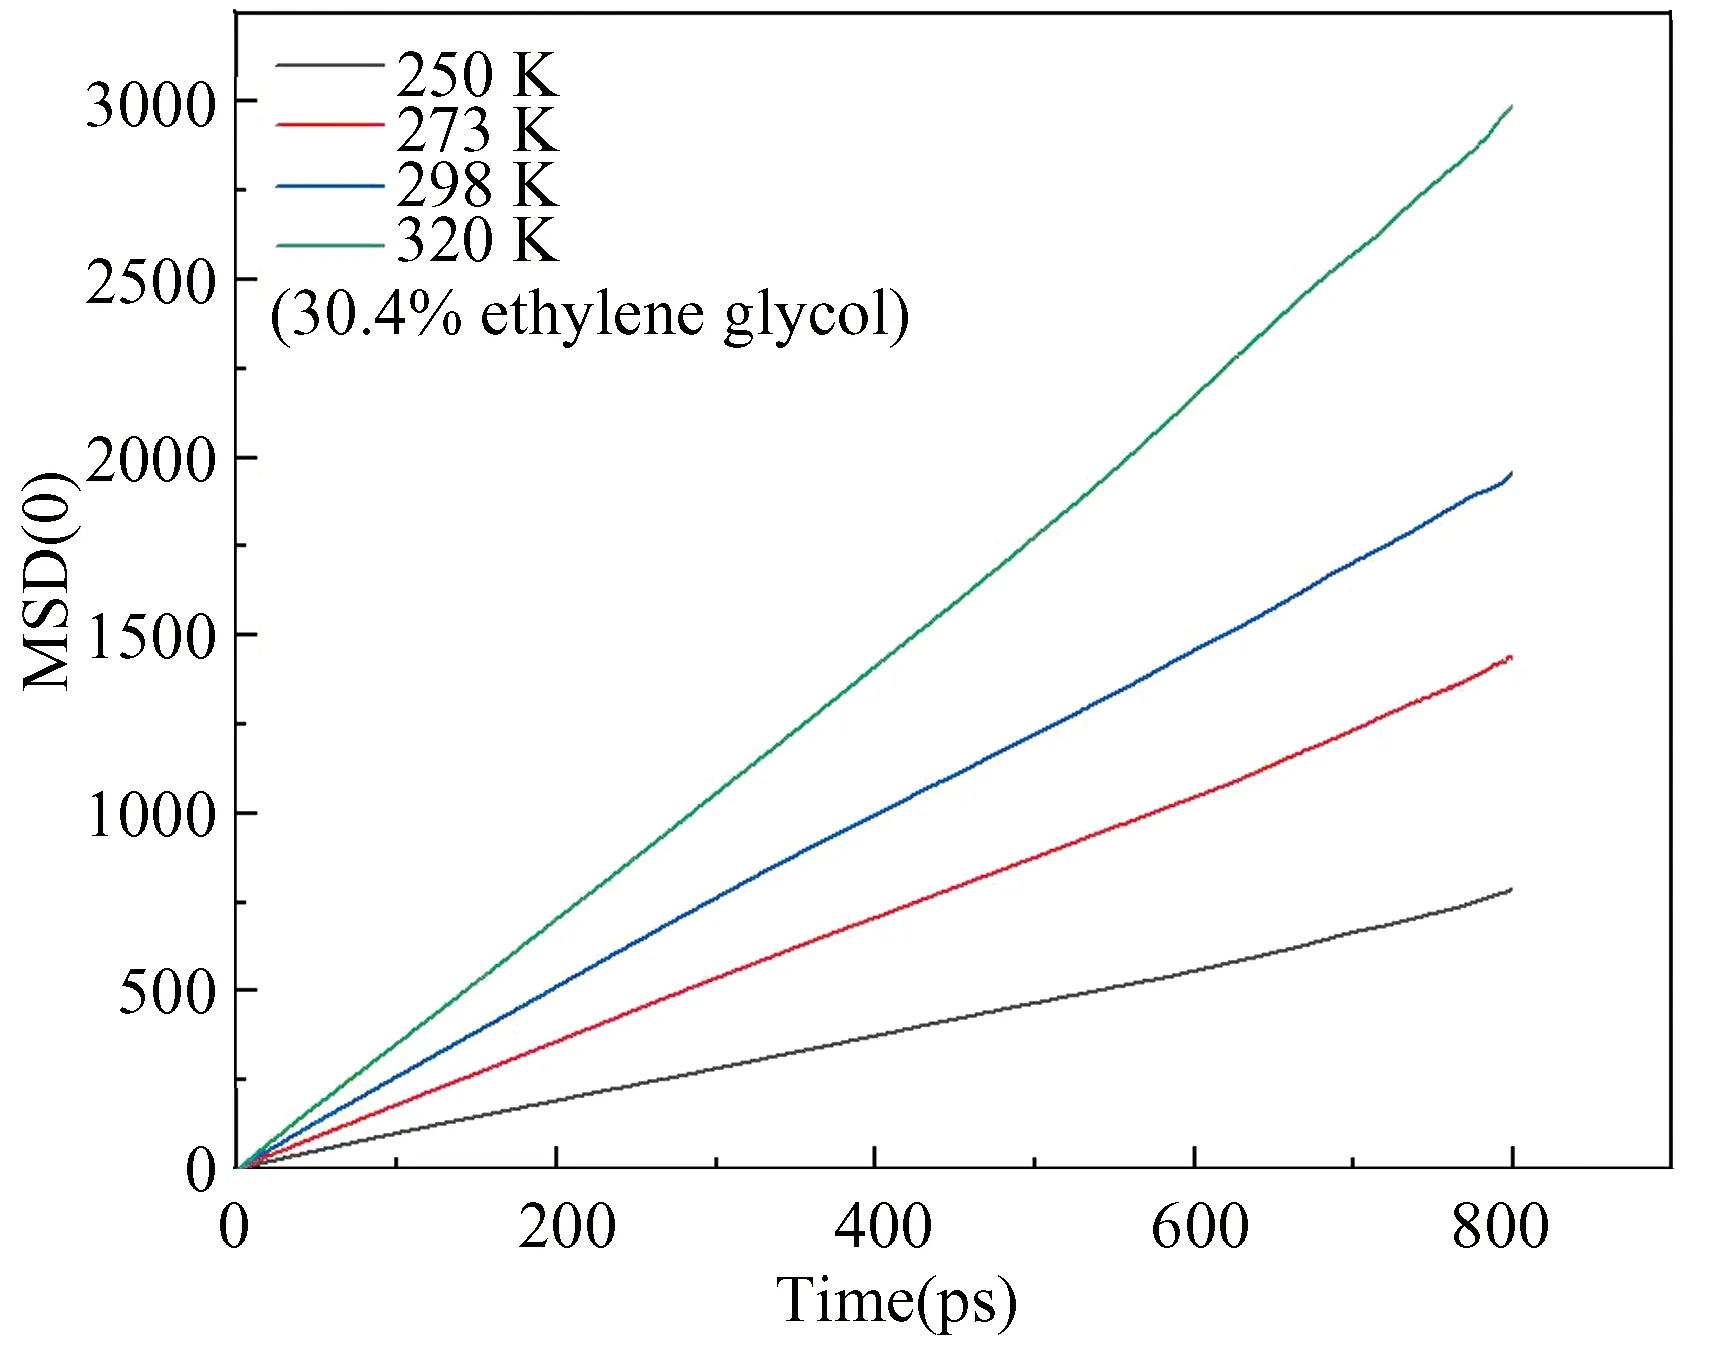
Fig. 7 Distributions of instantaneous MSD of oxygen atom in hydrate at different temperature
The RDFs of O-O, O-H, H-H, C-O, C-H and C-C at different temperatures are shown in Fig.8.
In Fig.8(a), gO-Ohas an obvious characteristic peak located near 2.75 ? and the peak decreases with the increase of temperature, indicating that hydrate structures begin to be damaged, and dissociated hydrate crystals are available,after the first peak, subsequently, other small characteristic peaks gradually disappear, and the curves tend to be flat. It means that the hydrate has decomposed on the condition of the hydrate structure.
As shown in Fig.8(b), there are three obvious characteristic peaks, located at 0.75, 1.75 and 3.25 ?, respectively, and their peak values decline with the increase of temperature. For Fig.8(c), three obvious characteristic peaks of gH-Hare located near 1.25, 2.25 and 3.75 ?, and the corresponding peak values increase firstly, and then gradually decrease, while the curves of gH-Htend to be gentle and their peak values are almost the same, meaning that the stability of methane hydrate is destroyed at a high temperature.
In Fig.8(d), the unique characteristic peak value is around 3.75 ?. After the disappearance of the first peak, the rest of the curve shows an upward trend due to small hole of hydrate being wrapped by methane molecules. For gC-H, only one characteristic peak locates near 3.75 ?. The curves show an upward trend with the increase of truncation radius after the first peak disappears. The curves in Figs.8 (d) and (e) show an upward trend, and the reason is that the methane molecules escape from the crystal hole and then gather together.
The gC-Cshown in Fig.8 (f) has a characteristic peak near 4.25 ?, and the peak increases gradually with the increase of temperature, indicating that methane molecules begin to gather.
2.1.2Effectofpressureonhydratedecompositionrate
The conformations of ethylene glycol system under different pressures are shown in Fig.9, and the hydrate decomposition degree becomes greater with the decrease of pressure, and the decomposition rate speeds up. Also, ethylene glycol molecules form hydrogen bonds with the hydrate surface.
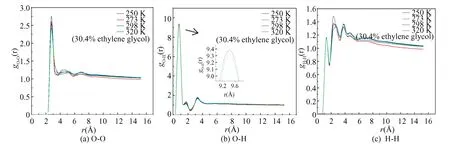
Fig. 8 RDF of atoms in hydrate at different temperatures

Fig. 9 Conformations of ethylene glycol-hydrate system under different pressures (Concentration of ethylene glycol is 30.4%)
The MSD diagram of the oxygen atom is shown in Fig.10 and the slope of the curve is larger at 25 MPa pressure than at other pressures, indicating that the hydrate is dissociated.
After kinetic simulation, the radial distribution function of O-O and C-C under different pressures are analyzed, as shown in Fig.11.
In Fig.11(a), there is an obvious characteristic peak in the gO-Onear 2.75 ? at the pressures of 15 MPa and 25 MPa, their peaks are lower than those at other three pressures, indicating that the hydrate decomposes easily at low pressure, the lowest peak appears at 25 MPa. For Fig.11(b), there is an obvious characteristic peak in the gC-Cdiagram near 4.25 ?. The highest peak appears at the pressure of 25 MPa, demonstrating that methane molecules in the hydrate escape and gather from the crystal cavity, and the hydrate structure is damaged. According to Figs.9 and 10, the optimal decomposition degree of ethylene glycol system is at the pressure of 25 MPa.

Fig.10 Distributions of instantaneous MSD of oxygen atom in hydrate at different pressures
2.1.3EffectofEGconcentrationonhydratedecompositionrate
The conformation of the model under different EG concentrations is shown in Fig.12. It means that methane molecules show a relatively regular aggregation distribution in the solution at a low concentration of ethylene glycol. With the increase of concentration of alcohol solution, methane molecules change from aggregation to dispersion.
The MSD and RDF diagram of oxygen atom is shown in Fig.13. The slopes of the curves are roughly the same with EG concentrations of 23.7% and 30.4%, and their hydrate decompositions are the same. However, the slope of the curve becomes smaller at the EG concentration greater than 30.4%, and their decomposition rate slows down. For gO-O, there is an obvious characteristic peak near 2.75 ?, and the low concentration of EG will reduce the peak value, indicating that under this working condition, the two concentrations of EG have better decomposition effect on hydrate.

Fig. 11 RDF of oxygen and carbon atoms in hydrate under different pressures

Fig.13 Distributions of instantaneous MSD and RDF of oxygen atom in hydrate at different EG concentrations
2.2 Glycerol
Glycerol(C3H8O3), also known as glycerin. Research shows that it is easier to form new hydrogen bonds between hydrate water molecules and glycerol molecules, so as to prevent hydrate regeneration. The molecular structure of glycerol is shown in Fig.14, and 30.7% glycerol is selected for this section.
2.2.1Effectoftemperatureonhydratedecompositionrate
The conformation of the glycerol system at different temperatures is shown in Fig.15. We can find that glycerol molecules can attach to the hydrate surface to associate hydrogen bonds with the hydrate surface, preventing methane from entering the crystal cavity again, and then forming methane hydrate. In addition, high temperature can promote the decomposition of hydrate, continually confirming that increasing temperature accelerates the decomposition of hydrate.

Fig.14 Molecular structure of glycerolRed ball represents oxygen atom, gray ball represents carbon atom and white ball represents hydrogen atom
The MSD of oxygen atom at different temperatures is shown in Fig.16. The slope of the MSD curve becomes steep with an increase of temperature, indicating that the decomposition rate is faster.
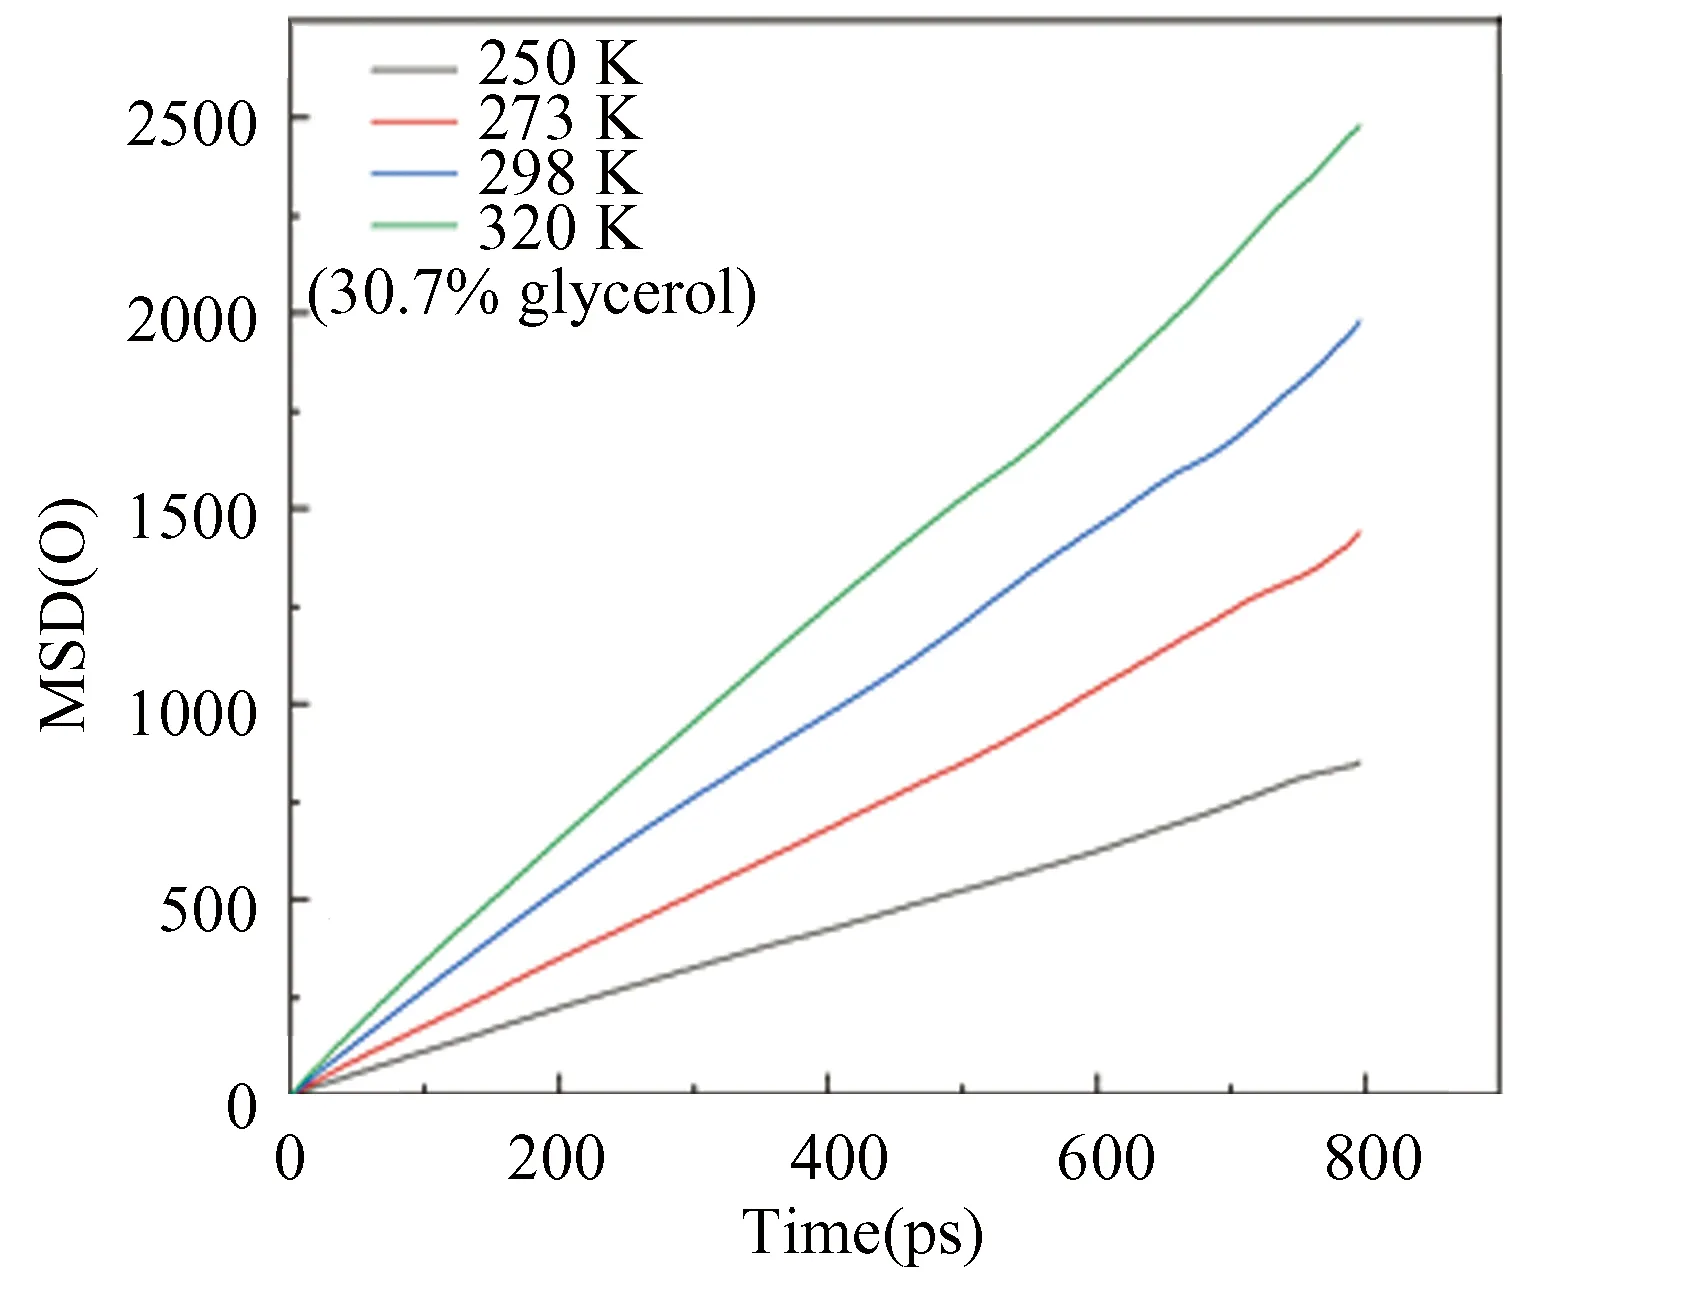
Fig. 16 Distributions of instantaneous MSD of oxygen atoms in hydrate at different temperatures
The radial distribution functions of O-O, O-H, H-H, C-O, C-H and C-C at different temperatures are shown in Fig.17.
In Fig.17(a), gO-Ohas an obvious characteristic peak located near 2.75?. The peak value becomes lower at a high temperature. After the first characteristic peak, the rest of the curve tends to be gentle, demonstrating that the hydrate has decomposed, the order of water molecules has been broken, and the hydrate has been destroyed.
As shown in Fig.17(b), there are three obvious characteristic peaks at 0.75, 1.75 and 3.25 ?, respectively.
With the increase of temperature, the peak value gradually decreases, the rest of the curve tends to be flat and the peaks gradually disappear. For Fig.17(c), there are three obvious characteristic peaks at 1.25, 2.25 and 3.75 ? in the curve of gH-H. When the temperature increases, both peaks decrease, and the other peaks of curve disappear gradually, meaning alcohol molecules form hydrogen bonds with the hydrate surface, resulting in the destruction of hydrate stability.
In Fig.17(d), the unique characteristic peak value is around 3.75 ?,and the peak becomes lower and lower with the increase of temperature. In addition, except for the first peak, the trend of other curves is generally the same. From Fig.17(e), the diagram of gC-Ois generally consistent. The curve shows an upward trend along with the distance from 8 ? to 15 ?, which is a sign of methane molecules escaping from the hole and gathering together.
Fig.17(f) shows the gC-Cdiagram, with a characteristic peak near 4.25 ?, which represents that hydrate methane molecules gradually escape from the hole and gather together. In addition, near 6 ?, the curve tends to be consistent, indicating that the arrangement of carbon atoms will not change greatly, and the system is in equilibrium state at this moment.
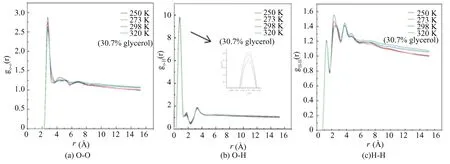
Fig.17 RDF of atoms in hydrate at different temperatures
2.2.2Effectofpressureonhydratedecompositionrate
The conformations of glycerol system under different pressures are shown in Fig.18. It also can be seen that, similar to the decomposition mechanism of ethylene glycol, glycerol molecules can form hydrogen bonds with nearby liquid water molecules, destroy the cage structure, and adhere to the hydrate surface to prevent hydrate regeneration.
The MSD diagram of the oxygen atom is shown in Fig.19. The slope of MSD curve is the steepest at the pressure of 25 MPa, indicating the best decomposition effect, while the slopes of curves at 35 MPa and 45 MPa are the same, so their degrees of decomposition are roughly the same. In addition, the slopes of curves are the lowest at pressures of 15 MPa and 50 MPa.

Fig.18 Conformations of glycerol-hydrate system under different pressures(The concentration of glycerol is 30.7%)

Fig.19 Distributions of instantaneous MSD of oxygen atom in hydrate at different pressures
After kinetic simulation, the gO-Oand gC-Cunder different pressures are analyzed, as shown in Fig.20. In Fig.20(a), there is an obvious characteristic peak in the gO-Odiagram near 2.75 ?, the peak decreases gradually with the decrease of pressure. In Fig.20(b) gC-Cdiagram, there is also an obvious characteristic peak near 4.25 ?, and the peak is the highest when the pressure is 25 MPa, indicating that under this pressure, the hydrate decomposition degree is the largest, the hydrate crystal is damaged, and the methane molecules escape and then gather together. According to Figs.19 and 20, at the pressure of 25 MPa, the decomposition effect of hydrate with glycerol is remarkable.
2.2.3Effectofglycerolconcentrationonhydratedecompositionrate
The conformation of the glycerol system under different concentrations is shown in Fig.21. At the concentration of glycerol is 23.5% and 30.7% respectively, methane molecules are aggregated, and when the concentration increases, methane molecules begin to disperse.
The MSD and RDF diagram of oxygen atom is shown in Fig.22. For Fig.22(a), at the concentrations of 23.5%, 30.7% and 38.7%, the slopes of the curves are roughly the same, nevertheless, the slope of the curve becomes smaller at the glycerol concentration greater than 38.7%, meaning that their decomposition rate slows down. There is an obvious characteristic peak for gO-Onear 2.75 ? in Fig.22(b). The peak value increases with the increase of inhibitor concentration, especially, the peak value increases significantly at the concentration exceeding 38.7%. According to Figs.21 and 22, the hydrate decomposition effect performs excellent at the concentration between 23.5% and 38.7%.

Fig. 20 RDF of oxygen and carbon atoms in hydrate under different pressures

Fig.21 Conformations of glycerol-hydrate system at different glycerol concentrations
2.3 Comparison of Ethylene Glycol and Glycerol
According to the previous simulation results, glycol has the best effect when the concentration is 23.7%-30.4%, and glycerol has the best effect when the concentration is 23.5%-38.7%. Therefore, when comparing the decomposition effect of the two inhibitors, under the NPT ensemble, the decomposition of hydrate is analyzed at the temperature of 298 K and the pressure of 15 MPa, the concentration of glycol and glycerol is 30.4% and 30.7% respectively. The simulation results are shown in Fig.23.
In Fig.24(a), under the same conditions, there is an obvious characteristic peak in gO-Onear 2.75 ?, and the peak value of glycerol system is the lowest. In addition, the MSD diagram of oxygen atoms is shown in Fig.24(b). Its slope of the curve is almost 0 without inhibitor, indicating that the hydrate exists as a solid phase. While adding alcohol solution as inhibitor, the slope of curve shows an upward trend, indicating that the hydrate is dissociated. According to Figs.23 and 24, the effect of glycerol shows more effective decomposition of hydrate than that of ethylene glycol, and the effects of the two inhibitors on hydrate decomposition under pressures of 25 MPa and 35 MPa are compared, the results show that the inhibition effect of glycerol is better than that of ethylene glycol, because glycerol owns more hydroxyl groups, the stronger polarity, the greater hydrophilic in water, which are beneficial to the association of hydrogen bonds with its adjacent water molecules to inhibit hydrate formation.
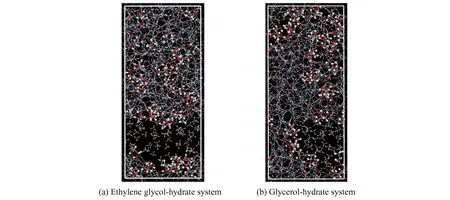
Fig. 23 Conformations of ethylene glycol-hydrate and glycerol-hydrate simulation system

Fig. 24 Distributions of instantaneous MSD and RDF of oxygen atom in hydrate under different inhibitors
Under the same conditions, the decomposition effects of the two inhibitors at 25 MPa and 35 MPa are compared by calculating the radial distribution function and mean square displacement of the oxygen atom. It can be seen from Fig.25, the peak value of the gO-Oin the glycerol system is lower than that in the ethylene glycol system, and the MSD slope of oxygen atom in the glycerol system is significantly higher than that in the ethylene glycol system. It is further verified that glycerol inhibitor is better than ethylene glycol in decomposing hydrate.
2.4 Comparison of Decomposition Effects of Hydrate in Two Different Ensembles
Under the same inhibitor concentration, temperature and pressure, the decomposition effects of ethylene glycol solution and glycerol solution under the two ensembles are simulated respectively. In this section, the inhibitor concentration is 38.7%, the temperature is 298 K and the pressure is 15 MPa. The simulation results are shown in Fig.26, group (a) and group (b) are hydrate decomposition diagrams of ethylene glycol aqueous solution and glycerol aqueous solution under NVT and NPT ensemble.
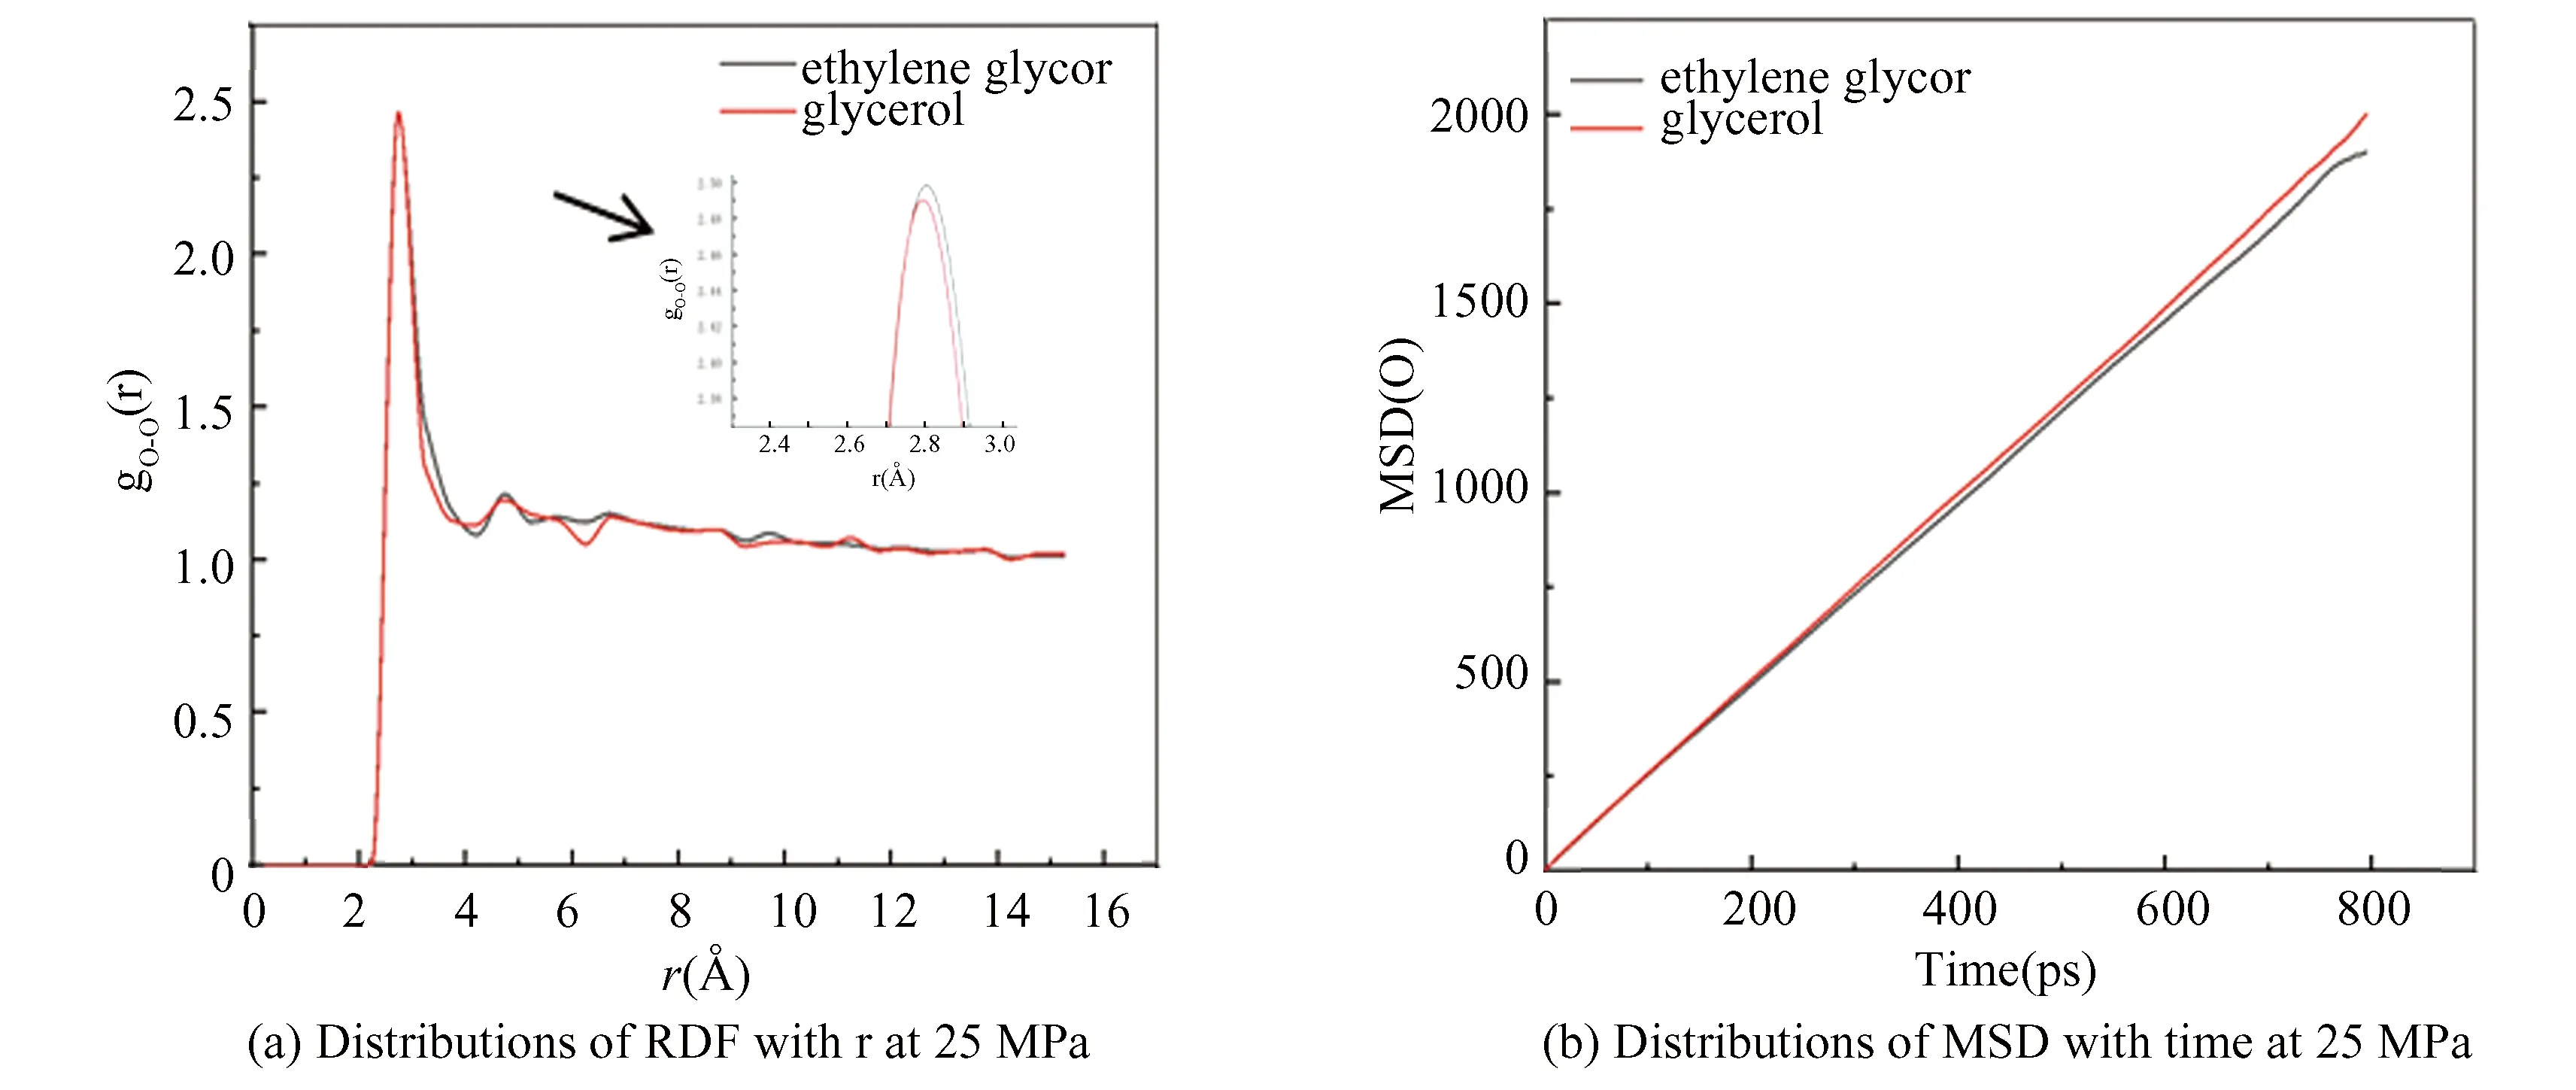
Fig.25 Distributions of instantaneous MSD and RDF of oxygen atom in hydrate under different inhibitors
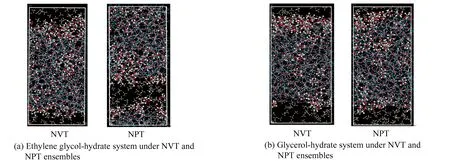
Fig.26 Conformation of ethylene glycol-hydrate and glycerol-hydrate simulation system under different ensembles
From Fig.27, the MSD images of O-O in both ensembles show an upward trend. The slope of the curve under NPT ensemble is significantly greater than that under NVT ensemble with time. The gO-Odiagram in Fig.28 has roughly the same trend with an obvious characteristic peak near 2.75 ?. However, the peak value for NPT ensemble is significantly smaller than that of NVT ensemble, and the curve gradually flattens, meaning that the hydrate gradually changes from solid phase to gas-liquid phase. According to Figs.26-28, the decomposition effect of hydrate under NPT ensemble is better than NVT ensemble, the reason is that the NPT ensemble can not only control temperature, but also control pressure, while the NVT ensemble no longer controls pressure after determining the box size.
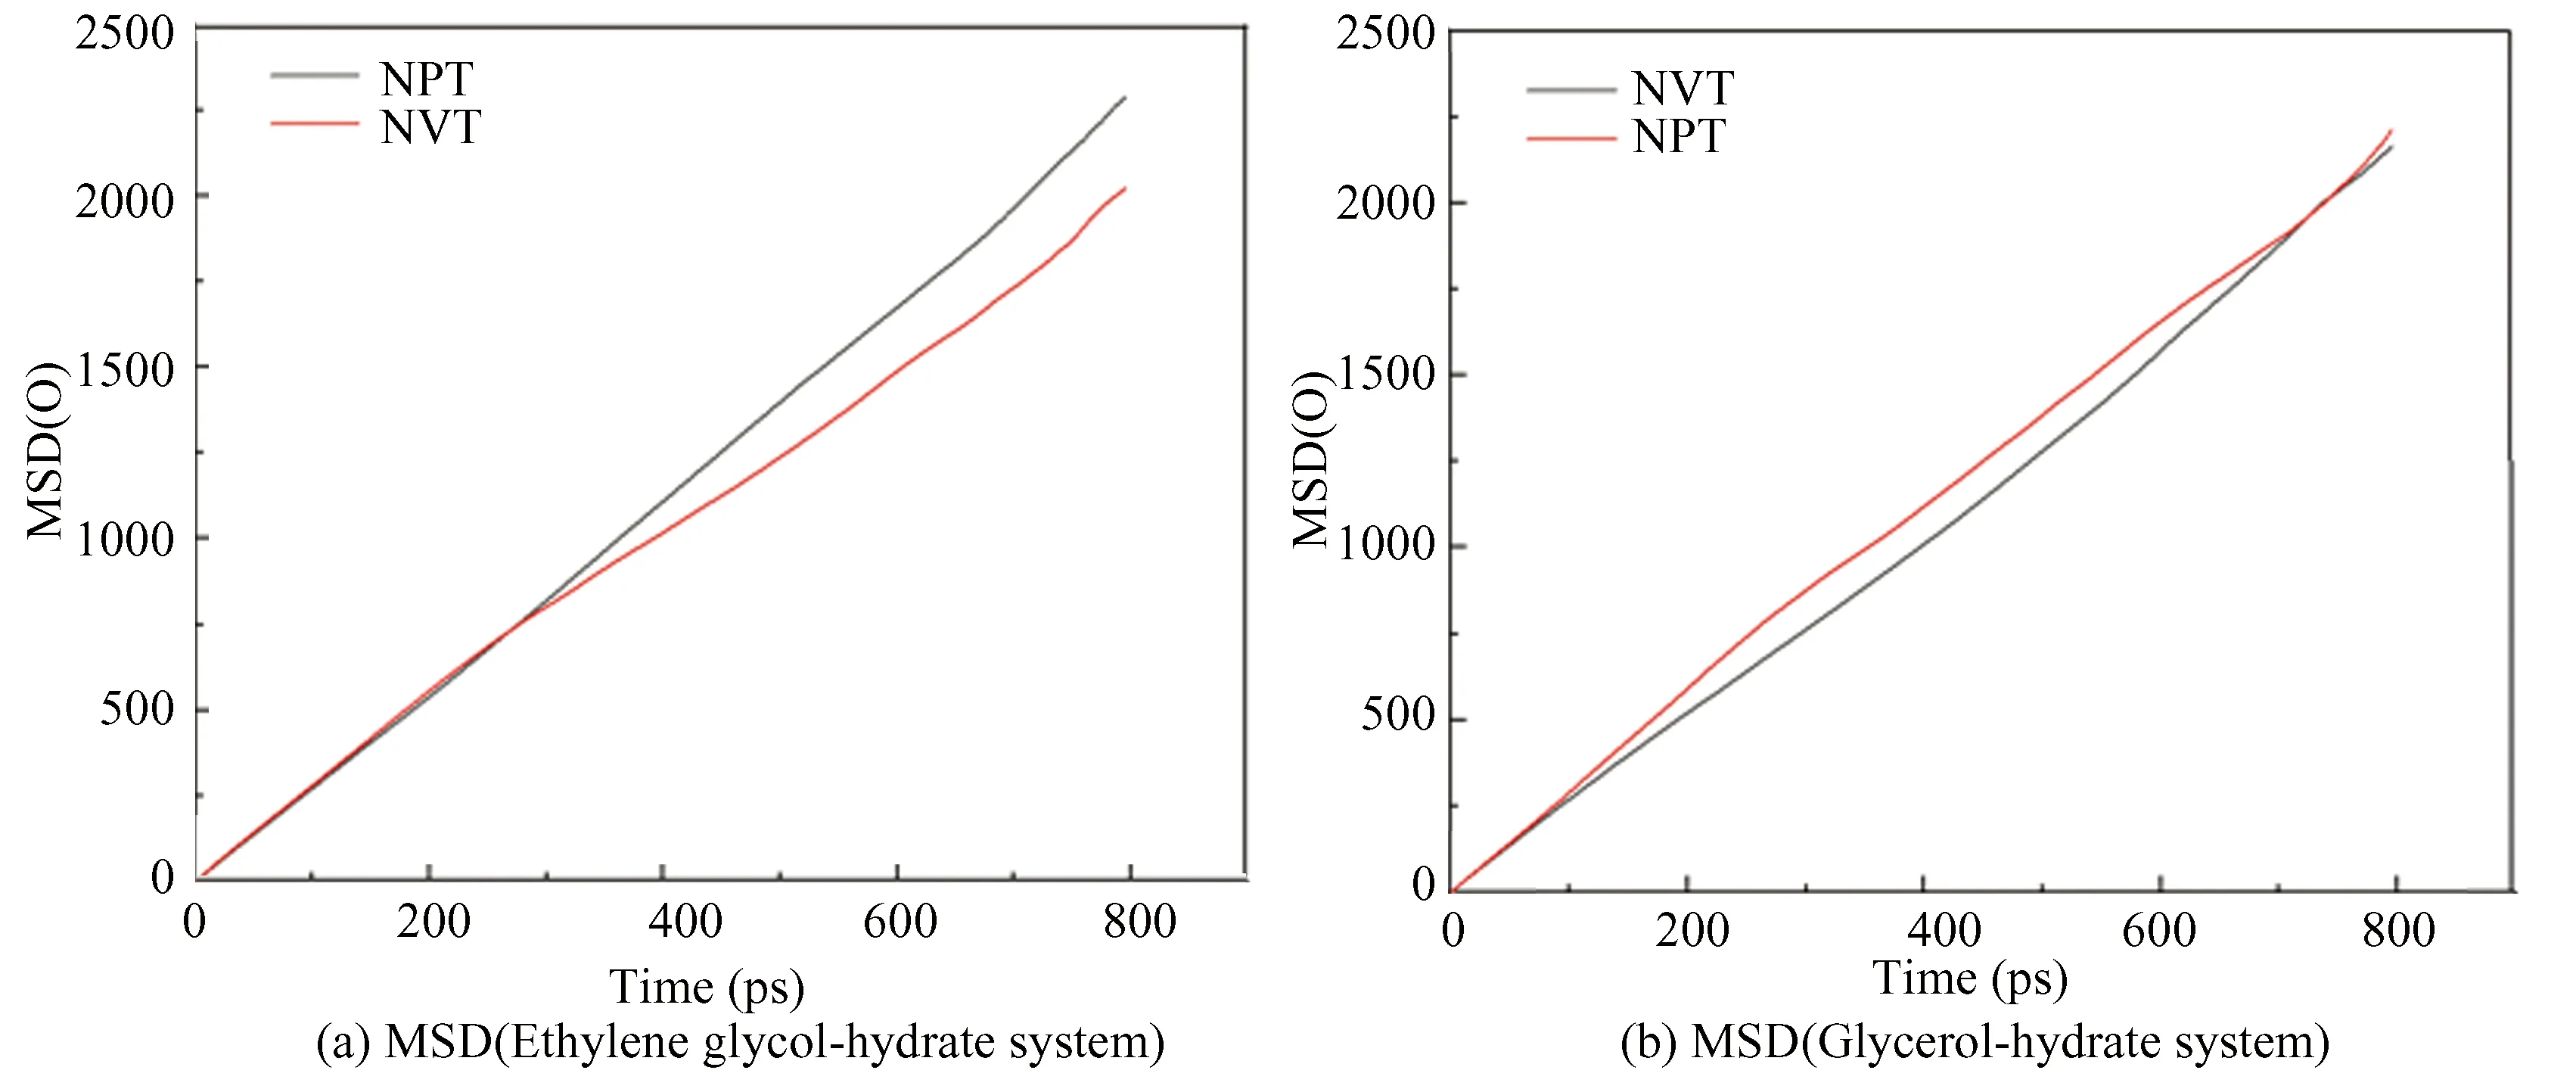
Fig.27 Distributions of instantaneous MSD of oxygen atom in hydrate under different ensembles

Fig. 28 RDF of oxygen atom in hydrate under different ensembles
3 Conclusions
In this paper, the decompositions of sI methane hydrate in ethylene glycol and glycerol aqueous solutions are explored by molecular dynamics simulation. The effects of temperature, pressure and concentration of two alcohol solutions on hydrate structure and decomposition rate are discussed, and the system without inhibitor serves as the control group.
The simulation results show that the decomposition process of hydrate generally includes three stages: the cage structure being destroyed, gas-liquid two-phase coexistence and gas-liquid separation. Adding glycol and glycerol aqueous solution, the hydrate structure is destroyed due to glycol and glycerol molecules attaching to the hydrate surface and forming hydrogen bonds with adjacent water molecules to prevent hydrate formation again.
The analysis on simulated conformation, RDF and MSD demonstrate that high temperature is conducive to hydrate decomposition. The decomposition effect of hydrate under the ethylene glycol and glycerol system is better at the pressure of 25 MPa and the inhibitor concentration ranging 20% - 40%, and the effect of glycerol decomposition hydrate is better than ethylene glycol. The decomposition rate of hydrate with NPT ensemble is better than that of NVT ensemble.
Therefore, the decomposition rate of hydrate can be improved by increasing temperature, reducing pressure, with appropriate concentrations of ethylene glycol and glycerol aqueous solutions.
 Journal of Harbin Institute of Technology(New Series)2023年6期
- Journal of Harbin Institute of Technology(New Series)的其它文章
- Optimization of Rolling Parameters for Enhancing Surface Integrity of Aluminum Alloy
- Evaluation of Shell and Tube Heat Exchanger Performance by Using ZnO/Water Nanofluids
- Influence of Ru Content on Microstructural Stability and Stress Rupture Property of DD15 Alloy
- Machines, Tools and Tool Transporter Concurrent Scheduling in Multi-machine FMS with Alternative Routing Using Symbiotic Organisms Search Algorithm
- A Review on Efficient Routing Mechanisms in Urban Scenario of Vehicular Ad-Hoc Networks
- Geometric Calibration Method of Robot Based on Measurement System Including Position and Orientation Parameters