
Unveiling localized electronic properties of ReS2 thin layers at nanoscale using Kelvin force probe microscopy combined with tip-enhanced Raman spectroscopy
2023-12-02 09:29:36YuLuo羅宇WeitaoSu蘇偉濤JuanjuanZhang張娟娟FeiChen陳飛KeWu武可YijieZeng曾宜杰andHongweiLu盧紅偉
Chinese Physics B 2023年11期
關(guān)鍵詞:陳飛
Yu Luo(羅宇), Weitao Su(蘇偉濤),?, Juanjuan Zhang(張娟娟), Fei Chen(陳飛),Ke Wu(武可), Yijie Zeng(曾宜杰), and Hongwei Lu(盧紅偉)
1School of Sciences,Hangzhou Dianzi University,Hangzhou 310018,China
2Hunan Petrochemical Vocational Technology College,Yueyang 414011,China
3College of Materials and Environmental Engineering,Hangzhou Dianzi University,Hangzhou 310018,China
Keywords: few layer ReS2,tip enhanced Raman spectroscopy,local strain,Kelvin probe force microscopy
1.Introduction
Two-dimensional (2D) transition metal dichalcogenides(TMDs) have drawn much attention recently owing to their unique layered structures and excellent physical properties.[1–4]Rhenium disulfide (ReS2) is an important member of these layered TMDs, in terms of its unique anisotropic optical and electronic properties.[5–7]ReS2has a distorted 1T structure as its stable phase.[8]In (100) plane,the atoms of a ReS2layer exist in the form of strong covalent bonds, while the neighboring layers are stacked by weak van der Waals force along[001]direction.[5]At the same time,the metallic Re–Re bond causes the Re4 atomic cluster to form highly oriented Re–Re chains along the lattice direction of theb-axis, [010], forming two rhombic edges with an included angle of 118.97?from thea-axis,[9]which lowers the crystal symmetry.Due to such an unique structure,the optical,electrical,and optoelectronic properties of ReS2thin layers exhibit significant in-plane and out-of-plane anisotropy.[7,10]Moreover, the band structure of ReS2thin layers is independent of the layer thickness, i.e., both single-layer and multi-layer ReS2possess direct-band gaps.[9]Compared to other conventional TMDs, ReS2provides a wider range for exploring advanced electronic and optoelectronic devices,such as logic inverters with higher amplification gain,[11]higher performance field effect transistors,[12]and high-sensitivity polarized light detection.[13]
For a new generation atomic scale device manufactured using ReS2thin layers, hardly removed imperfect structures,such as strain,[14]twin boundaries,[15]domain boundaries,[16]are expected to induce localized energy band structure and electronic properties at nanoscale region neighboring these imperfect structure.Probing localized electronic properties induced by these imperfect structures demands an analytic tool with nanoscale spatial resolution.Based on electrostatic interactions, Kelvin probe force microscopy (KPFM) performs as an useful tool to obtain the surface potential changes.[17,18]In a dual pass scan of conventional KPFM, the surface morphology is obtained in the first scan by employing an conductive atomic force microscopy(AFM)probe working at tapping mode,then the contact potential difference(CPD)is obtained in the second scan by lifting the probe and maintaining it at a settled height.[19]The electrostatic force between the tip and the sample is not simply the interaction between the tip apex and a certain point of the sample,but the averaged interaction with a larger sample area under the probe apex.[20]Therefore,the obtained CPD is the averaged potential of this large area and affected by the lifting height and diameter of tip apex,resulting in a few hundreds of nanometers in spatial resolution for conventional KPFM,[21,22]and it is difficult to characterize nanoscale localized electrical properties.
Tip-enhanced Raman spectroscopy (TERS), which utilizes the localized surface plasmon resonance (LSPR), lighting rod effect and tip-substrate coupling effect,[23–26]etc.,has emerged as a novel tool to investigate localized optical and electronic properties of TMDs.[26–33]Due to the strongly localized electric field at the tip apex, the spatial resolution of TERS can be several nanometers under ambient conditions[28,34]and even sub-nanometer at helium temperature.[34,35]However, to the best of our knowledge,TERS has not been implemented into characterizing physical properties of ReS2thin layers so far.In this work, TERS is combined with KPFM to study localized electronic properties of few-layer ReS2flakes mechanically exfoliated on rough gold thin films.We obtain the local strain of ReS2bubbles using tip-enhanced Raman spectroscopy and then inversely calculate the CPD changes at the nanoscale.This method overcomes low spatial resolution of conventional KPFM and can be used to characterize localized electrical properties of thinlayer TMDs with higher spatial resolution at nanoscale.
2.Experimental details
Few-layer ReS2flakes with low density of defects were mechanically exfoliated from a high-quality ReS2crystal(Xianfeng Nano) onto gold thin films (40 nm) coated on Si/SiO2(300 nm) substrates.Optical images of the samples were captured by an optical microscope (Olympus BX53).Far-field Raman and photoluminescence spectra were collected on a Horiba NanoRaman system(LabRAM HR Nano,HORIBA Scientific,France)in top illumination.The 532 nm excitation laser was focused onto the sample via a 100×Olympus objective lens (NA=0.9).The laser power at the sample surface was controlled below 100 μW to avoid the overheating effect.TERS measurements were conducted using the same HORIBA NanoRaman system.A He–Ne laser(632.8 nm) was focused onto the apex of Au-coated AFM tips (k=2.7 N/m,f=60 kHz, HORIBA Scientific, France)in side-illumination geometry at an angle of 60?using a 100×long working distance(6 mm)objective lens(Mitutoyo,Japan, 0.7 NA).TERS spectra were obtained using 150 and 1800 lines/mm gratings and an electron-multiplying chargedcoupled device detector(HORIBA Scientific,France).
KPFM measurements were performed on the scanning probe microscopy(SPM)unit of the same HORIBA NanoRaman system.Au-coated TERS probes were directly used for the AFM and KPFM measurements.KPFM measurements were performed by lifting the AFM probes 10 nm away from the sample surface.
3.Results and discussion
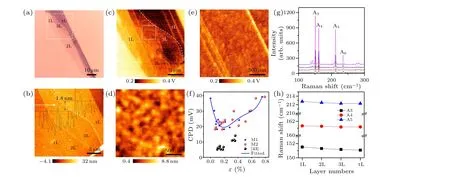
Optical image of a ReS2multi-layer flake deposited on a Au thin film is presented in Fig.1(a).The area with lightest contrast can be tentatively assigned to 1L.The areas with gradually increasing contrast can be tentatively assigned to 2L and 3L.The area with darkest contrast can be assigned to thick layer (tL).AFM topographic and phase images of a marked area in Fig.1(a)are shown in Fig.1(b)and Fig.S1 in the supporting information.Due to large surface roughness of the Au thin film, the 1L area is hardly seen in the topographic image, but can be easily found in the phase image (Fig.S1).A height profile across the terrace between 1L and 3L along the arrowed line in Fig.1(b)is plotted as an inset[Fig.1(b)].The thickness difference between 1L and 3L can be determined to be 1.8 nm.The thickness of 3L was determined to be 2.8 nm by using the height line profiles across 3L and tL (Fig.S2),while the thickness of 1L can be determined to be 1 nm,which agree well with the literatures.[10,36]By combining the optical,height and phase images, this ReS2flake can be quarantined into areas with different layer thickness shown in Fig.1(b).
A CPD image of the ReS2area corresponding to Fig.1(b)is presented in Fig.1(c).The 1L area has highest CPD as 0.31±0.02 V.For 2L, 3L and tL, their CPDs gradually decrease to 0.24±0.01 V,0.23±0.01 V and 0.22±0.01 V,respectively.The Fermi level (Ef) of 1L, 2L, 3L and tL can be calculated to be 4.59±0.02, 4.66±0.01, 4.68±0.01 and 4.68±0.01 eV,respectively,by using the equation[37]
whereΦA(chǔ)uis the work function of Au tip (4.9 eV).The measured values of ReS2thin layers are in good agreement with the theoretical value (4.63 eV) obtained using the DFT calculation.[38]
Zoomed-in topographic and CPD images of a 3L area marked in Fig.1(c) are shown in Figs.1(d) and 1(e), respectively.Due to the large particle size (averaged diameter~70 nm)and high roughness(RMS roughness,RMS=3.1 nm)of the gold particles,the ReS2area also gives large roughness of RMS=1.9 nm(Fig.S3).This indicates the 3L ReS2bends into bubbles in order to follow the roughness of the gold particles.The bubble like feature is much clear at the edge of this ReS2flake (Fig.S3).When the ReS2thin layer forms a bubble-like structure covering gold particles, biaxial strain is expected to be generated.For a bubble with a heighthand a diameterR, the biaxial strain at the crest can be calculated using the equation[39,40]
whereδ(ν)is a parameter that only depends on Poisson’s ratioν.For ReS2with an averageν=0.225,[41]δ(ν)can be set to be 0.6.The strain distributions of the bubbles are also calculated based on the membrane theory of solid mechanics[42](Note 1 in the supporting information), which is exemplified in Fig.S4.
In the CPD image shown in Fig.1(e), the CPD value at the valley of bubbles is hard to be determined due to large noise.Moreover, the low spatial resolution of KPFM scan(49.6±18.9 nm,Fig.S5)also inhibits the accurate imaging of the CPD distribution in the whole ReS2bubble area.Luckily the CPDs at crest of some bubbles can still be obtained.The CPDs at crests 14 bubbles(see Figs.S6a and S6b for their locations)were measured and plotted as a function of their strain calculated using Eq.(2),as shown by scatters in Fig.1(f).The CPD as a function of strain at the crest of bubble calculated based on the membrane theory are also plotted as scatters in Fig.1(f), which agrees well with the calculated results using Eq.(2)when strain>0.2%,indicating the validity of the calculations using Eq.(2).These CPDs can be well fitted by a 4thorder polynomial function of strain as follows:
The fitted data is plotted as a solid line in Fig.1(f).Best fit gives a V-shape curve with the minimum CPD at strain of 0.2%.The trend of the CPD–strain curve in strain>0.2%agrees well with that of ReS2bubbles reported by Longet al.[43]The measured CPD of ReS2is inversely proportional to its Fermi level, which has been defined aswhereEc(Ev) andmdp(mde) are the energies of conduction band minima (valence band maxima) and effective mass of hole(electron)at theΓpoint of the first Brillouin zone.[44]According to the previous reports,[45,46]Ec,Ev,mdpandmdeare all dependent on the loaded strain.Detailed quantitative analysis of the V-shape relationship betweenEfand strain needs to further consider the in-plane anisotropic electronic properties, which is still ongoing and will be reported in the near future.It should be noted that the relationship of Eq.(3) is obtained by using the strain and CPDs at crests of the bubbles.Because the strain varies from the bottom to the crest of a bubble,the local strain induced CPD variation in the whole area of a bubble cannot be directly obtained by Eq.(3).
ReS2belongs to thePgroup.Bulk ReS2has 36 phonon modes including 18 Raman active Agmodes, 15 infrared active Aumodes and 3 acoustic Aumodes.[47]Raman spectra of 1L, 2L, 3L and tL ReS2are plotted in Fig.1(g).Six Raman peaks between 100 cm-1and 250 cm-1can be assigned to Agmodes annotated as A1(~137 cm-1), A2(~143 cm-1), A3(151 cm-1), A4(161 cm-1), A5(212 cm-1)and A6(235 cm-1), of which the peak positions agree well with the reported data.[47,48]Raman peak positions of A3,A4and A5modes as a function of layer numbers are plotted in Fig.1(h).All these three modes redshift for~0.5 cm-1from 1L to tL, which is in agreement with the results reported in the literature[10,49]and can be correlated to the plane bond length contraction and lateral deformation caused by interlayer coupling.[50]
The optical configuration of the TERS setup is shown by a scheme presented in Fig.2(a).Briefly, a He–Ne laser(632.8 nm)is focused onto the apex of a plasmonic gold coated silicon probe at an angle of 30?via a long working distance lens(see experimental section for details).1L,2L and 3L areas were moved to the TERS probe by a piezostage.The obtained tip-in[containing near field(NF)and far field(FF)]and tip-out (FF) Raman spectra are plotted in Fig.2(b).Because the 150/mm grating gives a spectral resolution of~4 cm-1,fine Raman peaks in Fig.1(g)cannot be fully scrutinized.The Raman band B1 at~150 cm-1is predominantly merged by A3and A4peaks,while band B2 at~220 cm-1was merged by Raman peaks of A5and A6(see Fig.S7 for the deconvolution of B1 and B2 bands).The TERS spectra of ReS2exhibit a layer number and peak dependent enhancement.Single-layer ReS2has the strongest enhancement for B1 and B2 bands.The enhancement roughly decreases as the layer number increases from 1L to 3L.However, for thick layer, the enhancement of B1 and B2 becomes slightly larger than that of 3L.The enhancement contrasts of different layers can be calculated by usingC=(Itip-in-Itip-out)/Itip-out,[51]whereItip-inandItip-outare intensities of Raman bands B1 and B2 measured at tipin and tip-out, respectively.The calculated contrasts of B1 and B2 bands of different layers are plotted as opened circles in Fig.2(c).For 1L the contrasts of B1 and B2 are calculated to be 0.76 and 0.23, respectively; while for 3L, the contrasts of B1 and B2 decrease to be 0.04 and 0.15, respectively.The enhancement factors are further calculated by using EF=C×D2focus/d2tip, whereDfocusanddtipare diameters of laser focus and TERS spatial resolution,[52]and can be set to be 1000 nm and 10 nm,[30]respectively.In a TERS system operated in gap mode, the TERS intensity decays exponentially with the increasing distance from tip apex to the metallic thin film.As the layer thickness of ReS2increases, the gap size is also enlarged, which decreases the enhancement factor.[31]An exponential decay function of enhancement factor,EF ∝e(d-d0)/D,in whichDis a parameter that quantifies the enhanced optical field confinement at the tip apex along the longitudinal direction of the tip axis,[53]is used to fit the enhancement factor of ReS2B1 band as a function of layer thickness.Best fitting yields a decay constantDof 0.88 nm,which is very close to the thickness of 1L(Fig.S8).
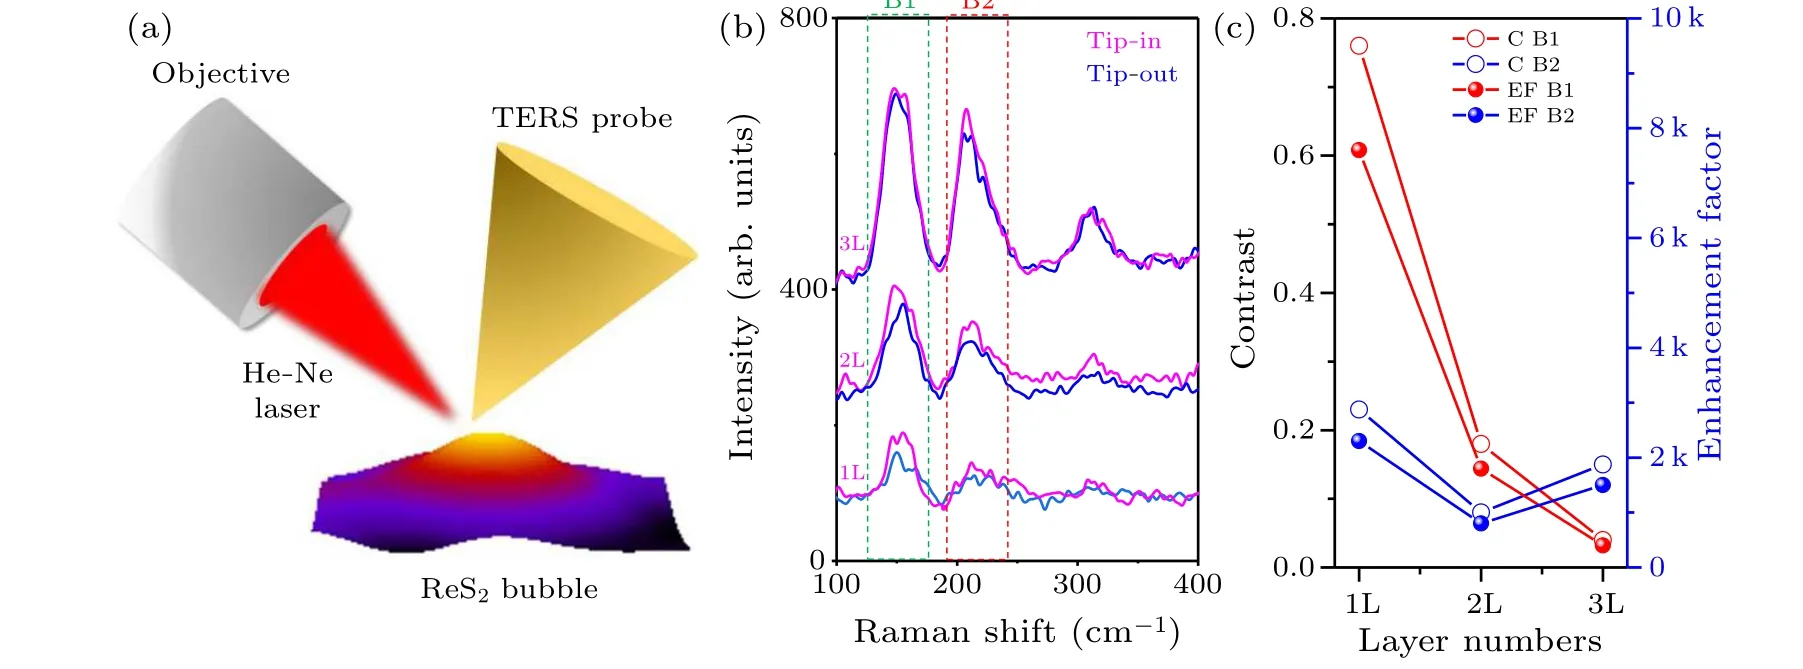
In further TERS analysis of ReS2,the strain induced relative peak intensity change and peak shift need to be considered.Liet al.[54]calculated the Raman intensity of A3and A4using the density function theory(DFT)and indicated that their intensity ratio can be enlarged fromIA3/IA4<1 to>1 either at tensile or at compressive strain.In the case of strong TERS enhancement like 1L ReS2, this would not give strong influence.However, in the case of weak TERS enhancement obtained for 3L ReS2, the local strain induced peak intensity ratio change may be larger than that of enhancement.The unusual stronger enhancement of Raman band B2 than that of B1 shown in Fig.2(c)is supposed to be induced by this factor.
In TERS analysis of strained ReS2,peak shift also needs to be considered.In a usual TERS enhancement analysis in which the peak shift is negligible, a pure NF signal is easily obtained by subtracting the FF signal from the NF [see the simulation shown in Figs.3(a) and 3(b)].For a local biaxial strain existing on a ReS2bubble,Raman peaks A3and A4are supposed to shift referring to their far-field positions.In the case of weak enhancement, either red shift (RF) or blue shift (BF) of NF signal causes a distorted Raman peak when subtracting the FF from the NF [see the simulation shown in Figs.3(a)and 3(b)].The position of the positive peak can still be used as the peak position of the pure NF signals for further calculations,which only gives negligible errors.
The Raman signal of 1L and 2L ReS2is much weaker than that of 3L ReS2[Fig.2(b)], indicating that much longer exposure time is needed at each pixel to get useful TERS spectra.Notably, tL ReS2has strong Raman signals, whereas the enhancement is much weaker.Therefore,TERS line scan was conducted on 3L so as to balance the TERS enhancement and the exposure time.An AFM topographic image of a 3L ReS2area is presented in Fig.3(c).TERS line scan was conducted in the marked area of Fig.3(c).The scanned area is 200×20 nm with 20×2 pixels.The obtained TERS spectra are stacked and shown in Fig.3(d).Compared to the peak position measured at the bottom of the bubble, both Raman peak A3 and A4 redshift by 0.5–1 cm-1at the crest of the bubble.The second line scan (line 2, from pixel 21 to 40) shows similar red shift analogy to the first line scan(line 1, from pixel 1 to 20),indicating the reproducibility of the measurements.In the measured bubble area,no defects or impurities can be seen either in AFM height[Fig.3(c)]or in CPD images.Therefore,the Raman shift can be attributed to the bubble induced strain rather than impurities or defects.The A3, A4and A5peak positions of the scanned pixels are obtained by fitting the subtracted NF spectra using Lorentzian functions and plotted as scatters in Fig.3(e).These TERS peak positions as a function of positions across the bubble are further fitted by quadratic polynomial functions,as shown by solid lines in Fig.3(e).
The strain induced Raman peak shift can be expressed as[55–57]
whereω0is the Raman peak position at zero strain, which was determined from ReS2flakes mechanically exfoliated on SiO2(300 nm)/Si substrates;γis Gr¨uneisen parameter;εrandεθare the strains along radial and circumferential directions,respectively.
The loaded forceFleading to the radial and circumferential strains can be expressed as[56]
whereEis Young’s modulus,dis the thickness of the flake.With Poisson’s ratioν=0.225,εris calculated to be 8.6 times larger thanεθ.Therefore,for a ReS2bubble the radial strain is predominant,while the circumferential strain is negligible and can be neglected.
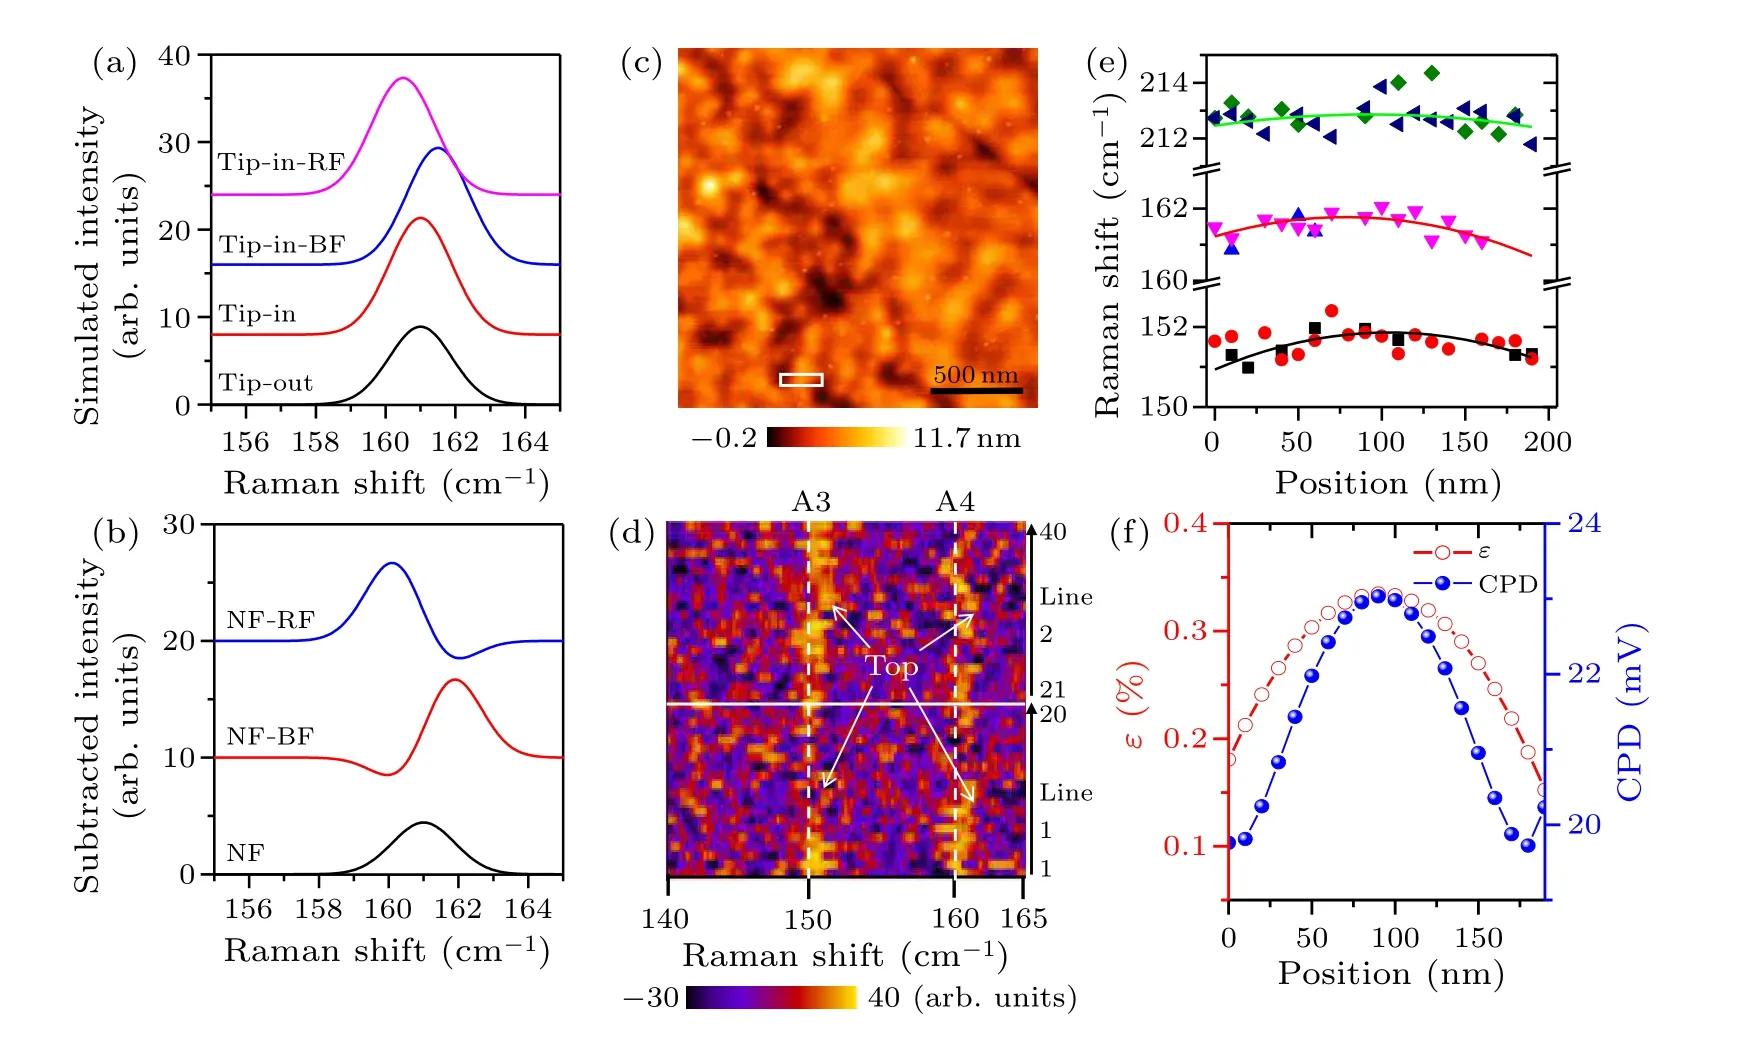
According to the theoretical calculations,theγvalues for A3, A4, and A5peaks are 1.4, 1.3, and 2.8, respectively.[58]The strains at different positions across the ReS2bubble can be calculated through Eq.(4) by using Raman peak shifts of A3, A4and A5.The obtained strains using A3, A4and A5peaks are averaged to eliminate the random errors, which are further plotted in Fig.3(f).The largest tensile strain of 0.34%is seen at the crest of the bubble, while the smallest tensile strain of 0.18%is seen at the bottom of the bubble.
Using this strain distribution curve as the working curve,we calculate the CPD as a function of position by employing Eq.(3),as plotted in Fig.3(f).It is worth noting that the spatial resolution of CPD calculated using Raman shift is strongly dependent on the pixel size of TERS line scan.The typical spatial resolution of our TERS system is better than 10 nm,indicating that the spatial resolution of this method is also better than 10 nm.Such a spatial resolution is~5 times better than that of the KPFM measurement.The localized electronic properties of other TMDs are expected to be measured at nanoscale by using this method.
4.Conclusions
In summary, we have proposed to characterize localized electronic properties of a ReS2thin layer by combining TERS with conventional KPFM measurement.The strain at different positions of a ReS2bubble can be obtained from the TERS peak shift by using Gr¨uneisen relationship.The local CPD at nanoscale is further obtained by using the strain-CPD relationship obtained via conventional KPFM instrument.The spatial resolution of the proposed method only depends on the spatial resolution of TERS and can be potentially improved to be several nanometers,which is<1/5 of that of conventional KPFM measurements.It is worth noting that this method is also applicable to other 2D materials in which local strain is the major factor modulating the localized electronic properties.This method breaks the spatial resolution limitation of conventional KPFM measurement and paves the way of characterizing the localized electronic properties with an alternative optical spectral method.
Acknowledgments
Project supported by the Zhejiang Provincial Natural Science Foundation of China (Grant No.LZ22A040003) and the National Natural Science Foundation of China (Grant No.52027809).
猜你喜歡
小讀者·愛讀寫(2024年11期)2024-11-30 00:00:00
祝您健康(2023年9期)2023-09-05 02:06:28
故事會(2022年13期)2022-07-05 04:43:59
知音·上半月(2022年1期)2022-01-14 19:50:07
華人時刊(2020年19期)2021-01-14 01:17:04
伴侶(2017年1期)2017-01-10 17:49:49
新青年(2016年8期)2016-08-04 12:30:54
中國社會保障(2016年1期)2016-02-09 16:12:06

- Chinese Physics B的其它文章
- The application of quantum coherence as a resource
- Special breathing structures induced by bright solitons collision in a binary dipolar Bose–Einstein condensates
- Effect of short-term plasticity on working memory
- Directional-to-random transition of cell cluster migration
- Effect of mono-/divalent metal ions on the conductivity characteristics of DNA solutions transferring through a microfluidic channel
- Off-diagonal approach to the exact solution of quantum integrable systems