
Plant Proteins Are Smaller Because They Are Encoded by Fewer Exons than Animal Proteins
2017-01-11 01:49:50ObedRamrezSanchezPaulinoPerezRodrguezLuisDelayeAxelTiessen
Obed Ram?′rez-Sa′nchezPaulino Pe′rez-Rodr?′guezLuis Delaye Axel Tiessen*d
1Genetic Engineering Department,CINVESTAV Unidad Irapuato,Irapuato,CP 36821,Mexico
2Colegio de Postgraduados,Campus Montecillo,Texcoco,CP 56230,Mexico
Plant Proteins Are Smaller Because They Are Encoded by Fewer Exons than Animal Proteins
Obed Ram?′rez-Sa′nchez1,a,Paulino Pe′rez-Rodr?′guez2,b,Luis Delaye1,c, Axel Tiessen1,*,d
1Genetic Engineering Department,CINVESTAV Unidad Irapuato,Irapuato,CP 36821,Mexico
2Colegio de Postgraduados,Campus Montecillo,Texcoco,CP 56230,Mexico
Digital proteome;
Eukarya;
Evolution;
Viridiplantae;
Polypeptide length
Protein size is an important biochemical feature since longer proteins can harbor more domains and therefore can display more biological functionalities than shorter proteins.We found remarkable differences in protein length,exon structure,and domain count among different phylogenetic lineages.While eukaryotic proteins have an average size of 472 amino acid residues(aa), average protein sizes in plant genomes are smaller than those of animals and fungi.Proteins unique to plants are~81 aa shorter than plant proteins conserved among other eukaryotic lineages.The smaller average size of plant proteins could neither be explained by endosymbiosis nor subcellular compartmentation nor exon size,but rather due to exon number.Metazoan proteins are encoded on average by~10 exons of small size[~176 nucleotides(nt)].Streptophyta have on average only~5.7 exons of medium size(~230 nt).Multicellular species code for large proteins by increasing the exon number,while most unicellular organisms employ rather larger exons(>400 nt).Among subcellular compartments,membrane proteins are the largest(~520 aa),whereas the smallest proteins correspond to the gene ontology group of ribosome(~240 aa).Plant genes are encoded by half the number of exons and also contain fewer domains than animal proteins on average.Interestingly, endosymbiotic proteins that migrated to the plant nucleus became larger than their cyanobacterial orthologs.We thus conclude that plants have proteins larger than bacteria but smaller than animals or fungi.Compared to the average of eukaryotic species,plants have~34%more but~20%smaller proteins.This suggests that photosynthetic organisms are unique and deserve therefore special attention with regard to the evolutionary forces acting on their genomes and proteomes.
Introduction
The biological function and the physical structure of proteins are mainly infuenced by their primary structure,i.e.,the total number,composition,and order of amino acid residues(aa). The chemical environment also affects the structure of a folded polypeptide,but the primary sequence is crucial for obtaining a fully functional protein.Short proteins(<200 aa)usually have limited functionalities while long proteins(>500 aa)have more options for accommodating multiple secondary structures and therefore more functional and regulatory domains [1-3].A positive exponential relationship between protein length(PL)and number of domains(ND)has been reported for animal proteins[4].
There are signifcant differences in protein length among the different domains of life.Eukaryotic proteins are on average longer than bacterial proteins,and these in turn are longer than archaeal proteins[5-7].Furthermore,eukaryotic genomes contain~7-fold more proteins that are on average~48%larger than bacterial ones[7].There are also differences in average protein sizes among eukaryotic taxa.A negative correlation was found between protein number and protein size,revealing domain fusion and protein splitting events occurring in different eukaryotic proteomes[7].In contrast, protein number and protein size are positively correlated within bacterial genomes[7].The causes of protein length variability among eukaryotic phylogenetic groupsare yet unknown.However,several evolutionary processeshave shaped protein length:(1)endosymbiosis and migration of bacterial genes into the nucleus[8];(2)genome duplication leading to polyploidy[9,10];(3)genomic reduction and selective gene loss[11];(4)fusion of single-function proteins into multi-domain proteins[5];(5)horizontalgene transfer [12,13];(6)intron gain and/or exon loss[7,14,15];and(7)evolution of multi-domain proteins[4,16,17].
Each process has a distinct effect on the proteome(the sum of all encoded polypeptides in a genome).For example,chromosomal or genome duplications increase the total number of proteins without altering average protein size.However,long proteins(more complex genes)are more likely to be retained after whole genome duplication,probably because they are more prone to subfunctionalization and neofunctionalization [18].On the one hand,transposon insertions and gene splitting increase the number of proteins but reduce average protein size.On the other hand,gene fusion reduces the number of proteins but increases average protein size(merged multidomain proteins).There is evidence supporting that those balancing processes indeed occur in both directions as demonstrated by the signifcantnegative correlation between protein size and the total number of proteins in eukaryotic genomes[7].
Plants are special eukaryotes since they are autotrophic.In comparison to fungal and animal cells,plants possess an additional cell organelle,the chloroplast,which hosts many of the unique features of photosynthetic organisms.In this article we address the following questions.(1)Are proteins from plants larger or smaller on average when compared to cyanobacterial, animal or fungal proteins?(2)How is protein size in eukaryotes correlated to exon size or exon number?(3)What is the impact on protein length of bacterial gene migration from the chloroplast to the nucleus?(4)Do proteins from different subcellular compartments have different average protein sizes? In order to answer these and other similar questions,we analyzed the proteomes of eukaryotic species that were publicly available.
Results and discussion
Eukaryotic proteins show a large diversity of sizes
We determined mean and median protein length in three independent proteome datasets.Datasets 1 and 2 were manually curated as reported previously[7].Dataset 1 contains mainly fully-sequenced genomes(51 eukaryotes together with some selected prokaryotes for comparison including 24 eubacteria and 9 archaea).Their entries were fltered for nonredundancy by eliminating duplicated sequences,subsequences,alternative splicing variants,and transposons[7]. Dataset 2 was constructed from genomes available in Kyoto Encyclopedia of Genes and Genomes(KEGG)database and contains 97 archaea,1205 bacteria,and 140 eukaryotes[7]. Dataset 3 covering a wider taxonomic range of eukaryotic species was constructed from the RefSeq release 70(see Methods) without being fltered for redundancy.It contains 492 eukaryotes from most branches of the eukaryotic tree of life(Table 1). Boxplot analysis of the curated dataset 1 revealed that archaeal and bacterial species display a narrow range of average sizes,whereas eukaryotic species have a wider range of variation(Figure 1).Genomes from prokaryotes had smaller proteins(<350 aa)than genomes from eukaryotes(>400 aa) in both datasets 1 and 2.Green plants have an average protein size that is between that of bacteria and that of nonphotosynthetic eukaryotic species(Figure 1).These results were consistent across datasets 1,2 and 3,thus demonstrating that the statistical analyses on incomplete genomes(datasets 3) are robust and minimally affected by diverse mathematical artifacts resulting from alternative splicing and limited sampling size(see Methods).Moreover,this allowed us to generalize the overall conclusion:there are remarkable differences in average protein length between prokaryotes and eukaryotes (Figure 1).
Protein length in plants is intermediate between bacteria and animals
Inspection of the proteomes from datasets 1 and 2 indicated that there were large differences in protein length across the domains of life(Figure 1)[7].Statistical analysis of the proteomes from dataset 3 indicated that there were also signifcant differences in protein length between several eukaryotic groups (Table 2).Average and median protein sizes were relatively conserved among closely-related evolutionary lineages,so that differences across taxonomic groups resulted to be highly signifcant(P<0.05;Table 2).Therefore,we grouped the organisms into the main taxonomic clades according to modern versions of the eukaryotic tree of life[19-21].Figure 2 shows comparisons ofprotein length between 14phylogenetic groups.Proteins in the Opisthokonta clade had the largest length among the eukaryotes.Among them,Ichthyosporea, Nucleariida,and Choanofagellida had longer proteins than Metazoa,which in turn had longer proteins than Fungi(Figure 2).Protein length in the Archaeplastida clade(Rodophyta,Chlorophyta,and Streptophyta)was smaller than that in the Opisthokonta clade(Figure 2 and Table 2).Finally,Cryptophyta and Haptophyta groups had the smallest mean and median protein length among eukaryotes(Figure 2 and Table 2). Clearly,there are signifcant differences(P<1E-16)in protein size between plants,fungi,animals,and other eukaryotes. Taken together,results from all our 3 datasets indicated that plants have an intermediate size(smaller than metazoan and fungal proteins but larger than bacterial proteins).As expected from a lognormal distribution which has a long right tail[7], differences were more remarkable for the means than for the medians.

Table 1 Phylogenetic coverage and global features of proteome dataset 3

Figure 1 Variation of average protein size in dataset 1
Plants genomes code for more proteins but their proteins are of smaller size
The number of proteins in plant species(36,795 on average in each genome)is greater than that in animal(25,189)and fungal species(9113)(Table 1).This indicates that compared to animals(Metazoa),plants(Streptophyta)had on average 46%more proteins(Table 1)but these proteins were of smaller size(Table 2).The average of metazoan proteins(595 aa)was 36% larger than the average of plant proteins(436 aa) (Table 2).The 90%percentile of the size of plant proteinswas in the range of 649-877 aa,whereas in animals it was in the range of 909-1125 aa.Logarithmic normalization also confrmed that proteomes of plants have a smaller group of long proteins(>500 aa)than those of animals(Figure S1).Compared to heterotrophic fungi,photosynthetic organisms (Archaeplastida)also have smaller protein sizes(Figure 2).

Table 2 Protein size,exon size,and exon number in proteome dataset 3

Figure 2 Protein length across the eukaryotic tree of life in dataset 3
We found it remarkable that plant proteins were signifcantly smaller than animal and fungal proteins(Figures 1 and 2;Table 2),which prompted us to explore the possible causes.A more detailed comparison among photosynthetic organisms revealed differences also among plant subgroups (P<0.01).Greenalgae(Chlorophyta)had66% fewerproteins but their proteins were 12%larger on average than other plant groups(Streptophyta and Rhodophyta)(Tables 1 and 2).The red algae Cyanidioschyzon merolae also had fewer but on average larger proteins(5002 proteins of size~504 aa) than vascular plants(>20,000 proteins of size~436 aa).The monocot species such as Oryza sativa(379-448 aa),Zea mays (345-402 aa),Sorghum bicolor(361-418 aa),and Brachipodium distachyon(428-457 aa),had slightly larger proteins than the dicot species,including Carica papaya(~296 aa),Medicago truncatula (245-295 aa),and Populus trichocarpa (375-390 aa)in terms of the range of mean values in the 3 different datasets.Interestingly,despite having a compact genome,average protein size in Arabidopsis thaliana(403-410 aa)was not particularly small compared to other plants.This indicates that intergenic DNA can be expanded or contracted by several evolutionary forces without affecting average protein sizes.Arabidopsisisthebestannotated plantgenomeand the calculated average protein size of 410 aa is larger compared to other plant genomes that have been less well annotated (e.g.,barrel clover or papaya with~296 aa).This observation supports the hypothesis that the distribution of protein sizes changes from an initially monotonic decrease function(due to random open reading frames)to a gamma function(sharp starts in the range of 1-100 aa)and then fnally to a lognormal distribution(soft starts from 1 to 100 aa)as the genomes evolve or become better annotated[7].
In order to check whether proteins unique to plants are shorter than plant proteins conserved among other eukaryotic lineages,we consulted the Plant Specifc Database(PLASdb) [22].We extracted the gene IDs of the 3848 Arabidopsis genes that are unique to plants and analyzed the protein length distribution of that subset.On the one hand,size of the plant-specifc proteins(medianof282 aaandmeanof321 aa)wassignifcantly smaller(Wilcox test,P<0.001)than that of the whole Arabidopsis proteome(median of 346 aa and mean of 402 aa)and the Streptophyta pan-proteome(median of 363 aa and mean of 436 aa)(Table 2).On the other hand,the size of Arabidopsis proteins shared among multicellular eukaryotes,e.g.,plants and Metazoa(median of 392 aa and mean of 458 aa)was significantly larger(Wilcox test,P<0.001)than that of Arabidopsis and Streptophyta(Table 2).There is a signifcant(P<0.01) length difference of64-81 aa between plant-specifc or cyanobacterial proteins and plant proteins that have orthologs in animals.These data suggest that protein size varies according to the phylogenetic lineage,evolutionary history(Figures 1 and 2),biological function,and cellular organization.
In order to identify the factors that determine the smaller average size of plant proteins compared to animals and fungi, we tested four possible explanations,including transposons, endosymbiosis,subcellularcompartmentation,and exon structure.
Mathematical artifacts due to transposon cannot explain the differences
The frst and simplest explanation is a numerical artifact due to the high abundance of small transposons in plant genomes [23,24].The size distribution of proteins can be accurately approximated by several probabilistic models,with gamma (with unrestricted shape parameter)and the lognormal models [7]as the best ft.Instead of only comparing a single value(e.g., mean or median),we mathematically modeled the distribution curves and calculated all percentiles in order to confrm the differences across species.Such approach allows to group samples according to the statisticaltestof Kruskal-Wallis (Table 2).Manual data curation and exhaustive statistical analysis,such as removal of protein redundancy(e.g.,dataset 1)and elimination by keywords in annotations(e.g.,dataset 2), led us to exclude that the results were due to the frequent appearance of only one type of protein(transposon or retroelements).We found instead a systematic shift in protein sizes across the whole range(Figure S1).
We also found that alternative splicing only marginally affected the average or median length of the proteins(Table 2 and data not shown).Similar results were obtained for given taxonomic groups no matter protein redundancy was fltered out or not(e.g.,datasets 1 vs.3).The explanation may be simple:splicing may be universal in all eukaryotes and occurs regardless of fnal protein size[25-29].There is no bias for alternative splicing to occur only in very small proteins or only in very large proteins[30,31].
Did endosymbiosis reduce the average size of plant proteins?
The second possible explanation as to why proteins are smaller in plants could be the acquisition of thousands of genes from chloroplasts after endosymbiosis.Two facts could support this hypothesis:the frst one is that cyanobacterial proteins are smaller than those of eukaryotes[7],and the second one is that cyanobacteria are the ancestors of plastids in the Viridiplantae and Streptophyta groups[32].Therefore,the intermediate size of plant proteins might arise from a massive migration of small proteins from bacterial origin(chloroplast)to the eukaryotic nucleus[33],reducing the overall average size by a dilution effect.
Based on previous data[7],an intuitive explanation can be as follows:after endosymbiosis,migration of an estimate of 3500 cyanobacterial proteins of~319 aa in length to a hypotheticalancienteukaryote having ~22,900 proteins of~472 aa in length would lead to a new eukaryote having average protein length of~451 aa.However,that size is still in the range of protein size in animals and fungi.Therefore such postulation cannot explain the results observed for plants.
To follow a more robust approach,we compared protein size between Arabidopsis nuclear proteins and their cyanobacterial orthologs.According to previous studies[8,34,35],genes transferred from chloroplasts to the nucleus can be identifed by constructing phylogenetic trees containing both eukaryotic and prokaryotic homologs and then looking for trees in which Arabidopsis and cyanobacteria branch together.The average protein length for three selected cyanobacteria(Nostoc sp. PCC7107,Prochlorococcus marinus,and Synechocystis sp. PCC 6803)was 314 aa,whereas the average length for Arabidopsis nuclear proteins was 406 aa.Similar to previous studies[8,34,36],we identifed 1339 putative Arabidopsis nuclear proteins of cyanobacterial origin.Those endosymbiotic proteins had an average size of 473 aa,which was signifcantly larger than the average size of their cyanobacterial orthologs (314 aa;Paired Wilcox test,P<0.001)and also larger than the average size of all Arabidopsis proteins(406 aa).Therefore, these results clearly exclude the‘bacterial gene migration”hypothesis as the explanatory cause for the average smallersize of plant proteins.On the contrary,gene migration from the chloroplast genome to the nuclear genome led to a slight increase of protein size.On average,endosymbiotic plant proteins were~159 aa larger than the cyanobacterial orthologs, possibly arising from the need for additional regulatory domains[5,37].Therefore,the endosymbiotic origin of plastids cannot account for the shorter average length of proteins within all Streptophyta species.
The average size of proteins varies according to cellular compartmentation
The third possible explanation as to why plant proteins are smaller than Metazoa or Fungi could be their localization in different cellular organelles.Compared to animal and fungal cells,plants have additional subcellular compartments,e.g., chloroplast,vacuole,and specialized peroxisomes.It is not known whether cell subcompartmentalization signifcantly affects the size distribution of proteins in eukaryotic species. In order to answer this question,we calculated the median and average size of proteins localized in different subcellular compartments.For this purpose,we analyzed the Arabidopsis genome using the Gene Ontology(GO)Slim classifcation of cellular component.It must be noted at this point that the proteolytic shortening of proteins,e.g.,due to subcellular import into chloroplasts,was not accounted for in this study since our aim was not to analyze the fnal sizes of the processed polypeptides,but rather the protein lengths as defned by the nuclear DNA-encoded proteome of each subcellular compartment.Therefore,the requirement for transit peptides(size~10-50 aa)should increase protein size(difference of digital proteome compared to the physical processed end proteins).
The median and average size of proteins grouped by GO categories was signifcantly(P=2.2E-16)different for various compartments in Arabidopsis(Table 3).The largest proteins were the membrane proteins(plasma membrane,Golgi apparatus,and other membranes GO groups),whereas the smallest proteins corresponded to the GO groups of ribosome, unknown cellular component,endoplasmic reticulum(ER) and extracellular proteins(Table 3).There were no signifcant size differences among cytosolic,plastidial,nuclear and mitochondrial proteins(Table 3).These data suggest that the presence of transit peptides in chloroplast genes(~10-50 aa)did not signifcantly increase average protein size compared to cytosolic proteins(without targeting signals).Plastidial proteins were neither particularly large nor small compared to other proteins.Similar results were obtained for mean and median protein sizes in rice according to GO grouping(data not shown).
Overall,these results do not support the hypothesis that the smaller average size of plant proteins is caused by prevalence of plastidial proteins in comparison to animal cells that lack chloroplasts.Plants might have fewer membrane proteins(of large size;>500 aa)but instead have more ribosomal,vacuolar,extracellular,and unknown proteins(of small size;<250 aa)compared to fungi and animals.In order to clarify this possibility,we analyzed protein compartmental distribution in other model organisms after grouping into GO categories.Since GO slim categories were not available for animal genomes,we used the Map2Slim script to map Homosapiens GO to GO slim generic annotation.We frst compared a model plant(Arabidopsis,Table 3)to the human genome(Table 4).Our data showed that protein lengths were mostly smaller in plants than in humans.Comparison of protein size medians from different cellular components in Arabidopsis and humans,such as the extracellular matrix (400 aa vs.755 aa),Golgi(431 aa vs.495 aa),cytoplasm (348 aa vs.491 aa),cytosol(367 aa vs.451 aa),nucleus (325 aa vs.472 aa),indicated larger proteins in Metazoa.Proteins from mitochondria(341 aa vs.312 aa)and ribosome (206 aa vs.180 aa)were roughly similar in both species. Proteins from 6 out of 11 GO cellular component categories were larger in humans than those in Arabidopsis,whereas no GO category contained signifcantly larger proteins in plants.
We also compared proteins from Arabidopsis(Table 3)with those from a model fungus,Baker’s yeast(Table 5).Membraneproteins are larger in comparison to ribosomal proteins (Tables 3-5).Membrane proteins accounted for 16.4%of total proteins in Arabidopsis and 20.5%in yeast,whereas ribosomal proteins accounted for 1.1%of total proteins in Arabidopsis and 2.5%in yeast.This revealed that the number of proteins (as percentage basis)falling within a GO cellular component category had a rather modest impact on average protein size. Plants have not a higher percentage of small ribosomal proteins compared to yeast(Tables 3 and 5).Instead,proteins belonging to a specifc GO cellular component category were mostly larger in the fungal(Table 5)than in the plant species (Table 3;Figure S2).In total,9 out of 11 GO cellular component categories contained larger proteins in yeast,while the remaining 2 categories(unknown and ribosome)behaved similarly in both species and no GO category contained larger proteins in the plant.

Table 3 Size of Arabidopsis proteins in different cell components

Table 4 Size of human proteins in different cell components
Overall,the data indicate that across different subcellular compartments,proteins from plants are in general smaller than human and yeast proteins(Tables 3-5;Figure S2).
Protein length is related to exon structure
The fourth possible explanation is the nature of eukaryotic genes being divided into introns and exons,whereas exons can sometimes correspond to specifc protein domains.It can be intuitively postulated that protein length would be strongly affected by the exon features.We therefore analyzed average exon length and average exon number per gene in all the eukaryotic genomes of datasets 1 and 3.For dataset 1,average exon length in nucleotides(nt)was obtained by averaging length of all exons from each gene frst,and then calculating a global average across all genes of each species and then the mean exon length was plotted against the mean protein length (Figure 3).For dataset 3,average exon length was calculated for 492 species without prior averaging(Figure 4).Table 2 shows summary statistics of protein length,exon number, and exon length in each of the 14 phylogenetic groups of dataset 3.
Most animal species had proteins with~10 exons of average size~210 nt(Figures 3 and 4).Plants had genes with fewer exons(4-6 per protein)but the mean exon length was larger (~380 nt)(Figure 3).All animal and plant species are multicellular organisms,whereas results varied according to cellularity. Unicellular species(e.g.,Chlorophyta and Stramenopiles)had proteins encoded by an average of only~2 exons,however, their exons were much larger on average(~900 nt per exon) (Figures 3 and 4).In contrast to the small exon size of animal (176 nt)and the medium exon size of plants(230 nt)(Table 2), a high number of fungal species had large exons(~1300 nt) (Figure 4).Many unicellular eukaryotes(e.g.,Excavata,Nucleariida,Alveolata,Amoebozoa,and Rhodophyta)also had larger exons than plant species(Table 2 and Figure 4). Therefore,average protein size across all species of dataset 3 was neither signifcantly correlated to average exon number only nor to exon length only.
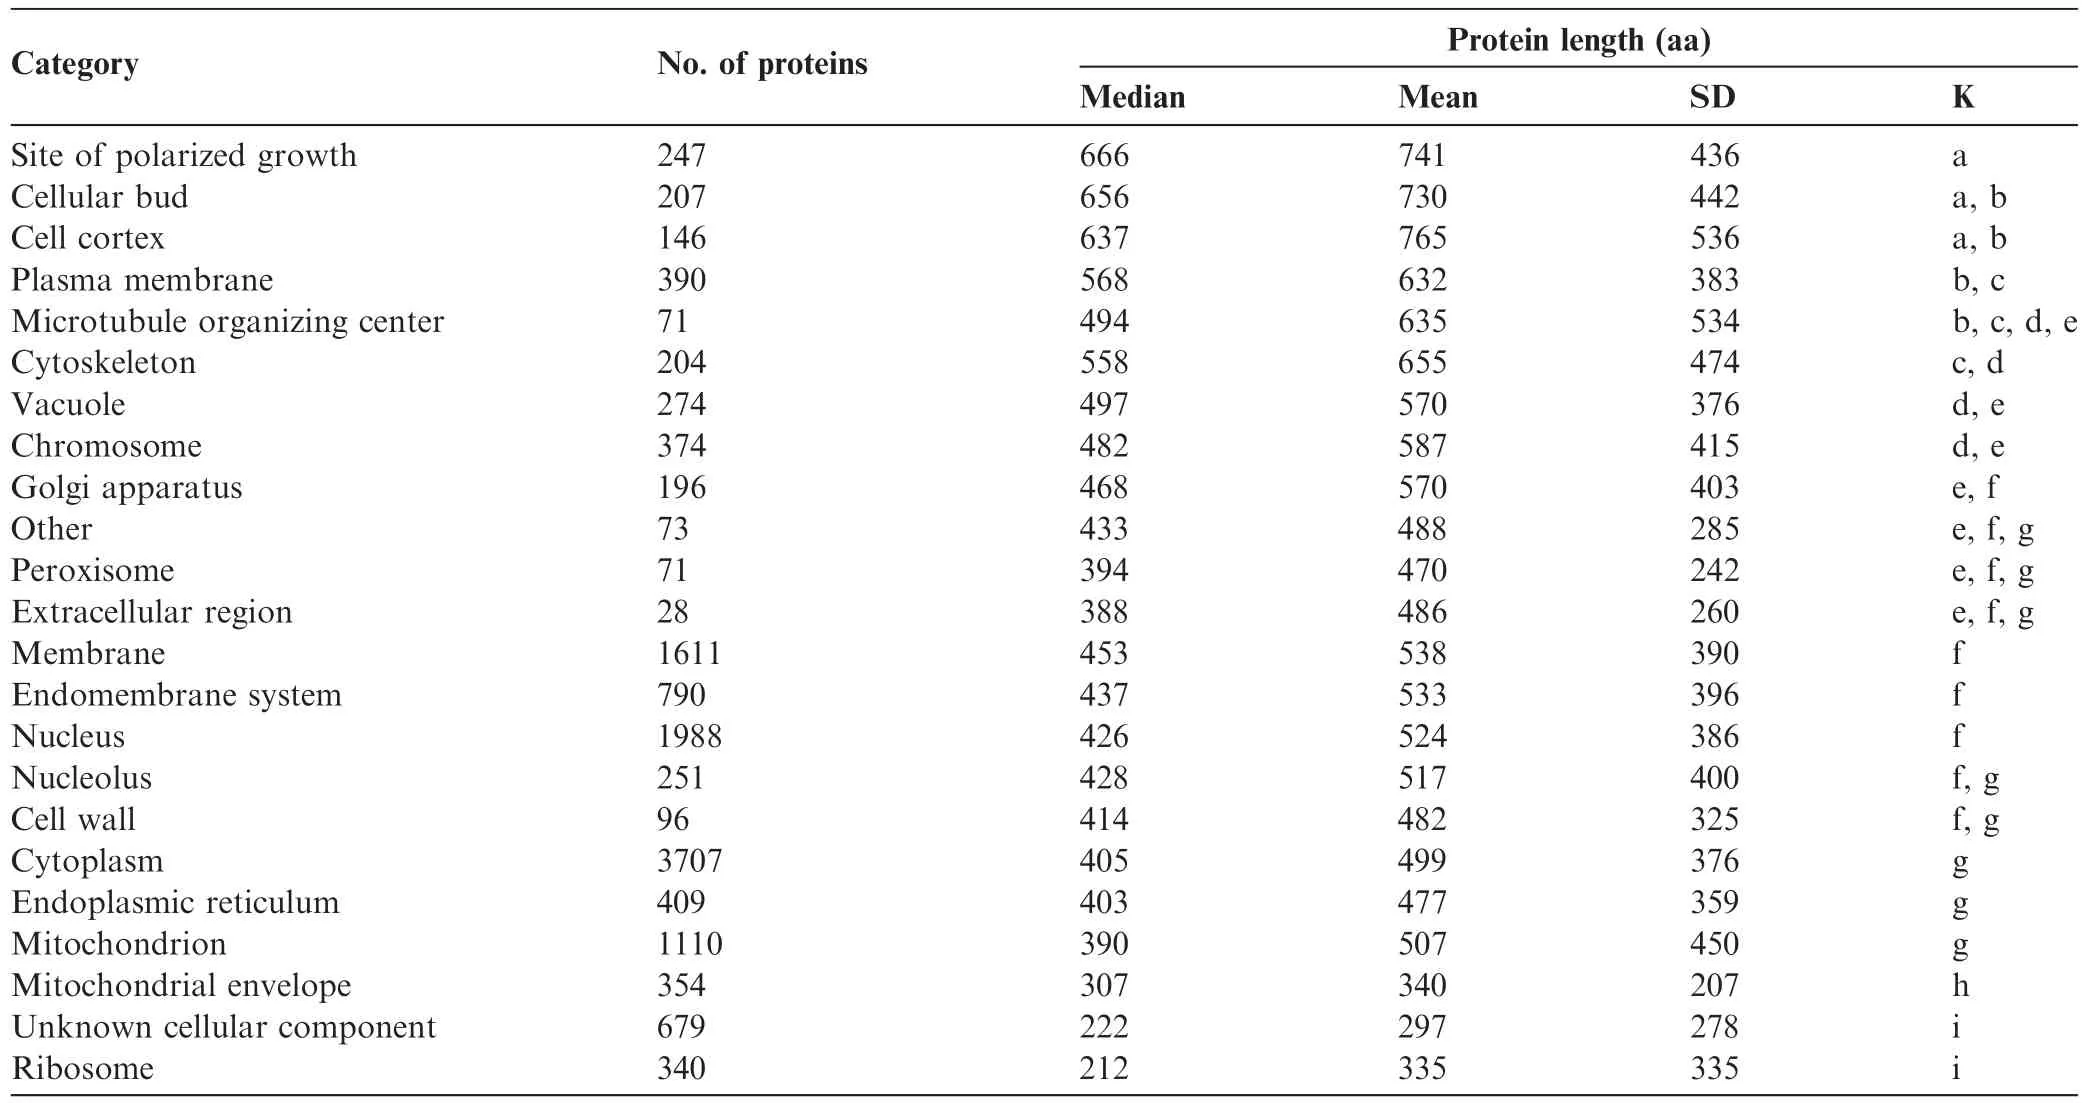
Table 5 Size of yeast proteins in different cell components

Figure 3 Relation between exon size,exon number and protein length in species of dataset 1

Figure 4 Relation between protein length and exon structure in dataset 3
There is a non-linear relationship between exon number and exon size
We then tested whether the fnal protein length would result from a factorial multiplication of both exon number and length.A curved hyperplane shows how exon length and number both contribute to protein length(Figure 5).The nonlinear relationship between exon length,exon number and protein size can be plotted in a characteristic curved hyperplane (Figure 5).
Plants have exons larger than animals but smaller than fungi(Figure 4,Table 2).The largest exons(1330 nt)were found for the Excavata group,whereas the smallest exons for the Metazoa group(176 nt)(Table 2).The biggest proteins were found for the Nucleariida group(690 aa)whereas Haptophyta group(367 aa)had the smallest proteins(Table 2,Figure 2).Different phylogenetic lineages appear to utilize one or the other strategy to attain large protein:large exons(e.g., Excavata and Rhodophyta)or numerous exons(e.g.,Metazoa and Choanofagellida)(Table 2;Figure 4).Multicellular plants rather utilize an intermediate strategy,whereas fungal species display a much wider range of strategies to attain larger proteins,both with medium(~500 nt)and large(~1500 nt)exons (Figure 4A).
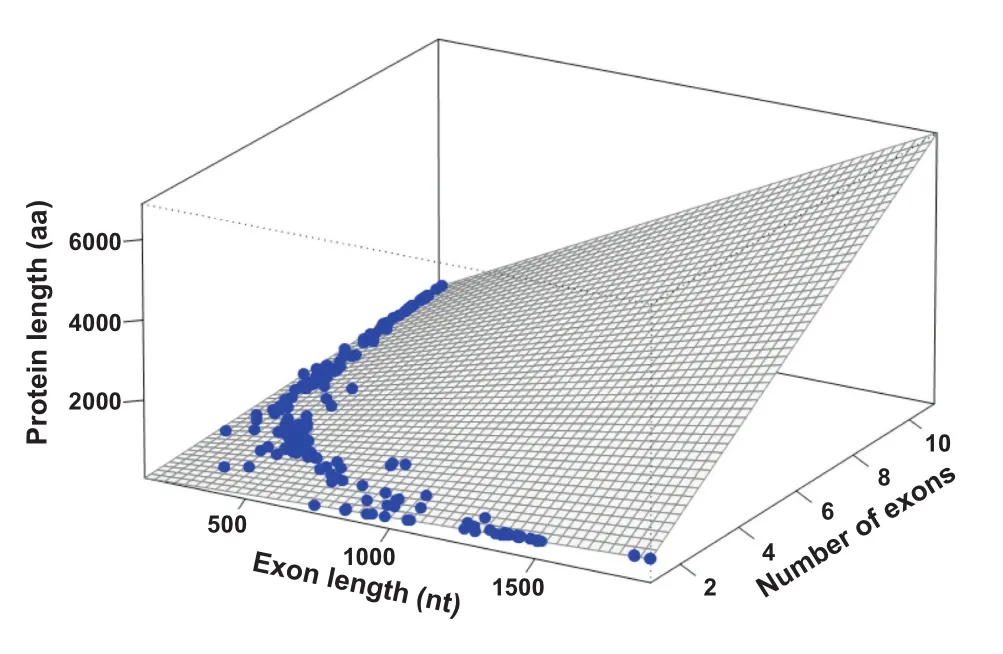
Figure 5 Linear regression model of protein length in dataset 3
A linear model explains the relationship between protein length and the exon features
A linear regression model was applied to dataset 3 considering the number and length of exons as predictors of protein length (Figure 5).Both exon length(EL)and exon number(EN)were signifcant(P<0.001;R2=0.5)in the model.When the interaction terms(EN×EL)were included in the model,the R2value was~1 which is extremely high(Figure 5).Analysis of dataset 1 yielded similar results for exon number and length (Figure 3),whereas dataset 2 lacked information on exon features.
As Felstenstein and others have pointed out,an observed correlation may be spurious if phylogenetic relationships are ignored[38-40].As a frst step to correct this bias and to perform a phylogenetical independent contrasts(PIC)analysis,we searched for small ribosomal RNA(srRNA)sequences in two curated databases named SINA and PRR2[41,42].We found 233 srRNA sequences that were present also in our dataset 3 at least at‘genus’level(see Methods).After phylogeny reconstruction by ML model,we removed 12 species from the tree because their branch lengths were zero,which is not useful for PIC analysis.Moreover,a rooted tree is mandatory to accomplish PIC analysis.Since the real root for the eukaryotes is not known yet,we used the‘midpoint root’criteria to put a root to our obtained phylogeny.This resulted in a root between Excavata and the others.Then,PIC analysis was conducted and the resulting contrast data were used to adjust a linear model.In this case,the R2obtained was only 0.67. The number of exons was highly signifcant(P=2E-6), whereas exon length(P=0.12)and the interaction term (P=0.19)were not signifcant.This clearly shows that during the course of evolution,the number of exons has been much more important to determine protein length than the size of the individual exons.

Figure 6 Number of InterPro domains per protein in an independent Pfam dataset
An average plant protein has fewer domains than an average animal protein
Results from all 3 datasets suggest that Metazoa and Fungi have both larger proteins than Streptophyta.In comparison to animal species(10.1 exons per gene),plants have 44%fewer exons per gene but 31%larger exons(Table 2).As a result, plant proteins are 27%smaller on average than animal proteins(Table 2 and Figure 2).We speculate that this may be indicative of plant proteins consisting of fewer functional domains than animal proteins.In order to test it,we counted the number of Pfam and InterPro domains per protein in 2 representative models:the human and rice genomes.Up to 35%of the human proteins contained≥4 domains,whereas only 16%of the rice proteins had≥4 domains(Figure 6). Moreover,up to 5.1%of the human proteins contained≥8 domains,whereas only 2.0%of the rice proteins had≥8 domains(Figure 6).Comparison of domain distribution histograms revealed that animals not only have larger proteins but also contain more functional domains than plants.
Conclusions

Figure 7 Comparison of proteome features between different organisms
Larger proteins can accommodate more functional and regulatory domains than smaller proteins.Plants have a higher number of coding genes than other species(Table 1),but animalproteins are larger and presumably also more complex(multidomain proteins).Plant proteins are~22%larger on average than bacterial proteins but they are also~27%smaller on average than animal proteins.We confrmed that proteins unique to plants are shorter than plant proteins conserved among other eukaryotic lineages.Through an exhaustive statistical analysis,we explored several possible explanations and ruled out that the smaller size of plant proteins was caused by cyanobacterial endosymbiosis.We demonstrated that average protein length varies according to subcellular compartment.Size differences were noted as a systematic shift across all protein lengths(Figure S1)and across several cellular compartmentsin plants,animals,and fungi(Tables3-5; Figure S2).
On the one hand,plant proteins are smaller because they are encoded by fewer exons and contain fewer domains than animal proteins.On the other hand,fungal proteins are larger than plant proteins because fungal exons are much larger on average than those of plants(Figure 7).It is open for debate whether fungal proteins are more or less complex than plant or animal proteins[29].The fact is that fungal genomes code for fewer proteins than animal or plant genomes(Table 1). We found it remarkable that myceliar or unicellular species (e.g.,Fungi,Excavata,Alveolata,and Rhodophyta)with low cellular differentiation have few but rather large exons (Table 2),whereas multicellular organisms with different types of cells,tissues,and organs(Metazoa and Streptophyta) employ many but rather small exons to code for their genes (Figure 4).It seems that unicellular undifferentiated eukaryotes(e.g.,Fungi,Excavata,Rhodophyta,and Stramenopila) are similar to prokaryotes(Archaea and Bacteria)that lack introns and thus have large exons(only 1‘exon”per gene) (Figure 7).
In summary,our modeling results expand previous studies that have suggested a positive relationship between the number of exons and protein length within a limited number of species [43].It also confrms the positive association between average protein size and average number of domains[4].Our linear regression analysis also shows that for each additional protein domain,a sequence length of~39 aa is added on average to a eukaryotic protein of size~367 aa.Therefore,the small size difference between a protein of~436 aa(e.g.,photosynthetic plant)and a protein of~595 aa(e.g.,heterotrophic animal) may determine an increase of regulatory complexity of having only 1 domain or 5 domains.Thus,the shorter length of plant proteins is not a trivial mathematical fact but may have profound biological implications.It seems that the average number of exons(and not exon length)is correlated somehow with the capacity of cellular differentiation of the organism. It is highly interesting what can be revealed by statistical analysis of the digital proteomes of the different phylogenetic lineages and we therefore recommend further investigations of plant genomes at a greater depth combining the efforts from several groups in the proteomics and evolutionary felds.
Methods
Construction and curation of datasets
Protein sequences of selected organisms from datasets 1 and 2 were obtained and curated as described previously[7].In addition,a third dataset of eukaryotic species(dataset 3)was constructed using the GenBank fles downloaded during July 2015 from the NCBI RefSeq release 70[44].
After downloading and parsing the GenBank fles,we obtained a dataset with~9.6 million sequences represented by 5837 species.However,only a small number of sequences are reported for many species.To avoid bias in our statistical analysis due to small sample size,we only retained species having at least 500 sequences.This threshold was considered mathematically reliable since the lognormal distribution of protein sizesallowsestimating minimalsampling sizes (N≥500)to attain minimal confdence levels(≤4.5%)for estimating the true means and medians[7].The fnal dataset 3 had~9.5 million proteins and~74.4 million exon sequences from 492 species divided in 14 phylogenetic groups(Table 1).
The exon features of dataset 3 were extracted from the coding determining sequence(CDS)lines in GenBank fles as described elsewhere [43].For example,the CDS of XP_007325329.1 in Agaricus bisporus join(18,372 to 18,786, 18,829 to 19,191,and 19,447 to 19,622)consists of three exons with lengths of 415 bp,363 bp,and 176 bp,respectively.Using a stringent quality control,we excluded all CDSs with ambiguous exon boundaries,start or stop codons.For instance,proteins that do not start explicitly with methionine(~1%)were excluded.As a result,a small percentage of CDSs was excluded in different groups(3.6%in Protist,1.44%in Fungi,0.96%in Streptophyta,and 0.87%in Metazoa).
Statistical analysis
Median values and arithmetic averages of protein length,exon length,and number of exons were calculated for each of the 492 species in dataset 3.To obtain the mean number of exons per gene,we frst counted the total number of exons and then divided it by the number of protein sequences considered. Mean exon length was obtained in a similar fashion by frst summing the length of all exons and then dividing by the total number of exons.
To compare protein length between species or phylogenetic groups,we frst applied the Kruskal-Wallis test[45]at P<0.05 and then performed pairwise comparisons with a local implementation of Kruskal-Wallis post-test[46].The non-parametric Kruskal-Wallis test[45]is more robust than a Tukey test,since it considers all the individual values of the distribution of sizes and not just a single value for mean or median(Tables 2-5).P values were adjusted with the false discovery rate(FDR)method[47]and labels of multiple comparisons were assigned using the‘multcompView”package [48].All statistical analyses were performed using R software [49].
Phylogenetic regression analysis
The evolutionary analysis was performed based on the established and best curated taxonomy of eukaryotes[19-21].The results were validated by performing an independent reconstruction of the phylogenies using the sequences of the small subunit rRNAs of 233 representative eukaryotic species.We consulted the Protist Ribosomal Reference database(PR2) [41]and the SILVA database[42](http://ssu-rrna.org)for phylogenetic regression analysis.Small subunit rRNA sequenceswere aligned with SINA[50].Gaps of multiple sequence alignments were eliminated using trimAl[51]with the‘a(chǎn)utomated1”option.Both estimation of the best-ft model and reconstruction of the phylogenetic tree were inferred with jModelTest version 2.1.7[52],using the maximum likelihood model through PhyML[53].The resulting tree was rooted using the‘phangorn”R package[54].
Phylogenetic independent contrast regression analysis[40] was conducted using the‘a(chǎn)pe”R package[55].Linear model was forced through the origin and adjusted as recommended by Garland et al[56].Response variable was protein length and explanatory variables were exon number and exon length.
Identifcation of cyanobacterial orthologs of nuclear proteins inArabidopsis
Sequences of nuclear-encoded proteins from the whole genomes of 4 archaebacteria(Pyrococcus furiosus,Methanobacterium AL,Methanococcus maripaludis,and Archaeoglobus fulgidus),3 Gram positives(Mycoplasma genitalium,Bacillus subtilis,and Mycobacterium sp.JDM601),3 cyanobacteria (Nostoc sp.PCC7107,P.marinus,and Synechocystis sp. PCC6803),4 eubacteria(Borrelia afzelii,Treponema azotonutricium,Chlamydia pecorum,and Aquifex aeolicus),and 4 proteobacteria (Rickettsia akari, Helicobacter acinonychis, Haemophilus ducreyi,and Escherichia coli)were obtained from NCBI genome database in August,2015.A.thaliana and Saccharomyces cerevisiae nuclear proteomes were downloaded from The Arabidopsis Information Resource(TAIR)(https:// www.arabidopsis.org)and Saccharomyces Genome Database (SGD)(http://www.yeastgenome.org),respectively.
A non-redundant set of Arabidopsis sequences was obtained with the Cluster Database at High Identity with Tolerance (CD-HIT)program using default parameters[57,58].Construction of BLAST tables was done with the reciprocal best BLAST hits by comparing Arabidopsis proteome with all other proteomes with thresholds of e-value<10-10and aa sequence identities>30%.Multiple sequence alignments(MSAs)of proteins were obtained with the multiple sequence comparison by log-expectation(MUSCLE)[59]using default parameters. Gaps were removed using trimAl[51]with the‘gappyout”option.Phylogenetic trees were reconstructed with PhyML using a maximum likelihood approach[60].The best-ft model was inferred with ProtTest[61].All the procedures above were conducted using the Environment for Tree Exploration(ETE) pipeline for phylogenetic analysis[62].To identify genes of endosymbiotic origin that migrated from the chloroplast to the nucleus in Arabidopsis,we searched for phylogenetic trees in which cyanobacterial protein sequences branch together with Arabidopsis nuclear protein sequences[8,34].
Analysis of protein length between GO categories of yeast andArabidopsis
The GO Slim annotations were downloaded from TAIR and SGD.H.sapiens and O.sativa GO annotations were obtained from the Gene Ontology Consortium database(http://geneontology.org)and then mapped to GO Slim generic annotations using the Map2Slim program,which is available from the Comprehensive Perl Archive Network(CPAN)through the go-perl package.Statistical comparisons between organisms/ compartments were performed by non-parametric Kruskal-Wallis[45]test at P<0.05 and post hoc analysis or by analysis of variance(ANOVA)and Tukey’s post hoc tests.
Authors’contributions
AT conceived the study,coordinated the project,participated in the statistical analysis,prepared most fgures,contributed to the biological interpretation of the results,and wrote the manuscript.ORS and PPR performed statistical analysis, wrote Perl and R scripts,and prepared some fgures and tables. LDA wrote some perl scripts for sequence analysis and contributed to the evolutionary interpretation of the data.All authors revised and approved the fnal manuscript.
Competing interests
The authors declare no competing interests.
Acknowledgments
We thank Andres Christen and Miguel Nakamura for helpful mathematical advice.We also thank Cei Abreu-Goodger and Ruairidh Sawers for their suggestions on the manuscript.This study was supported by basic grants from CONACYTMexico to AT and LD and a scholarship to ORS(Grant No.347589/237183).
Supplementary material
Supplementary material associated with this article can be found,in the online version,at http://dx.doi.org/10.1016/j. gpb.2016.06.003.
[1]Chothia C,Finkelstein AV.The classifcation and origins of protein folding patterns.Annu Rev Biochem 1990;59:1007-39.
[2]PetskoGA,RingeD.Proteinstructureandfunction.London:New Science Press;2004.
[3]Chothia C,Gough J,Vogel C,Teichmann SA.Evolution of the protein repertoire.Science 2003;300:1701-3.
[4]Middleton S,Song T,Nayak S.Length constraints of multidomain proteins in metazoans.Bioinformation 2010;4:441-4.
[5]Brocchieri L,Karlin S.Protein length in eukaryoticand prokaryotic proteomes.Nucleic Acids Res 2005;33:3390-400.
[6]Zhang JZ.Protein-length distributions for the three domains of life.Trends Genet 2000;16:107-9.
[7]Tiessen A,Pe′rez-Rodr?′guez P,Delaye-Arredondo LJ.Mathematical modeling and comparison of protein size distribution in different plant,animal,fungal and microbial species reveals a negative correlation between protein size and protein number, thus providing insight into the evolution of proteomes.BMC Res Notes 2012;5:85.
[8]Martin W,Rujan T,Richly E,Hansen A,Cornelsen S,Lins T, et al.Evolutionary analysis of arabidopsis,cyanobacterial,and chloroplast genomes reveals plastid phylogeny and thousands of cyanobacterial genes in the nucleus.Proc Natl Acad Sci U S A 2002;99:12246-51.
[9]Adams KL,Wendel JF.Polyploidy and genome evolution in plants.Curr Opin Plant Biol 2005;8:135-41.
[10]McGrath CL,Gout JF,Johri P,Doak TG,Lynch M.Differential retention and divergent resolution of duplicate genes following whole-genome duplication.Genome Res 2014;24:1665-75.
[11]Kelkar YD,Ochman H.Genome reduction promotes increase in protein functional complexity in bacteria. Genetics 2013;193:303-7.
[12]Yue J,Hu X,Sun H,Yang Y,Huang J.Widespread impact of horizontal gene transfer on plant colonization of land.Nat Commun 2012;3:1152.
[13]Lacroix B,Citovsky V.Transfer of DNA from bacteria to eukaryotes.mBio 2016;7:e00863-16.
[14]Coulombe-Huntington J,Majewski J.Intron loss and gain in Drosophila.Mol Biol Evol 2007;24:2842-50.
[15]Merkin J,Chen P,Alexis M,Hautaniemi S,Burge CB.Origins and impacts of new mammalian exons. Cell Rep 2015;10:1992-2005.
[16]Zmasek CM,Godzik A.This De′ja`vu feeling—analysis of multidomain protein evolution in eukaryotic genomes.PLoS Comput Biol 2012;8:e1002701.
[17]Schu¨ler A,Bornberg-Bauer E.Evolution of protein domain repeats in Metazoa.Mol Biol Evol 2016;33:3170-82.
[18]He X,Zhang J.Gene complexity and gene duplicability.Curr Biol 2005;15:1016-21.
[19]Pawlowski J,Audic S,Adl S,Bass D,Belbahri L,Berney C,et al. CBOL protist working group:barcoding eukaryotic richness beyond the animal,plant,and fungal kingdoms.PLoS Biol 2012;10:e1001419.
[20]Burki F.The eukaryotic tree of life from a global phylogenomic perspective.Cold Spring Harbor Perspect Biol 2014;6:a016147.
[21]Adl SM,Simpson AGB,Lane CE,LukesˇJ,Bass D,Bowser SS, et al.The revised classifcation of eukaryotes.J Eukaryot Microbiol 2012;59:429-514.
[22]Gutierrez RA,Larson MD,Wilkerson C.The plant-specifc database.Classifcation of Arabidopsis proteins based on their phylogenetic profle.Plant Physiol 2004;135:1888-92.
[23]Lisch D.How important are transposons for plant evolution?Nat Rev Genet 2013;14:49-61.
[24]Bennetzen JL,Ma J,Devos KM.Mechanisms of recent genome size variation in fowering plants.Ann Bot 2005;95:127-32.
[25]Kim E,Magen A,Ast G.Different levels of alternative splicing among eukaryotes.Nucleic Acids Res 2007;35:125-31.
[26]Zhou K,Salamov A,Kuo A,Aerts AL,Kong X,Grigoriev IV. Alternative splicing acting as a bridge in evolution.Stem Cell Invest 2015;2:19.
[27]Zhang C,Yang H,Yang H.Evolutionary character of alternative splicing in plants.Bioinform Biol Insights 2015;9:47-52.
[28]Pan Q,ShaiO,LeeLJ,FreyBJ,BlencoweBJ.Deep surveying of alternative splicing complexity in the human transcriptome by high-throughputsequencing.NatGenet 2008;40:1413-5.
[29]Chen L,Bush SJ,Tovar-Corona JM,Castillo-Morales A,Urrutia AO.Correcting for differential transcript coverage reveals a strong relationship between alternative splicing and organism complexity.Mol Biol Evol 2014;31:1402-13.
[30]Grishkevich V,Yanai I.Gene length and expression level shape genomic novelties.Genome Res 2014;24:1497-503.
[31]Irimia M,Rukov JL,Penny D,Roy SW.Functional and evolutionary analysis of alternatively spliced genes is consistent with an early eukaryotic origin of alternative splicing.BMC Evol Biol 2007;7:188.
[32]Reyes-Prieto Adrian,Andreas PM,Weber A,Bhattacharya D. The origin and establishment of the plastid in algae and plants. Ann Rev Genet 2007;41:147-68.
[33]Martin W,Stoebe B,Goremykin V,Hansmann S,Hasegawa M, Kowallik KV.Gene transfer to the nucleus and the evolution of chloroplasts.Nature 1998;393:162-5.
[34]Rujan T,Martin W.How many genes in Arabidopsis come from cyanobacteria?An estimate from 386 protein phylogenies.Trends Genet 2001;17:113-20.
[35]Dagan T,Roettger M,Stucken K,Landan G,Koch R,Major P, et al.Genomes of Stigonematalean cyanobacteria(subsection V) and the evolution of oxygenic photosynthesis from prokaryotes to plastids.Genome Biol Evol 2013;5:31-44.
[36]Bayer RG,Ko¨stler T,Jain A,Stael S,Ebersberger I,Teige M. Higher plant proteins of Cyanobacterial origin:are they or are they not preferentially targeted to chloroplasts?Mol Plant 2014;7:1797-800.
[37]Ekman D,Bjo¨rklund A?K,Frey-Sko¨tt J,Elofsson A.Multidomain proteins in the three kingdoms of life:orphan domains and other unassigned regions.J Mol Biol 2005;348:231-43.
[38]Felsenstein J.Phylogenies and the comparative method.Am Nat 1985;125:1-15.
[39]Rabosky DL.No substitute for real data:a cautionary note on the use of phylogenies from birth-death polytomy resolvers for downstream comparative analyses.Evolution 2015;69:3207-16.
[40]Martins EP,Hansen TF.Phylogenies and the comparative method:a general approach to incorporating phylogenetic information into the analysisofinterspecifc data.Am Nat 1997;149:646-67.
[41]Guillou L,Bachar D,Audic S,Bass D,Berney C,Bittner L,et al. The Protist Ribosomal Reference database(PR2):a catalog of unicellular eukaryote small sub-unit rRNA sequences with curated taxonomy.Nucleic Acids Res 2013;41:D597-604.
[42]Quast C,Pruesse E,Yilmaz P,Gerken J,Schweer T,Yarza P, et al.The SILVA ribosomal RNA gene database project: improved data processing and web-based tools.Nucleic Acids Res 2013;41,D590-6.
[43]Kaplunovsky A,Khailenko V,Bolshoy A,Atambayeva S, Ivashchenko A.Statistics of exon lengths in animals,plants, fungi,and protists.Int J Biol Biomol Agric Food Biotechnol Eng 2009;28:177-82.
[44]Pruitt KD,Tatusova T,Maglott DR.NCBI reference sequences (RefSeq):a curated non-redundant sequence database of genomes,transcripts and proteins.Nucleic Acids Res 2007;35:D61-5. [45]Kruskal W.Use of ranks in one-criterion variance analysis.J Am Stat Assoc 1952;47:583-621.
[46]Sa Castellan.Non parametric statistics for the behavioural sciences.New York:MacGraw Hill Int;1988.
[47]Benjamini Y,Hochberg Y.Controlling the false discovery rate:a practical and powerful approach to multiple testing.J R Stat Soc Series B Stat Methodol 1995;57:289-300.
[48]Graves S,Piepho HP,Selzer L,Dorai-Raj S.multcompView: visualizations of paired comparisons.R package version 0.1-7, 2015.<https://cran.r-project.org/web/packages/multcompView/ multcompView.pdf>.
[49]R Core Team.R:a language and environment for statistical computing.Vienna:R Foundation for Statistical Computing; 2013.
[50]Pruesse E,Peplies J,Glo¨ckner FO.SINA:accurate highthroughput multiple sequence alignment of ribosomal RNA genes.Bioinformatics 2012;28:1823-9.
[51]Capella-Gutie′rrez S,Silla-Mart?′nez JM,Gabaldo′n T.TrimAl:a tool for automated alignment trimming in large-scale phylogenetic analyses.Bioinformatics 2009;25:1972-3.
[52]Darriba D,Taboada GL,Doallo R,Posada D.JModelTest 2: more models,new heuristics and parallel computing.Nat Methods 2012;9:772.
[53]Guindon S,Gascuel O.A Simple,fast,and accurate algorithm to estimate large phylogenies by maximum likelihood.Syst Biol 2003;52:696-704.
[54]Schliep KP.Phangorn:phylogenetic analysis in R.Bioinformatics 2011;27:592-3.
[55]Paradis E,Claude J,Strimmer K.APE:analyses of phylogenetics and evolution in R language.Bioinformatics 2004;20:289-90.
[56]Garland T,Harvey PH,Ives AR.Procedures for the analysis of comparative data using phylogenetically independent contrasts. Syst Biol 1992;41:18-32.
[57]Fu L,Niu B,Zhu Z,Wu S,Li W.CD-HIT:accelerated for clustering the next-generation sequencing data.Bioinformatics 2012;28:3150-2.
[58]Li W,Godzik A.Cd-hit:a fast program for clustering and comparing large sets of protein or nucleotide sequences.Bioinformatics 2006;22:1658-9.
[59]Edgar RC.MUSCLE:multiple sequence alignment with high accuracy and high throughput.Nucleic Acids Res 2004;32:1792-7.
[60]Guindon S,Dufayard JF,Lefort V,Anisimova M,Hordijk W, Gascuel O.New algorithms and methods to estimate maximumlikelihood phylogenies:assessing the performance of PhyML 3.0. Syst Biol 2010;59:307-21.
[61]Darriba D,Taboada GL,Doallo R,Posada D.ProtTest 3:fast selection of best-ft models of protein evolution.Bioinformatics 2011;27:1164-5.
[62]Huerta-Cepas J,Dopazo J,Gabaldon T.ETE:a python environment for tree exploration. BMC Bioinformatics 2010;11:24.
Received 22 January 2016;revised 3 June 2016;accepted 3 June 2016 Available online 18 December 2016
Handled by Deng-Ke Niu
*Corresponding author.
E-mail:atiessen@ira.cinvestav.mx(Tiessen A).
aORCID:0000-0003-3156-1209.
bORCID:0000-0002-3202-1784.
cORCID:0000-0003-4193-2720.
dORCID:0000-0001-5572-4274.
Peer review under responsibility of Beijing Institute of Genomics,Chinese Academy of Sciences and Genetics Society of China.
http://dx.doi.org/10.1016/j.gpb.2016.06.003 1672-0229?2016 The Authors.Production and hosting by Elsevier B.V.on behalf of Beijing Institute of Genomics,Chinese Academy of Sciences and Genetics Society of China.
This is an open access article under the CC BY license(http://creativecommons.org/licenses/by/4.0/).
 Genomics,Proteomics & Bioinformatics2016年6期
- Genomics,Proteomics & Bioinformatics的其它文章
- Announcement of Distinguished GPB Special Issues 2003-2015
- Announcement of Distinguished GPB Articles 2012-2015
- An Improved Methodology to Overcome Key Issues in Human Fecal Metagenomic DNA Extraction
- Identifcation of Risk Pathways and Functional Modules for Coronary Artery Disease Based on Genome-wide SNP Data
- T Cell Repertoire Diversity Is Decreased in Type 1 Diabetes Patients
- Biological Databases for Hematology Research