
Inatorial forecasting method considering macro and micro characteristics of chaotic traffic flow
2023-11-02 08:09:44YueHou侯越DiZhang張迪DaLi李達andPingYang楊萍
Chinese Physics B 2023年10期
關(guān)鍵詞:李達
Yue Hou(侯越), Di Zhang(張迪), Da Li(李達), and Ping Yang(楊萍)
School of Electronics and Information Engineering,Lanzhou Jiaotong University,Lanzhou 730070,China
Keywords: traffic flow prediction, phase space reconstruction, particle swarm optimization algorithm, deep learning models
1.Introduction
With the fast development of the urban road network,traffic congestion is becoming a hot issue of increasing concern.As a major research area in intelligent transportation systems(ITSs),[1-3]road network traffic data forecasting can provide some auxiliary decision bases for citizens to plan travel routes and reduce travel costs, which can alleviate traffic congestion to a certain extent.Affected by external uncertainties such as vehicle running state and adverse weather,traffic flow data exhibit nonlinear chaotic dynamics characteristics.At the same time,different spatial road network structures are differentially distributed, which makes the traffic flow at a macroscopic level possess complex spatial and temporal correlation performance.The key to modeling the chaotic traffic flow prediction is how to fully and effectively extract the macro and micro characteristics of traffic flow data.
Modeling chaotic traffic flow prediction is primarily comprised of macro and micro characteristic analyses and traffic flow prediction stages.Macro and micro analyses of features are the crucial basis for modeling chaotic traffic flow.Most of the existing studies analyze the macro spatiotemporal characteristics of data by embedding the time dimension and spatial dimension.Denget al.[4]constructed the spatiotemporal matrix from the perspective of spatiotemporal correlation to realize the conversion of spatiotemporal characteristics of road networks to Euclidean space.In terms of microscopic chaotic characteristics, the main focus is placed on phase space reconstruction technique.The phase space reconstruction algorithms are classified as two major categories.One category is to solve independently embedding dimensionmand delay timeτ, such as the G-P method,[5]the mutual information method,[6]and the pseudo-nearest neighbor method.[7]The other category is to combine the embedding window theory to simultaneously computemandτ, like the C-C method.[8]Penget al.[9]used the C-C method to calculate the delay time and embedding dimension of traffic flow sequence to portray the univariate phase space information of the traffic system with higher efficiency.For the phase space reconstruction technique,some studies have shown that models incorporating multivariate information of the system have better prediction effects than those considering only univariate information.[10,11]Consequently,multivariate phase space reconstruction is widely applied to system dynamics feature extraction.Maet al.[12]conducted phase space reconstruction for average occupancy, average speed, and time series within the traffic system, respectively, and demonstrated that considering multivariate approach has a better prediction effect than considering only single variable.The above research discussed the spatiotemporal data organization form of traffic flow and multivariate phase space reconstruction algorithm in the macro and micro feature analysis stage from multiple perspectives,which provides strong theoretical support for fully extracting the spatiotemporal characteristics of data and chaotic features in modeling the chaotic traffic flow prediction.However,there are still some important points that have not been taken into account in these studies.The authors in Ref.[4]showed the construction of the spatiotemporal matrix only from the spatiotemporal perspective and does not consider the realistic road network node correlation.In Ref.[12],based on solving the multivariate reconstruction parameters separately, the maximum embedding dimension and the minimum delay time are selected for multivariate phase space reconstruction.However,owing to the large number of realistic road network nodes,the method is difficult to apply to the multivariate phase space reconstruction of regional road networks.In addition,when using phase space reconstruction technique to characterize the nonlinear evolution of traffic system, the univariate phase space reconstruction method cannot evolve the changing pattern of multi-node traffic data, and the organization of reconstructing multi-node phase space one by one greatly increases the complexity of the model.Therefore,it is necessary to study data organization form that can efficiently characterize both macro and micro aspects of urban road networks.
Traffic flow prediction is mainly modeled by using statistical learning modeling techniques,traditional machine learning modeling techniques, and deep learning modeling techniques.The statistical learning techniques emerged earlier and mainly include the historical average (HA) method, autoregressive integrated moving average (ARIMA),[13,14]etc.Although these methods are simple to operate, they are ineffective in analyzing the nonlinear laws of traffic data.Compared with statistical methods,traditional machine learning methods have strong feature abstraction capabilities, mainly including support vector regression(SVR),[15,16]Bayesian networks,[17]and feedforward neural networks,[18,19]which can effectively extract the nonlinear laws of traffic data.With the generation of massive multi-source traffic data,the capability of machine learning modeling methods is inadequate in large-scale data feature extraction,while deep learning is extensively used owing to its complex feature abstraction capability.In deep learning modeling, recurrent neural network (RNN) is commonly utilized to capture temporal dependence characteristics in traffic data,but it is ineffective in extracting long-time dependence features.Long short-term memory (LSTM)[20]and gated recurrent unit(GRU)[21,22]can compensate effectively for RNN,but these methods have the drawback that data space features cannot be extracted effectively.To extract spatial features effectively,CNN[23]is widely applied.Zhuang and Cao[24]performed the extraction of space characteristics of traffic data by utilizing the CNN and enhanced the model prediction performance.Zhanget al.[25]utilized convolutional neural networks to extract spatiotemporal features from the spatiotemporal matrix of traffic flow and achieved better prediction results.Nevertheless, the single modeling approach is hard to effectively characterize the spatiotemporal correlation in traffic flow sequences.In recent years,therefore,combined methods of modeling the spatiotemporal traffic flow have been proposed.Zhenget al.[26]combined attention components and ConvLSTM to achieve short-term prediction of traffic flow by consistent extraction of spatiotemporal features of traffic flow.Liet al.[27]combined Bayesian theory and data based on phase space reconstruction of multi-source traffic data,and then utilized radial basis function neural networks to extract the internal chaotic features.Huanget al.[28]extracted the nonlinear features of chaotic time series by using CNN based on phase space reconstruction of chaotic time series and utilized GRU to learn temporaldependence in a tandem network manner.The above studies extracted temporal features,spatial features and chaotic features of time-series data by using single modeling and combined modeling,respectively,which provides a multiangle modeling idea for macro and micro feature extraction of traffic data.However, there are still some points that have not been fully considered in these studies.In Ref.[24] CNN was utilized to extract the spatial features of traffic data, but the process ignored temporal features.In Ref.[25] the CNN was used to extract spatiotemporal features based on the construction of spatiotemporal matrix,which can capture the spatiotemporal correlation to a certain extent but is not sufficient for the extraction of time-series features.In Ref.[26],the spatiotemporal features of traffic data were extracted by taking the advantage of ConvLSTM consistent extraction of spatiotemporal features, but it is difficult to effectively ensure the stability of the model by considering only macro spatiotemporal features.In Ref.[27] the phase space reconstruction theory was utilized to investigate the chaotic characteristics of traffic flow, but did not consider the macroscopic spatiotemporal correlation features of traffic flow.In Ref.[28] a combined modeling approach was adopted to learn the chaotic features and temporal features on time series data,yet ignored macroscopic spatial features.For the macro spatiotemporal characteristics and micro chaotic characteristics of traffic flow data,most of the existing studies only consider the macro spatiotemporal characteristics and ignore the micro chaotic characteristics, or only model the micro chaotic characteristics and ignore the macro spatiotemporal characteristics,resulting in inadequate feature extraction.Therefore,in the aspect of multinode macro and micro feature extraction for large-scale road networks, it is necessary to study the modeling strategies for extracting spatiotemporal features and multi-node chaotic features in a comprehensive and efficient manner.
In addition, the traditional combinatorial modeling approach frequently relies on subjective experience to determine the model hyperparameters, however, with the complexity of the model parameters, this approach is prone to degrade the model performance.For such problems, the existing methods often utilize intelligent algorithms to search for model optimal parameters, and particle swarm optimization (PSO)[29]algorithm is more frequently used in model optimization because of its highly collaborative and efficient.Sheikhan and Mohammadi[30]used the PSO to search for the optimal neuron number for multilayer perceptron and reduced the effect of subjective aspects on modeling.Mohamadet al.[31]utilized the PSO for optimizing the hyperparameters of feedback neural network and achieved better results.The aforementioned literature used the PSO for optimizing the parameters of complex neural network models, which effectively improves the generalization performance of complex models to a certain extent.However, the combination of PSO and deep learning networks increases the complexity of model training,and therefore highly time-efficient optimization strategies for PSO improvement need studying.
In summary, most of the existing traffic flow prediction modeling methods focus on spatiotemporal characteristics, and there are few studies on the micro phase space evolution characteristics of traffic flow, especially those studies about the chaotic traffic flow of regional road networks have not been found.Therefore, we believe that comprehensive research considering the spatiotemporal characteristics and chaotic characteristics of the regional road network is necessary.At the same time, efficient data organization of macro and micro characteristics and high optimization efficiency of the model are essential to fully extract the macro and micro characteristics of traffic flow.Therefore, this paper constructs a combined traffic flow prediction model based on the improved PSO optimization from the perspective of comprehensive consideration of spatio-temporal characteristics and chaotic phase space evolution characteristics, aiming to improve the traffic flow prediction accuracy and model stability,while enhancing the applicability of the model in realistic scenarios.Several important means applied to this research are listed below.
(i)To tackle the problem that multivariate phase space reconstruction constructs node phase space one by one,leading the algorithm to take longer time, an improved multivariate phase space reconstruction idea of filtering global representative nodes is proposed to realize the construction of data organization forms based on microscopic chaos.
(ii) To address the problem that the combined modeling approach is difficult to effectively extract the more adequate data features at both macro and micro levels, this paper proposes a CNN-ConvLSTM combined modeling method,which reveals the complex features of chaotic traffic flow from different perspectives and can effectively extract the hidden correlation characteristics between features.
(iii)For improving the time efficiency of PSO in optimizing the combined model,this research proposes a lightweight particle swarm optimization (ALPSO) idea for the challenge that model performance degrades,owing to subjective empirically determined parameters.
The remainder of this research is organized below.Section 2 describes each submodule of the combinatorial model.Section 3 introduces experimental data sources,and conducts experimental simulations from multiple perspectives.Some conclusions are drawn from this research in Section 4.
2.Method of CNN-ConvLSTM-ALPSO (CCA)model construction
The components of the CNN-ConvLSTM-ALPSO chaotic traffic flow intelligent combination prediction model proposed in this research are shown in Fig.1, whose main modules are described below.
(I) Chaotic feature extraction module Firstly, the improved multivariate phase space reconstruction (IMPSR) algorithm is used to reconstruct phase space of multiple nodes data of the road network,then the chaotic features from the reconstructed phase space tensor are extracted by utilizing CNN,and finally the chaotic features are input into the feature connection layer for stitching with macroscopic spatiotemporal features.
(II) Spatiotemporal feature extraction module Firstly,the time series with different periods are constructed as spatiotemporal matrix (STM), then the spatiotemporal features in the matrix are extracted by ConvLSTM, and finally, the model output is obtained by inputting the spliced spatiotemporal characteristics and chaotic characteristics into the fully connected network.
(III)Improved particle swarm algorithm optimization module The model hyperparameters are regarded as an individual particle, and the error value of the validation dataset is treated as an algorithmic fitness value.The optimization process of combined model hyperparameters is realized by repeated iterations.
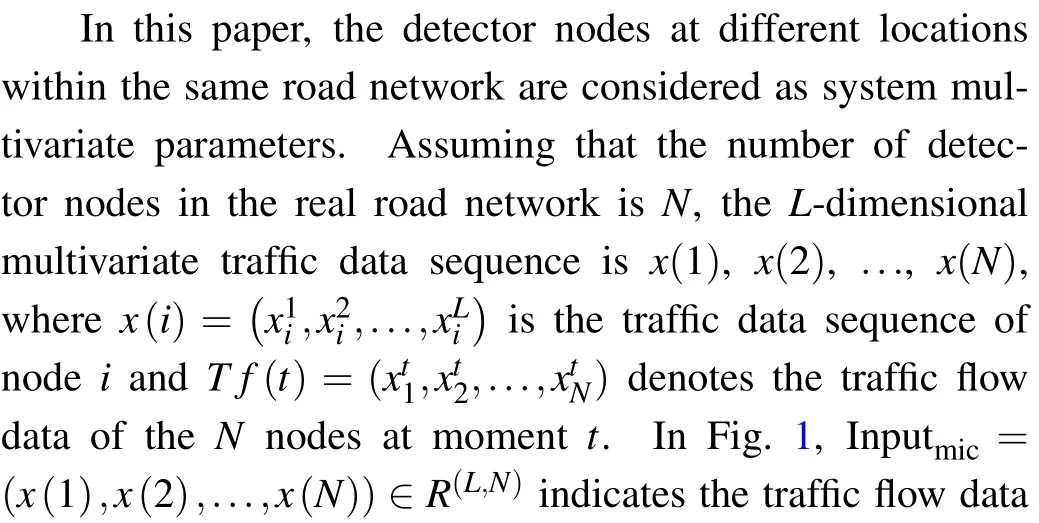


Fig.1.Basic structure of CCA model.
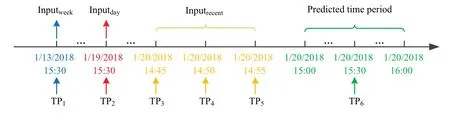
Fig.2.Time point distribution of input data and predicted data.
2.1.Improved multivariate phase space reconstruction
In the real scenario,the traffic system has chaotic characteristics, such as some roads are congested while other roads related to them run normally, and the traffic flow varies unsteadily owing to the vehicles going and stopping on the congested road,etc., which are the manifestations of the chaotic characteristics of traffic flow.At the same time,the traffic system has the initial value sensitivity of a chaotic system,and a small behavior of a vehicle while driving may lead to traffic congestion, which in turn leads to abnormal changes in traffic flow on that road.For the chaotic dynamics characteristics exhibited among the data within the traffic flow, the internal nonlinear relationship cannot be revealed in a one-dimensional time series, and a phase space reconstruction is needed to unfold the structure of the singular attractor to analyze and discriminate the chaos.However, since the traditional phase space reconstruction method is primarily based on univariate systems,applying it to multivariate systems is likely to result in greater complexity,which puts forward higher requirements for the efficiency of algorithm.Therefore,this paper proposes an algorithm to construct the correlation matrix of the road network by combining the gray correlation coefficients among the detector nodes and proposes an improved multivariate phase space reconstruction algorithm based on this matrix to achieve the purpose of reconstructing the multi-node phase space of the road network more efficiently.
The IMPSR algorithm takes Inputmicas the input data to reconstruct the phase space of the road network multi-detector node data.The detailed steps are as follows.
Step 1 The road network nodes data are normalized,and the gray correlation coefficient matrix is calculated based on Eqs.(1)and(2)to generate the gray correlation degree matrix,which is calculated as follows:
wherekrepresents the data series index,iandjare the node numbers,ρdenotes the resolution coefficient,Vis the gray correlation coefficient matrix,andArefers to the gray correlation matrix.
Step 2 On the basis of generating the gray correlation matrix,the row countuand column countvof road network correlation matrix are calculated based on Eqs.(3)-(5)as shown below:
To ensure that the topology of the road network nodes has a strong correlation,firstly,any node of the road network is selected as the initial element of the matrix, and the most relevant node of the current node is found, with the row as the benchmark.Secondly,with the column as the benchmark,the relevant nodes are searched for on the basis of the row elements in the direction of the vertical axis,and finally,the road network correlation matrix with the strong correlation between rows and columns is obtained as follows:
whereεu,vdenotes the serial number of road detector nodes after sorting using the row-column strong correlation rule.
Step 3 Based on the building of the road network correlation matrix,uglobal representative nodes are chosen on the counter-diagonal,andmandτof theunodes data are obtained by utilizing the C-C method respectively.By applying the BDS test statistic to the reasonable estimate ofmand the search radiusr,S(T),ΔS(T),andScor(T)are calculated from the following equations:
The 1st minimum value point for ΔS(T) or the 1st zero value point forS(T) is taken as the optimal value ofτ.The point of minimum value ofScor(T)is taken as the value of sliding window,and themis obtained according to the embedding window theory.Finally,the global representative node reconstruction parameters are solved by the mean rounding method,which is calculated from the following equations:
whereF(·)denotes the mean rounding method.
Step 4 The phase space reconstruction tensor of all nodes in the road network is obtained by utilizingmandτsolved in Step 3,and the reconstructed phase point of all nodes at timetis represented below:
The phase space tensor after the phase space reconstruction of all node data is shown as follows:
2.2.Deep learning methods
2.2.1.Structure of CNN model
Because of the relatively high complexity of the internal phase space structure for road network node data and the high dimensionality of the data, it is difficult to match the highdimensional phase space data by using traditional neural networks suitable for processing one-dimensional time series.In addition,the data structure of phase space resembles that of an image matrix,therefore we can extract phase space characteristics by utilizing CNN,which is efficient in processing tensor data.The structure of the CNN used in this paper is depicted in Fig.3.
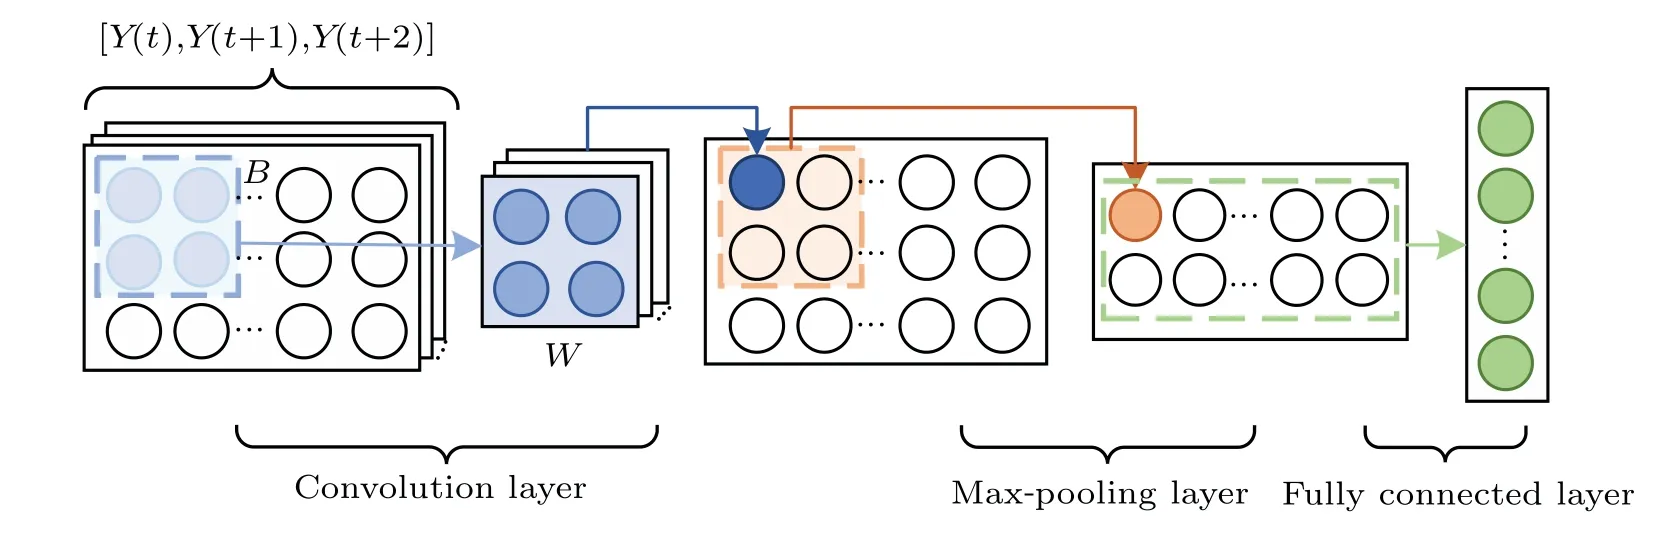
Fig.3.Basic structure of CNN.
When extracting chaotic feature,redundant data may degrade the performance of the model and increase the complexity of the model.Therefore, we select only the three phase points closest to the predicted target value in the phase space tensor output from IMPSR as the input to the CNN, and the specific expression is [Y(t),Y(t+1),Y(t+2)]∈R(3,m,N).On this basis,the expression((t+2)+(m-1)τ)<pre1can better circumvent the problem of leakage of forecast data,wherepre1denotes the time point corresponding to the first time slice in the forecast of future one-hour traffic flow.The CNN convolution kernel conducts convolutional operations on different regions in the phase space tensor one by one to obtain the initial extracted spatial features,then the feature information is highly aggregated by multiple convolutional layer networks and finally, the extraction of phase space structure features is realized.The specific convolution calculation formula is given below:
whereQrefers to the eigenvalue extracted by the convolution operation,bthe bias value of the neurons,Wthe convolution kernel weight matrix,⊙the Hadamard product operation,Bthe local phase space tensor involved in the convolution calculation,andσthe S-type function.
In Fig.3,the main function of the max-pooling layer is to reduce the redundant chaotic features by retaining the maximum feature value of the sub-region,while the fully connected layer is mainly used to highly abstract the features after the max-pooling layer has been processed.
2.2.2.Description of ConvLSTM network
The temporal features and spatial features of traffic data are the critical factors in portraying the evolution of data,and whether the spatiotemporal characteristics of data can be adequately extracted is the key to determining the performance of the prediction model.Traditional combinatorial forecasting methods mostly form network models by serially connecting multiple components.Although these methods can extract part of the spatiotemporal information,they destroy the spatiotemporal correlation within the data, which is not highly timeefficient.ConvLSTM is proposed to better solve this problem,and it can efficiently extract spatial correlations while learning the temporal dependency of the data by embedding convolutional operations into the gating unit.The ConvLSTM internal cell structure in this research is shown in Fig.4.
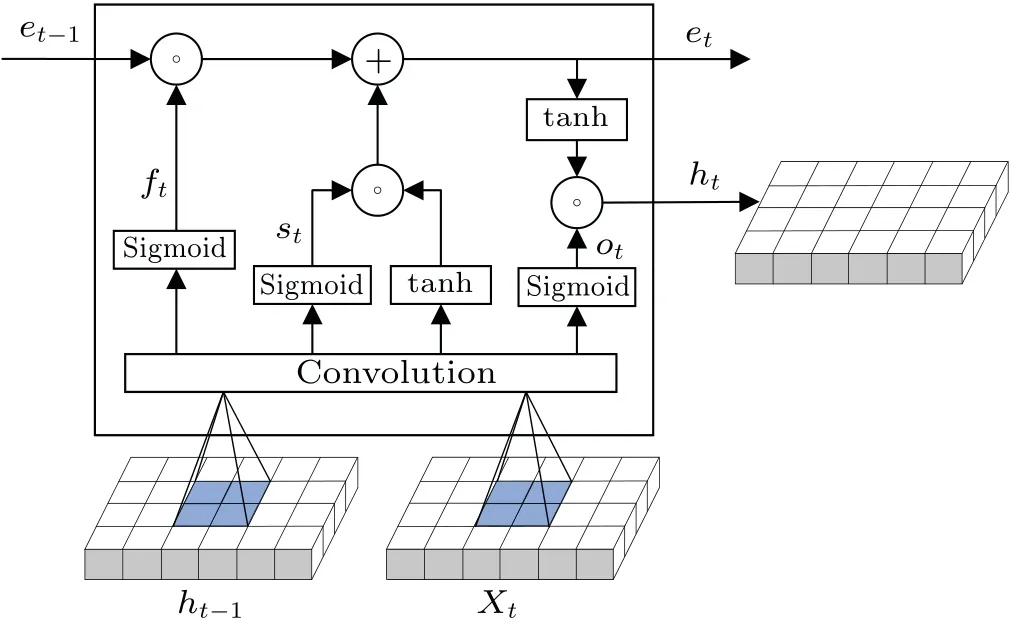
Fig.4.Basic structure of ConvLSTM.
In Fig.4,Xtdenotes STM,whose structure is given below:
wheredenotes the traffic flow value for detectorεu,v.If there is an empty value in the last row of STM,the mean value of the current column is chosen to fill it.
The ConvLSTM combines the gating units for finegrained extraction of spatiotemporal characteristics of traffic data to ensure that the internal correlation of the original data is not split as much as possible, and the specific calculation process is shown as follows:
where°denotes the element-by-element multiplication.ot,ft, andstare the output gate, input gate, and forget gate.etandhtdenote the cell information and hidden state information at timet,respectively.Wsx,Wsh,Wfx,Wfx,Wox,Woh,Wex, andWehare the weight matrix.bs,bf,bo, andberefer to the bias of the neurons.Θrepresents the convolution operation andXtdenotes the spatiotemporal matrix.
2.3.Improved lightweight particle swarm optimization
The PSO utilizes heuristic search ideas to obtain the best solution in the optimization scenario, which is widely used to optimize the parameters of traffic flow prediction models.[32-34]When performing parametric optimization, an individual particle is taken as a solution of the problem optimized, and position and velocity are two properties of the particle,which are updated below:
whereωis the inertia weight,η1andη2denote the learning factors,μ1andμ2are constants between 0 and 1,pq(n),ξq(n),andγq(n)represent the individual historical optimal solution,velocity vector,and position vector of particleqat then-th iteration,respectively,andg(n)refers to the optimal solution of then-th generation particle swarm.
The traditional particle swarm algorithm has fixed values ofω,η1, andη2.It cannot dynamically change the particle search step,resulting in an imprecise solution.In view of this,this research proposes the ALPSO with adaptive update parameters,and its improved form is given as follows:
where dist(n)denotes the mean Euclidean distance among all particles of then-th generation and the global optimal solution,Erefers to the count of all particles,andβis the random number in a range from 0 to 1.
The above improvement methods can further enhance the efficiency of PSO,so this paper optimizes the combined model parameters based on ALPSO,and the detailed flow is depicted in Fig.5.
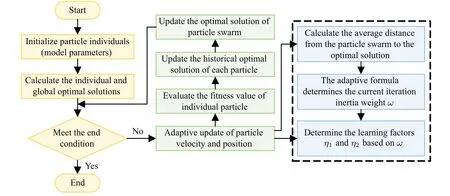
Fig.5.Flow diagram of ALPSO optimization model.
3.Experiments
3.1.Dataset source
Two real highway data sets, PeMSD4 and PeMSD8, are used in this research as research objects,and the traffic parameters include traffic speed, traffic time occupancy, and traffic flow.When processing data,5 min is taken as a time slice,and sum up the traffic flow every 5 min.Thus,24 h of data can be split into 288 time slices of data.The PeMSD4 represents the traffic data dataset that is collected in the San Francisco Bay Area and contains 307 detectors spanning January to February 2018,with as many as 16992 time slices of data in total.The PeMSD8 represents the traffic dataset that is collected in the San Bernardino area and contains 170 detectors spanning from July to August 2016,with as many as 17856 time slices of data in total.The first 50 days of data from the dataset is a training dataset and the rest is a test dataset.The 300 time slices of data were selected from the training dataset as the validation dataset for assessing the model performance.
3.2.Experiment setups
In this research, we conduct model validation experiments in combination with the Pycharm experimental platform.In the micro chaos feature extraction module, this research sets the total number of network layers of CNN to 4 and assumes the convolution number and detector number to be equal.The convolution kernel has a dimension of 2 along both horizontal direction and vertical direction.The hyperparameters in the spatiotemporal features extraction module are optimized by using ALPSO,and the total number of particles and loop iteration updates are valued at 6 and 20 respectively in the optimization process.For model training,Adam is chosen as the optimizer and the model learning rate is taken as 0.0001.On this basis, the mean absolute error (MAE) of the training set is used as the feedback result of the model training to update the network weight parameters.To circumvent the problems of overtraining and overfitting of the model,we use the early stop method to control the model training process.Meanwhile, to make the balance between model prediction accuracy and training efficiency,the model training is terminated when the validation set error rises four times continuously, and the model structure with the lowest validation set error is saved.In this paper, traffic flow is predicted for 12 time slices in the next hour by using the time series of the previous week, the previous day, the recent 15 minutes, and the reconstructed phase space tensor data of the road network detector nodes.
To comprehensively validate the accuracy and generalization capability of CCA,we choose statistical models,deep learning modeling methods,and combined models,which are widely used in the traffic data modeling field, as our baseline models.The baseline models are introduced below.
(i) HA: predict the next time period by using the mean value of the time series historical data.
(ii) SVR: achieve prediction of regression problems by utilizing the idea of continuous optimization of model bias.
(iii)RNN:a neural network model widely used to capture time series data dependence.
(iv)LSTM:an improved recurrent neural network used to extract long-time dependency features of data.
(v) GRU: an improved recurrent neural network with fewer network parameters compared with LSTM.
(vi)CNN-LSTM:CNN is used to extract chaotic characteristics of traffic data, meanwhile combining LSTM to capture temporal characteristics of chaotic sequence data.
(vii) Diffusion convolutional recurrent neural network(DCRNN): capture spatiotemporal features of data in a random wandering manner on the road network topology map.
(viii) Attention based spatial-temporal graph convolutional network (ASTGCN): it uses multiple component networks to more comprehensively capture the space features and time features in traffic data.
3.3.Evaluation of model prediction performance
To validate the comprehensive effect of the CCA, take MAE,R-square, and root-mean-square error (RMSE) as performance indexes.The specific calculation formulas are given below:
whereZrepresents the input sample’s total number,yand ˉydenote the true value, and its mean value, respectively, and ?yrefers to the prediction result.
3.4.Experimental verification
3.4.1.Multivariate phase space reconstruction of chaotic traffic flow
Taking the PeMSD8 dataset as the research object, the road network correlation matrix of the PeMSD8 dataset is generated based on the road network correlation matrix construction algorithm proposed in Subsection 2.1.1,as shown in Fig.6.
To verify that the nodes in the road network correlation matrix are strongly associated, 10 nodes and 4 nodes are respectively selected in the vertical axis region and local matrix region in Fig.6 for node association analysis, and the results are shown in Fig.7.
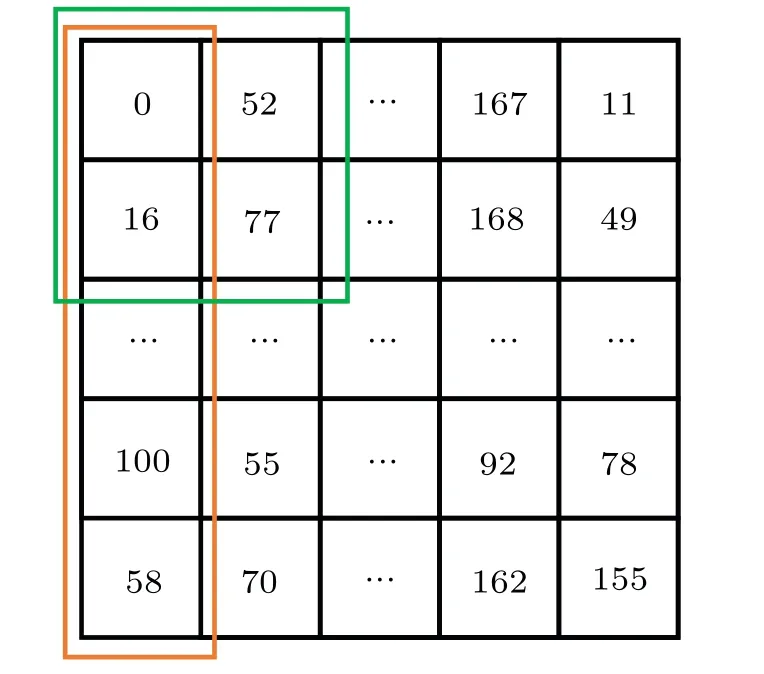
Fig.6.PeMSD8 road network correlation matrix.
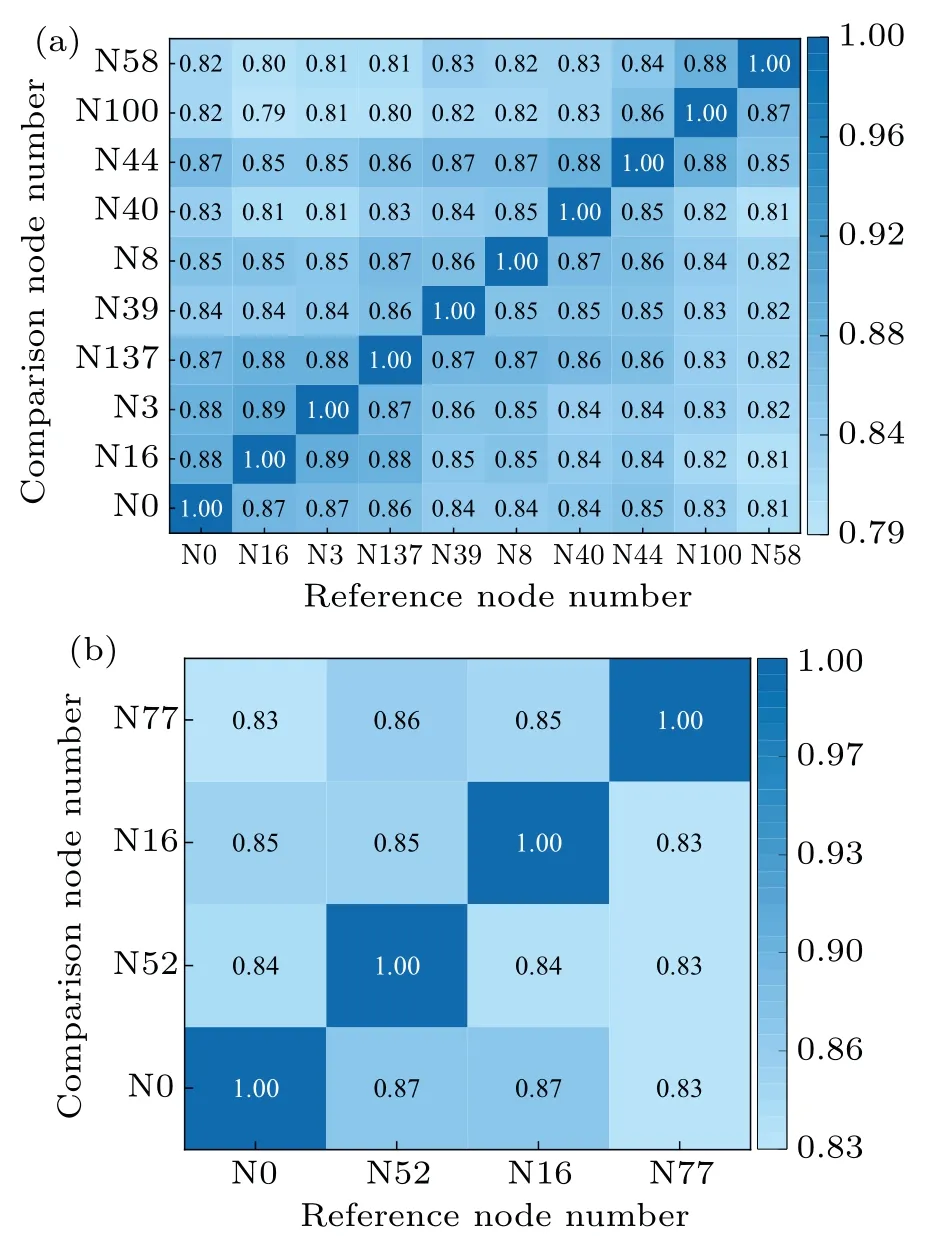
Fig.7.(a)Vertical axis road network correlation and(b)matrix region nodes correlation of PeMSD8.
The horizontal coordinate in Fig.7 indicates the reference node number and the vertical coordinate refers to the comparison node number.Combining the analysis of Fig.6 with that of Fig.7(a),it is evident that when node 0 is the reference sequence and the rest of the nodes are the comparison sequence,the correlation coefficient between node 0 and node 16 is as high as 0.87,while the correlation coefficients between node 0 and other nodes are all greater than or equal to 0.81,indicating that the space structure of nodes in the road network correlation matrix has a strong correlation.Combining the node data in Fig.6 and the correlation coefficient analysis in Fig.7(b),it is obvious that the correlation coefficient between node 0 and the neighboring nodes 16 and 52 in the horizontal direction and vertical direction are all 0.87, and the correlation coefficient between node 16 in the diagonal position and node 52 at this time is 0.85,which further indicates that the nodes in different regions of the correlation matrix are strongly correlated.Since the node association mechanism is utilized to construct the road network association matrix,the nodes on the diagonal of this matrix also have a close association with the nodes in the upper triangle region and lower triangle region.
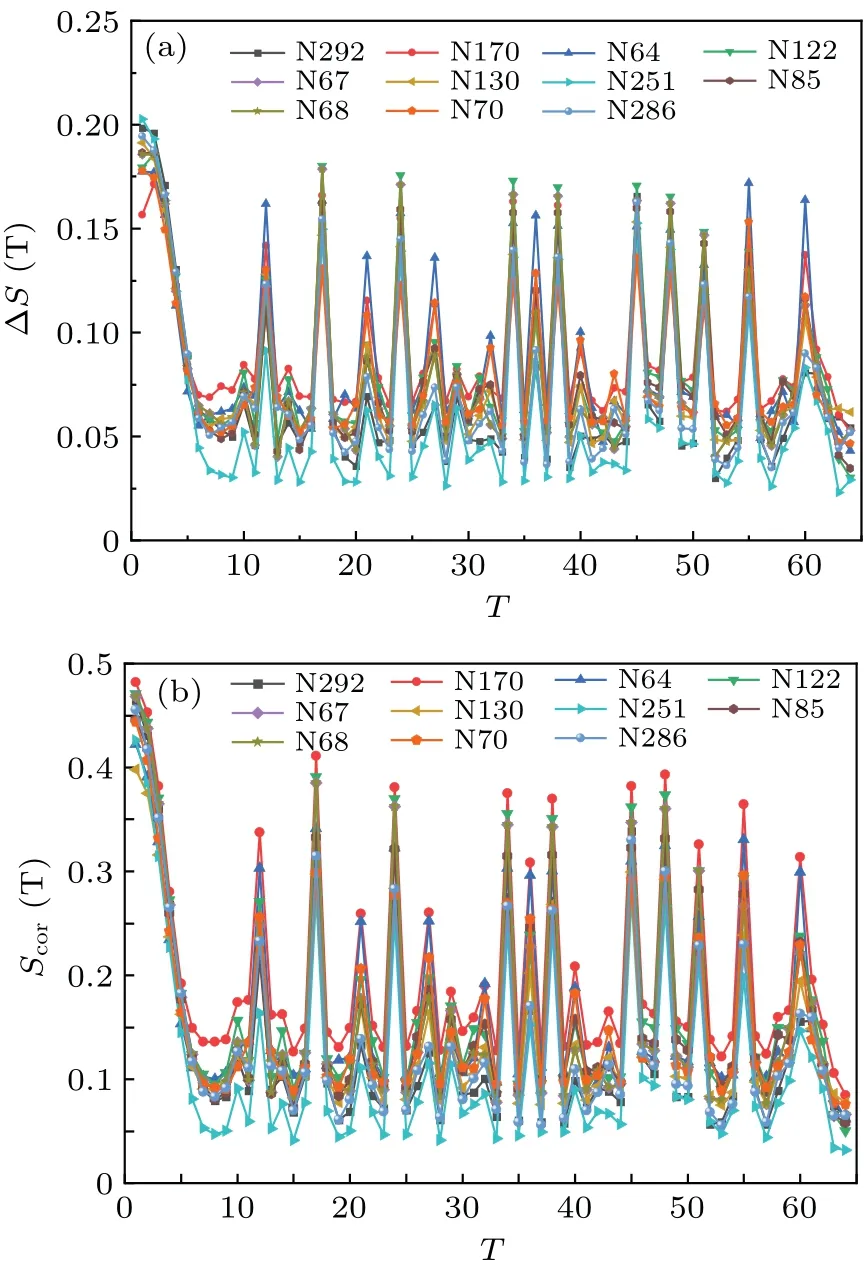
Fig.8.Statistical data distribution of representative nodes of PeMSD4 road network: (a)ΔS(T)and(b)Scor(T).
To optimize the reconstruction efficiency of the multivariate phase space, the IMPSR proposed in Subsection 2.2.1 is utilized to construct the phase space tensor of the road network nodes.Figures 8 and 9 exhibit the data distribution of the statistic ΔS(T) andScor(T) for the global representative nodes.
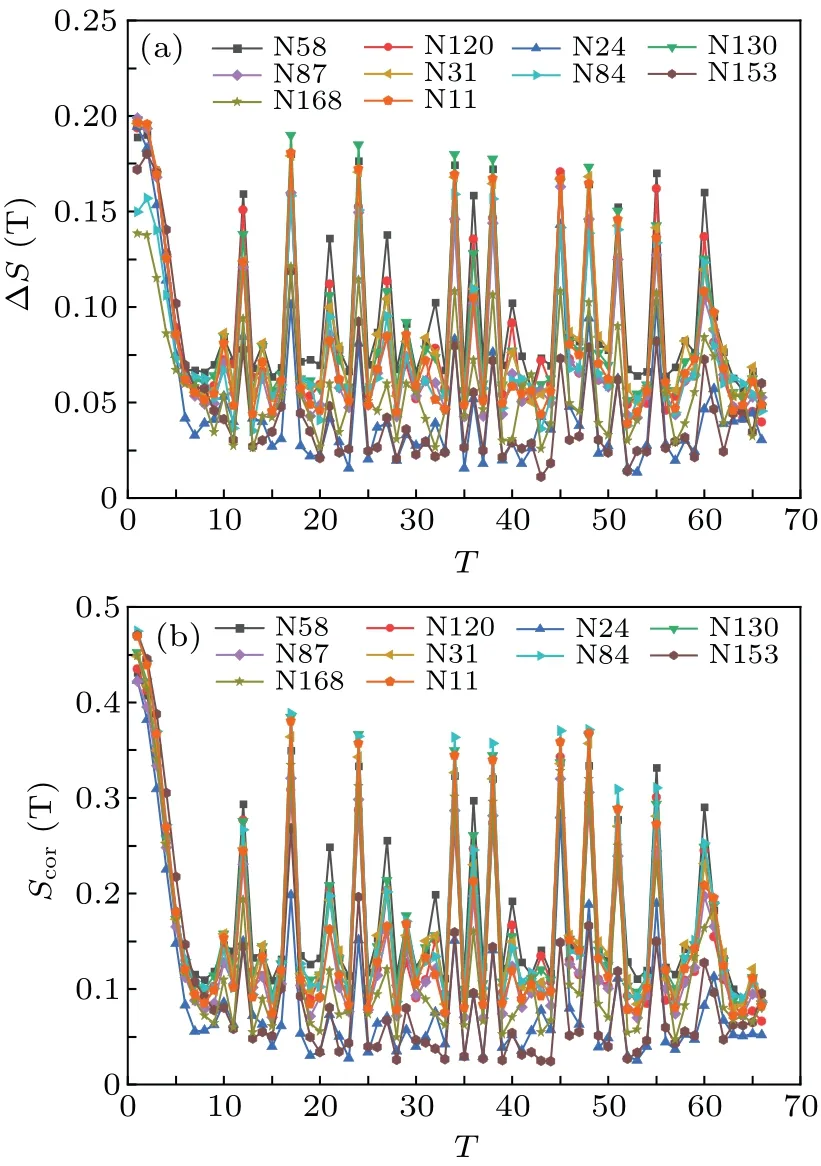
Fig.9.Statistical data distribution of representative nodes of PeMSD8 road network: (a)ΔS(T)and(b)Scor(T).
From the peaks and valleys of the data in Figs.8 and 9,we can see that the distribution of the statistical curves is more similar to that of the representative nodes, indicating that the representative nodes have similar data change laws.On this basis, reconfiguration parametersmandτof representative nodes are solved by applying C-C algorithm.Tables 1 and 2 give the detailed calculation results.Meanwhile, the mean rounding method is utilized for averaging reconstruction variables of representative nodes,and then themandτof all nodes are obtained.Table 3 lists the specific values.
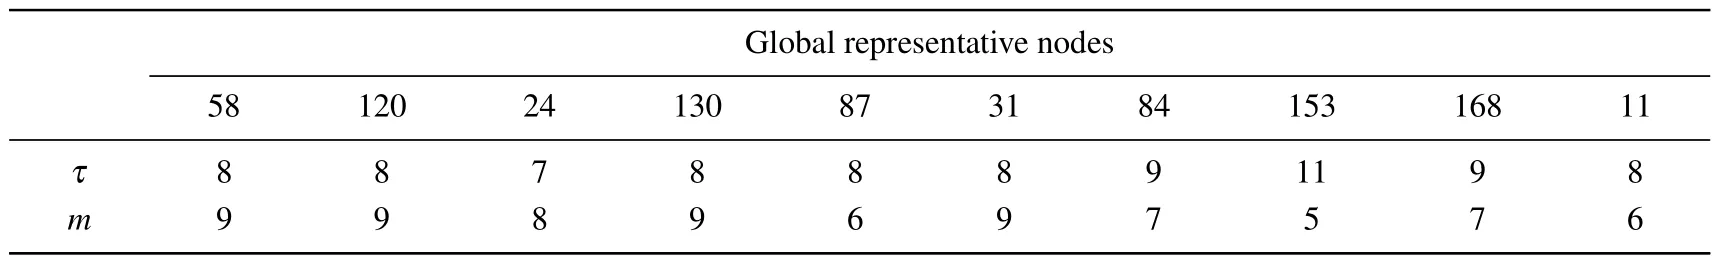
Table 1.Phase space reconstruction parameters of PeMSD4 representative nodes.
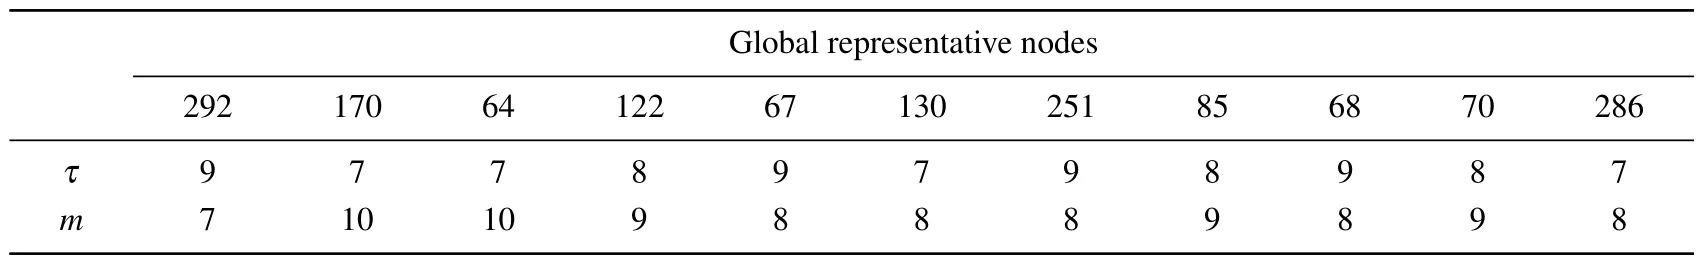
Table 2.Phase space reconstruction parameters of PeMSD8 representative nodes.
From the data in Table 1, the maximum value of the reconstruction parametermis 11 and the minimum value is 7 in the PeMSD4 dataset.Analysis of Table 2 indicates that the difference between maximum value and minimum value ofmandτfor the representative nodes of PeMSD8 are 2 and 3,respectively, and their differences are small.Therefore, the mean values of the reconstruction parameters of the representative nodes of the road network in Table 3 can be utilized to represent the values ofmandτfor all nodes in this road network region,and this approach greatly improves the efficiency of multivariate reconstruction.
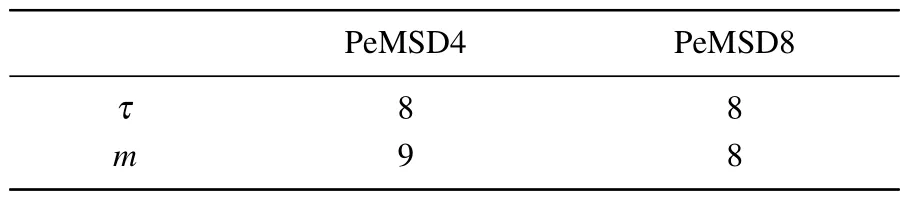
Table 3.Phase space reconstruction parameters of road network nodes.
To determine the chaotic features of PeMSD4 and PeMSD8 datasets, this paper conducts a phase space reconstruction of all node data based on the reconstruction parameters obtained.Then the largest Lyapunov exponent (LLE)is obtained by using the wolf[35]method to discriminate the chaotic characteristics of the traffic flow.When the largest Lyapunov exponent is a positive value, the phase point evolution law no longer follows the periodic law of continuous convergence of adjacent phase points,and the phase point trajectory in high-dimensional space obviously follows the nonperiodic evolution law, and the dynamical system is considered chaotic at this time.Figures 10(a)and 10(b)represent the LLE for node data of PeMSD4 dataset and PeMSD8 dataset,respectively.The horizontal and vertical coordinates in the figures represent the node serial number and the largest Lyapunov exponent,respectively.
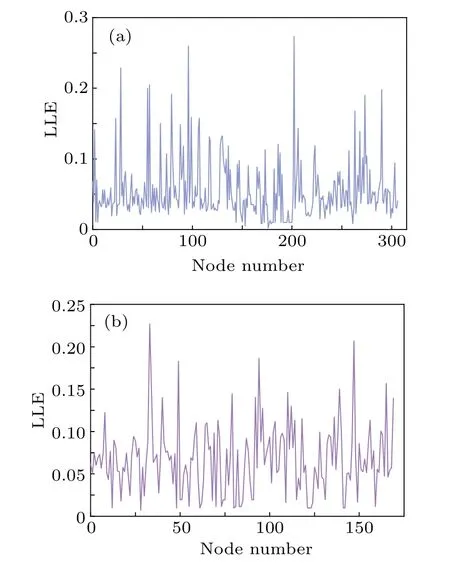
Fig.10.Largest Lyapunov exponents of node data of(a)PeMSD4 and(b)PeMSD8.
From the data in Fig.10, we can observe that the LLEs of all nodes in the PeMSD4 and PeMSD8 datasets are greater than 0, indicating that the data of each node in the road network all possess chaotic characteristics.
3.4.2.Model optimization experiments based on ALPSO
To verify the efficiency of the ALPSO algorithm, a one-dimensional vector optimal solution optimization problem is constructed.TheG1= (a1,a2,...,aJ) andG2=(a1,a2,...,aJ) are assumed to represent the solution vector and the target vector, respectively, whereJrepresents the total number of vector elements.The solution vector refers to the individual particle.Therefore,the optimization problem is expressed asG1continuously approximatingG2through multiple iterative updates,and the algorithm stops iterating whenG1equalsG2,which means that the particle finds the optimal solution.The experiment setsJto 10 and the particle count to 500.Meanwhile, the values of all elements of the target vectorG2are initialized to 2.2.The values of individual particles are randomly initialized in a range from-10 to 10.The optimization performances of different algorithms are given in Table 4.
Combination with the analysis in Table 4 evidently shows that the iteration number to searching for optimal solutions is 880 for traditional PSO and 681 for traditional IPSO, and their corresponding algorithm running times are 14 s and 10 s,respectively.The ALPSO finds the optimal solution in only 81 iterations,which corresponds to an algorithm running time of 2 s, less than all the compared algorithms.Therefore, the ALPSO algorithm can better balance the relationship between the local search step and the global search step for particles and has higher optimization efficiency.
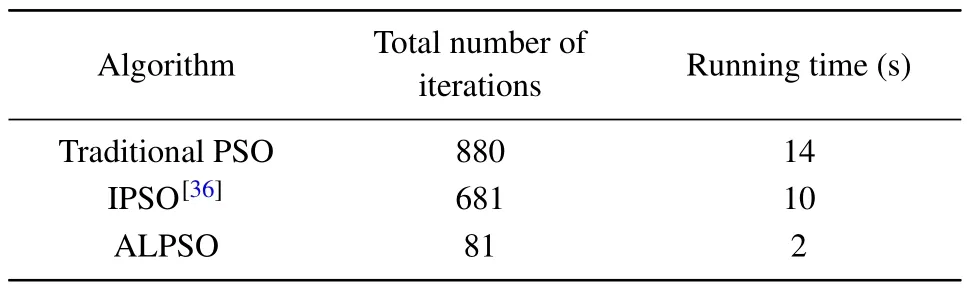
Table 4.Optimal results from different PSO algorithms.
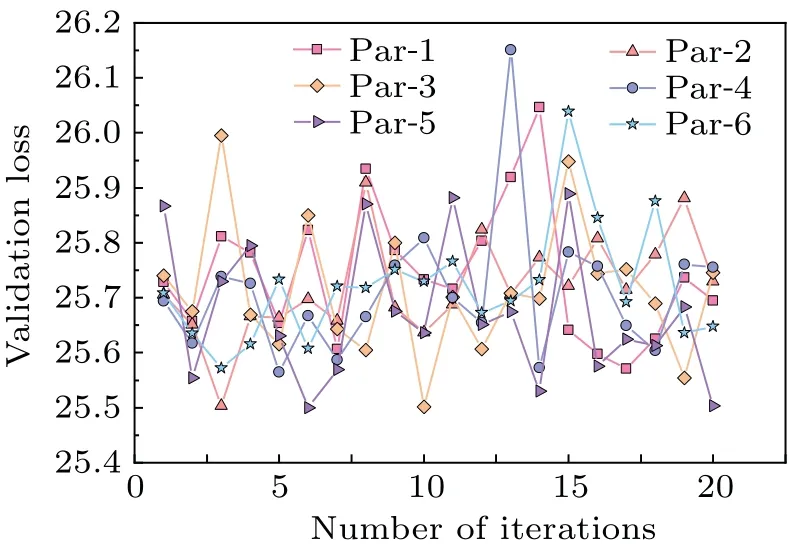
Fig.11.Model optimization based on ALPSO.
Based on the verification that the ALPSO algorithm has better performance,this research achieves the model optimization process by taking the number of model input batches,ConvLSTM convolutional kernel number, and convolutional kernel dimension as an individual particle.Figure 11 shows the validator error for 6 particles during 20 iterations.The analysis of the overall particle search process indicates that the particle Par-5 finds the best value of the model hyperparameters at the 6th iteration.At this time,the count for model input batches is 52, the number of convolution kernels for ConvLSTM is 51, and the convolution kernel along the horizontal axis and vertical axis have three dimensions.
3.4.3.Combined model experiments
In this paper,the optimization results of ALPSO are used to set some hyperparameters of the model.To compare average effect of CCA with that of the baseline model, two real data sets,PeMSD4 and PeMSD8,are used as the research objects.The error indexes of different models in predicting the next one-hour traffic flow are given in Table 5.
The analysis of the data in Table 5 indicates that the traditional traffic flow prediction models HA and SVR only extract simple linear features from traffic data,so the comprehensive performances of the models are relatively poor.The LSTM and GRU can well extract the time dependence in the data,and outperform RNN in average effect on both datasets.The analysis from the perspective of modeling micro chaotic features and macro temporal features indicate that the CNN-LSTM performance indexes are superior to the indexes of modeling approach with considering only chaotic sequence temporal features.Analysis from the perspective of spatiotemporal feature modeling shows that DCRNN and ASTGCN both can extract the spatiotemporal features and outperform CNN-LSTM in RMSE,but are slightly inferior to CNN-LSTM in MAE,indicating that spatiotemporal features and chaotic characteristics can enhance model prediction performance from different feature perspectives.Compared with the baseline model, the CCA model can fully extract the microscopic chaotic features while considering the spatiotemporal features.The RMSE,MAE,andR-square of CCA on PeMSD4 are 32.22,19.43,and 0.932,respectively.The RMSE,MAE,andR-square of CCA on PeMSD8 are 22.94, 13.95, and 0.943, respectively, which outperforms the counterparts of all baseline models.In particular,in the PeMSD8 dataset,the RMSE and MAE of CCA are reduced by at least 9.5% and 12.4%, respectively, compared with those of the optimal baseline model.In the PeMSD4 dataset,the MAE of CCA is reduced by 4.9%compared with that of the ASTGCN model with better comprehensive performance in the baseline, and theR-square is improved by 1.3%compared with the counterpart of CNN-LSTM that only considers chaotic and temporal characteristics,further demonstrating that the CCA model achieves a fine-grained extraction process of macro and micro features of traffic data.
Figures 12 and 13 show the index curves of CCA and the baseline model in predicting the traffic flow of 12 time slices in the next hour.A comprehensive analysis of the index curves in the figure indicates that in the baseline model,the traditional statistical model HA has poor prediction performance and the SVR has improved prediction performance on the PeMSD8 dataset.The RNN, GRU, and LSTM only consider the time characteristics of data,and the performances of the three models are similar.The CNN-LSTM considers the chaotic characteristics and time characteristics, and the comprehensive performances of its index curves are superior to those of the model that only considers the temporal characteristics of chaotic sequences.The DCRNN and ASTGCN both consider the spatiotemporal characteristics which,in the first time slice,both have small RMSE values.With increasing time steps, the RMSE curve and MAE curve of the CCA model always increase at a relatively flat rate, which shows that the CCA model has better stability in predicting the future traffic flow at multiple time steps.Meanwhile, the RMSE,MAE,andR-square of the CCA model predicting the 12th time slice on the PeMSD8 dataset are 24.71, 14.99, and 0.928, respectively; and the RMSE, MAE, andR-square of the 12th time slice on the PeMSD4 dataset are 33.44, 20.17,and 0.927,respectively,which are superior to the counterparts of all other baseline models.The aboveanalyses demonstrate that the CCA model can extract the macro and micro features of traffic flow more completely and has better prediction performance in predicting the future traffic flow in multiple time slices.
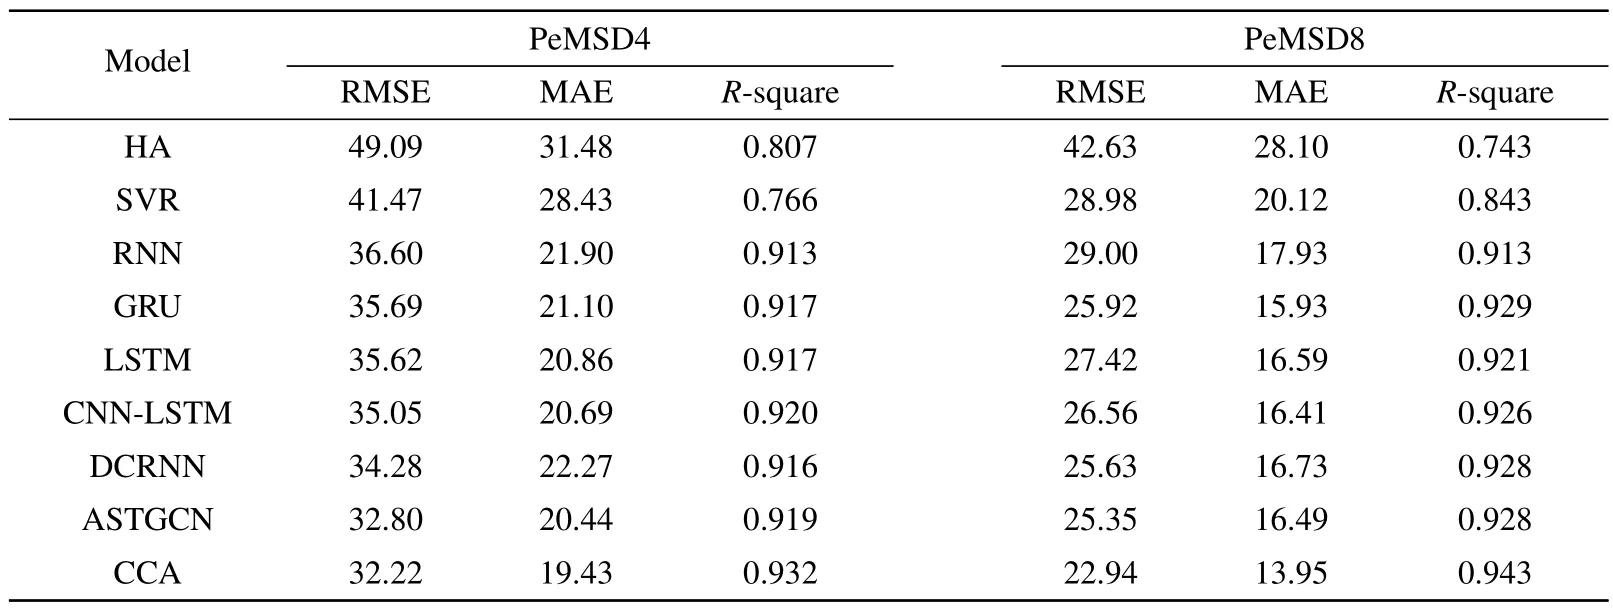
Table 5.Comparison of performance between CCA and baseline.
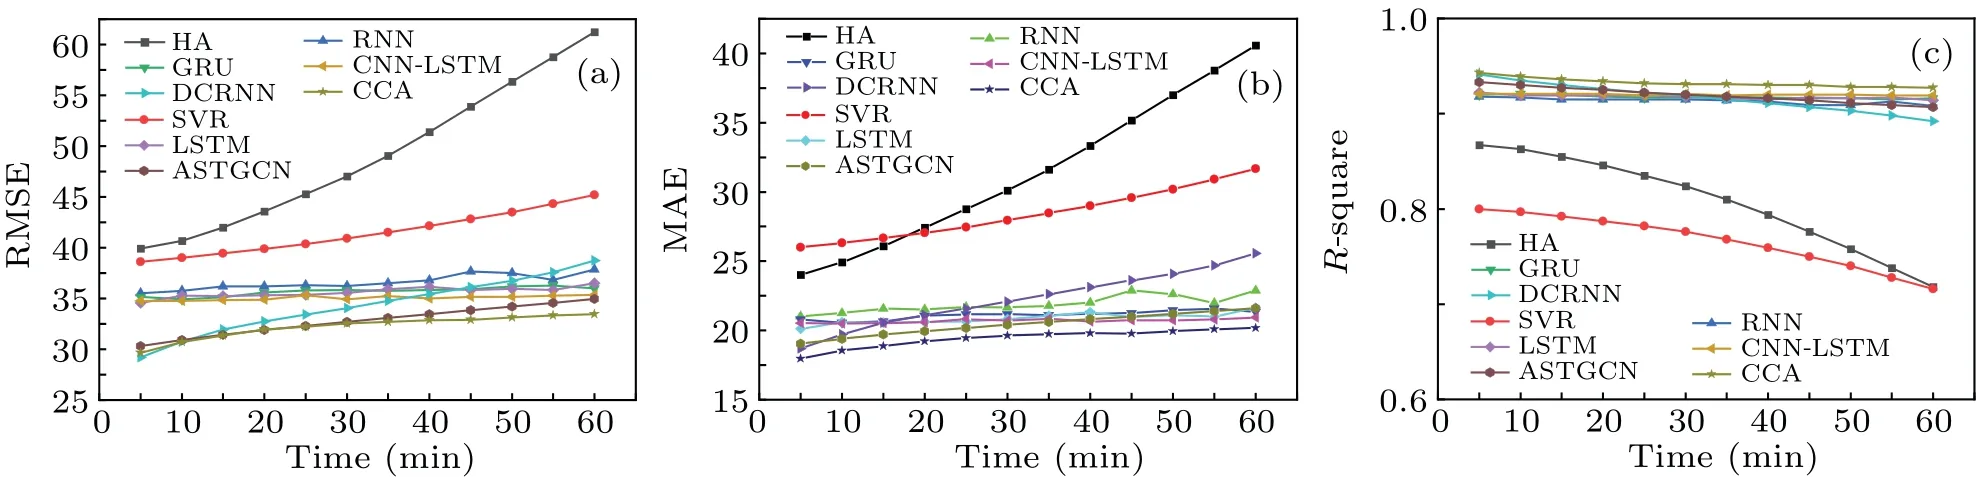
Fig.12.Comparison of performance among different models on PeMSD4: (a)RMSE,(b)MAE,and(c)R-square.
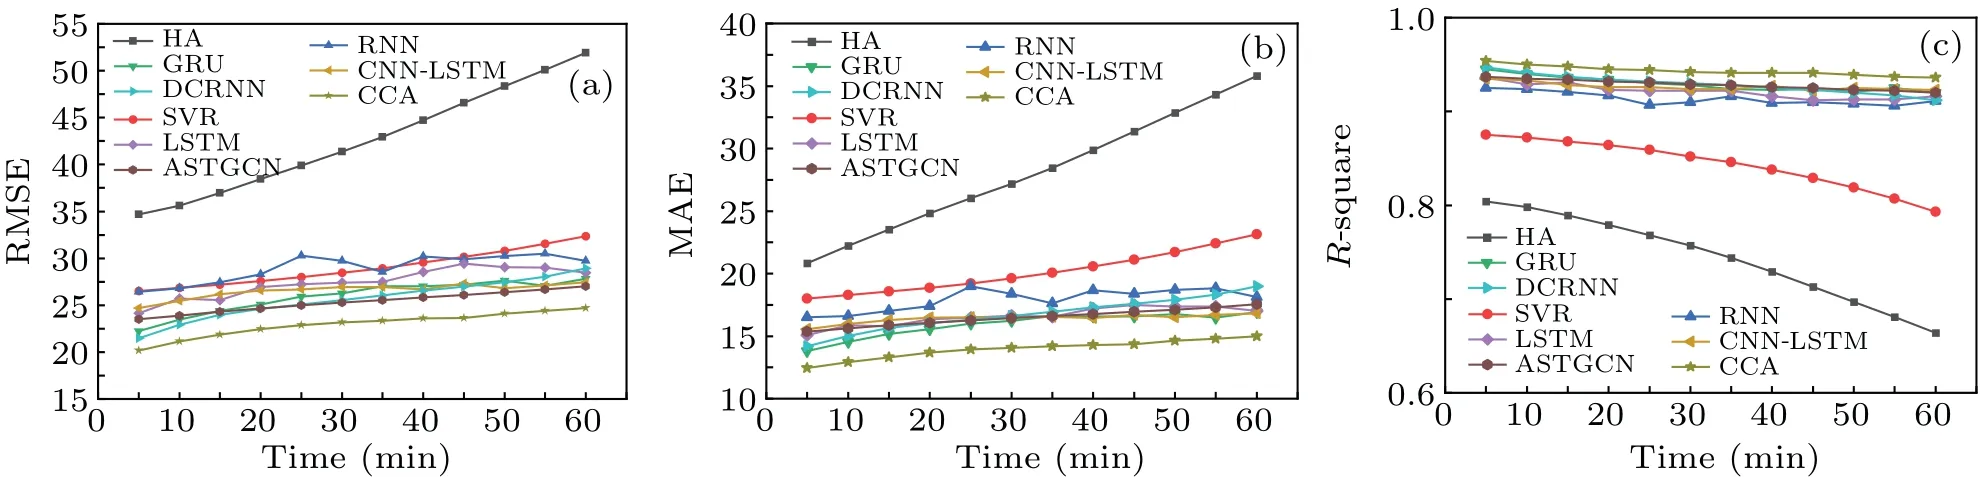
Fig.13.Comparison of performance among different models on PeMSD8: (a)RMSE,(b)MAE,and(c)R-square.
3.4.4.Ablation experiments
To fully validate the feasibility and innovation of the modeling ideas in this research, this subsubsection takes the PeMSD8 dataset as the research object,and analyzes the ablation experiment of the model.Taking CCA as the base model,the model with removing the macro spatiotemporal feature extraction module is named CCA-ST, and the model with removing the micro chaotic feature extraction module is called CCA-M.Table 6 describes the index values for the ablation experiments.
Analysis of the data in Table 6 indicates that the CCAST removes the macro spatiotemporal feature extraction module of traffic flow and its RMSE, MAE, andR-square on the PeMSD8 dataset have higher values of 34.93, 22.83, and 0.881,respectively.The CCA-M removes the traffic flow microscopic chaotic feature extraction module, and its RMSE,MAE,andR-square on the PeMSD8 dataset are 24.27,14.56,and 0.937, respectively.The RMSE and MAE of CCA decrease by 34.3%and 38.8%,respectively,and theR-square is improved by 7%compared with those of the CCA-ST,which further illustrates that the modeling idea of this paper can better improve the model overall performance by comprehensively considering the micro features and macro spatiotemporal features of chaotic traffic flow.
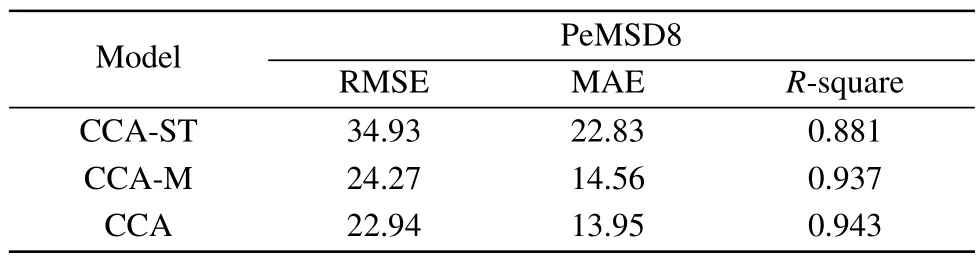
Table 6.Comparison of performance among variant models on PeMSD8
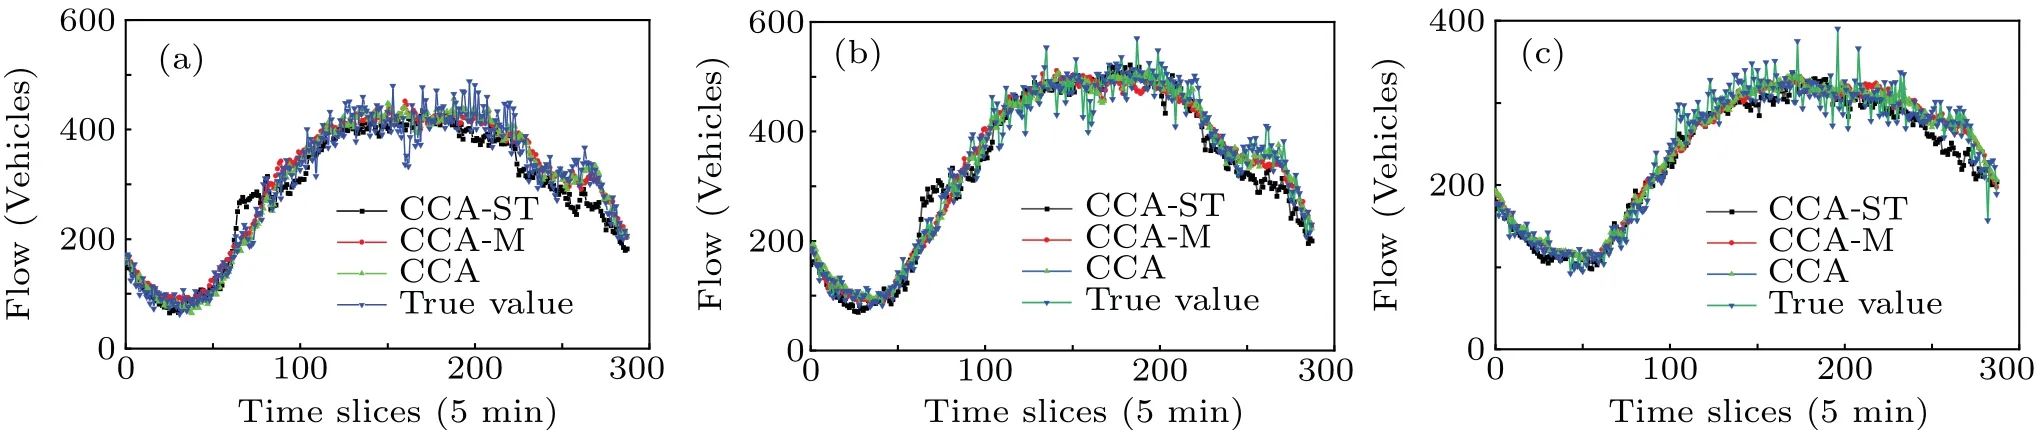
Fig.14.Prediction results of different models in(a)detector 1,(b)detector 4,and(c)detector 131.
To further highlight the prediction performance of the proposed model in this research, we randomly select the predicted values of 288 time slices of detectors numbered 1, 4,and 131 in the test set and compare them with the corresponding true values, and the results are shown in Fig.14.The combination of the data distribution of the true and predicted values in the figure shows that the true values maintain an ascending trend when the time slice is in a range from 50 to 120 and a descending trend when the time slice is in a range from 230 to 288,respectively.At this time,the predicted values of CCA-ST on the detector numbered 1 and the detector numbered 4 deviate more from the true value,and the deviation of CCA-M decreases compared with that of CCA-ST, while the predicted value of CCA always fits the true value more closely,and it has the smallest overall deviation.The true value fluctuates more when the time slice is taken in a range from 150 to 220.At this time,CCA-ST deviation is still larger,especially in the detector numbered 4 it is more obvious, CCA-M floats above or below the middle boundary of the true value, while the predicted value of CCA as a whole remains at the middle boundary position of the fluctuation line, with better stability.The above analysis shows that the CCA model, which integrates spatiotemporal and chaotic features,has better prediction performance than the CCA-M and CCA-ST models,which consider features only from a single perspective.
4.Conclusions
By combining the nonlinear dynamic features and macro spatiotemporal features of chaotic traffic flow, this research proposes an intelligent combinatorial forecasting model that integrates the macro and micro characteristics of traffic flow.Through the analysis of CCA performance indexes from different perspectives,several reliable conclusions are drawn below.
(I) The ALPSO can better adaptively adjust the balanced relationship between the global search step and the local search step for particles.In a one-dimensional vector optimization problem, ALPSO only requires 81 iterations to find the optimal solution,outperforming all comparative algorithms.
(II)In the process of constructing the road network association matrix,it can be found that although the traffic network structure is unknown,the IMPSR can still filter the global representative nodes by constructing the road network correlation matrix, and then reconstruct the phase space tensor that can effectively portray the chaotic characteristics of traffic data.
(III) In comparative experiments on traffic data forecast,the CCA has the lowest error indexes on both PeMSD4 and PeMSD8 datasets.Taking the MAE as the evaluation metric,the CCA model reduces 4.5% and 12.4% respectively on the two datasets compared with the model with the best effect in the baseline and thus has superior prediction performance.
(IV) The analysis of the ablation experiment demonstrates that the CCA model outperforms the model that considers both macro spatiotemporal and micro chaotic characteristics alone.In particular, the RMSE and MAE indexes are reduced by 34.3% and 38.8%, and theR-square is enhanced by 7%compared with the counterparts of the CCA-ST model which only considers the chaotic characteristics,thus demonstrating the feasibility of this paper considering macro spatiotemporal characteristics for chaotic traffic data and micro chaotic characteristics comprehensively.
(V)Future work will further investigate the contributions of other traffic parameters like traffic speed and vehicle spacing in traffic data prediction,and introduce weather,holidays,and other external factors to enhance model robustness.
Acknowledgements
Project supported by the National Natural Science Foundation of China (Grant No.62063014) and the Natural Science Foundation of Gansu Province, China (Grant No.22JR5RA365).
猜你喜歡
文萃報·周二版(2022年10期)2022-03-19 22:43:34
湘潮(上半月)(2021年10期)2021-12-02 02:09:42
馬克思主義哲學研究(2021年1期)2021-11-22 07:47:42
花火·慧閱讀(2021年11期)2021-11-17 00:32:35
湘潮(上半月)(2021年4期)2021-07-20 08:05:26
馬克思主義哲學研究(2021年2期)2021-06-05 07:01:34
Plasma Science and Technology(2021年5期)2021-05-22 07:01:08
馬克思主義哲學研究(2020年1期)2020-11-26 07:25:28
Nuclear Science and Techniques(2014年1期)2014-04-24 09:29:06
晚報文萃·開心版(2013年8期)2013-04-29 01:52:56

- Chinese Physics B的其它文章
- Corrigendum to“Reactive oxygen species in plasma against E.coli cells survival rate”
- Dynamic decision and its complex dynamics analysis of low-carbon supply chain considering risk-aversion under carbon tax policy
- Fully relativistic many-body perturbation energies,transition properties,and lifetimes of lithium-like iron Fe XXIV
- Measurement of the relative neutron sensitivity curve of a LaBr3(Ce)scintillator based on the CSNS Back-n white neutron source
- Kinesin-microtubule interaction reveals the mechanism of kinesin-1 for discriminating the binding site on microtubule
- Multilevel optoelectronic hybrid memory based on N-doped Ge2Sb2Te5 film with low resistance drift and ultrafast speed