
Chemical and physical studies of metallic alloy-based old Indian coins with LIBS coupled with multivariate analysis
2023-10-08 08:20:56VikasGUPTAAbhishekhKumarRAITejmaniKUMARRajendharJUNJURIManojKUMARandRAI
Plasma Science and Technology 2023年9期
Vikas GUPTA,Abhishekh Kumar RAI,Tejmani KUMAR,Rajendhar JUNJURI,G Manoj KUMAR and A K RAI,?
1 Laser Spectroscopy Research Laboratory,Department of Physics,University of Allahabad,Prayagraj 211002,India
2Department of Earthand Planetary Sciences,University of Allahabad,Prayagraj 211002,India
3AdvancedCentre ofResearch in High Energy Materials,University of Hyderabad,Hyderabad 500046 India
4 Leibniz Institute of Photonic Technology,Jena D-07745,Germany
Abstract The present work aims to demonstrate the capabilities of Laser-induced Breakdown Spectroscopy(LIBS) coupled with a multivariate technique for rapid quantification and classification of old Indian coins made of various alloys.Thirteen old Indian coins in different years of circulation,(1922-1986) were selected for the study.The concentrations were determined by Calibration free LIBS(CF-LIBS) method.The concentration of cuprum(Cu) is negligible,and aluminum(Al)is maximum in the first five coins,and vice-versa in the remaining eight coins.Two different multivariate methods,Principal Component Analysis(PCA)and Soft Independent Modelling of Class Analogy(SIMCA) have been used to classify and identify the coins.PCA classified all thirteen samples into four main alloy categories.The discernment of unknown samples to their probable class membership of alloy was performed using SIMCA.The surface hardness(Brinell hardness number) is linearly correlated with the plasma temperature and LIBS intensity ratios.The sample surface of the first and fifth coin belongs to Al-alloy,having the least surface hardness,and it became harder for Cu-Ni alloy,Ni-brass alloy,and bronze alloy.The hardness of the surface is more for bronze sample twelve.It is also observed that the plasma temperature increases monotonically with the Brinell hardness number.This analysis provides valuable information on fabrication methodology and explains large diversification in the elementary composition of old coins.
Keywords:LIBS,metallic alloy,stoichiometric ablation,PCA,SIMCA,old indian coins,surface hardness
1.Introduction
We observed extensive diversification in the elementary composition and fabrication methodology in Mughals/British coins and Indian rupee coins during India’s independence[1-4].During that period,both decimal and non-decimal coins are in circulation.Before India’s independence,British Indian coins were categorized/named as non-decimal coins.After India’s independence,British Indian coins were used as a frozen currency until India became a republic in 1950.The first rupee coins of the Republic of India were minted in 1950.These coins are referred to as Anna series or pre-decimal coinage,which includes a half rupee,quarter rupee,two annas,one anna,half anna and one pice coins.In the Annaseries,one rupee was divided into 16 annas or 64 pice,with each anna equal to 4 pice.In 1957,India shifted to the decimal system.After adopting the decimal system,the coins minted between 1957 and 1964 were printed with the legend‘Naya Paisa’(New Paisa).With the Indian Coinage(Amendment) Act of 1955,India shifted to the ‘Decimal System’,according to which a new ‘decimal series’ was introduced in 1957.The rupee was now divided into 100 paise instead of 16 annas.These newly introduced coins were initially struck with the words ‘Naya Paisa’ to distinguish them from the previous coins,but the word‘Naya’was dropped in 1964.A steady increase in pricing gradually led these coins to be minted only in Al from 1964,and these new Al series dropped the word‘Naya’from it.Later a new metal was introduced,and we soon had Ferritic Stainless Steel coins of 10,25,and 50 paise introduced in 1988 and one rupee in 1992.Due to a considerable decline in demand for coins of lower denominations and an increase in metal costs,circulation of lower denomination coins was reduced,and the Government of India,in consultation with the Reserve Bank of India,decided to mint all denomination coins in ferritic stainless steel in 2006 [1].These coins,categorized as Anna series(NDC),Naya Paisa(Frozen Currency/DC),and Paisa(NDC) were mainly made of the composition of metals/alloys like copper-nickel(cupronickel),copper-nickel-zinc(nickel-brass),bronze and aluminium-magnesium [1,2].
The composition of metals/alloys,in ancient times as well as during India’s independence was very expensive and highly valued materials.They had a face value at the minimum size and weight,that is why many coins were made of gold or silver or copper,or iron in that period.Therefore,the first and most important is that metals/alloys are more resistant and can stand long travels and use.The second is that in ancient times the value of coins was their face value.There were no central banks to back up what they said their worth was.The coins that are planned for circulation should have some special properties/requirements like the ease of stamping,anti-corrosion properties,and high durability so that they can be used for a long time.Achieving this goal has tended to necessitate the use of alloys.Most of the coins during India’s independence are made of mainly aluminummagnesium alloy and copper alloy(cupro-nickel,nickelbrass,and bronze).Metals,like copper,silver,gold,and iron were also used in ancient times to make coins because of their hardness and high durability.Iron may have been replaced because of its usage in war equipment and its tendency to get corroded easily.The different compositions of metals or alloys have been widely used to make coins.Other metals like gold and silver were replaced because of the variation of their face value during different periods.Most of the coins during India’s independence were made up of copper.Brass,the composition of copper and zinc with a 1:3 ratio may be chosen because of its attractive gold color with high durability and anti-corrosion properties[5].Also,it is relatively cheaper and stronger than copper.The coins made by the melting copper along with nickel or tin were also used to make coins known as copper-nickel and bronze.The use of copper in most of the coins is because of being a naturally antibacterial material.The durability of copper-nickel coins is more than that of other alloys,that is why it was used to make coins.Bronze has also been used to make coins.Bronze is harder than copper due to alloying that metal with tin or other metals.Bronze is also more fusible(i.e.more readily melted) and is hence easier to cast.It is harder than pure copper and far more resistant to corrosion.We observed that ancient coins were made of gold,silver,copper,or alloys containing a high percentage of these three elements.The value of a coin was the market value of the metal in it.Modern coins represent a promise from the issuing government rather than the coin’s actual value.It becomes necessary to change to cheaper metals when the metal in a coin costs more than the actual coin.At that time,Al was also a suitable metal to make coins that had low cast and lightweight.Also,we could make more coins than copper or zinc from the same process with the same amount of material with the least cast.Also,lighterweight of coins could make them easier to carry.Metals/alloy were also used as a coin because it is hard and difficult to break.It has also been observed that in ancient periods/during Indian independence,bronze was a hard metal than copper,which has been widely used to make coins and artifacts [6-10].
To get an idea about the dynasty of the different periods(Mugal,British,and Indian),it is of utmost necessity to identify and quantify the major and minor constituents of the coins.Therefore,we aim to present an example for quick identification,quantification,and classification of various currencies/coins using Laser-induced Breakdown Spectroscopy(LIBS) coupled with multivariate methods.
Different analytical techniques like inductively coupled plasma-atomic emission spectrometry(ICP-AES),x-ray fluorescence spectroscopy(XRF),inductively coupled plasma-mass spectrometry(ICP-MS),and Energy Dispersive x-ray Analysis(EDX) are used for the elemental analysis of metallic objects.These techniques are more promising and give precise discernment of different elements/alloys used to prepare the coins [11-19].However,these techniques need sample preparation or involve solvent/dissolution.Sometimes it is impossible to take the sample to the laboratory due to their size or their surrounding conditions.Also,sometimes the things are so precious that they need analysis without damaging and breaking them.The coins associated with the surrounding objects on the wall needin situcharacterization.Therefore,we need a profound technique to overcome all these drawbacks in the above-discussed analytical tools for rapidly identifying and classifying metallic alloy-based objects.Recently,LIBS has emerged as a more effective tool for compositional analysis and identification/classification of materials/alloys used in producing different objects/coins[20-30].Because of its ability ofin situ,quasi-non-destructive,and no/minimal sample preparation,we can use this technique to identify and classify metallic alloys in different fields like archaeology and precious metallic alloys/coins.In addition to that,the LIBS can establish the correlation of mechanically measured surface hardness of the different coins with plasma parameters and intensity ratio of ionic and atomic lines [22,26,27].The conventional techniques such as theVickers hardness test,the Brinell hardness test,etc are destructive and time-consuming compared to LIBS.In the present work,we have measured the surface hardness of some coins with LIBS technique and compared it with the result found by the Brinell hardness number(BHN).
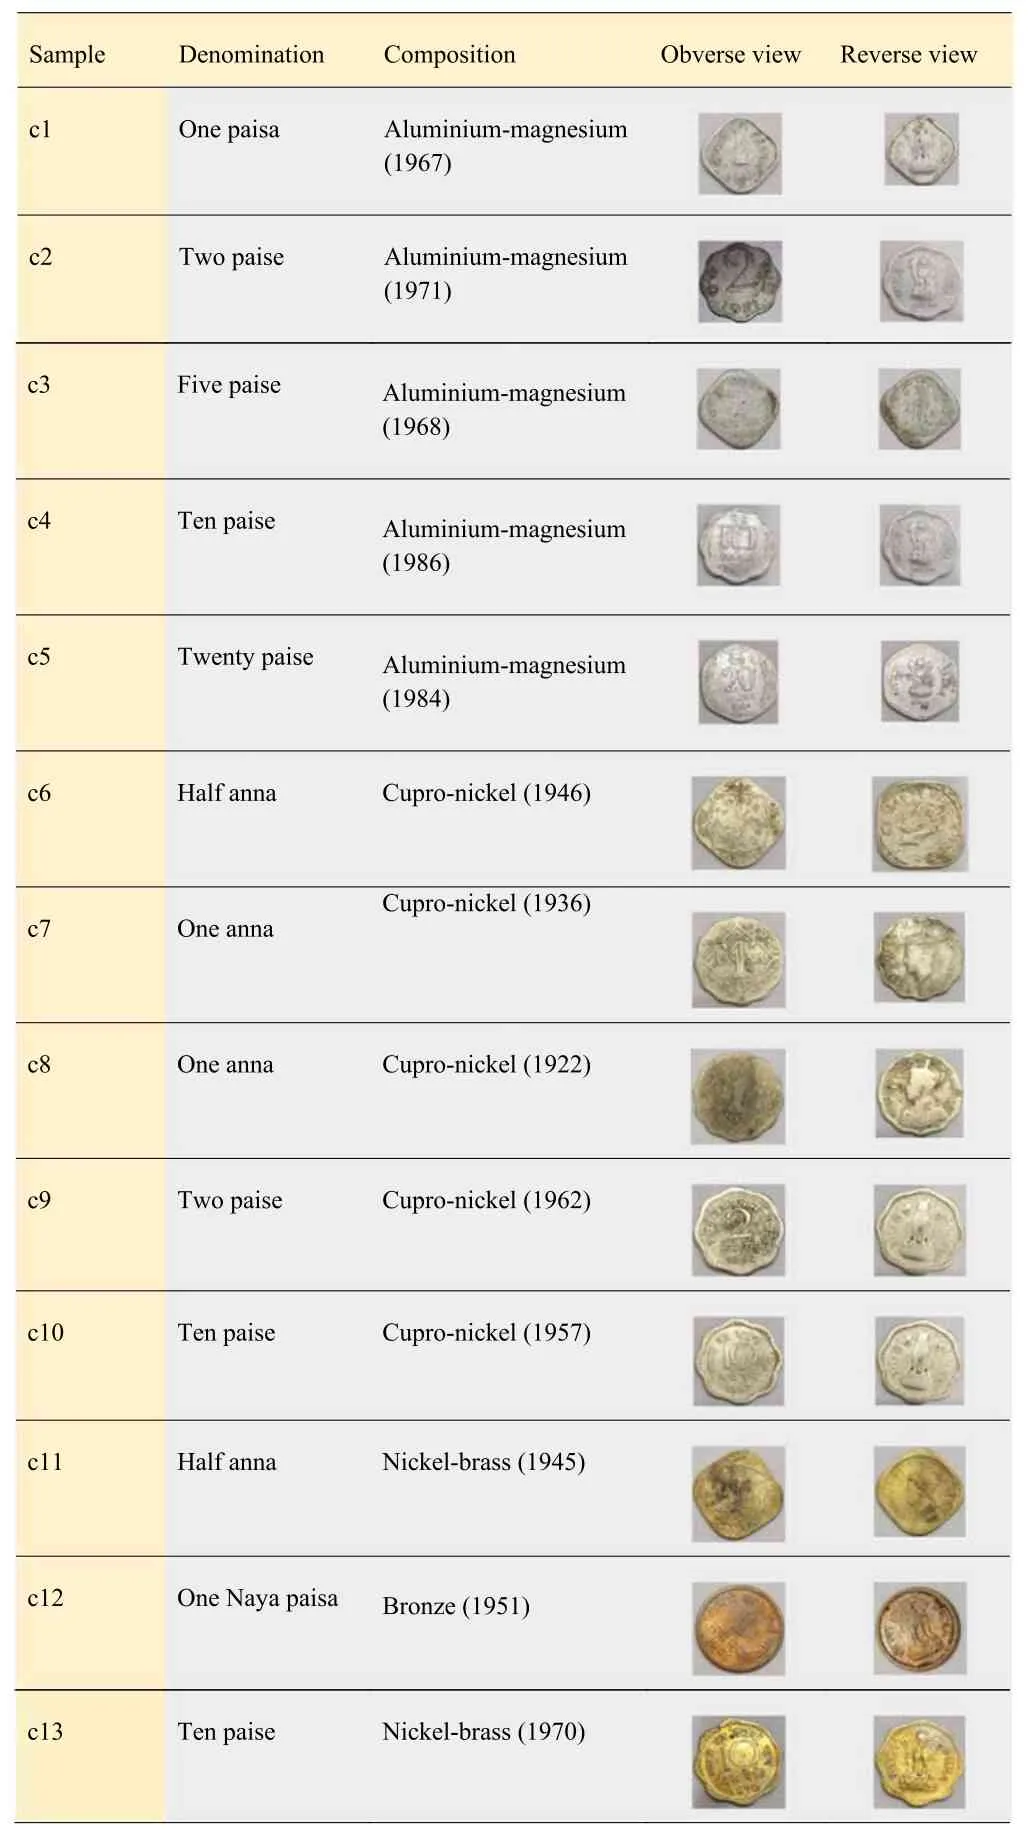
Table 1.Obverse and reverse view of old Indian coins with their composition.
The combination of LIBS with multivariate methods gives a quick and simple methodology for identifying and classifying metallic alloys,which is cost-effective and instant.Principle component analysis(PCA) and Soft Independent Modelling of Class Analogies(SIMCA) are well-known multivariate methods used for the classification and identification of samples [31-33].It extracts valuable information from a large LIBS data set.Multivariate analysis methods are used to evaluate and collect statistical data to clarify and explain relationships between different variables associated with this data.The above technique of LIBS is performed not only as a spectrochemical analytical technique but also as an easy way to measure the surface hardness of solid targets(metallic coins) simultaneously.
2.Material and methods
Thirteen old Indian coins have been selected for the study made up of two main categories of alloys,Cu alloy and Al-Mg alloy.The Al-Mg alloy is composed of mainly aluminum and 2%-3% magnesium where five coins belong to this category(alloy 1).Another five coins belong to cupro-nickel alloy(alloy 2).In the remaining three coins,two coins are composed of nickel-brass alloy(alloy 3) and one is bronze(alloy 4).Generally,cupro-nickel composed of Cu and Ni as main matrix elements with a ratio of 3:1 yields white colour.Similarly,in nickel-brass,the composition of Cu-Ni-Zn is 75%,20%,and 5%,respectively,yielding golden yellow colour.The appearance of cupro-nickel is nearly the same as with Al-Mg alloy [5].The composition of the selected coins was given on the RBI website [1].
The photographs and their composition of the 13 Indian coins are presented in table 1.Generally,these coins belong to different alloys like Al-Mg alloy,Cu-Ni alloy,Ni-brass,and bronze alloy,etc.Also,they were classified as Decimal(DC)and Non-decimal(NDC)coins.All the coins except c6,c7,c8,and c11 belong to NDC coins,and the remaining belong to DC.
2.1.LIBS instrumental setup
The LIBS spectra were recorded by accumulating five laser shots to get one spectrum.Thirty-five sets of LIBS spectra of each sample have been acquired by using a Q-switched Nd:YAG laser(Innolas split light 1200).The schematic diagram of the LIBS experimental setup is shown in figure 1.A planoconvex quartz lens with a 150 mm focal length is used to focus a pulsed laser beam at the sample’s surface.The laser delivered energy of 45 mJ,having an irradiance of nearly 1012W cm-2at the focal spot,generating a fugacious plasma.The emitted signal from plasma is recorded with the help of a Mechelle spectrometer(ME-5000) coupled to ICCD(Andor,iSTAR DH-734),having a 0.1 nm spectral resolution at 500 nm.The motion in theX-Ydirection of the sample stage is controlled with a motion controller(EPM 2000),which provides a fresh surface for each laser exposure.The surface contamination is removed by using defocused laser shots on the surface of the coins by moving the coins in a controlled manner using a suitable translational stage.Then the spectral signature was taken at the same fresh spot position by retracing.The other experimental parameters like the focal length of the lens,energy of the laser beam,lens to sample distance,repetition rate,etc are optimized to get better LIBS spectra.These experimental parameters are maintained the same during the whole experiment.

Figure 1.Schematic diagram of LIBS instrumental setup.
2.2.Estimation of surface hardness
In this section,we have used the Brinell hardness test to estimate the surface hardness of coins in terms of Brinell Hardness Number(HBN) using the formula given in equation(1).It is commonly used to determine the surface hardness of metals and alloys.In this method,we have indented a hardened steel or carbide ball under a load into the sample surface.The HBN is obtained by dividing the load,in kilograms,by the spherical area of the indentation in square millimeters;this area is a function of the ball diameter and the depth of the indentation
whereF-applied load(kg),D-indenter diameter(mm),andd-indentation diameter(mm).Here,we have taken 187.5 kg equivalent load for all samples,and 2.5 mm of indenter has been used.The impression of the indenter on the coins surfaces c1,c9,c11,and c12 has been shown in figure 2,and the hardness of the four coins c1,c9,c11,and c12 is listed in table 2.
3.Results and discussion
3.1.Qualitative analysis of the samples
The LIBS spectra of the coins in the UV-NIR spectral region are shown in figure 3 in the stacked form,providing the identification and discrimination of the samples based on the appearance of the spectral signature of significant elements.We have used the atomic spectra database(ASD) of the National Institute of Standards and Technology(NIST) for the assignment of the spectral lines of various elements in the LIBS spectra of the coins [34].
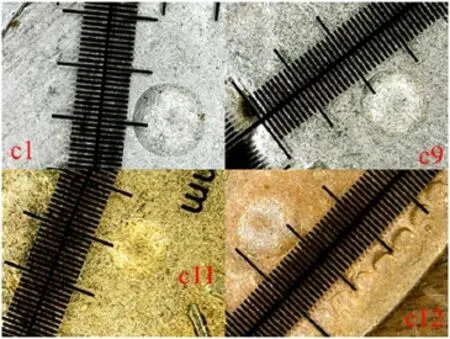
Figure 2.Impression of indenter on the surface of the coins c1,c9,c11,and c12.
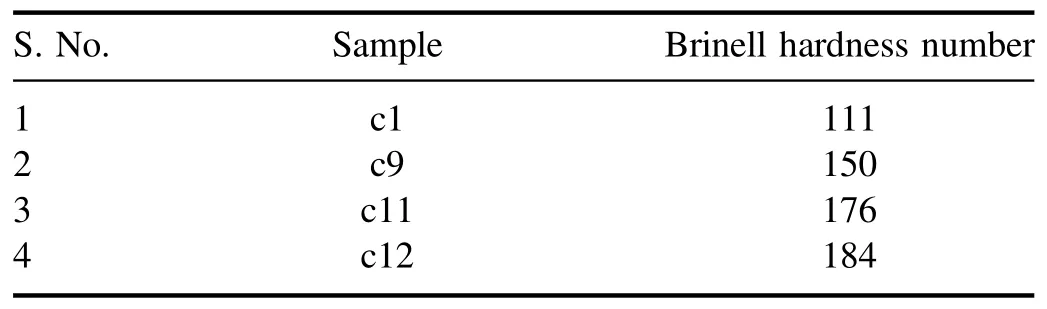
Table 2.The samples with their respective BHN.
Figure 3 shows the LIBS spectra of thirteen old Indian coins(c1-c13) in the spectral range of 240.0-595.0 nm.As shown in figure 3(a),a similar spectral signature in the LIBS spectra is observed for the samples c1-c5,which belong to only decimal coins(DC).Another group of coins(c6-c10)combination of decimal and non-decimal coins(Anna series)shows nearly similar LIBS spectra shown in figure 3(b).The LIBS spectra of the remaining three samples(c11-c13)show minor dissimilarity in spectral signature presented in figure 3(c).The spectral lines of Zn near 330.2 and 472.3 nm were not identified in sample c12,while it is present in samples c11 and c13.In contrast,the spectral signature of Sn near 283.9 nm is identified in sample c12,while it is absent in samples c11 and c13.Thus,it would look simple to classify the various coins based on the spectral signature of the major elements,as shown in figure 3.After analyzing the whole spectral range(220.0-875.0 nm) of LIBS spectra,we have seen that most of the major peaks were observed in the spectral region of 240.0-595.0 nm.Various major peaks of significant elements responsible for categorizing the samples in a different group of alloys have been observed in this spectral region.We have observed mainly the spectral lines of Al at 256.8,265.0,305.0,308.2,and 394.4 nm and those of Al II at 263.1,281.6 nm,and Mg at 279.1,and 517.1 nm in the LIBS spectra of the first five samples(c1-c5) with higher spectral intensity.The LIBS spectra of the remaining ten coins(c6-c13)clearly show the presence of spectral lines of Cu as significant elements with minor differences in spectral intensities of different elements.Copper is a common element that is found in all samples except c1-c5.We have identified the persistent lines of copper at 324.7,327.3,510.5,515.3,and 521.8 nm and the strong lines of copper as major peaks at 570.0 and 578.2 nm.We have observed the Ni and Zn spectral lines as major peaks at 251.1,310.18,341.50,352.4,361.9,334.5,472.2,and 481.0 nm,respectively.Spectral lines of Ni with Cu were also identified as significant peaks in the coins c6-c10.The coins c11 and c13reveal the presence of Ni and Zn,along with Cu as major peaks.While in coin c12,spectral lines of Zn and Sn were observed as major and minor peaks,respectively,along with Cu.The spectral signature of Sn is present in sample c12,shown separately in figure 3(d),which is not observed in samples c11 and c13.Al,Ca,Mg,and Na were found in all samples with different spectral intensities as major peaks in the samples c1-c5,while they were seen as minor peaks in all remaining samples.The spectral signatures of Ca and Na were observed as minor peaks in all coins.Therefore,we may conclude that different alloys were used to make these coins.The wavelengths of the spectral lines of various elements found in a different group of samples are summarized in table 3.
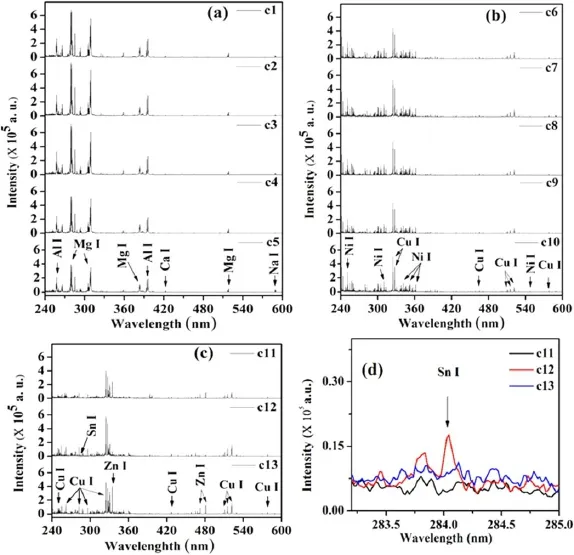
Figure 3.LIBS spectra of different coins(c1-c13) in the spectral range of 240.0-595.0 nm.

Figure 4.Comparison of the intensity of the spectral lines of the elements in different samples.

Figure 5.Comparison of spectral intensity of elements(Cu,Ni,Zn,and Sn) present in the sample.
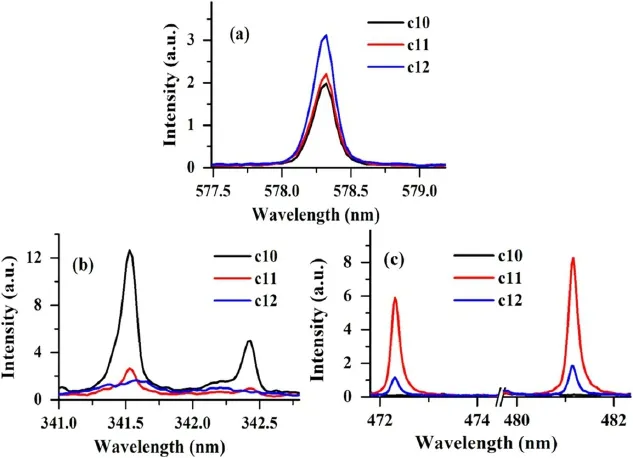
Figure 6.Comparison of the spectral intensities of the sample c10,c11 and c12(a)for Cu at 578.3 nm(b)for Ni at 341.5 and 342.4 nm and(c) for Zn at 472.3 and 481.1 nm.

Figure 7.The Boltzmann plot for the Cu I and Al I.
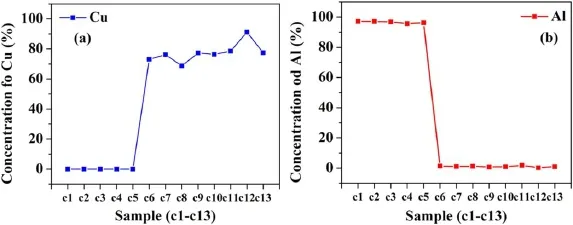
Figure 8.The variation of concentration of Cu and Al in coins c1-c13.
After analyzing the spectral lines of the elements listed in table 3,we may conclude that all samples can mainly be divided into four groups of alloys.The first five coins belong to Al-Mg alloy,and the remaining coins belong to Cu alloy.Further classification among the different Cu alloys is challenging without comparing the spectral intensity of the elements present in the samples.Therefore,a comparison of spectral intensity using a bar plot has been shown in figure 4.Single spectra have been taken from each sample to compare spectral intensities.
It is clear from the bar plot shown in figure 4 that the relative concentration of Al and Mg is higher in the first five samples belonging to alloy one compared to other samples.For other samples belonging to Cu-alloy(alloy 2),the relative concentration of Cu and Ni is approximately the same in samples c6-c10.For further classification of three coins(c10,c11,and c12) we have compared the relative intensity of spectral lines of Cu,Ni,Zn,and Sn,shown in figure 5.

Table 3.Wavelengths of the different spectral lines of major and minor elements present in samples.
Based on the relative intensity of these elements,we can conclude that sample c10 belongs to the copper-nickel alloy and sample c11 belongs to the Ni brass alloy.The sample c12 is different from c10 and c11 due to the presence of Sn.Therefore,it is clear that sample c12 belongs to bronze alloy.The relative spectral intensities of Cu and Ni at wavelengths 578.3 nm,341.5 nm,and 343.4 nm,respectively,are shown in figures 6(a)-(b).Also,the relative spectral intensity of Zn is shown in figure 6(c).
3.2.Quantitative analysis
To verify the result of qualitative analysis,we have calculated the concentration of each species in the samples using the CFLIBS [35-37].The CF-LIBS method does not need any reference materials.Therefore CF-LIBS has been used in this work for quantitative analysis.For quantitative analysis,we have looked over Plasma’s temporal evolution.The integrated intensity of the spectral lines of the elements in the LIBS spectra plays a vital role,as the concentration of the elements present in the sample is directly proportional to the intensity of the spectral line given in equation(2).The following equation(2) is the line intensityInm,of a transition in LIBS spectra.The suffix inInmindicates the transition from upper energy levelEnto lower energy levelEm
whereAnmis the transition probability for the transitionEntoEmandgnis the degeneracy parameter forEn,kBis the Boltzmann constant,CsandUs(T) are the relative concentration and partition function of that species,respectively,andFis an experimental factor.But before using the intensities of spectral lines for the analytical purpose,the laserinduced plasma should fulfil the following three conditions.
(i) Laser ablation should be stoichiometric.
(ii) The plasma should be optically thin.
(iii) Plasma should be in local thermal equilibrium(LTE).
To satisfy the first condition,the irradiance of the laser shot at the focus spot at the target sample(coins) should be higher than 1012W cm-2[27,35].This is a sufficient condition for stoichiometric ablation.Irradiance is dependent on the radiant flux of Nd:YAG laser pulse and the energy received by the area of the focal spot having a diameter(D)given in the equation below
where,λanddare the wavelength and diameter of the laser beam,andfis the focal length of the convex lens used to focus the laser beam on the target sample.We calculated irradiance for the present experiment and found near 5.0×10¹²W cm-2,which is much greater than 109W cm-2.Therefore we have achieved the criteria of the stoichiometric nature of the ablated part to proceed with further analysis.
For optically thin plasma,the theoretical value of the intensity ratio of two atomic lines of the same species should equal the experimental intensity ratio.These intensity ratios of two emission lines corresponding to the same species and having the nearly same upper energy level can be representedby the following equation
whereInmandIijare the integrated spectra line intensities i.e.the experimental values corresponding to the different transitions of the same species.
For the spectral lines of Cu at 510.5 nm and 570.0 nm having the nearly same upper energy level,we have found that the experimentally estimated intensity ratio(9.23)is quite near to the theoretically calculated intensity ratio(9.30) at gate delay near 1.5μs.A similar calculation was performed for all coins and found that experimentally determined intensity ratios are in good agreement with the theoretically calculated intensity ratio for the spectra recorded between 1.0 and 2.0μs gate delay.Thus,the delay time of 1.0-2.0μs is the best temporal window for quantitative analysis.Therefore,we have used this window for quantitative estimation of the elements.
In the present experiment,the McWhirter criterion has been used to fulfill LTE as it is an essential necessary condition for LTE.A detailed description has been described in earlier publications [10,22,25,38].
3.2.1.Elemental composition of the coins using CF-LIBS.After satisfying the three conditions,we applied the CF-LIBS algorithm [36,37].We have estimated the concentration of each element present in the sample with the help of the CFLIBS algorithm and the results are summarized in table 4.The Boltzmann plot for the species(Cu I and Al I) is shown in figures 7(a) and(b).Al is present in the first five coins(c1)-(c5) while Cu is present in last eight coins(c6)-(c13).
3.2.2.Variation of the constituents in coins based on designation.The samples named c1-c5,c9,c10,c12,and c13 belong to decimal coins(DC),and the remaining samples,c6-c8,and c11 belong to non-decimal coins(NDC).Therefore,out of 13 coins,nine coins belong to DC.The first five coins are made of mainly Al and Mg.The concentration of Al varies from(95.75±0.23)% to(97.11±0.19)%.From table 4,we observed that copper alloys like bronze,Ni-brass,and cupro-nickel had also been used to make DC.For four coins(c6-c8 and c11)belonging to NDC,two different alloys Cu-Ni alloys(c6-c8) and Ni-brass alloy(c11),have been used to make these coins.The variation of Cu in Cu-Ni alloy varies from(68.70 ± 0.10)% to(76.23 ±0.03)% and that of Ni from(21.27 ± 0.10)% to(27.58 ±0.13)%.The concentration of Cu is higher in c11 as compared to c6-c8 coins belonging to Cu-Ni alloy.Therefore,we observed no significant pattern in the manufacturing process of decimal and non-decimal coins.Although,a stronger negative correlation(negligible concentration) was observed in the group of coins c1-c5 and c6-c13 based on the concentration of copper and aluminum,respectively shown in figure 8.
3.2.3.Variation of the constituents in the coins based on alloy.After analyzing the composition of the coins,weconclude that these coins belong to mainly aluminum and copper alloys.The samples of the decimal coins from c1 to c5 belong to Al-Mg alloy,while the coins from c6-c10 and c11,c13,and c12 belong to different alloys like copper-nickel,brass,and bronze,respectively because of the relative concentration and composition as discussed in section 3.2 and also from results of CF-LIBS mentioned in table 4.
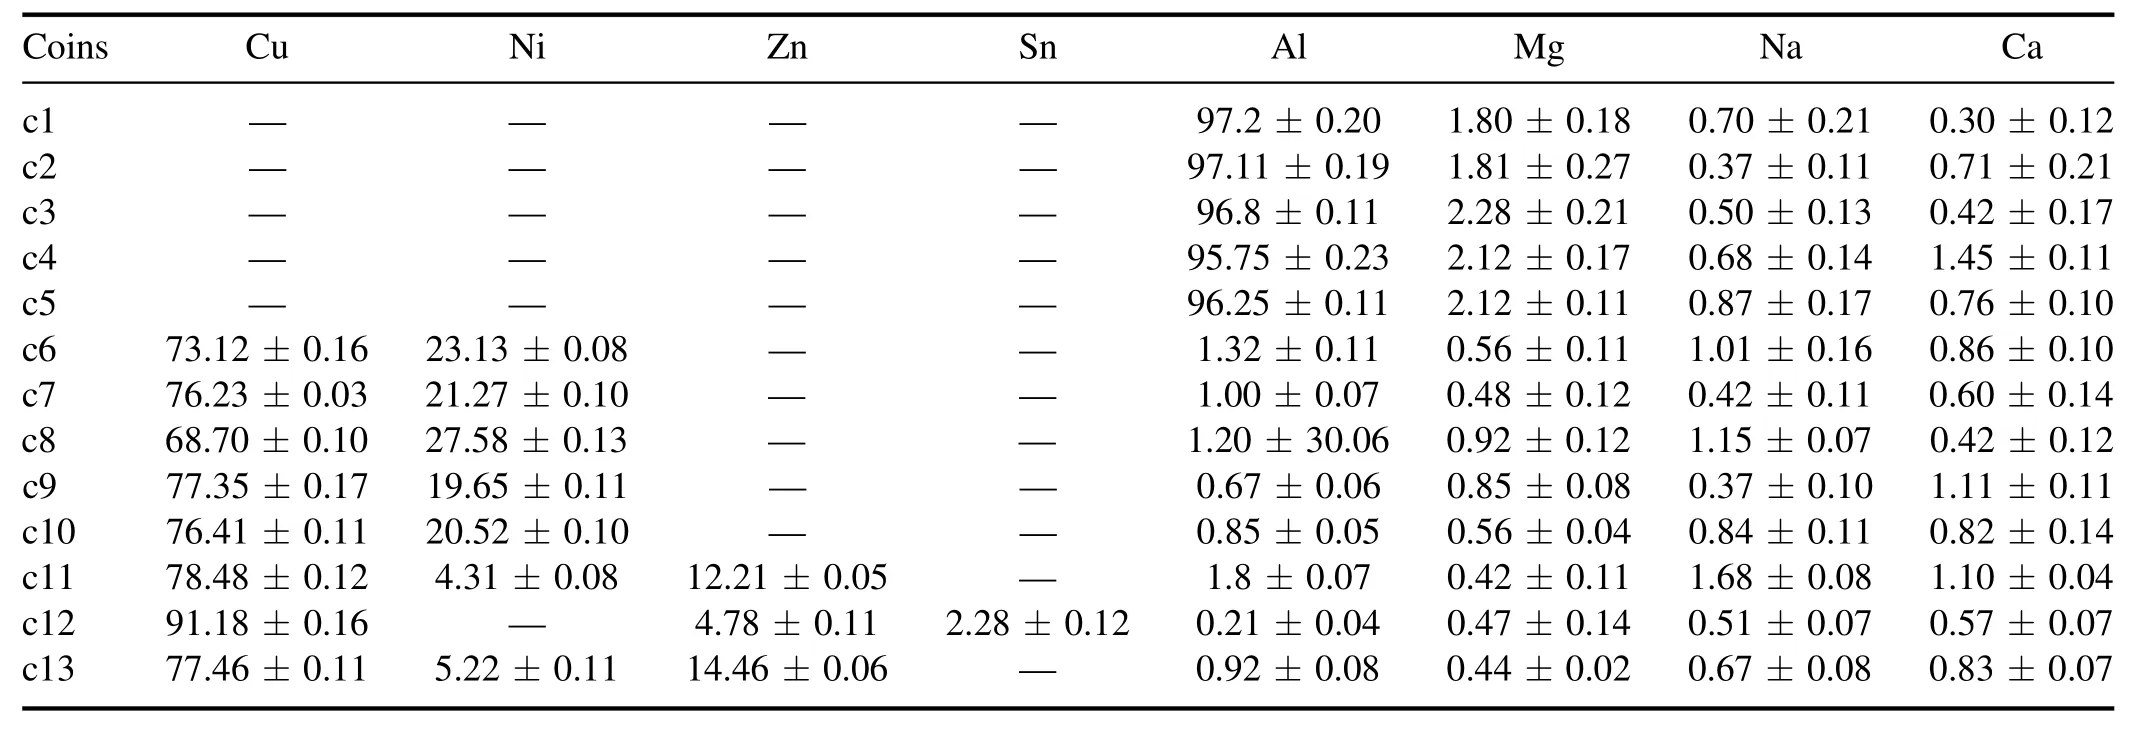
Table 4.Concentration(%) of the elements in the coins obtained by CF-LIBS.
3.2.4.Year-wise variation.Looking over the manufacturing year,we observe that these coins had been minted in different years mentioned in table 1.The coin c8 is the oldest coin out of all thirteen coins,while c4 is the latest one.Figure 9(a)shows the variation of Cu in various coins manufactured in different years.We observed that the coins minted up to the year 1962 contain a higher amount of Cu except coin c2.While the concentration of aluminum was increased in the coins minted after 1962.After that,copper was not used to minting coins.This indicates the change in the economic condition of India during that period.It seems that the manufacturing of coins shifted from copper to aluminum after almost 1962[1].It is clear from figures 9(a)and(b)that most of the decimal coins are made of mainly Al and belong to Al alloy.In contrast,most of the coins in the category of nondecimal coins were made of primarily copper.The manufacturing procedure of coins belonging to Cu-Ni alloy looks the same as the composition of decimal coins c9 and c10,and non-decimal coins c6,c7,and c8 are nearly the same.However,the issuing dates of these two groups of coins are very different.
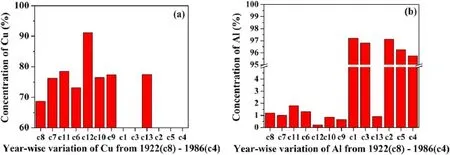
Figure 9.The year-wise variation of concentration of Cu and Al in coins c1-c13.
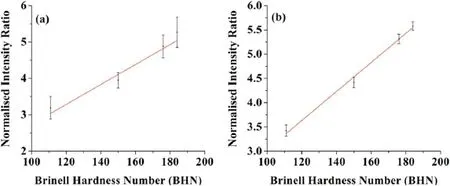
Figure 10.The intensity ratio of ionic and atomic spectral lines versus the BHN for different alloy samples.
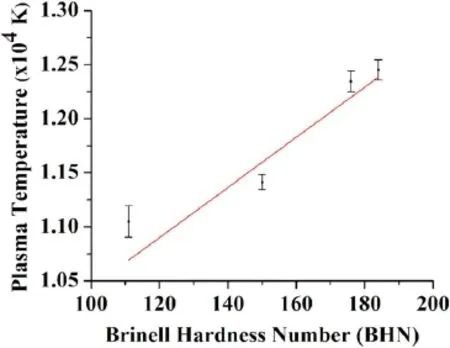
Figure 11.Variation of plasma temperature with BHN.

Figure 12.The scores plot(a) PC1 against PC2 and loading plot((b),(c)) of PCA results.
3.3.Surface hardness measurement
We have chosen four coins from each group of alloys to determine the surface hardness.We have used the Brinell hardness test to measure the hardness of the coin discussed in the material and method section,and the results are summarized in table 2.We have also compared the above results with the result obtained by the LIBS discussed in the following section.
3.3.1.Correlation of intensity ratio of the of ionic and atomic spectral lines with the surface hardness of the material.We have tried to find a correlation between surface hardness measured by the LIBS(measuring the intensity ratio of ionic to atomic spectral lines) using Ca and Cu lines with the mechanically mustered surface hardness(Brinell hardness number).In this section,we have correlated the surface hardness of four samples belonging to Al and Cu alloy by measuring the intensity ratio of the ionic to atomic spectral lines.Measurement of the intensity ratio of the spectral lines requires a proper selection of well-resolved and intense spectral lines.For this purpose,we have identified ionic spectral lines of Ca II at 393.4 nm and atomic spectral lines of Ca I at 422.7 nm because these spectral lines are present in allsamples and well resolved.In addition to this,we have also used the ionic and atomic spectral lines of Cu at 237.0 nm and 578.7 nm,respectively for the samples belonging to the copper alloy for the determination of the surface hardness,which gives the best correlation with the mechanically measured hardness as compared to Ca lines.
We observed from the graph shown in figure 10 that both have a positive correlation.A best linear fit was found for the copper lines shown in figure 10(b) with an RMSE of nearly 0.93.
3.3.2.Correlation of the plasma temperature with the surface hardness.In this section,we have estimated the plasma temperature in LTE.With the help of equation(2),we can easily determine the plasma temperature for any species like Cu I,Al I by taking the logarithm of equation(2)
whereInmis the integrated intensity of that species for different transitions and others are spectroscopic parameters corresponding to each transition.Csis the concentration of species andUs(T) is the partition function [36,37].By plotting the left-hand side versusEn,the slope(-1/kBT) of the obtained line gives plasma temperature.The emission lines of Cu(I) and Al(I) have been used to determine temperature under the condition of LTE for the coins c1 and coins c6,c9,c11,and c12 respectively.According to these requirements,the Al I and Cu I lines selected to determine the plasma temperature are listed in table 5 with their required parameters [34].We found that the plasma temperature varies from 11050 to 12450 K of coins c1,c9,c11,and c12,respectively,belonging to a different alloy.
The linear relation between plasma temperature and hardness for the four coins of different alloy samples has been shown in figure 11.It is noticed here that the plasma temperature increases as the hardness of the metallic alloy increases.
The probable explanation for the increase in surface hardness with the rise in plasma temperature is given below.
(1) The breakdown threshold of the materials decreases with the increase of the surface hardness[26,27].Therefore,a large amount of the preceding laser beam pulse is utilized to heat the generated plasma,which increases plasma temperature.
(2) This increase is attributed to the increase in the collision force.
(3) Cowpeet al[38]have studied bioceramics samples using the LIBS to see the relationship between plasmatemperature and the sample hardness,and they also demonstrated a linear relationship between sample surface hardness and plasma temperature.
Therefore,we conclude from analysis that the increasing order of hardness belongs to the material/alloys used to make coins.The sample surface of c1 and c5 belongs to Al-alloy,having the least surface hardness,and large for Cu-Ni alloy,Ni-brass alloy,and bronze alloy.The hardness of the surface is more for bronze sample c12.
3.4.Classification using multivariate methods
It is time-consuming to classify/discriminate samples/coins using the qualitative analysis of the spectral lines of the LIBS spectra.However,the identification and classification may also be made without any extended spectral analysis of each coin.Also,there is no need for a comparative study of spectral line intensity for the classification.With the help of the multivariate analysis of the LIBS data set,we can easily classify and identify the alloy used to manufacture a particular coin.A detailed analysis is given in the following section.
3.4.1.PCA analysis.We have recorded 35 spectra for each coin,which account for a total of 455 sets for thirteen samples.LIBS spectra cover the spectra range of 220-875 nm,a large number of variables as the intensity at a different wavelength.Reducing the number of variables is the first step before performing the multivariate methods[31,32].It is possible by observing raw data in a simple graph.For statistical analysis of LIBS data,spectra obtained from different coins are arranged,and various data sets are prepared in the form of a matrix.We have created matrices of dimensions(455×145 32)made up of variables with 14532 features as columns.The 35 spectra taken from each sample have been represented by rows having dimensions 455 for 13 samples(c1×c13).The Unscrambler-X software(CAMO Software India Pvt.Ltd) is used to pre-process and solve the data matrix,which firstly makes covariance matrices and then further gives the scores and loading plots.
The sample classification on the PCA score plot is shown in figure 12(a).We have found classified data on the PC1 versus PC2 graph.The PC1 discriminates the data with 92% of the total variance and the PC2 with 5% of the total variance.There is no need for a higher PC as we have covered significant variance for classification.The score plot of PCA visually represents the presence of different clusters,which implies that different alloys have been used to make coins.Each point on the PCA score plot represents the single spectra of one sample.Therefore,we found spectral data of all samples clustered in a different region,with their groups describing the similar composition of the coins.The PC1 component reveals the significant dissimilarity between two groups of coins,mainly coins made of Al-Mg and Cu alloys,which were classified on the positive and negative sides of the PC1.The responsible transitions of Al(3p2P1/2,3/2-4s2S1/2)and Mg(3s3p3P012-3s4s3S1) at wavelength 394.4 nm,396.1 nm for Al and Mg at 516.7 nm,517.2 nm,518.3 nm for the classification of these two groups were easily identified with a loading plot of PC1 shown in figure 12(b).
The LIBS spectra of the coins(c1-c5) belonging to Al-Mg alloy are clustered on the positive side of the PC1 axis.All other LIBS spectra of the coins(c6-c13)belonging to Cu alloy clustered on the negative side of the PC1 axis.Further,the LIBS spectra of the coins made of the copper alloy have been classified on the PC2 axis in two different groups having major similarities with minor differences.In the third quaordinant on the PCA score plot,we observed the clustering of LIBS spectra of the coins c6-c10 while the LIBS spectra of coins c11-c13 clustered in the first quaordinant of the PCA score plot i.e.; on the positive side of PC2.However,we observed two groups of clustering in the first quaordinant on the score plot of PCA.The loading plot of PC2 identified the spectral lines which are responsible for the further discrimination of the coins belonging to Cualloy.Some of the major responsibilities,strong transition lines of different elements like Cu(4p2P3/2,1/2-4s22D3/2),Zn(4s4p3P1,2-4s5s3S1)were easily identified on the loading plot of PC2 at wavelengths of 570.0 nm,578.2 nm for Cu and that of Zn at 472.2 nm and 481.0 nm shown in figure 12(c).The coins belonging to Alloy 2 and Alloy 3 seem to be very similar on the PCA score plot.It was clustered into different groups.
3.4.2.SIMCA analysis.We have performed SIMCA for the supervised classification of data and identification of a new sample with their group of alloy[33].For this,We have taken the LIBS data set of four coins(c1,c10,c11,and c12),one from each alloy,to create a model.Out of 35 LIBS data sets of each coin,we have selected 34 as a trainee and one LIBSdata set has been kept out for a test for each alloy.For each of them,four different PCA models were created for each group of alloys by selecting the different regions on the score plot of PCA.This multivariate method calculates the principle components which are the linear combinations of the variables that are associated with most of the valuable information.Table 5 shows the distance of each PCA model for different groups of alloys(alloys 1-4).The similarity and dissimilarity have been easily observed by analyzing the relative distance of all PCA models.There is a significant distance between alloy 1 and with other three classes of alloy corresponding to Cu alloy.However,the model distance of others is approximately small and belongs to nearly the same class of Cu alloy.Table 5 of model distance shows that there is much more similarity in alloy 3 and alloy 4 as they have most of the spectral signatures common.However,the dissimilarity is revealed with the model distance of alloy 2 to those of alloy 3 and alloy 4.Now,we supposed the ‘test’LIBS data set of the same coins as four unknown samples which have been selected for identification/classification named s1,s2,s3,and s4.Another LIBS data set of a sample belonging to Nordic gold has been intentionally chosen for cross-validation named s5.The projection of a new sample corresponding to their class member has been listed in table 6.All samples have been correctly classified except sample s5,a Nordic gold alloy,which has been intensionally chosen for the cross-validation of SIMCA classification.It reveals dissimilar samples belonging to none of the sample class alloys in this model.
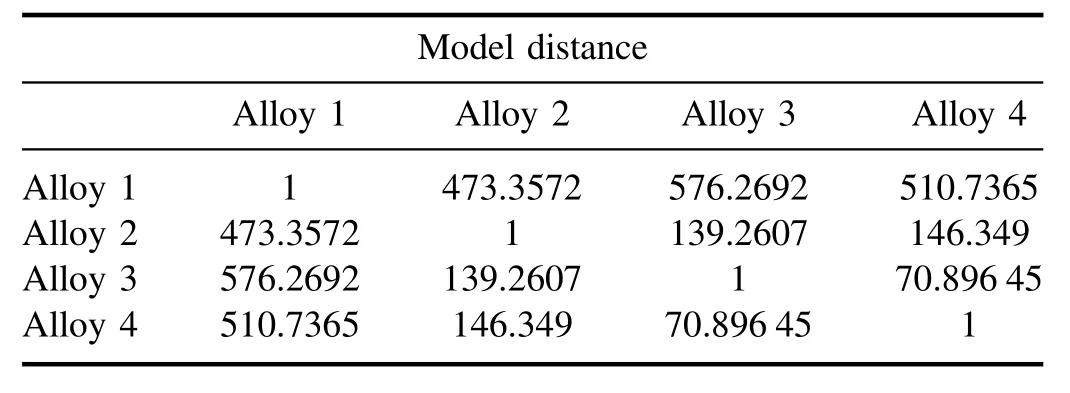
Table 5.PCA model distance.
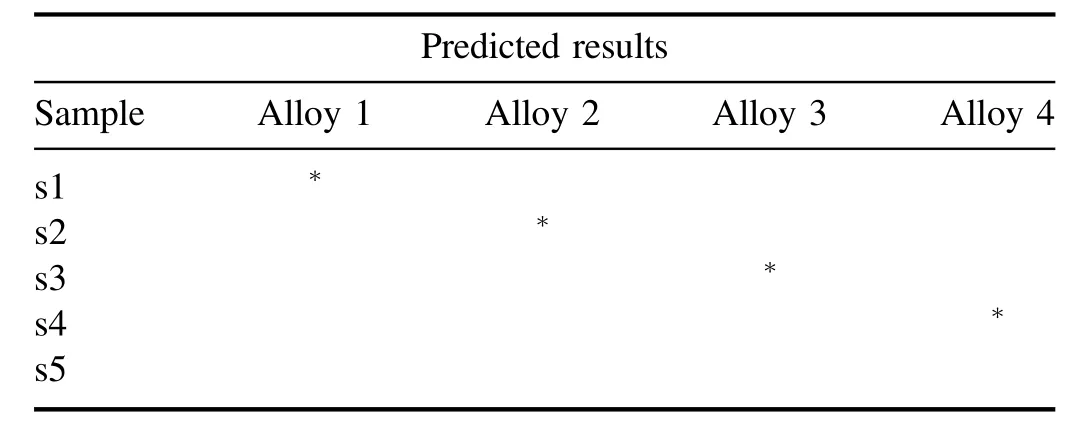
Table 6.Predicted results of a classification in group.
4.Conclusions
LIBS can simultaneously analyze,classify and measure the surface hardness of different samples,especially metallic alloys.Emission spectra of thirteen old Indian coins made up of various alloys were recorded without any sample pretreatment.The presence of the characteristic spectral lines of the various elements in the LIBS spectra of the coins reveals that the studied coins are made up of four different alloys.The intensity of the spectral lines of different elements was measured to compare the relative concentration of the elements/constituents in each coin.CF-LIBS approach is used to simultaneously determine the concentration of all constituents/elements of each coin studied in the present work.The concentration of Al in coins c1-c5 was estimated and found to vary from(95.75±0.23)% to(97.11±0.19)%.We found a higher concentration of Cu((91.18 ± 0.16)%) in bronze sample c12,defined as one Naya paisa(DC).The measurement of the surface hardness was demonstrated by correlating the surface hardness with the LIBS intensity ratio.Additionally,the plasma excitation temperature has been estimated for each coin and correlated with the surface hardness of different samples.We found one Naya paisa coin(c12) belonging to bronze alloy is harder than the others.Principle Component Analysis(PCA)has visually shown the classification of the coins into four groups.Soft Independent Modelling of Class Analogies(SIMCA) was used to identify the categories of new samples based on the model developed in the present work.We observed precise classification for all four classes of alloy by which the coins were made off.Finally,a suitable multivariate model for the category of a group of a sample belonging to four different alloys is developed.
Acknowledgments
Mr Vikas Gupta is thankful to UGC-CSIR for providing financial assistance as a junior research fellow for the research work.
 Plasma Science and Technology2023年9期
- Plasma Science and Technology的其它文章
- Plasma Science and Technology
- The magnetic field design of a solenoid for the cold-cathode Penning ion source of a miniature neutron tube
- Research on the energy consumption mechanism and characteristics of the gallium indium tin liquid metal arcing process
- Effects of anode material on the evolution of anode plasma and characteristics of intense electron beam diode
- Simulation of DC glow discharge plasma with free-moving dust particles in the radial direction
- Experimental studies on the propagation of whistler-mode waves in a magnetized plasma structure with a non-uniform density