
A Review of Research on the Record-Breaking Precipitation Event in Henan Province,China,July 2021※
2023-09-06 08:00:50QinghongZHANGRumengLIJuanzhenSUNFengLUJunXUandFanZHANG
Advances in Atmospheric Sciences 2023年8期
Qinghong ZHANG ,Rumeng LI ,Juanzhen SUN ,Feng LU ,Jun XU ,and Fan ZHANG
1Department of Atmospheric &Oceanic sciences,School of Physics,Peking University,Beijing 100871,China
2HIWeather International Coordination Office,Chinese Academy of Meteorological Sciences,Beijing 100081,China
3National Center for Atmospheric Science,Boulder,CO 80307,United States
4Innovation Center for Feng Yun Meteorological Satellite,National Satellite Meteorological Center (National Center for Space Weather),China Meteorological Administrations,Beijing 100049,China
5National Meteorological Center of China,Beijing 100081,China
ABSTRACT A record-breaking precipitation event,with a maximum 24-h (1-h) precipitation of 624 mm (201.9 mm) observed at Zhengzhou Weather Station,occurred in Henan Province,China,in July 2021.However,all global operational forecast models failed to predict the intensity and location of maximum precipitation for this event.The unexpected heavy rainfall caused 398 deaths and 120.06 billion RMB of economic losses.The high-societal-impact of this event has drawn much attention from the research community.This article provides a research review of the event from the perspectives of observations,analysis,dynamics,predictability,and the connection with climate warming and urbanization.Global reanalysis data show that there was an anomalous large-scale circulation pattern that resulted in abundant moisture supply to the region of interest.Three mesoscale systems (a mesoscale low pressure system,a barrier jet,and downslope gravity current) were found by recent high-resolution model simulation and data assimilation studies to have contributed to the local intensification of the rainstorm.Furthermore,observational analysis has suggested that an abrupt increase in graupel through microphysical processes after the sequential merging of three convective cells contributed to the record-breaking precipitation.Although these findings have aided in our understanding of the extreme rainfall event,preliminary analysis indicated that the practical predictability of the extreme rainfall for this event was rather low.The contrary influences of climate warming and urbanization on precipitation extremes as revealed by two studies could add further challenges to the predictability.We conclude that data sharing and collaboration between meteorological and hydrological researchers will be crucial in future research on high-impact weather events.
Key words: extreme precipitation,observation,dynamics,predictability,climate warming,urbanization
1.Introduction
High-impact weather events,such as severe local storms,tropical cyclones (TCs),and heat waves,have major effects on society and economic activity (Zhang et al.,2019).Climate warming is reported as the main driver of the increase in frequency and intensity of high-impact weather events in most areas of the world,especially monsoon regions (IPCC,2013;Wang et al.,2021).China has experienced rapid economic development and population growth in association with increasing urbanization over the past 30 years;therefore,the societal impacts related to high-impact weather events have also increased significantly.Although some progress has been made in our scientific understanding,monitoring and prediction of high-impact weather events,statistics on weather-related losses show that considerable challenges still exist in forecasting these events that often cause complex weather-related problems for society(Zhang et al.,2021a).
From 17 to 23 July 2021,Henan Province in China experienced a high-impact weather event with rainstorm magnitudes rarely experienced previously.According to a government report (https://www.mem.gov.cn/gk/sgcc/tbzdsgdcbg/202201/P020220121639049697767.pdf),the highest total rainfall during this event was 1122.6 mm,recorded at Hebi Science and Technology Innovation Center Weather Station(Cai et al.,2022),followed by 993.1 mm at Baizhai Weather Station in Xinmi City (Fig.1).More than 20 national weather stations recorded record-breaking 24-h precipitation during the event (Xu et al.,2022b).A 24-h precipitation maximum of 624.0 mm was observed at Zhengzhou Weather Station from 0000 UTC 20 July to 0000 UTC 21 July 2021(Yang et al.,2022),which was close to the average annual mean rainfall in Zhengzhou (640.8 mm) and exceeded the largest amount ever recorded since the establishment of the station (189.4 mm in July 1978) by about 3.4 times (Cai et al.,2022).A maximum 1-h rainfall of 201.9 mm occurred at Zhengzhou Station from 1600 to 1700 local standard time,which broke the hourly precipitation record for mainland China.

Fig.1.Grid precipitation (shaded in green colors;units: mm)with a resolution of 0.01° from 0000 UTC 17 July to 0000 UTC 23 July 2021.Stations where the daily rainfall records from 1950—2021 were broken are denoted by a cross with a color corresponding to the key on the right-hand side of the figure.Gray shading denotes the terrain height (light gray:(100—500] m;medium gray: (500—1000] m;dark gray: above 1000 m).The dark line is the boundary of Henan Province.
However,the National Weather Center of the China Meteorological Administration (CMA) only forecasted a maximum 24-h precipitation of 150 mm on the morning of 20 July 2021.The ECMWF global operational forecast model predicted that the maximum daily precipitation (100—200 mm) would occur over the mountains 200 km northwest of Zhengzhou City.All of the THORPEX Interactive Grand Global Ensemble (TIGGE) models underestimated the areaaveraged precipitation over Henan Province (Zhang et al.,2022) (Fig.2).The area-averaged precipitation from observations was 74.5 mm,compared with an ensemble mean from the four best-performing operational models [Bureau of Meteorology (BoM),National Centre for Medium Range Weather Forecasting (NCMRWF),UK Meteorological Office (UKMO),and Korea Meteorological Agency (KMA)]of less than 55.0 mm.The mean maximum 24-h precipitation of the four models was 186.9 mm,which was far less than the observed amount of 505.5 mm (from 1200 LST 19 July to 1200 UTC 20 July;forecast initialization at 0000 UTC 19 July).The equitable threat score (ETS) under different rainfall intensities indicated limited forecasting ability for daily rainfall greater than 100.0 mm for all models (Figs.2b—e).The CMA’s global model was the second worst performing among the 12 operational models in terms of area-averaged precipitation forecasting (Zhang et al.,2022).

Fig.2.Precipitation according to ensemble forecasts.(a) Boxplot of the area-averaged 24-h accumulated rainfall for ensemble members from 12 TIGGE models.NCMRWF is denoted by NCMR due to the limited space on the x-axis.(b—e) Boxplots of the ETSs for ensemble members from the (b) BoM,(c) NCMRWF,(d)UKMO,and (e) KMA models at various thresholds (range: 100—300 mm) over the study region.The whiskers extend to the most extreme data points not classified as outliers.Points were identified as outliers if they were larger than q3+1.5 (q3 -q1) or smaller than q1 -1.5 (q3 -q1),where q1 and q3 are the 25th and 75th percentiles,respectively [Reprinted from (Zhang et al.,2022),with permission from Springer Nature].
Similar to the global models,the CMA’s regional mesoscale model (with 3-km horizontal grid spacing,hereafter referred to as CMA-MESO) underestimated the rainfall intensity,with a 24-h precipitation maximum (between 1200 UTC 19 July and 1200 UTC 20 July from a forecast initialized at 0000 UTC on 19 July) of 314.8 mm near the mountains (Fig.3a),while the forecast initialized at 1200 UTC 19 July produced a better forecast in terms of the rainfall center and intensity (Figs.3b and c).The maximum 24-h precipitation exceeded 400.0 mm within 20 km of Zhengzhou Station,although the precipitation peak hour in the forecast was a few hours earlier than observed.Unfortunately,the CMA-MESO forecast initialized at 1200 UTC 19 July was not considered in the final forecast issued on the morning of 20 July.
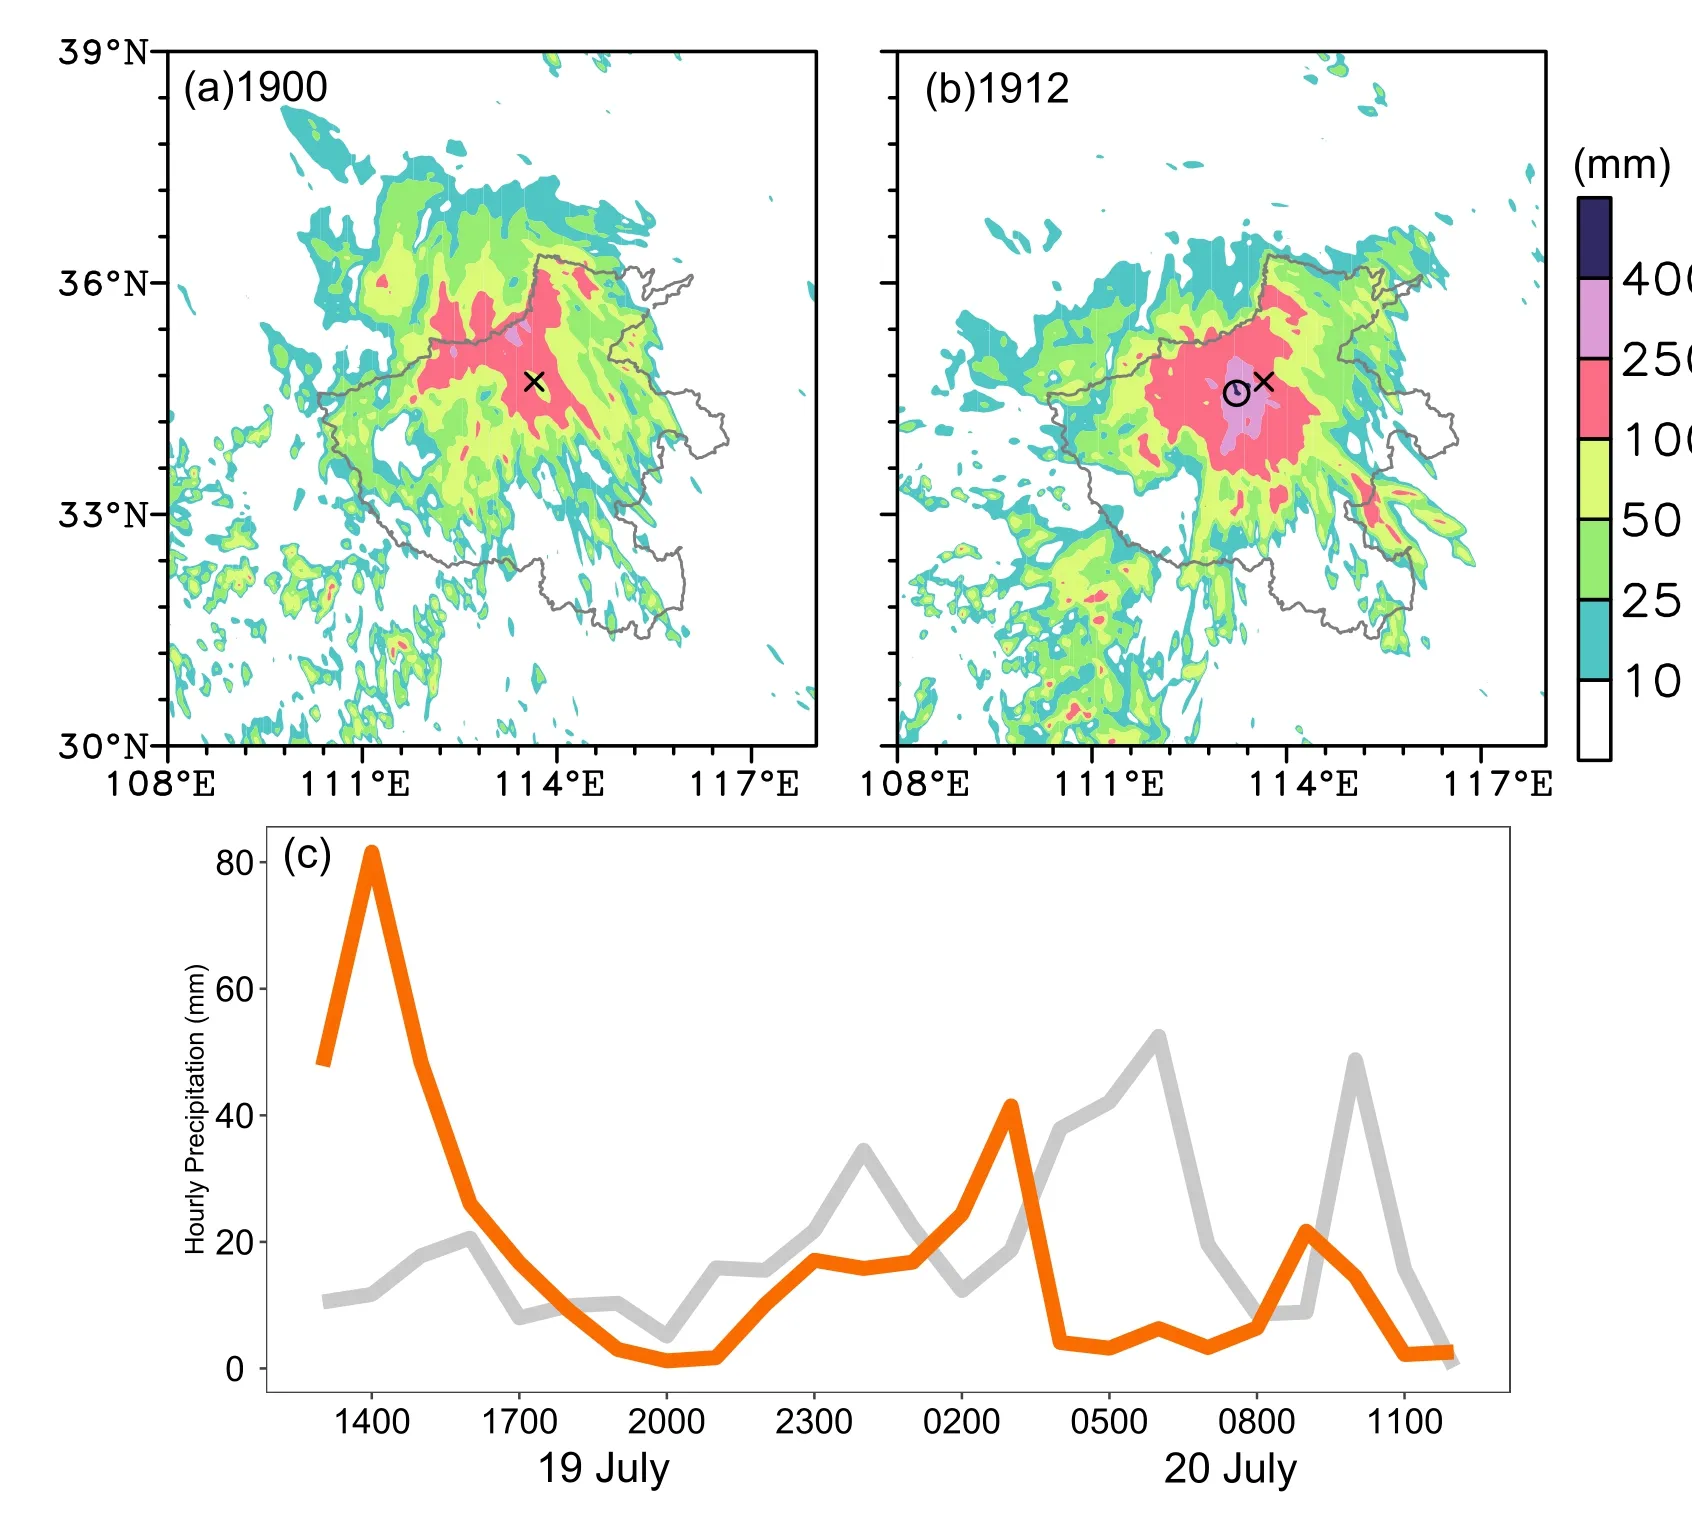
Fig.3.(a) 24-h accumulated precipiation (shading) from 1200 UTC 19 July to 1200 UTC 20 July 2021 from the CMA-MESO forecast initialized at 0000 UTC 19 July.(b) As in (a) but for the forecast initialized at 1200 UTC.The cross in (a,b) represents the location of Zhengzhou City.The circle in (b) represents the grid point with the maximum forecasted 24-h precipitation.(c) Comparison of the houly precipitation between the gridded observations (gray) at a grid point nearest to Zhengzhou and the forecasted maximum (orange) in the circle in (b).
The unexpected precipitation led to urban waterlogging,debris flows,floods,and property damage in Henan Province,especially in Zhengzhou City (which has a population of 12.7 million).Floodwaters in 12 major rivers rose above the warning level.Eight floodwater storage and detention areas were opened across the province.The main urban areas were severely flooded on the afternoon of 20 July and the maximum water depth on the roads was nearly 2.6 m,resulting in more than half of the city’s residential areas with underground spaces and important public facilities being flooded.A total of 398 people died or went missing,14.8 million people were otherwise affected by the disaster,and the direct economic loss was 120.06 billion RMB,according to the government report (https://www.mem.gov.cn/gk/sgcc/tbzdsgdcbg/202201/P020220121639049697767.pdf).
This record-breaking event received much attention from researchers in various scientific disciplines,such as atmospheric science,hydrology,and disaster management.The main purpose of the current paper is to provide a “metaanalysis” and review of recent studies on the event in the discipline of atmosphere science.Section 2 introduces the large-scale circulation background of the event.The characteristics of the event as described by mesoscale observations and reanalysis data are summarized in section 3,and the dynamic processes and predictability are considered in section 4.The influences of climate warming and urbanization are discussed in sections 5 and 6,respectively.Finally,a summary and some further discussion are provided in section 7.
2.Large-scale circulation background
Several papers have described the large-scale circulation,anomalous atmospheric conditions,and local weather systems during 17—23 July using ERA5 data (Ran et al.,2021;Zhang et al.,2021b;Cai et al.,2022;Kong et al.,2022).In this section,we review the large-scale circulation background to the event as revealed by ERA5,and in the next section illustrate some mesoscale differences between ERA5 and a mesoscale reanalysis.
The large-scale circulations around Henan Province displayed a saddle-like pattern that formed on 12 July and persisted until 22 July (Cai et al.,2022;Kong et al.,2022;Chyi et al.,2023).The western Pacific subtropical high (WPSH)was located near the Japan Sea from 19 to 21 July 2021(Fig.4).Another continental subtropical high was located over North China.A trough in the midlatitudes and an inverted trough over South China were located between these two subtropical highs,and a binary TC system comprising TC In-Fa (2021;near the East Sea) and TC Cempaka(2021;near the South China Sea) was also a key factor(Fig.4).The strong pressure gradient between TC In-Fa(2021) and the WPSH strengthened the easterly winds,which together with a southerly monsoon from the south of Henan brought abundant moisture inland (Fig.4) (Kong et al.,2022;Wei et al.,2023).From 18 to 23 July 2021,TC In-Fa remained in the East China Sea,with a translation speed of 6 km h-1(estimated using best-track data from the CMA),which was significantly slower than the global mean TC translation speed from 1951 to 2011 of 17.5 km h-1(Chan,2019;Yamaguchi et al.,2020).The stable saddle-like circulation pattern supported a stationary WPSH and the slow movement of TC In-Fa (2021),thereby favoring continuous moisture transport to inland areas (Kong et al.,2022;Chyi et al.,2023).An upper-level trough was located to the northwest of Henan Province at 200—300 hPa,which led to strong upper-level divergence.Such a circulation pattern is thought to be conducive to the formation of severe rainstorms (Cai et al.,2022;Kong et al.,2022;Xu et al.,2022a,b;Wei et al.,2023).

Fig.4.Geopotential height (contours) and its anomalies (shaded;units: gpm) at 500 hPa from 19 to 21 July 2021.The green solid contour and red dashed contour denote the 5860 gpm contour in the three-day period and associated climatology in the period 1980—2021,respectively.The vectors correspond to the 925-hPa wind with a velocity >4 m s-1.Red dots represent the 200-hPa divergence >10-5 s-1.The orange line is the boundary of Henan Province.
Compared with the mean circulation for July over the past 50 years,a significant anomaly in geopotential height was seen at 500 hPa in the period 19—21 July 2021,with the WPSH extending far to the north (to 35°—40°N) and a low occurring in association with a TC to the south.The WPSH ridgeline remained roughly 15° farther north than average(Fig.4).The circulation anomalies were analyzed quantitatively using an obliquely rotated principal component scheme by Xu et al.(2022b).Based on the categorized daily atmospheric large-scale circulations over North China in the summers of 1979—2021 using the geopotential heights at 500 and 925 hPa in succession,they found that the circulation pattern during 19—21 July 2021 was previously observed in only 1.6% of all summer days in the past 43 years.However,the anomalous large-scale circulation pattern could not completely explain the record-breaking event;other dynamic processes related to mesoscale convective storms may have been contributing factors.
3.Mesoscale observations and reanalysis
China has made major advances in terms of the development of comprehensive observation systems in recent years,by increasing the density of observations,hardware updates,innovative algorithms,and quality control,and by establishing new automatic detection systems such as the FY-4B satellite (replacing FY-4A) and raindrop spectrometers.The comprehensive observation systems provide valuable opportunity to mesoscale detection and analysis of high-impact weather events.
3.1.Satellites
Satellite retrieval precipitation products have been shown to underestimate the intense rainfall significantly during this record-breaking event (Liu et al.,2022b).However,those products that integrate infrared and passive microwave data were better than those that only use infrared information,indicating the importance of microphysical process in generating the extreme precipitation in this event.Nevertheless,the geostationary high-speed imager (GHI),which is a new instrument onboard the FY-4B satellite,demonstrated its monitoring ability during this event.GHI has 250-m grid spacing in the visible band and 2-km grid spacing in the thermal infrared band for a 2000 × 1800 km region,and updates every 1 min (https://space.oscar.wmo.int/instruments/view/ghi).The target area can be changed every 30 min.Therefore,GHI provides accurate,reliable,and timely high-resolution data to meet emergency response requirements when high-impact weather occurs.As the record-breaking precipitation in Zhengzhou was not forecasted on 20 July,the GHI onboard FY-4B remained targeted on TC Cempaka and missed the Zhengzhou area (Fig.5a).On the following day,FY-4B was turned to monitor Henan but the main area of precipitation had moved to the northern tip of Henan and the precipitation intensity became weaker(Fig.5b).
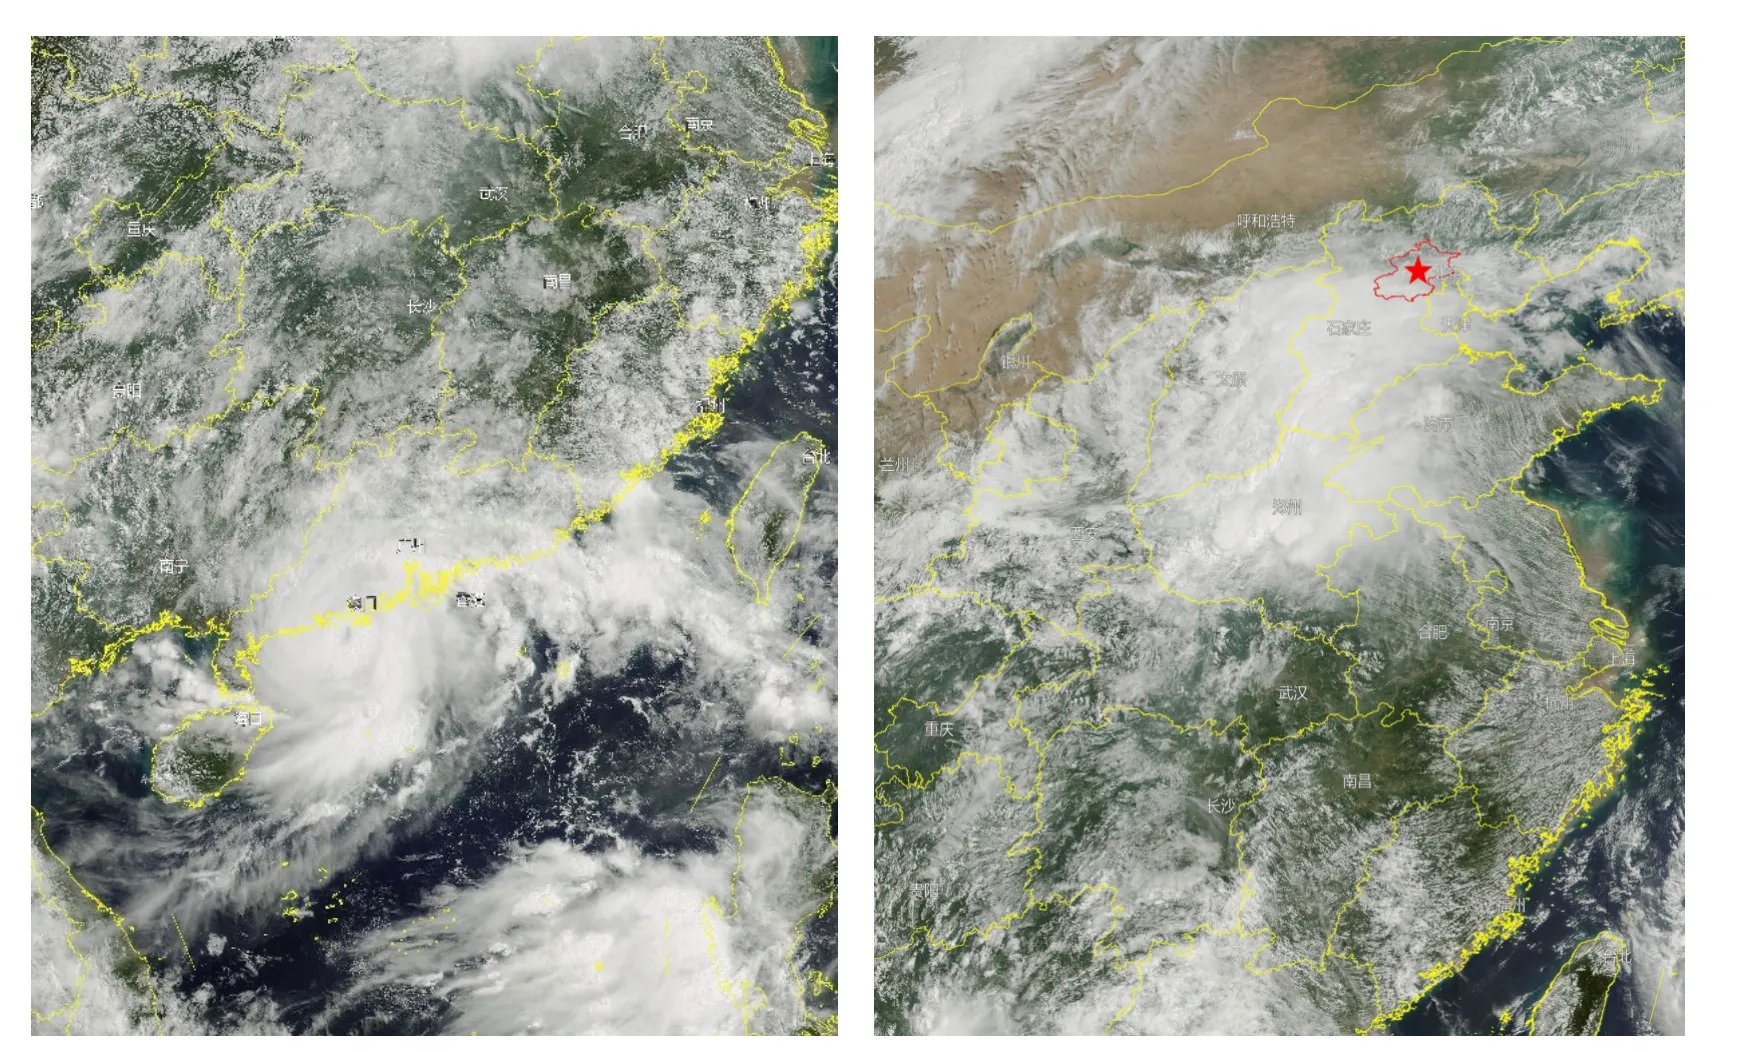
Fig.5.Visible images from the FY-4B geostationary high-speed imager acquired at 0230 UTC 20 July 2021(left) and 0230 UTC 21 July 2021 (right).
Although FY-4B was not monitoring Zhengzhou on 20 July,assimilation of the clear-sky radiance data obtained by the advanced geostationary radiance imager onboard FY-4A was shown to improve the forecast of 24-h accumulated precipitation with an amount surpassing 500 mm,and the forecast of the precipitation location,using the regional mesoscale Weather Research and Forecasting (WRF) model (Xu et al.,2023).The assimilation updated the atmospheric temperature and humidity over the ocean,which in turn changed the vertical and horizontal wind fields over the ocean,leading to a narrower and stronger water vapor transport path to Zhengzhou in the lower troposphere.Conversely,in the control experiment,water vapor convergence and upward motion were more widely distributed,and thus the precipitation centers were more diffuse.Using Geostationary Interferometric Infrared Sounder (GIIRS) water vapor channel data and CMA-MESO,Yin et al.(2022b) found the location error of maximum 24-h accumulated precipitation forecasts in GIIRS assimilation experiments decreased from 128.48 km in the control experiment to 28.97 km (Yin et al.,2022b).The effectiveness of satellite data assimilation was largely determined by the key dynamics that produced the recordbreaking precipitation,which is discussed in the next section.
3.2.Surface-based observations
A 650 × 820 km area near Henan Province has 24 Doppler weather radars,3 wind profile radars,351 national weather stations covering all variables (including raindrop spectrometers),and 6924 automatic weather stations (AWSs)covering four variables (temperature,wind,relative humidity and precipitation) (Fig.6).The average distance between surface rain gauge stations in Zhengzhou Province has reached 100 m,which is one of the highest-resolution grid spacings in the world,and provides precise precipitation information for disaster prevention and model verification.The grid-averaged ERA5 and observed 24-h precipitation amounts were comparable during 19—21 July (24/29,37/41,and 26/29 mm,respectively;Fig.7).However,comparison of the observed 24-h precipitation and ERA5 data,both with 0.25° grid spacing,showed large differences in precipitation intensity and the center location of maximum precipitation.The ERA5 precipitation was at least 200 mm lower than the observed precipitation center during 19—21 July,indicating that the largescale circulation alone cannot explain the record-breaking precipitation.However,ERA5 was used in several studies to explain the observed mesoscale rainstorm and record-breaking precipitation (Fu et al.,2022;Kong et al.,2022).

Fig.6.Locations of surface-based observations from 24 doppler weather radars (red triangles),3 wind profile radars (yellow circles),351 raindrop spectrometers (blue triangles),and 6924 AWSs (small dots).The blue color represents stations belonging to the CMA and the red color represents those belonging to the Water Control Bureau.The white outline indicates Henan Province.

Fig.7.(a—c) ERA5 daily precipitation,(d—f) observed gridded precipitation (color shaded;units: mm) with a horizontal resolution of 0.01°,and (g—i) difference in daily precipitation between the observed gridded precipitation with a horizontal resolution of 0.25° and the ERA5 daily precipitation from 19 to 21 July 2021.Gray shading denotes the terrain height (light gray: (100—500] m;medium gray: (500—1000] m;dark gray: above 1000 m).The dark line is the boundary of Henan Province.[Data from Fig.10 in Xu et al.(2022b)],reproduced with permission from Springer Nature.
3.3.Reanalysis at 2-km grid spacing with 6-min intervals
The availability of high-resolution radar data and highdensity surface observations provided an opportunity to conduct a high-resolution reanalysis using the four-dimensional variational (4DVar) technique in the Variational Doppler Radar Assimilation System (VDRAS) (Sun and Crook,1997).In a recent study,Sun et al.(2023) produced a rapid update analysis with a 6-min cycling interval and 2-km horizontal grid spacing.The 2-km reanalysis revealed the mesoscale factors responsible for the formation and development of the record-breaking precipitation that occurred in Zhengzhou on 20 July 2021.They found that the rainstorm was formed via the sequential merging of three convective cells (Fig.8),which were initiated along the convergence bands in a meso-beta-scale low-pressure system (meso-low).The cells A and B in Fig.8a initiated over the mountains southwest of Zhengzhou,while cell C initiated over the plains to the east.The first merging of cells A and B occurred at 0436 UTC near Mixian Station (Fig.8c).The vertical motion intensified and extended to above the melting level after merging,associated with a tenfold increase in the number concentration for small (<2 mm) and medium (2—4 mm) raindrops.The second merging occurred between merged cells AB and cell C near Zhengzhou Station around 0700 UTC 20 July (Fig.8a),and this merged storm remained at Zhengzhou for more than two hours and was responsible for the record-breaking hourly precipitation(Sun et al.,2023;Wei et al.,2023).The number and size of raindrops changed significantly after the second convection merging event (Fig.8e).The number of small and medium raindrops increased by one to two orders after merging,and the high amount persisted for at least 1 h.Large raindrops also appeared.The convection merging event likely caused intense upward motion,which in turn accelerated the onset of new condensation and collision—coalescence processes(Chen et al.,2022).This implied an abrupt increase of graupel in the upper level after the merging of convection initiated over the mountains and plains,along with an increase in the number of small (<2 mm) and medium (2—4 mm) raindrops(which accounted for nearly 90% of the rainfall at Zhengzhou Station between 0800—0900 UTC).
Comparison of the ERA5 and 2-km reanalysis data showed that there was little difference in the location and intensity of the meso-low between ERA5 and the 2-km reanalysis at 2200 UTC 19 July.However,the meso-low in ERA5 was 200 km farther to the north and with higher intensity than in the 2-km reanalysis at 0900 UTC 20 July,when the record-breaking hourly precipitation occurred (Fig.9).This might explain the intensity and location errors in precipitation in the ERA5 analysis.The real-time ECMWF model also failed to accurately predict the location and intensity of the meso-low (Zhao et al.,2022).It is considered important to determine if the error in precipitation would be reduced if the meso-low was in the correct location.
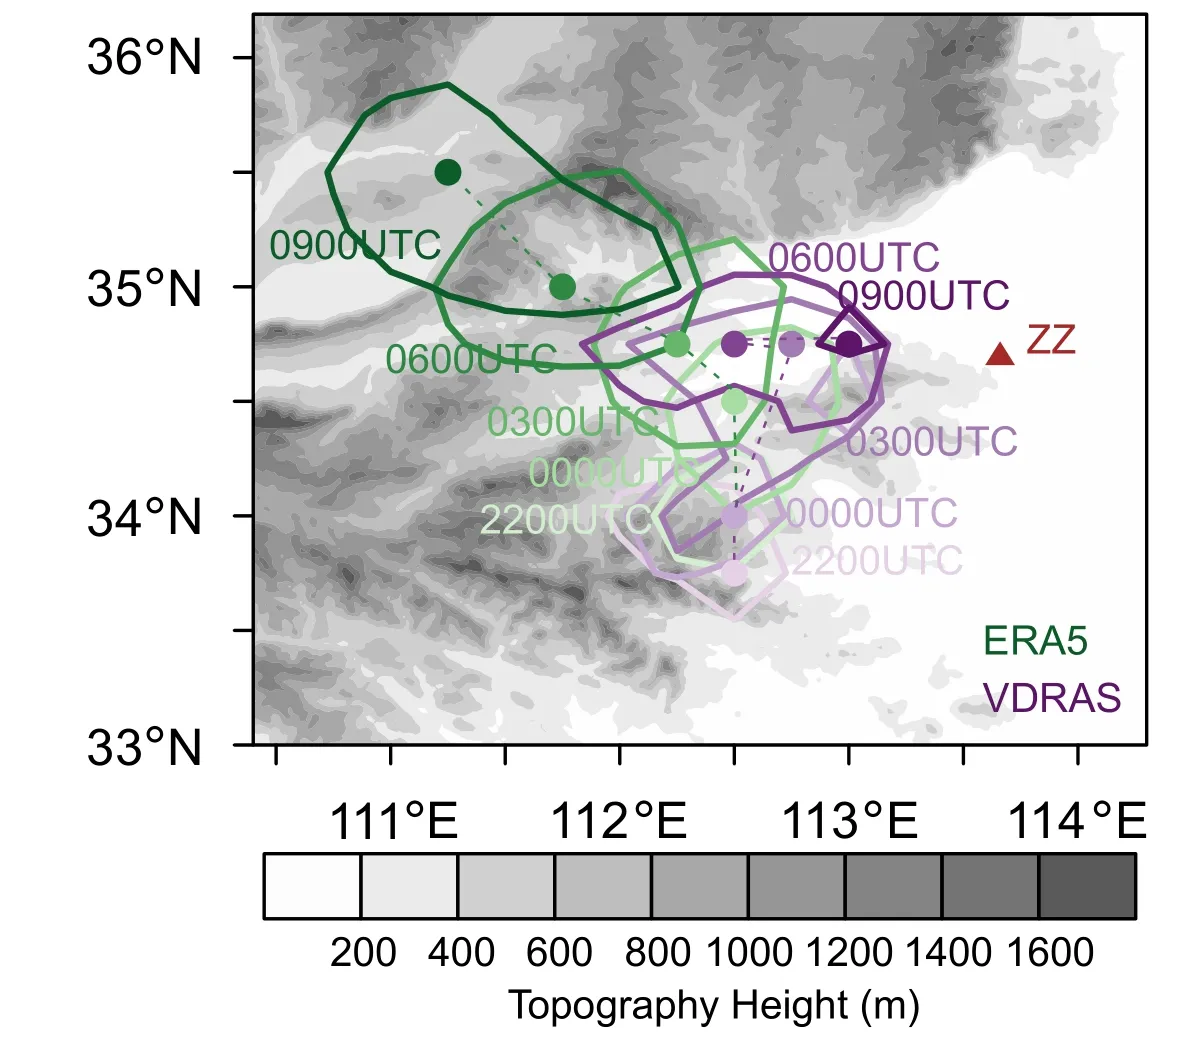
Fig.9.Comparison of ERA5 (green lines and dots) and VDRAS(purple lines and dots) reanalysis data showing the evolution of the mesoscale low at 700 hPa (ERA5) and 3 km (VDRAS) from 2200 UTC 19 July to 0900 UTC 20 July,with 3-h intervals.The dots are the center locations of the meso-low represented by local maximums of relative vorticity.The contours are isolines of relative vorticity at 2.8 × 10⁻³ s-1.Zhengzhou Station is marked by a brown triangle.
4.Dynamics and predictability
4.1.Dynamics
The mechanisms underlying the record-breaking precipitation have been the focus of several convection-permitting model simulation studies (Yin et al.,2022a;Sun et al.,2023;Wei et al.,2023).The first dynamical process was proposed by Yin et al.(2022a),who highlighted the significance of a mesoscale vortex encircled by arc-shaped updrafts.The arc-shaped convergence acted like a multidirectional lifting pump and transported precipitation from different areas into the same region.However,the maximum precipitation in their simulation was near the mountains west of Zhengzhou City,which is far away from the observed location.The merging of convective cells was not simulated in their study.
Wei et al.(2023) found that the record-breaking precipitation was caused by a quasi-stationary storm coming from east of Zhengzhou.Beside a low-level meso-β-scale vortex[or meso-low as in Sun et al.(2023)] shown by Yin et al.2022a,they found a barrier jet on the eastern slopes of the Taihang Mountains due to terrain blocking of the strong easterly synoptic low-level jet flow.The southerly winds associated with the vortex achieved a similar intensity as the northerly flow originating from the barrier jet,resulting in the quasi-stationary storm in Zhengzhou City.This simulation was consistent in some respects with the 2-km reanalysis by Sun et al.(2023) based on observed radar and surface data and VDRAS 4DVar.The mesoscale reanalysis confirmed the roles of the mesoscale low-pressure system and the barrier jet along the Taihang Mountains.However,the reanalysis indicated that a downslope gravity current resulting from overnight mountain-top radiative cooling,and likely the evaporation of light rain over the Taihang Mountains too,was responsible for the northerly flow toward Zhengzhou.They also suggested that the barrier flow might not have played an important role without the interaction with this downslope gravity current.
Based on previous studies,we summarize the three mesoscale systems that played a critical role in the development of the rainstorm associated with the hourly record-breaking precipitation (Fig.10).Among the three systems,the meso-low that developed from an inverted trough southwest of Zhengzhou was most important in terms of the formation and intensification of the rainstorm.Two terrain-influenced flows near the Taihang Mountains north of Zhengzhou,i.e.,a barrier jet and downslope gravity current,contributed to the local intensification of the rainstorm and intense recordbreaking hourly precipitation.These three mesoscale features synergistically enhanced the moisture transport to Zhengzhou in the north—south direction in the few hours prior to the occurrence of the extreme rainfall,in addition to the existing moisture transport by large-scale flow from the east.

Fig.10.Schematic of the multiscale dynamical processes responsible for the extreme hourly rainfall in Zhengzhou on 21 July 2021.The gold triangle is the location of Zhengzhou City.The turquoise,white,red,and brown arrows represent the environmental flow,the southwesterly flow from the meso-low,the downslope gravity flow originating from the top of the Taihang Mountains,and the barrier jet,respectively.The light yellow circular arrows indicate the midlevel circulation of the meso-low.
In addition to dynamic processes,the precipitation efficiency was also analyzed by a WRF simulation (Yin et al.,2023).Water vapor flux convergence was the main factor influencing the large-scale precipitation efficiency,while cloud-microphysical precipitation efficiency was dominated by the net consumption of water vapor by microphysical processes.Consumed water vapor mainly produced cloud water and ice-phase particles,which were subsequently converted to raindrops by the melting of graupel and the accretion of cloud water by rain water (Yin et al.,2023).The simulation suggested the importance of graupel melting,which agrees with the raindrop observations (Fig.8).
4.2.Predictability
The uncertainties and error growth in forecasting this high-impact rainfall event were analyzed at different spatial and temporal scales,using forecasts from global to regional convection-permitting numerical models in Zhang et al.(2022).The forecasts from global operational models have been discussed in section 1 (Fig.2).Here,we focus on regional synoptic and convection-permitting models.
Sensitive areas identified by a conditional nonlinear optimal perturbation (CNOP) scheme using a coarse-grid-spacing regional model (horizontal grid spacing of 60 km and 21 terrain-following vertical levels),showed three areas of“total moist energy norm”.The first was in the mid and lower altitudes in the southeast of Henan Province,associated with the easterly low-level jet.The second peaked in the mid and upper level,and centered at the mesoscale low and inverted trough at 500 hPa.The third area was in the northwest of Henan Province and was associated with a trough at 300 hPa.The second and third sensitive areas were likely influenced by the large-scale divergence from the mid to upper level,which favored upward motion (Zhang et al.,2021b;Cai et al.,2022),while the first area may have been associated with the moisture feeder band below 500 hPa(Zhang et al.,2022).These sensitive areas are associated with the anomalous circulation characteristics referred to in section 2.The importance of the easterly low-level jet was verified in the data assimilation research by Xu et al.(2023).
Practical and intrinsic predictability in the record-breaking rainfall in Zhengzhou were also analyzed in Zhang et al.(2022),using the convection-permitting WRF model with 40 ensembles whose initial uncertainties were from relatively large scales (LARGE).The initial conditions of the different ensemble members varied in terms of their representation of the upper-level ridge and trough,the mid-level low-pressure system over Henan Province,and the easterly low-level jet associated with the WPSH and TC In-Fa (2021).The general location of rainfall was easy to predict because rainfall regions were similar across all ensemble forecasts.However,the predictability of the extreme rainfall occurring during this event was intrinsically limited by the deterministic forecasting system,where there were large uncertainties in the 24-h precipitation amount in these forecasts,even with minute initial perturbations (Fig.11).The authors demonstrated the inability of large-scale errors to grow unless the amplitude of small-scale errors increases sufficiently,because small-scale errors grow faster than large-scale ones.

Fig.11. Hourly power spectra (first and second columns) and growth of the power spectra (third and fourth columns) of the zonal (U)wind perturbations (upper panels), Temperature (T) perturbations (middle panels), and water vapor (Qv) perturbations (bottom panels)from 0600 UTC to 2100 UTC 19 July 2021 (first 15 h of the simulation), for the CNOP (first and third columns) and one of the best members in LARGE (second and fourth columns). Blue colors denote earlier times (shorter simulations) and red colors denote later times (longer simulations) [Reprinted from Fig. 13 in Zhang et al. (2022), with permission from Springer Nature].
In this event,the first echo formed at 0200 UTC on 20 July 2021,and then merged with two other convective systems,finally producing record-breaking precipitation at 0800—0900 UTC.Normally,it takes 6 h for mesoscale errors to grow to a large scale.Lower predictability is expected with longer durations of convection.This might be the reason that ECMWF gave the wrong location of the mesoscale low shown in Fig.9.
The predictability of this extreme rainfall was also investigated by two 4-km convection-permitting ensemble forecast systems (CEFSs) based on the WRF model (Zhu et al.,2022).One was initialized from the NCEP Global Ensemble Forecast System (GEFS) (CEFS_GEFS),and the other from time-lagged ERA5 data (CEFS_ERA).The simulated rainfall centers in both CEFSs were located in the foothills of the Taihang Mountains,indicating that the heavy rainfall induced by orographic lift and blocking was predictable.Only a few ensemble members were able to simulate the hourly rainfall peak,which may shed light on the evolution and propagation of extreme rainfall.However,for the extreme 24-h rainfall observed in Zhengzhou,most members had large positional errors within a few hundred kilometers,highlighting the limited intrinsic predictability of the location of city-scale extreme rainfall (Zhu et al.,2022).In this case,the position of the convergent region between the mesoscale low and easterly wind had a large uncertainty in the ensembles.This result agreed with that of Xu et al.(2022a),in which the intensity and structure of the easterly jet were the key factors for ensuring accurate precipitation foreacsts.
5.Climate warming
The synoptic conditions during this extreme rainfall event in Henan were apparently highly unusual and most likely caused by chaotic atmospheric dynamics.However,given that the global mean temperature has increased by almost 1.0 K over the past century,there is also a need to consider how current global warming may have impacted this record-breaking event,and how future warming may generate similar synoptic-scale dynamics.
To estimate the effect of warming on the record-breaking precipitation,a narrative attribution approach was used based on simulations of the event with a small-domain,highresolution cloud-resolving model (Qin et al.,2022).Warming was determined to have the potential to significantly intensify both regional-scale (7% K-1—9% K-1) and station-scale(10% K-1—14% K-1) precipitation extremes,depending on the convective organization.This resulted in shear-driven convective organization producing more precipitation extremes at both the regional and station scale than unorganized convection due to stronger diabatic heating feedback.The organized convection in Qin et al.(2022) occurred along a squall line,in which there was a decrease of zonal wind from 20 m s-1at the surface to 0 m s-1at a height of 1 km.The simple shear was not the same as in the observations,in which convection merged under a convergent mesoscale low.The organized convection may not represent the actual situation in this case.
Climate warming could also impact large-scale daily circulations because uncertainty in climate projections are mainly due to large-scale circulations (Shepherd,2014).Furthermore,extreme precipitation is frequently associated with convective storms (Dowdy and Catto,2017;Yamaguchi et al.,2020;Ng et al.,2022),and large-scale circulation may create circumstances that favor convection (Liu et al.,2022a).From the 1980s to the 2010s,as the average TC track shifted to the north,the number of days with a similar circulation pattern to this event showed a significant increasing trend at the decadal scale (Xu et al.,2022b).Thus,the question of how the occurrence and intensity of extreme precipitation can be affected by climate warming remains to be addressed.
6.Urbanization
The effect of urbanization on the heavy rainfall that occurred over Zhengzhou on 20 July 2021 was analyzed using two ensemble WRF model simulations (each consisting of 11 members) with different land cover scenarios (Luo et al.,2023).The first included cities (CTRL),while the second replaced them with the most common nearby land type,i.e.,mixed dryland/irrigated cropland and pasture (NURB)(Fig.12).
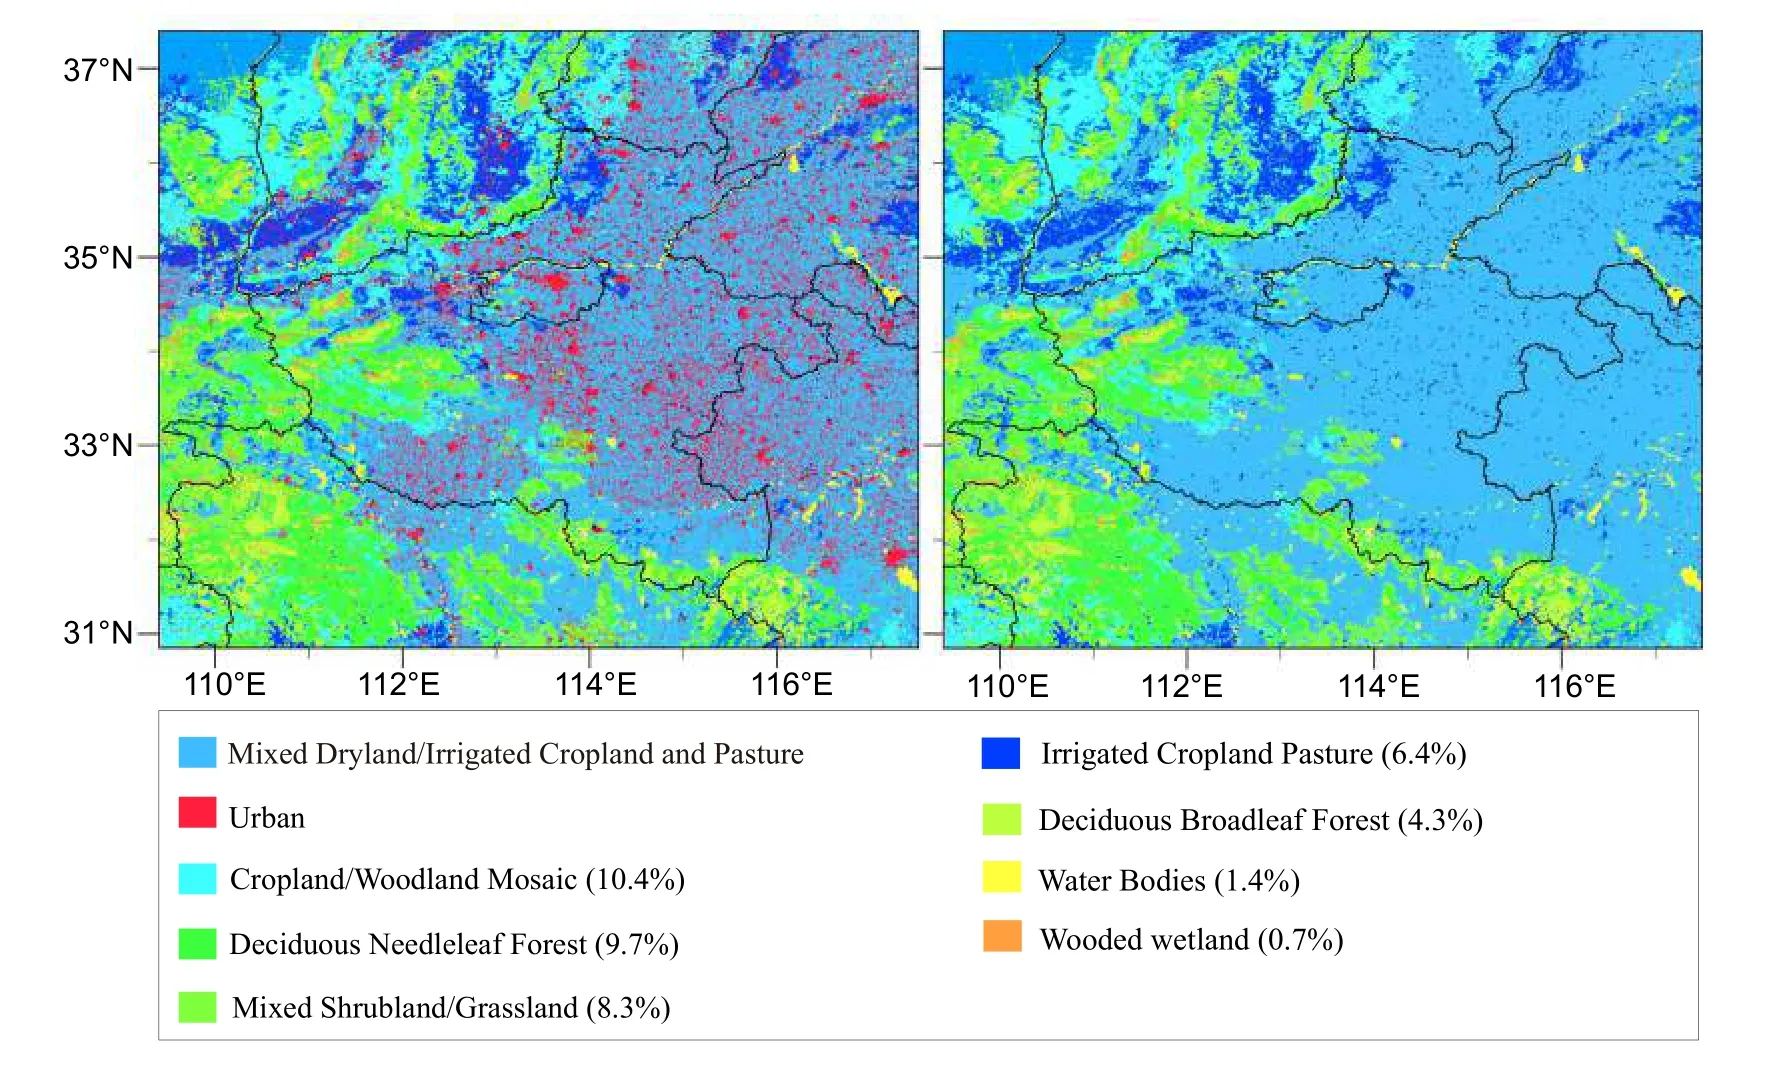
Fig.12.Land-use/land type maps used in the CTRL (left) and NURB (right) experiments.Names and areal fractions (%) of the land cover/land-use types in CTRL are labeled at the bottom.[Adapted from Figs.2b and c in (Luo et al.,2023),with permission from Springer Nature].
The ensemble mean hourly accumulated rainfall over the Henan region was reduced by about 5% at the beginning of the simulation,and reached 30% after 20 h,which resulted in a 13% reduction in the 24-h accumulated rainfall in CTRL relative to NURB.The maximum hourly rainfall over Zhengzhou in CTRL was reduced by 15—70 mm in individual members compared with NURB runs.The reduction in rainfall was mainly due to the dryness caused by the limited evapotranspiration,combined with the wind stilling effect associated with the increased surface roughness in the urban areas upstream of Zhengzhou City.These effects resulted in a decrease in moisture inflow from the south and east to Henan Province,and a weakening of the convective updrafts.The continuous precipitation cloud over Zhengzhou City from 18 to 20 July greatly reduced the level of solar radiation,suggesting that the heat island effect of Zhengzhou was limited.This case study highlighted the importance of upstream urbanization over a broad upstream area,which was influenced by large-scale circulation.Flows from areas to the north,east,and south converged over Zhengzhou City,and the numerous towns and cities shown in Fig.12b caused a reduction in precipitation in Henan Province.
7.Summary and implications
A record-breaking precipitation event that occurred during 17—21 July 2021 in Henan Province,China,had huge societal impacts.Now,after two years,it is important to examine whether our physical understanding can explain this extreme precipitation event;and if so,what action we can take to reduce the impacts of similar weather events in the future.
He spake to the King: Your loyalty46 shall be rewarded, and taking up the heads of the children, he placed them on their bodies, smeared the wounds with their blood, and in a minute they were all right again and jumping about as if nothing had happened
The anomalous nature of the large-scale circulation may explain the occurrence of this event from the viewpoint of moisture supply and large-scale dynamic lifting.However,the intensity and location of the maximum rainfall center were mainly associated with mesoscale weather systems.The extreme rainstorm that caused record-breaking hourly precipitation in Zhengzhou formed after two sequential convection merging processes,and remained over Zhengzhou City for more than two hours.The stationary position of this rainstorm can be attributed to the balance of three flows: a southerly flow to the east of the mesoscale low;a northeasterly flow due to the barrier jet caused by the synoptic southeasterly flow and steep mountains to the north of Zhengzhou;and a northwesterly downslope gravity flow due to the mountain-top radiative cooling and probably the evaporation of light rain over the Taihang Mountains.
The record-breaking precipitation was contributed by multiple-scale weather systems,and the mesoscale low might have been the key linkage in their multiple-scale interaction.While the location and structure of this mesoscale low was essential for the convection merging process,we have shown (Fig.9) that in ERA5 this meso-low was~200 km to the northwest compared with the mesoscale reanalysis based on the assimilation of radar and surface data.Inaccurate prediction of the meso-low could be one of the reasons why global operational weather prediction systems predicted the rainfall center to be over the mountains rather than the city of Zhengzhou.The genesis of the mesoscale low or vortex was also not clear,although several studies have suggested that heating of preexisting convection (Fu et al.,2022),the intensification of the large-scale easterly wind (Kong et al.,2022),or the downward invasion of moist potential vorticity from the middle and upper troposphere (Gou et al.,2023),might have been the key factors.
The complex multiscale interactive dynamics in this event may have resulted in the low predictability.Beside the errors in several sensitive areas (associated with the southeasterly wind,mesoscale low,and upstream trough near Henan Province),the prediction accuracy in terms of the precipitation was also limited owing to the rapid increase in mesoscale errors (Zhang et al.,2022).Nevertheless,data assimilation research using the satellite water vapor channel has provided hope for forecasting the location of heavy rainfall (Xu et al.,2023),although predicting the intensity remains a challenge.
Climate warming has the potential to significantly intensify regional-scale precipitation extremes (by 7% K-1—9% K-1),as well as station-scale precipitation extremes (by 10% K-1—14% K-1,depending on the convective organization).This accords with similar research on other precipitation events.However,contribution of climate warming to an event does not mean that it caused it.Therefore,questions remain regarding the climate systems that influence circulation patterns,and how climate drivers respond to the warming climate.
Long-term increased rainfall has been observed over areas of rapid urbanization,and downwind,worldwide(Changnon,1969;Kishtawal et al.,2010;Fu et al.,2019;Li et al.,2020).The increase has been attributed to urban thermal effects (Huff and Vogel,1978),building barrier effects (Bornstein and Lin,2000;Guo et al.,2006;Zhang et al.,2009;Miao et al.,2011),and urban anthropogenic aerosol emissions effects (Rosenfeld,2000;Bell et al.,2009).High-impact rainfall usually has a longer lifespan and broader area of influence than local convection.Whether urbanization influences the extreme precipitation initiated by large-scale dynamic forcing is largely unknown.For this event,the local urbanization in Zhengzhou had a limited effect on the precipitation,while upstream urbanization resulted in a 13% reduction in the 24-h accumulated rainfall (Luo et al.,2023).
Research on this extreme precipitation event in Zhengzhou has contributed to improving our physical understanding of high-impact weather,partly owing to the application of high-resolution remote sensing and in-situ observations in several studies of this event.Since the goal of physical understanding is to improve the forecasting of future disasters and mitigate their impacts or prevent their occurrence,below we summarize several implications from this case study in the context of improving our physical understanding and prediction of high-impact weather.
(1) Improving the application of high-resolution observations.
For this event in Zhengzhou,the large number of surface observations provided a realistic picture of the precipitation,surface temperature,humidity,and winds,while the radar observations provided detailed information on the clouds and three-dimensional structure of the atmosphere.ERA5 overestimated the intensity of the mesoscale low,with a location of~200 km farther to the northwest than observed.Therefore,studies using ERA5 data may have overestimated the effects of topographic lift.There are large uncertainties in studies using ERA5 to explain convection,and high-resolution reanalysis data obtained by assimilation of high-resolution observations are needed for the study of high-impact precipitation events.
(2) Making data freely available to the research community and weather centers.
To the best of our knowledge,the surface observations from fewer than 1000 national surface stations are currently shared with the Global Telecommunication System,even though there are more than 60 000 AWSs and national observation stations in China.Furthermore,only users with a high priority level can download these data freely.This policy has restricted the development of weather-related science in China for many years.The weather observation system in China is one of the most extensive in the world,but weatherrelated research,especially high-impact weather research,is not fulfilling its potential partly due to limited data availability.
(3) Implementing real-time probability forecasts.
The deterministic predictability for high-impact weather events,like the Zhengzhou case,is limited.On the other hand,recent studies have shown that the predictability of extreme rainfall can be improved significantly by using a neighborhood “probability of precipitation” method in conjunction with an ensemble (Zhu et al.,2022).
(4) Developing impact-based forecasts.
The flooding of Henan Province caused by this event drew the attention of both the hydrology and meteorology research communities,and both have conducted extensive research with the same goal of disaster reduction.However,there have been few collaborative studies (e.g.,impactbased studies with meteorological input).An extreme precipitation warning was issued before the Zhengzhou event,but the impact of the extreme precipitation (e.g.,severe flooding) was not forecasted,and hence no relevant action was taken.
High-impact weather events have the potential to cause huge damage to society and are expected to be more frequent and intense due to climate warming.The annual mean surface temperature over continental China in 2021 was found to be 1.0°C above the average value for 1981—2010,which would make it the warmest year since 1961 (Zhou et al.,2022).Additionally,devastating high-impact weather events,such as record-breaking precipitation,springtime droughts,cold snaps,thunderstorms,wildfires,and heat waves were reported by the CMA (2022).Research related to highimpact weather has improved in recent years;however,further improvements will be hindered without appropriate policies on data and the other issues outlined above.
Acknowledgements.This work was supported by the National Natural Science Foundation of China (Grant No.42030607) and 2022 Open Research Program of the Chinese State Key Laboratory of Severe Weather.
 Advances in Atmospheric Sciences2023年8期
- Advances in Atmospheric Sciences的其它文章
- Preface to the Special Issue on the National Report to the 28th IUGG General Assembly by CNC-IAMAS (2019-2022)※
- Recent Advances in China on the Predictability of Weather and Climate※
- Seamless Prediction in China: A Review※
- A Review of Atmospheric Electricity Research in China from 2019 to 2022※
- Recent Advances in Understanding Multi-scale Climate Variability of the Asian Monsoon※
- China’s Recent Progresses in Polar Climate Change and Its Interactions with the Global Climate System※