
On the Two Successive Supercold Waves Straddling the End of 2020 and the Beginning of 2021※
2022-04-06 08:38:54CholawBUEHJingbeiPENGDaweiLINandBominCHEN
Advances in Atmospheric Sciences 2022年4期
Cholaw BUEH, Jingbei PENG, Dawei LIN, and Bomin CHEN
1International Center for Climate and Environment Sciences, Institute of Atmospheric Physics,Chinese Academy of Sciences, Beijing 100029, China
2State Key Laboratory of Severe Weather (LASW) & Key Laboratory for Cloud Physics of China Meteorological Administration, Chinese Academy of Meteorological Sciences, Beijing 100081, China
3Shanghai Climate Center, Shanghai 200030, China
ABSTRACT Two supercold waves straddling 2020 and 2021 successively hit China and caused record-breaking extremely low temperatures. In this study, the distinct features of these two supercold waves are analyzed on the medium-range time scale.The blocking pattern from the Kara Sea to Lake Baikal characterized the first cold wave, while the large-scale tilted ridge and trough over the Asian continent featured the second cold wave. Prior to the cold waves, both the northwest and hyperpolar paths of cold air contributed to a zonally extensive cold air accumulation in the key region of Siberia. This might be the primary reason why strong and extensive supercold waves occur even under the Arctic amplification background.
Key words: cold wave, Siberian high, hyperpolar path, blocking, large-scale tilted ridge and trough
1. Introduction
In the two months spanning 2020 and 2021 (i.e., December 2020 and January 2021), China suffered serious cold air attacks, and a number of cities experienced record-breaking extremely low temperatures. In these two months, there were eight cold weather events in East Asia, and two of them, which occurred during 28-31 December 2020 and 6-8 January 2021, became strong cold waves featuring intense and extensive temperature drops in East Asia. During the first cold wave, the coldest weather since the beginning of winter occurred in most parts of central and eastern China. On the morning of 31 December 2020, the 0°C isotherm moved southward, south of the Yangtze River, and the observed temperatures at 20 national meteorological stations reached or fell below the local historical low temperature for December (https://mp.weixin.qq.com/s/dUWGHg 7vUsLgZbivDRiZuw). In particular, the temperatures at the southern suburb station of Taiyuan (Shanxi Province) and the Hengshan station (Hunan Province) dropped to -20.6°C and -15.9°C, respectively, breaking the local record for the lowest temperature. During the second cold wave, the land area with a temperature drop of more than 8°C (12°C)reached 2.5 (0.4) million square kilometres. The lowest temperature of 60 meteorological stations in the northern part of China broke or reached the historical extreme low value since the establishment of the stations (https://mp.weixin.qq.com/s/lNNTSt1MPV93zTP9BKQbtg). On the morning of 7 January, the minimum temperature in the southern suburb observatory in Beijing was -19.6°C, which was the lowest in the winter since 1966. These two cold waves have attracted extensive public attention due to their severe weather impacts. On the other hand, they have aroused the interest of the scientific community simply because they took place during global warming. A recent article reported that the synergistic effect of the warm Arctic and the La Ni?a event in the current winter, as an indispensable background, was crucial for these cold events (Zheng et al.,2021). At present, the abovementioned two cold waves have become a relevant topic in Asian countries, and the related dynamic issues deserve further in-depth investigation.
Researchers in China began to investigate East Asian cold waves as early as in the 1950s. Tao (1955, 1957) systematically analyzed different types of cold waves affecting China. He proposed the notion of a key region of cold air accumulation for the subsequent cold wave and indicated several cold air paths for invading China. In the 1980s, Qiu(1985) recognized that the cold waves affecting China were closely associated with two active mid-tropospheric ridges over the North Atlantic and North Pacific. As these studies proposed, a strong cold wave with a nationwide extent in China is often driven by the Ural-blocking circulation, for which blocking maintenance works at cold air accumulation in the key region around Central Siberia and collapse of the blocking gives rise to a southward cold air outburst. The two successive cold waves spanning 2020 and 2021, as is shown later, share similarities in the evolution of the surface cold temperature anomaly pattern and the mid- and high-latitude circulation structure. However, these two cold waves are distinct from those that have occurred earlier in the last century in many aspects, including the cold air path and the evolution of the blocking pattern.
Both low- and high-frequency dynamic processes are essential for East Asian cold waves. The propagation of low-frequency Rossby waves from upstream has been recognized as an important contributor to the build-up of the blocking pattern over the North Atlantic/European sector (Dole,1986; Nakamura et al., 1997). Li (2004) pointed out that the eastward propagation of the low-frequency Rossby wave from Newfoundland is favourable to the formation of the Ural-blocking high in early winter. Li and Gu (2010) also pointed out that the Rossby wave train originating from the midlatitude North Atlantic exerts an important influence on the formation of the Ural blocking pattern. These studies suggest that the low-frequency Rossby waves originating from the North Atlantic/Europe could play roles in the maintenance of the Ural blocking pattern and thus the subsequent East Asian cold wave. In this study, we examine how low-frequency processes are related to the Asian blocking circulation and the abovementioned two cold waves. On the other hand, considering the slowness involved in the low-frequency wave, the cold air outburst seems to be associated with high-frequency waves embedded within the low-frequency Rossby waves. In fact, during East Asian cold waves, synoptic troughs and ridges are frequently observed to be very active prior to and during cold air outbursts (Zhu et al., 1981). Thus, it is worth exploring the role of the highfrequency process during the two cold waves.
Arctic amplification (AA) has been recognized as the most prominent manifestation of global warming (Screen and Simmonds, 2010; Petoukhov and Semenov, 2010; Wu,2017). Under such an unfavorable warm Arctic circumstance, what are the primary reasons for the occurrence of the two supercold waves at the end of 2020 and at the beginning of 2021? The intensity of a cold wave is measured by the degree of the temperature drop, which is primarily determined by cold temperature advection. The occurrence of intense cold advection requires two conditions: a strong meridional temperature gradient and a strong northerly wind.The former is determined by the cold air accumulation in the Siberian key region (so called cold dome; Tao, 1955,1957), and the latter depends on the strength of the northerly wind along the eastern flank of the Siberian high (SH).Therefore, it is necessary to explore the main causes of these two supercold waves in terms of the cold air accumulation in the Siberian key region and the relevant northerly wind operated by the SH.
In this study, we primarily address the following questions: (1) What are the distinct features of the two supercold waves compared with the earlier cold waves? (2) What roles do low-frequency and high-frequency processes play in these two cold waves? (3) Considering the AA background, what are the primary reasons for the occurrence of these two supercold waves? Our primary purpose is to attempt to answer these questions. The remainder of this paper is organized as follows: section 2 describes the data and methods used; the main results are presented in section 3; and the final section consists of a conclusion and discussion.
2. Data and methodology
In this study, we use daily mean reanalysis data from the National Centers for Environmental Prediction (NCEP)and National Center for Atmospheric Research (NCAR)(Kalnay et al., 1996). The meteorological fields include 500-hPa geopotential height (Z500), horizontal winds at 500 hPa and 925 hPa, surface air temperature (SAT) and air temperatures at 500 hPa and 925 hPa, sea level pressure(SLP), and air density at 500 hPa. The data are available on a global regular grid with intervals of 2.5° in both latitude and longitude. With regard to the two successive cold waves, we use the daily meteorological fields for the period from 20 December 2020 to 10 January 2021. Unless otherwise specified, the daily and monthly anomalies are relative to the climate mean during 1981-2010. The Z500 trend field is calculated for the period of 1979-2021.
We use the Lanczos filtering method (Duchon, 1979) to decompose the Z500 field into high-frequency and low-frequency components with a cut-off period of eight days.
Stationary or low-frequency Rossby wave propagation associated with cold waves is analyzed by applying a waveactivity flux defined by Takaya and Nakamura (1997,2001). The flux is independent of the wave phase and parallel to the local group velocity of the Rossby wave train.
The Ertel potential vorticity (q) at 500 hPa is calculated asq=-gζa·?pθ, whereg, ζa, and θ represent the gravitational acceleration, absolute vorticity, and potential temperature, respectively. To examine the roles of low- and high-frequency waves in the advection of potential vorticity, in this study we decompose potential vorticity advection (-V·?pq)into advection by low-frequency wind (-VL·?pq) and advection by high-frequency wind (-VH·?pq). In a similar way,the temperature advection at 925 hPa is also divided into the temperature advection by the low-frequency wind and that by the high-frequency wind.
To depict the daily evolution of the SH, we defined an SH index (SHI) as the domain (40°-55°N, 70°-120°E)-averaged SLP anomaly, for which the domain approximates the area surrounded by the climatic isobar of 1030 hPa, and it is also almost identical to the SH key region in Wu et al.(2011). In order to illustrate the daily variation of cold air accumulation in the key region of East Asian cold waves(Tao, 1957; Zhu et al., 1981), we also defined a cold air accumulation index (CAI; blue dashed line in Fig. 3) as the average SAT anomaly in the domain (50°-65°N, 65°-95°E;black box in Fig. 2f). To examine the daily evolution of the cold temperature process in China, we also selected an area with the largest temperature drop (28°-46°N, 102°-122°E;black box in Fig. 1a) during the two cold waves and defined a cold temperature index (CTI; blue solid line in Fig. 3) as the average SAT anomaly in this area.
Student’s t-test (Wilks, 1995) is employed to assess the statistical significance of the results in the composite analysis and the trend analysis.
3. Results
3.1. Key features of the two cold waves
The two supercold waves during 28-31 December 2020 and 6-8 January 2021 hit China one after another, bringing a wide range of extremely low temperatures. The difference field between the minimum daily mean SAT during the first cold wave and the daily mean SAT on the day before the cold wave, representing the largest temperature drop at every grid point, is shown in Fig. 1a. Most parts of China to the east of 100°E experienced a temperature drop of more than 12°C, and the temperature drops in North China and the northern part of East China were even more than 16°C. During 6-8 January 2021, China was once again hit by a strong cold wave. Although the largest temperature drop during this cold wave (Fig. 1b) was smaller than that during the last cold wave (Fig. 1a), a record-breaking extremely low temperature occurred in many locations,since the SAT on the day before the cold wave had already been considerably low (see blue solid line of Fig. 3).

Fig. 1. (a) The difference field between the minimum daily mean SAT during the cold wave during 28-31 December 2020 and the daily mean SAT the day before the cold wave (°C) and, (b) as in (a) but for the cold wave during 6-8 January 2021.The black box represents the key region of temperature drop in China during the cold waves.
It is known that when the SH strengthens and expands southward, cold air outbursts take place and invade southward (Ding and Krishnamurti, 1987; Ding, 1990; Takaya and Nakamura, 2005). Here, we examine the evolution of the SH and its impact on cold weather in China during these two cold waves. On 24-26 December 2020, a positive sea level pressure (SLP) anomaly center developed in the area from Novaya Zemlya Island to the Kara Sea (Figs. 2a and 2b). On 26 December, the amplitude of the SLP anomaly center exceeded 40 hPa. Until this time, the SH was to the northwest of its climatological position, as indicated by the isobar of 1030 hPa (red and blue contours in Fig. 2b). Then,the centre of the SH moved southeastward and reached to the west of Lake Baikal on 28 December (Fig. 2c). The central amplitude of the SH then exceeded 1065 hPa, which is comparable to that of the supercold wave during 21-26 January 2016 (Jiang et al., 2016). Compared with its climatological position, the SH extended southward by 1-3 degrees of latitude, as seen from the isobars of 1030 hPa (blue and red contours in Fig. 2c). Before 27 December, the SHI was negative and relatively weak (Fig. 3). On 27 December, it turned positive, and from 28 December onward, the SHI strengthened rapidly, and the concurrent CTI drop indicated the start of the cold wave outburst. By 30 December,the SH quickly expanded southward to cover southern China (Fig. 2d), corresponding to the cold air outburst stage(Fig. 2h). Negative SAT anomalies were down to -8°C in southern China (to the south of 30°N) and down to -12°C in northern China (to the north of 30°N). After 31 December,as seen in Fig. 3, the CTI recovered to the value it had been before 27 December, suggesting the end of the first cold wave.

Fig. 2. (a)-(d) SLP anomaly fields (hPa) on 24, 26, 28, and 30 December 2020, and (e)-(h) as in (a)-(d) but for SAT anomaly fields (°C). In (a)-(d), the red and purple lines represent the isobars of 1030 hPa and 1060 hPa, respectively,and the blue line represents the corresponding daily climate mean isobar of 1030 hPa. In (e)-(h), the red (blue) line represents the daily mean (the corresponding daily climate mean) isotherm of -30°C. The black boxes in (b) and (f)denote the key regions of the SH and the cold air accumulation for the cold wave, respectively.

Fig. 3. Daily evolution of the SLP anomaly (red solid line) averaged in the key region of the SH(black box in Fig. 2b), the SAT anomaly (blue solid line) averaged in the key region of temperature drop in China (black box in Fig. 1a), and the SAT anomaly (blue dashed line) averaged in the Siberian key region of cold air accumulation (black box in Fig. 2f). The horizontal ordinate refers to the period from 20 December 2020 to 10 January 2021. The shadow indicates the two cold wave processes.
The daily evolution of the CAI, as shown in Fig. 3(dashed blue line), indicates that 24-27 December could be considered the key period of cold air accumulation around central and eastern Siberia. This is consistent with the observed facts in Figs. 2e and 2f that the cold dome, as indicated by the isotherm of -30°C (red contours), formed in an extensive band from central to eastern Siberia. As observed on 26 December, the SAT anomalies were less than -16°C in most parts of western and central Siberia and less than-12°C in most parts of eastern Siberia (Fig. 2f). As is well known, an extensive band of cold dome is crucial for the cold waves in East Asia (Takaya and Nakamura, 2005).Then, how does such an extensive cold dome form? To answer this question, we show the cold air paths in Fig. 4. A cold air path is identified if along this path an apparent daily SAT drop is detected. As clearly seen in Fig. 4a, two routes of strong cold air masses, one along the northwest path from the northern end of the Ural Mountains and the other along the north path from the north of Lake Baikal, merged together to form the cold dome on 26 December (Fig. 2f).Right after that, the cold air began to sweep through China.As shown in Fig. 3, 26-28 December can be considered the key period of rapid SH amplification (red solid line in Fig.3), and this is consistent with Figs. 2b and 2c. It is noteworthy that the northwest path is the primary cold air path during the first cold wave (Fig. 4a). But that is not to say that the north path does not matter. In fact, the cold air mass along the north path worked at building up the extensive cold anomalies during both the cold air accumulation and the cold air outburst stages (Figs. 2e-2h).

Fig. 4. Cold air paths for (a) the first cold wave and (b) the second cold wave. A circle denotes a daily strong cooling area where the daily mean SAT apparently drops from the last day.The solid (dashed) circle refers to a daily mean SAT drop of 8°C (6°C) in (a) and 5°C (2°C) in (b). See text for details.
Prior to the second strong cold wave during 6-8 January 2021, there was a large-scale positive SLP anomaly in Siberia with a central amplitude of more than 35 hPa (Fig. 5a).Compared with the climate mean, the SH was stronger with a central intensity of up to 1060 hPa, and the area surrounded by the isobar of 1030 hPa was considerably extensive.In fact, between the first and second strong cold waves, the SHI still reflected a strong positive anomaly (Fig. 3),although the SH did not invade southward to China. On 6 and 7 January, the SH extended southeastward to southern China (Figs. 5b and 5c), and strong cold air swept across most parts of China (Figs. 5e and 5f). As seen from the blue solid line in Fig. 3, the minimum CTI in this cold wave(-19.3°C) is as low as that in the first cold wave (-18.9°C).It is noted from Fig. 3 that prior to the cold wave outburst,the processes of SH amplification and cold dome formation in the Siberian key region show a slower feature compared to those for the first cold wave. This issue will also be discussed in the next subsection.
The SAT anomalies in Siberia, as displayed in Figs. 5d and 5e, imply that the cold air accumulation prior to this cold wave was also related with two routes of cold air masses. Indeed, as displayed in Fig. 4b, the cold air masses along the northwest path and along the north path merged together on 5-6 January and then invaded southward to southern China. In contrast to the situation of the first cold wave,the north path is the primary cold air path during the second cold wave (Fig. 4b), whereas the cold air along the northwest path is relatively weak.
For both strong cold waves in 2020/21, as stated previously, the cold air along the north path was very active and contributed to the cold air accumulation in the key Siberian region (see the red contours in Figs. 2e, 2f, 5d, and 5e). We also note that the extreme cold region on the subpolar Asian continent in the climate mean of 1981-2010, surrounded by the isotherm of -30°C (blue contours in Figs. 2e, 2f, 5d, and 5e), was situated in eastern Siberia. This is perhaps consistent with the warming associated with AA since the end of the 1970s in the Barents-Kara Seas (Screen and Simmonds,2010; Petoukhov and Semenov, 2010; Luo et al., 2016). To see if that is the case, we draw in Fig. 6 the extreme cold area in northern Asia with temperature below -32°C for each decade since the 1950s. In the 1950s and 1960s, as seen in Fig. 6, strong cold air sources were distributed not only in the subarctic region of the Eurasian continent but also in the Arctic Ocean to the north of the Novaya Zemlya Islands. In the 1990s, the extreme cold area shrank to its minimum around Yakutsk. In the two most recent decades (the 2000s and 2010s), the extreme cold area slightly expanded eastward compared to that in the 1990s. In this recent decadal background, if a supercold wave is to form, it is necessary not only to have a strong SH and its southward invasion but also to have a strong cold air accumulation around the climatologically extreme cold area, which facilitates a strong temperature drop due to the corresponding supercold advection. We emphasize that this is an important reason why these two cold waves both preferred the north path for its cold air accumulation and subsequent southward outburst.

Fig. 5. As in Fig. 2, but on 4, 6 and 7 January 2021.

Fig. 6. Fig, 6. Mean isotherms of -32°C in January in different decades.
The north path discussed in this study (Fig. 4) has also been called the hyperpolar path by Chinese meteorologists(e.g., Tao, 1959). The concept of the “hyperpolar path” in cold air movement was first put forward around the 1940s by scholars of the former Soviet Union . This term refers to the cold air path, along which the cold air dome or the surface cold high pressure near the Arctic moves from northeast to southwest or from north to south. Following the earlier convention, hereafter, we call the north path as the hyperpolar path.
3.2. Roles of low- and high-frequency Rossby processes
The SH amplification process is closely related to the blocking pattern and its maintenance (Takaya and Nakamura, 2005). Figure 7 shows the time-averaged Z500 and its anomalies relating to the two strong cold waves. As observed, the circulation patterns of these two strong cold waves are generally similar (Figs. 7a and 7b). As displayed in Fig. 7a, two strong ridges, one over the Ural Mountains and the other over the North Atlantic, extended into the polar region, while there was a deep trough along the western coast of Europe between these two ridges. Stationary Rossby wave propagation, which emanated from the northern North Atlantic, was apparently responsible for maintenance of the Ural ridge. The polar vortex deflected towards East Asia and the North Pacific (Fig. 7a). The circulation pattern for the second cold wave, as shown in Fig. 5b,resembles that of the first cold wave, which was also characterized by the Ural ridge, the North Atlantic ridge, and the polar vortex deflection towards East Asia and the North Pacific. However, the most prominent circulation feature during these two cold waves is an isolated high around the Barents-Kara Seas, which is directly associated with the evolution of blocking-type circulation over the Asian continent.The isolated high and the related positive Z500 anomaly center extend toward Greenland for the first cold wave, while they are close to the subpolar region of the Eurasian continent for the second cold wave (Figs. 7a and 7b). In this subsection, we discuss the synoptic evolution of these circulation components, including low-frequency and high-frequency components, and how they collocate to enable the abovementioned two cold waves. As will be shown later, the roles of the low-frequency and high-frequency processes are quite different for these two cold waves. The low-frequency process alone does not fully explain the record-breaking cold air outbreaks.

Fig. 7. The fields of Z500 (contours with an interval of 80 m) and its anomaly (shading; m) averaged from (a) 26 December 2020 to 2 January 2021 and from (b) 4 January to 10 January 2021. The corresponding wave activity fluxes (arrows; m2 s-2) are superimposed in (a) and (b). In the calculation of the wave activity fluxes, the timeaveraged anomalies relative to the corresponding climate mean are regarded as perturbations associated with a quasistationary Rossby wave train.
First, we analyse the first supercold wave. The Z500 fields on 24, 26, 28, and 30 December 2020 are shown in Figs. 8a-8d, with the superposition of the corresponding 500-hPa potential vorticity advection (PVA) fields. The corresponding fields of low-frequency Z500 and high-frequency Z500 are displayed in Figs. 8e-8h and Figs. 8i-8l,respectively. A similar 925-hPa temperature advection diagram is also plotted in Fig. 9. In the cold air accumulation stage (Figs. 2e and 2f), the isolated high around the Barents-Kara Seas and a zonally elongated transverse trough on the northern side of Lake Baikal together characterize a blocking pattern (Figs. 8a and 8b). We call this pattern the Kara-Baikal blocking pattern. In the following, our discussion mainly focuses on the evolution of the Kara-Baikal blocking pattern and the accompanying process of the transverse trough becoming a meridional trough, from the perspectives of PVA and Rossby wave energy dispersion. On 24 December, the transverse trough extended westward to approach the Ural Mountains (Figs. 8a and 8e), but it shrank toward central Siberia on 26 December (Figs. 8b and 8f)due to a negative PVA around its western end. The negative PVA also affected the Kara Sea high, which was developed and expanded southward from 24 December to 26 December. During this time, Rossby wave packets emanated from the front edge of the Kara Sea high to the western portion of the transverse trough to the southeast (Figs.8e and 8f). Such a wave activity release indicates that this blocking pattern started to decay (Nakamura, 1994; Shi and Nakamura, 2021). Corresponding to the Kara-Baikal blocking pattern, a temperature drop of ~12°C d-1was observed between Lake Balkhash and Lake Baikal on 26 December(Fig. 9a), primarily due to temperature advection by the high-frequency wind (Fig. 9d). On the other hand, a temperature drop of 3°C d-1-5°C d-1was observed in eastern Siberia due to the cold temperature advection by the low-frequency wind (Fig. 9g). Indeed, the high-frequency transient wave train was active over midlatitude Eurasia (Figs. 8b and 8j),and an instantaneous negative Z500 center (~-90 m) was present near Lake Balkhash (Fig. 8j). As indicated in Fig.4a, at this time, the primary cold advection between Lake Balkhash and Lake Baikal is consistent with the northwest path of cold air, while the weak cold advection in eastern Siberia matches with the north path of cold air. In brief, the cold air accumulation process for this cold wave was completed by both the northwest and hyperpolar paths of cold air masses.
The cold wave broke out on 28 December as the transverse trough near Lake Baikal turned anticlockwise into a tilted trough and moved slightly eastward (Fig. 8c). The downstream Rossby wave energy dispersion was responsible for the trough becoming tilted and for the isolated high around the Kara Sea becoming weak (Figs. 8c and 8g), consistent with the finding of Nakamura (1994). Notably, the longtilted trough from the Sea of Okhotsk to northwestern China was the result of the Northeast-Southwest overlap of negative low- and high-frequency components (Figs. 8c, 8g, and 8k). The negative and positive PVA in the northwestern and southeastern portions of the tilted trough, respectively,made this trough turn anticlockwise to become a meridional trough (Figs. 8a-8h). Such a PVA effect is even obvious from 28 December onwards (Figs. 8c, 8d, 8g, and 8h).At this time, a strong temperature drop, down to -10°C d-1,occurred in Mongolia and northern parts of China (Fig. 9b).The primary reason for this is the arrival of the southern edge of the SH with strong SLP anomalies (Fig. 2c). Notably, at least in the western portion of the strong cooling area, the temperature drop resulted from the cold advection by high-frequency winds (Figs. 9b and 9h). On the other hand, in correspondence with the tilted trough over East Asia (Fig. 8c) and the eastern edge of the SH (Fig. 2c), a meridional band of strong cold advection, up to -15°C d-1,formed from eastern Siberia to northen and northeastern China (Fig. 9b), signifying the advent of cold waves as well.It is shown that in the eastern portion of the strong cooling area, the cold advection by low-frequency winds contributed to the strong temperature drop (Figs. 9b and 9e). These facts suggest that the southward intrusion of the SH front edge and the related strong temperature drop are associated with the high-frequency process, while the strong cooling along the eastern edge of the SH, which is nearby the land-sea border, is controlled by the low-frequency process.
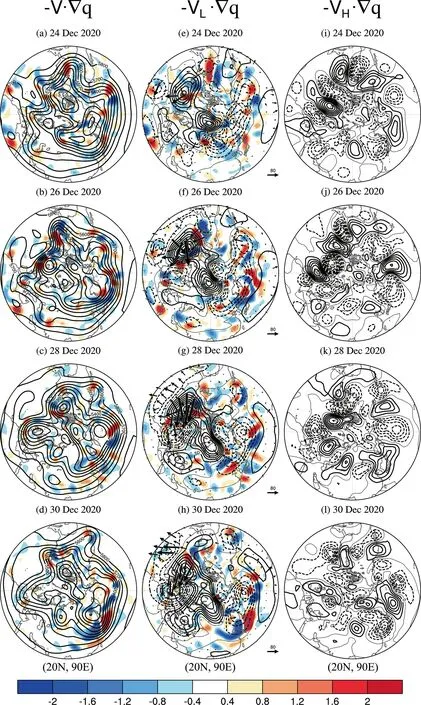
Fig. 8. (a)-(d) The Z500 fields (contours with an interval of 100 m) on 24, 26, 28, and 30 December 2020 with the superpositions of 500 hPa PVA fields (shading; 10-11 K m2 kg-1 s-2);(e)-(h) as in (a)-(d), but for the low-frequency Z500 anomaly fields and the PVA by the lowfrequency wind component; and (i)-(l) as in (a)-(d), but for the high-frequency Z500 fields.The contours of the low-frequency (high-frequency) Z500 fields are given with intervals of 50 m (30 m). Additionally, superimposed in (e)-(h) are the wave activity fluxes (m2 s-2). In the calculation of the wave activity fluxes, the daily mean anomalies relative to the corresponding 31-day running mean field are regarded as perturbations associated with lowfrequency Rossby wave packets.
The cold wave swept across southern China on 30 December (Fig. 9c) as the tilted trough over East Asia turned into a meridional trough (Fig. 8d). It is worth pointing out that, at this time, the high-frequency Z500 component of the East Asian trough, down to ~-150 m, was almost equivalent to its low-frequency counterpart (Figs. 8h and 8l), reflecting the crucial role of the high-frequency Rossby wave. The propagation and evolution of the transient synoptic wave was clearly seen over midlatitude Eurasia (Figs. 8k and 8l), and in particular, the wave was strongly amplified near the East Asian coast on 30 December (Fig. 8l) when it was situated aloft over the strong surface baroclinic zone.As seen from Figs. 9a-9c, the cold advection along the East Asian coast was in its strongest stage (~15°C d-1), and it was almost equally contributed by the cold advection from the high- and low-frequency winds (Figs. 9f and 9i).
Now, we briefly discuss the second cold wave. As previously presented, the Z500 circulation pattern and its evolution during this cold wave are similar to those of the first cold wave (Figs. 8a-8d and Figs. 10a-10c), but its blocking pattern and high-frequency process are somewhat different from those during the first cold wave. The cold air accumulation stage of this cold wave (Fig. 5d) was achieved by a pair of large-scale tilted ridges and troughs over the Asian continent (Bueh and Xie, 2015; Bueh et al., 2018; Lin et al.,2018), for which the tilted ridge extended from Central Asia to Far East Russia and the tilted trough was situated from the Sea of Okhotsk to the Lake Balkhash (Fig. 10a). The portion of the large-scale tilted ridge and trough to the east of Lake Balkhash could be considered a blocking pattern(Bueh and Xie, 2015). It is shown that the blocking pattern of this cold wave was located slightly southeastward compared to that of the first cold wave. During the evolution of the large-scale tilted trough turning into a meridional trough along the East Asian coast, the cold wave first invaded northern China (Figs. 5e and 10b) and then hit southern China(Figs. 5f and 10c). The low-frequency dynamics, including the shaping effect of PVA by the low-frequency wind and the low-frequency wave energy dispersion, are primarily responsible for the evolution of the large-scale tilted ridge and trough over the Asian continent into a meridionally oriented ridge and trough (Figs. 10a-10f and 11a-11f), thus dominating this cold wave process. Interestingly, the strong temperature drop during this cold wave event was primarily caused by the hyperpolar path of cold air (Fig. 4b) and was contributed by the cold advection from low-frequency winds (Figs. 11a-11f). By contrast, the role of the high-frequency process is weaker (Figs. 10g-10i and 11g-11i).

Fig. 9. (a)-(c) Daily mean temperature advection fields at 925 hPa (shading; °C d-1) on 26, 28, and 30 December 2020; (d)-(f) as in(a)-(c), but for the temperature advection by the low-frequency wind component; and (g)-(i) as in (a)-(c), but for the temperature advection by the high-frequency wind component. The observed daily mean temperature change from the last day, as indicated by contours with an interval of 3°C d-1, is also superimposed in each panel on the respective days.

Fig. 10. As in Fig. 8, but on 4, 6, and 7 January.

Fig. 11. As in Fig. 9, but on 4, 6, and 7 January.
To summarize, the Kara-Baikal blocking and its evolution characterized the first cold wave, while the large-scale tilted ridge and trough over the Asian continent characterized the second cold wave. These large-scale circulation patterns and their evolutions are associated with both the northwest and hyperpolar paths of cold air accumulation and southward advancement. The hyperpolar route of cold air activity associated with the SH was very active during these two cold waves, which is linked with the polar vortex deflection towards East Asia and the North Pacific (Figs. 7a and 7b).
3.3. Comparison with earlier cold waves
As introduced previously, the two cold waves in winter of 2020/21 occurred over a very wide extent. In this subsection, we compare the key features of the first cold wave during 28-31 December 2020 with those of the 20 strongest winter (DJF) cold waves during 1951-2000.
Here, we adopt the cold wave definition of Wang and Ding (2006). They defined the cold wave at an individual station according to the abrupt temperature drop and temperature anomaly. Then, they defined the nationwide and regional cold waves in China according to different cold wave area thresholds. In total, 267 cold waves are defined in this manner for the period 1951-2000 (Peng and Cholaw,2012). Then, we select a subset (197) of cold waves with durations of at most five days. The constraint of “at most five days” is chosen for the purpose of a direct comparison because the cold wave during 28-31 December 2020 lasted for only four days. Finally, the 20 strongest cold waves,which are selected according to the number of cold wave stations in China (Table 1), are used in the composite analysis.In fact, the cold wave during 28-31 December 2020 is very extensive (332 cold wave stations) and would rank third among the 197 cold waves in Table 1. In this subsection, the anomalies are calculated relative to the climate mean for the period 1951-2020.
Figure 12 shows composite fields of Z500 and its anomalies, SLP anomalies, and SAT anomalies, respectively, at different reference times for the earlier cold waves. Figure 13 displays the analogous fields for the cold wave during 28-31 December 2020. As shown in Figs. 12a-12c, the earlier cold waves in China were preceded by the Ural blocking circulation, and their outbursts were characterized by an inverse “ Ω” circulation pattern from the Ural Mountains to the northwestern Pacific. The Ural blocking pattern disappears with the ending of a cold wave. During the first cold wave in winter of 2020/21, however, the blocking pattern was situated more to the north and stronger positive Z500 anomalies were present over the Kara Sea compared to the situation for the earlier cold waves (Figs. 13a and 13b). The blocking pattern exhibited a wave-breaking feature, instead of the inverse “ Ω” circulation pattern, for the earlier coldwaves. This might be related to the polar vortex deflection towards East Asia and the North Pacific in winter of 2020/21 (Fig. 7). The Ural ridge was still active even after the cold wave (Fig. 13c), in contrast to the situation of earlier cold waves.

Table 1. Metadata for the 20 strongest cold waves during 1951-2000 (see text for details).
During the cold waves in winter of 2020/21, the Aleutian low was active and tended to extend westward to affect eastern Siberia (e.g., Figs. 13d-13f). The collocation of such an anomalous circulation near the northeastern Asian coast and the SH amplification may be considered as favorable for the hyperpolar path of cold air accumulation prior to the cold wave outburst (Fig. 4). Accordingly, as shown in Fig. 13g, the SAT anomalies prior to the cold wave were zonally extensive. This might be the primary reason why a strong and extensive cold wave occurs even under the AA background. These distinct features are obviously absent for the earlier cold waves (Figs. 12d-12i).
4. Conclusion and discussion
4.1. Concluding remarks
In the present study, we analyze distinct features of the two successive supercold waves straddling the end of 2020 and the beginning of 2021 using NCEP/NCAR reanalysis data. The Kara-Baikal blocking facilitated the first cold wave, while the large-scale tilted ridge and trough over the Asian continent featured the second cold wave. The collocation of the Asian blocking pattern and the polar vortex deflection towards East Asia facilitated a distinct hyperpolar path of cold air for these two cold waves (Figs. 4 and 7). We emphasize that the reason why strong and extensive supercold waves occur even under the AA background is primarily the zonally extensive cold air accumulation from central to eastern Siberia prior to the cold wave outburst.
The two cold waves straddling 2020 and 2021 exhibited distinct features: (1) the blocking circulation occurred to the north or the east of the Ural Mountains and was not confined only to the Ural Mountains as it was for the earlier cold waves. The polar vortex deflection towards East Asia and the North Pacific was also a very important anomalous circulation background for the two strong cold waves; (2)prior to these two cold waves, both the northwest and hyperpolar paths of cold air were active and contributed to a zonally extensive cold air accumulation in the key region of Siberia; and (3) both high- and low-frequency processes worked in concert to facilitate an extensive cold air accumulation and the subsequent southward outburst. The southeastward intrusion of the SH front edge and the related strong temperature drop along the northwest path are associated with the high-frequency process, while the strong cooling along the eastern edge of the SH, which is along the hyperpolar path, is controlled by the low-frequency process. Two common features are observed as well between the two cold waves and the earlier cold waves: (1) the blocking maintenance corresponds to the surface cold air accumulation in the key region around Siberia; and (2) once the transverse or tilted trough in front of the primary ridge becomes meridional, the accumulated cold air rushes southward, causing the East Asian cold wave. These features are basically consistent with the results of previous cold wave studies (Tao,1957; Zhu et al., 1981; Qiu, 1985; Takaya and Nakamura,2005; Peng and Cholaw, 2012).
4.2. Discussion
In recent decades, with continuous global warming and the continuous reduction of Arctic sea ice, AA has become increasingly prominent (Screen and Simmonds, 2010; Petoukhov and Semenov, 2010; Luo et al., 2016), thus strengthening the connection between Arctic and midlatitude weather(e.g., Honda et al., 2009; Liu et al., 2012; Wu, 2017). AA may lead to the frequent occurrence of extreme weather and climate events (e.g., Ding et al., 2008; Wu, 2017). On the other hand, it is widely known that La Ni?a events tend to cause abnormally cold weather in East Asia during the winter (Chen, 2002; He et al., 2008; Chen et al., 2013; Han et al., 2016). Consistent with these findings, the combined effect of the warm Arctic and the La Ni?a event has been reported to be important for extreme cold weather events in East Asia (Han et al., 2016; Zheng et al., 2021). This combined effect possibly contributed to the supercold waves in the winter of 2020/21, as proposed by Zheng et al. (2021),since the La Ni?a phase matured during this winter as well.

Fig. 12. Composite fields of Z500 (contours with interval of 80 m) and the corresponding anomalies (shading) on (a) the third day before the cold wave, (b) the starting day of cold wave, and (c) the ending day of cold wave; (d)-(f) As in (a)-(c), but for SLP anomalies with an interval of 2 hPa; (g)-(h) As in (a)-(c), but for SAT anomalies with an interval of 2°C. The black dots in (a)-(i)indicate the region where the composite anomalies are significant at the 95% confidence level with a student’s t-test. The composite fields are constructed based on the strongest 20 cold waves during 1951-2000, which are selected in terms of the cold wave extent(or cold wave station count).

Fig. 13. As in Fig. 12, but for the cold wave during 28-31 December 2020. The third day before the cold wave is 25 December.
To examine the background effects of the warm Arctic and the La Ni?a event, we show in Fig. 14 the December-January mean Z500 and its anomaly fields in the winter of 2020/21, the corresponding composite anomaly fields for the last ten La Ni?a years, and the corresponding trend fields for December-January in 1979-2021. The circulation anomaly fields in the winter of 2020/21 (Fig. 14a)resemble those of the La Ni?a composite (Fig. 14b) and the recent trend field (Fig. 14c), particularly over the vast region from the North Atlantic to East Asia. As long as we agree that the circulation anomalies in Figs. 7 and 14a are the preferred patterns of the abovementioned two supercold waves, we tend to agree with the opinion of Zheng et al.(2021). However, it is noteworthy that a noticeable ridge over the North Atlantic, in association with the negative phase of the North Atlantic Oscillation (NAO), was observed in Figs. 7 and 14a. Even during the two cold waves, the North Atlantic ridge was robustly present and had a close link with the Asian blocking pattern (Figs. 8b-8d and 10a-10c). According to the statistical significance test, neither the La Ni?a event nor the global warming trend guaranteed the existence of an anomalously strong North Atlantic ridge (Fig. 14). Therefore, we speculate that AA,the La Ni?a event, and the negative NAO phase come together to constitute a preferred background condition for the supercold wave events in the winter of 2020/21. It should also be pointed out that the cold wave process is essentially a medium-range process, and AA, the La Ni?a event,and the NAO are phenomena of much longer time scales. At present, the way the collocation of AA, the La Ni?a event,and the NAO influenced the occurrence of the cold waves in a specific time interval remains unclear. This may constitute an interesting and important issue. We need future investigations to address this issue.
In addition, the Ural ridge was almost stably present during December 2020 and January 2021. How this stable Ural ridge is dynamically connected with the blocking pattern associated with the two supercold waves is still unknown. We will address this issue in future work.

Fig. 14. (a) The fields of Z500 (contours with an interval of 80 m) and its anomaly (shading; m) averaged during December 2020 and January 2021, (b) the Z500 anomaly fields (shading; m) composited for the 10 La Ni?a years(1984, 1988, 1995, 1998, 1999, 2007, 2010, 2011, 2017, and 2020, and (c) the mean December-January Z500 trend fields for the years 1979-2021 (contours with an interval of 2 m (10 yr)-1. In (b) and (c), dotting and shading indicate the region where the anomaly and trend exceed the 95% confidence level.
Acknowledgements. The authors convey their sincere thanks to the two anonymous reviewers and the editor for their sound criticisms and constructive comments and suggestions. This research was jointly supported by the National Key Research and Development Project (Grant No. 2018YFC1505601), the National Natural Science Foundation of China (Grant No. 41975072), and the Strategic Priority Research Program of Chinese Academy of Sciences (Grant No. XDA23090102).
 Advances in Atmospheric Sciences2022年4期
- Advances in Atmospheric Sciences的其它文章
- Preface to the Special Issue on Extreme Cold Events from East Asia to North America in Winter 2020/21※
- Influence of the NAO on Wintertime Surface Air Temperature over East Asia: Multidecadal Variability and Decadal Prediction※
- The 2020/21 Extremely Cold Winter in China Influenced by the Synergistic Effect of La Ni?a and Warm Arctic※
- Seasonal Cumulative Effect of Ural Blocking Episodes on the Frequent Cold events in China during the Early Winter of 2020/21※
- The Nature and Predictability of the East Asian Extreme Cold Events of 2020/21※
- Extreme Cold Events from East Asia to North America in Winter 2020/21: Comparisons, Causes, and Future Implications※