
Metabolomic and elemental profiling of blood serum in bladder cancer
2023-01-12 09:50:44KrzysztoOssolinskiTomszRumnVlriCopiBrinTriptLonroNoguirKtinNoguirArturKoozijAntAltmrAnnOssolinskTuszOssolinskiJonnNizio
Krzyszto Ossoli′nski ,Tomsz Rumn ,Vl′ri Copi′ ,Brin P.Tript ,Lonro B.Noguir ,Ktin O.P.C.Noguir ,Artur Ko?ozij ,Ant P?z-Altmr ,Ann Ossoli′nsk ,Tusz Ossoli′nski ,Jonn Nizio?,*
a Department of Urology,John Paul II Hospital,36-100,Kolbuszowa,Poland
b Rzesz′ow University of Technology,Faculty of Chemistry,35-959,Rzesz′ow,Poland
c The Department of Chemistry and Biochemistry,Montana State University,Bozeman,MT,59717,USA
d Department of Geology,Federal University of Ouro Preto,35400-000,Ouro Preto,Brazil
e Department of Biological Sciences,Federal University of Ouro Preto,35400-000,Ouro Preto,Brazil
f Doctoral School of Engineering and Technical Sciences at the Rzesz′ow University of Technology,35-959,Rzesz′ow,Poland
Keywords:Bladder cancer Biomarkers Human serum Metallomics Metabolomics
ABSTRACT Bladder cancer(BC)is one of the most frequently diagnosed types of urinary cancer.Despite advances in treatment methods,no specific biomarkers are currently in use.Targeted and untargeted profiling of metabolites and elements of human blood serum from 100 BC patients and the same number of normal controls(NCs),with external validation,was attempted using three analytical methods,i.e.,nuclear magnetic resonance,gold and silver-109 nanoparticle-based laser desorption/ionization mass spectrometry(LDI-MS),and inductively coupled plasma optical emission spectrometry(ICP-OES).All results were subjected to multivariate statistical analysis.Four potential serum biomarkers of BC,namely,isobutyrate,pyroglutamate,choline,and acetate,were quantified with proton nuclear magnetic resonance,which had excellent predictive ability as judged by the area under the curve(AUC)value of 0.999.Two elements,Li and Fe,were also found to distinguish between cancer and control samples,as judged from ICP-OES data and AUC of 0.807(in validation set).Twenty-five putatively identified compounds,mostly related to glycans and lipids,differentiated BC from NCs,as detected using LDI-MS.Five serum metabolites were found to discriminate between tumor grades and nine metabolites between tumor stages.The results from three different analytical platforms demonstrate that the identified distinct serum metabolites and metal elements have potential to be used for noninvasive detection,staging,and grading of BC.
1.Introduction
Bladder cancer(BC)is the tenth most commonly diagnosed cancer in the world with approximately 570,000 new cases diagnosed each year.The incidence rate per 100,000 person per year varies from 2.4 for women to 9.5 for men,and the mortality rate varies from 0.86 for women to 3.3 for men[1].Globally,urothelial carcinoma(UC)identified histopathologically constitutes more than 90% of all the cases of BC.In endemic regions such as Egypt with a high prevalence of schistosomiasis infection,squamous cell carcinoma(SCC)accounts for the majority of BC.However,control over theSchistosoma haematobiuminfection has led to a shift from SCC to UC being the most prevalent type of BC[2].The remaining 10% includes exposure to aromatic amines,hydrocarbons,dyes,some solvents,and coal tar[3].The most common symptoms of BC include macroscopic and microscopic hematuria.The mainstay for BC diagnosis includes cystoscopy and urine cytology,and may include ultrasound and computed tomography urography.Unfortunately,cystoscopy is considered as an invasive procedure and the sensitivity of urine cytology is low.Therefore,to reduce the number of procedures,urinary markers have been proposed to track BC recurrence[4,5].These urinary markers are associated with higher sensitivity,although at the expense of lower specificity,compared with the accuracy of urine cytology.However,these markers have not been incorporated into clinical guidelines regarding the diagnosis and surveillance of BC.Therefore,there is a significant need for noninvasive methods for the early detection of BC with high sensitivity,specificity,and low cost.
Instrumental analyses of small molecules in biofluids,such as blood,serum,and urine,are very powerful approaches to identify and characterize diagnostic metabolic biomarkers.Metabolite concentrations are reflective of the state of the organism and may be the indicators of disease states including cancer states[6].In the past decade,numerous sensitive analytical methods have been developed to allow the study of the metabolic state of living system.The most frequently used analytical platforms for study of metabolites are nuclear magnetic resonance(NMR)[7]and mass spectrometry(MS),the latter usually coupled with liquid chromatography(LC)or gas chromatography(GC)[8-10].
Metabolomic methods have been used for study of BC with the aim of identifying potential biomarkers in urine,serum,and tissues[11,12].The advantage of serum analysis is that it is much less susceptible to the dilution factor compared to urine[13].Although from an application point of view,serum analysis is the best option,the published data are very limited.A majority of reports of BC serum metabolomics describe MS results.The first such study[14]was focused on human serum profiling of BC with LC-MS,and the authors proposed five potential biomarkers.Later,Zhou et al.[15]applied GC-MS to perform plasma metabolomics analyses of 92 patients and 48 controls.The results identified increased levels of metabolites associated with the pentose phosphate pathway,fatty acid synthesis,and nucleotide metabolism in BC samples compared with the controls.The authors focused on three metabolites that could discriminate between the BC and control groups.In the following years,several publications appeared that focused on identifying potential biomarkers of BC using LC-MS[16-20]and GC-MS[21,22].To date,only three reports have reported metabolic differences in serum within BC with NMR.The first NMR serum metabolomics study of BC was published by Cao et al.[23]in 2012,and involved 67 BC patients and 25 healthy controls,and revealed a few metabolites for which concentrations differed significantly between these two groups.The metabolite changes were linked to impacted pathways of lipogenesis,aromatic amino acid metabolism,glycolysis,and the citrate cycle.In 2013,Bansal et al.[24]applied proton nuclear magnetic resonance(1H NMR)spectroscopy to compare 36 low-grade(LG)and 31 high-grade(HG)BC samples with those of 32 healthy control patients.The study identified six metabolites that could,together,serve as differentiating biomarkers of LG versus HG BC.This same research team recently reported the use of NMR to identify variations in the concentration of previously selected potential serum BC biomarkers in 55 preoperative and 53 post-operative BC patients,and 152 controls[25].
Various studies have established the connection between levels of metals,including trace-level metals and other trace elements,with an increased risk of developing cancer in humans[26].Toxic elements are known risk factors for genetic and epigenetic effects,which enhance the risk of developing different cancers[27].Inductively coupled plasma optical emission spectrometry(ICPOES)has emerged as one of the most frequently used methods for assessing the concentrations of metals in samples of biological origin[28]including BC serum[29].Studies recruited 27 BC patients,29 non-tumor patients with acute and chronic inflammation,and 30 healthy control patients,who were divided into validation and discovery cohorts.ICP-OES methods have also been used in the search for biomarkers of other cancers,including kidney cancer[30,31].
Herein,we report the results of the largest investigation to date,comprising the targeted and non-targeted,elemental-and metabolomics-based profiling of 200 serum samples obtained from 100 patients with BC and 100 healthy controls.This study has enabled the elucidation of the detailed metabolic and elemental changes resulting from BC,with a specific focus on the stage and grade of BC.The analytical platforms used were high-resolution1H NMR,ICP-OES,and high-resolution laser desorption/ionization MS(LDI-MS),and the associated data were subjected to robust validation by multivariate and univariate statistical analyses.
2.Materials and methods
2.1.Materials and instruments
High-resolution LDI-MSI experiments were performed on Autoflex Speed time-of-flight mass spectrometer(Bruker,Bremen,Germany)with a declared resolution of>20,000 form/zvalues of>1,000 in positive-ion reflectron mode.The samples were placed on a stainless-steel target with automatic pipette and then covered by nebulization with a silver-109 nanoparticle(109AgNP)suspension generated by pulsed fiber laser(PFL)two-dimensional(2D)galvoscanner(GS)laser synthesis in solution/suspension(LASiS)and nebulization of109AgNPs(109AgNPs LDI-MS)as described in our recent publication[32].Gold nanoparticle(AuNP)-based LDIMS(AuNPs LDI-MS)was prepared analogically as described above with the exception for PFL-2D GS LASiS material/substrate,which was gold foil of 1 mm thickness.All solvents were of minimum LCMS grade and were acquired from Sigma Aldrich(St.Louis,MO,USA).Deuterium oxide(D2O)and 4,4-dimethyl-4-silapentane-1-sulfonic acid were purchased from Sigma Inc.(Boston,MA,USA).Nitric acid EMSURE ISO-grade 65%and hydrogen peroxide EMSURE ACS ISO-grade 30% were purchased from Merck KGaA(Darmstadt,Germany).
2.2.Collection of human serum samples
Serum samples were collected at John Paul II Hospital(Kolbuszowa,Poland).Control serum samples were collected from healthy volunteers after a medical examination focused on the detection of urinary cancers.Both types of serum samples from the original NMR,MS,and ICP-OES datasets were randomly divided every time into two groups,a training set,comprising 80%of all samples,and a validation set,corresponding to 20%of all samples.All the patients underwent transurethral resection of bladder tumor following detailed clinical questioning and laboratory testing.The local bioethics committee approved the study(Permission No.:2018/04/10).Just over half of the patients(n=54)had LG BC and papillary urothelial neoplasm of low malignant potential(PUNLMP)(n=3),whereas the remaining patient group exhibited HG disease(n=41).In two cases,both HG and LG neoplasms were detected.Most of these patients(n=69)displayed noninvasive papillary carcinomas(pathologic stage Ta,pTa)stage disease,19 had submucosal invasive tumors(pathologic stage T1(pT1))stage,and 12 patients had muscle invasive BC(pathologic stage T2(pT2)).The average age of patients diagnosed with BC and in the NC group was 74±10 and 64±12 years,respectively.The clinical characteristics of the patients are presented in Table S1.A 2.6 mL of blood sample was drawn from each participant and centrifuged(3,000g,10 min,room temperature),then separated and kept at-60°C.
2.3.Preparation of serum metabolite extracts for 1H NMR metabolomics
Medium-to-high polarity metabolites were extracted from serum samples as stated in our recent publication[33]and detailed in Section S1 in the Supplementary data.
2.4.Preparation of serum samples for LDI-MS studies
Serum samples were thawed at room temperature and diluted 500 times with methanol.Then,0.3μL of serum sample was placed directly on target plates(109Ag and Au PFL-2D GS LASiS[32]).After the solvent was evaporated in air,the plates with the samples were measured with Autoflex Speed apparatus.
2.5.Data processing and spectral acquisition
NMR and MS spectral acquisition and processing are shown in the Supplementary data(Sections S2-S4).
2.6.ICP-OES analysis
Determination of the concentrations of Ca,Fe,K,Na,Mg,as well as minor elements(Mn,P,and S)and trace elements(Cu and Zn)in serum,was performed for 116 samples(65 BC and 51 NC)as stated in our recent publication[31]and detailed in Section S5 in the Supplementary data and Table S2.
2.7.Multivariate statistical analysis
All metabolite datasets were analyzed using the MetaboAnalyst 5.0[34].The statistical analysis approach presented in this publication is similar to one we previously presented[31]and another unrelated study[35];details are presented in the Supplementary data(Section S6).
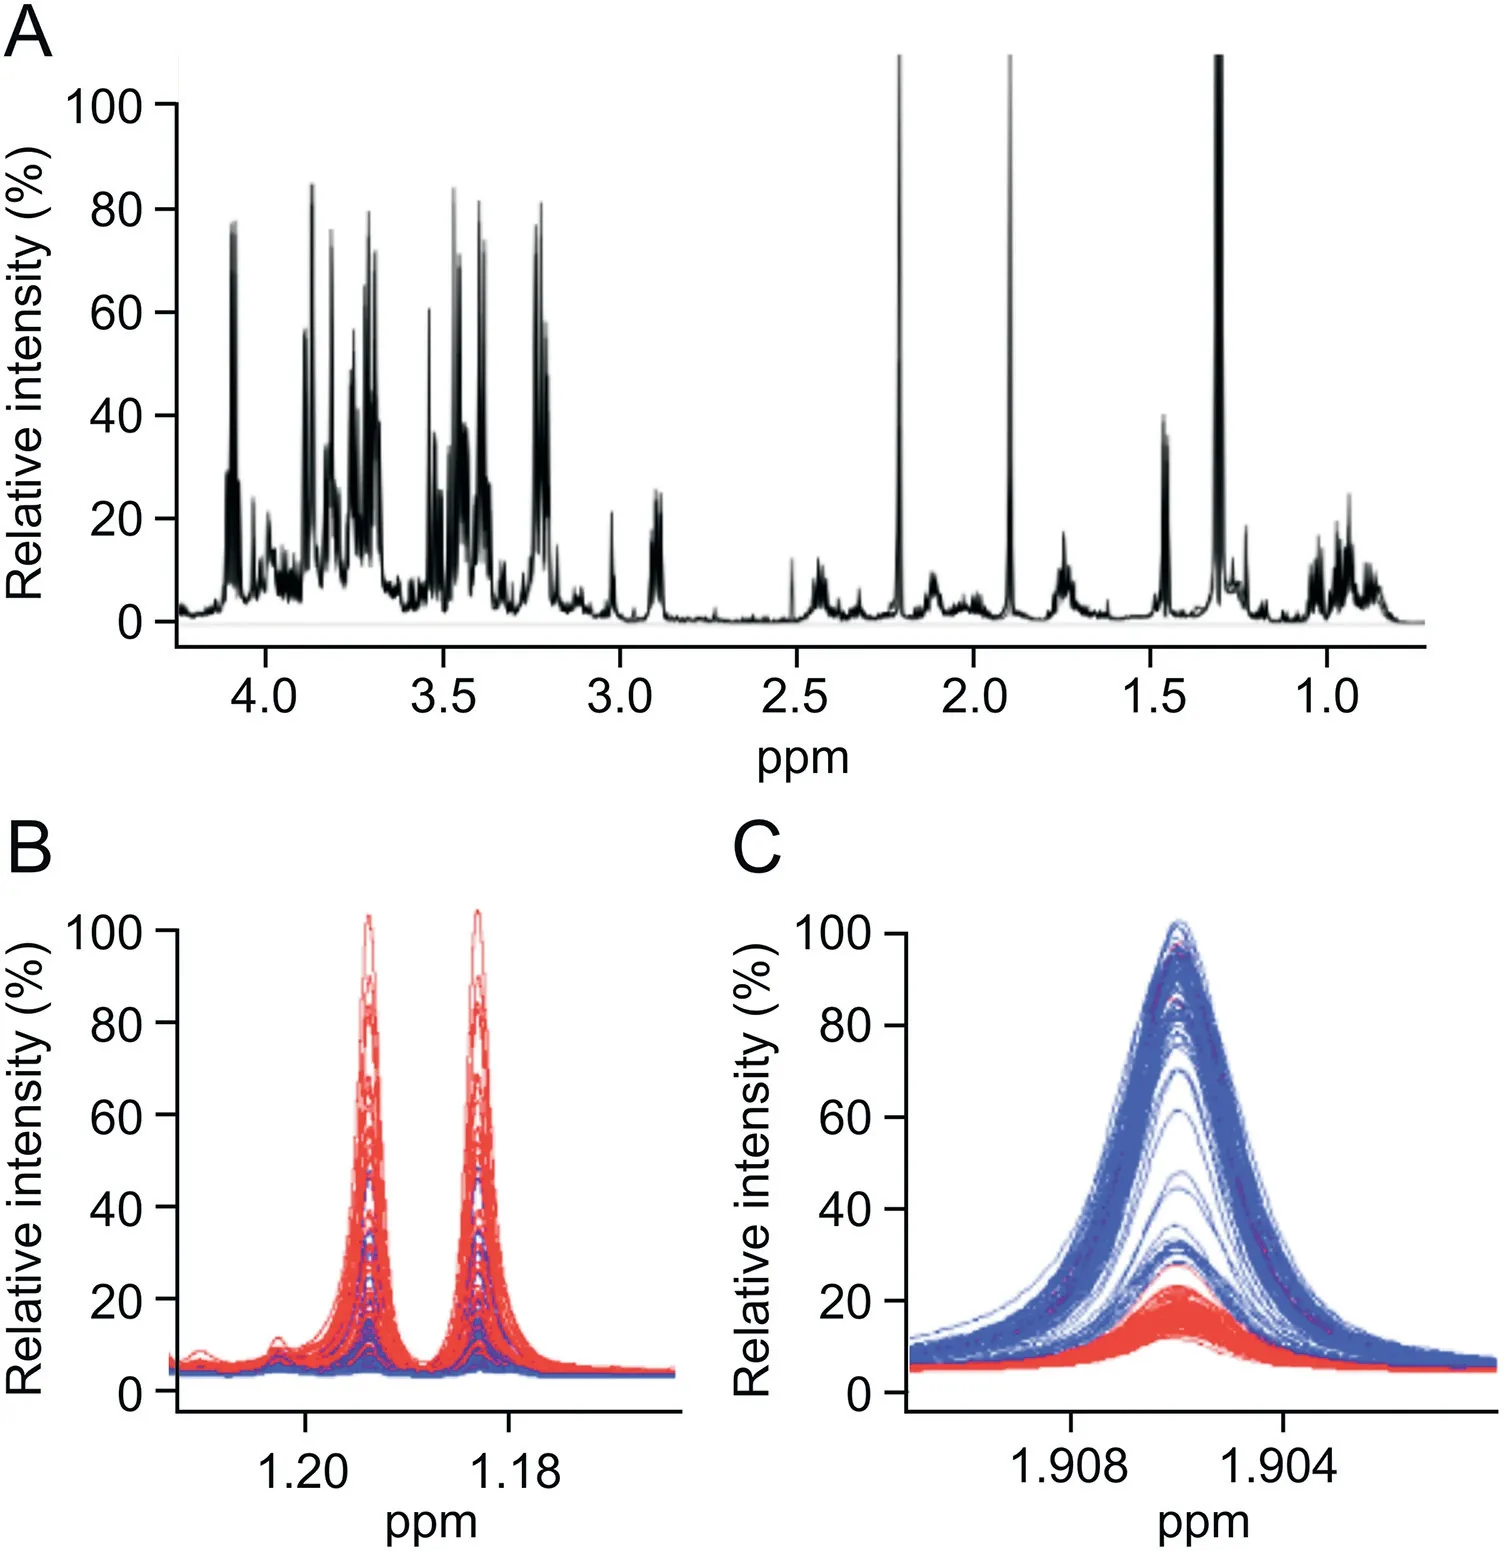
Fig.1.(A)Characteristic proton nuclear magnetic resonance(1H NMR)spectrum fragment(0.5-4.2 ppm)of a protein-free metabolite extract mixture obtained from serum sample from a patient with BC,recorded on a 600 MHz(14 T)solution NMR spectrometer.Expanded NMR spectral regions,corresponding to 1H chemical shift ranges of(B)1.16-1.21 ppm for 3-hydroxybutyrate and(C)1.900-1.911 ppm for acetate,with a spectral overlay of 80 serum metabolic profiles obtained from healthy control patients depicted in blue(blue spectral traces)and BC patients in red(red spectral traces).
3.Results
In this work,we studied the metabolic profiles of BC in an effort to propose serum-specific metabolic and/or elemental markers for the specific detection of BC.Two hundred(100 BC and 100 normal control(NC))1H NMR spectra were recorded of metabolite extracts from patients and healthy control serum samples.Four hundred LDI mass spectra were recorded with the use of109Ag and Au PFL-2D GS LASiS targets.Additionally,116 ICP-OES spectra of samples from 65 patients with BC and 51 NCs were studied.
3.1.Differences between BC and control serum by 1H NMR
Two hundred extracts from sera(100 cancer and 100 control)were analyzed with1H NMR spectroscopy.Overall,39 compounds were identified in each serum sample following standard protocols[36,37].An overlay of control and cancer NMR spectra,presented as blue and red traces,respectively,in Figs.1B and C,shows a relatively high degree of similarity in the raw NMR data.These spectral regions depict NMR signals observed from 3-hydroxybutyrate and acetate metabolites,respectively.The intensity-normalized spectral overlays shown in Figs.1B and C clearly indicate that 3-hydroxybutyrate levels(Fig.1B)are higher and acetate levels(Fig.1C)are lower in the serum profiles of patients with BC(red)compared with healthy controls(blue).Detailed analysis of the spectra indicated significant differences in metabolite levels between serum samples from patients with BC and healthy controls.
Metabolite concentration datasets obtained by NMR metabolomics were randomly divided into two subsets:a training dataset to train the model(n=80 BC andn=80 NCs),and a validation dataset to assess the validity and robustness of the trained model(n=20 BC andn=20 NCs).Metabolite concentrations from both datasets were subjected to statistical analyses to assess differences in metabolite levels.The results of these analyses are summarized in Tables S3 and S4.The 2D principal components analysis(PCA)score plots of both subsets indicated good separation between the cancer and the controls(Fig.2A).In the validation set,separation between cancer and control serum samples was also observed along principal components 1 and 2(Fig.2B).The three-dimensional(3D)PCA plots for training and validation sets are provided in Figs.S1A and B.
A supervised multivariate analysis of the training set with the aid of orthogonal partial least-squares discriminant analysis(OPLS-DA)indicated the strong separation of the BC and NC groups(Fig.2C).Two thousand permutation tests were conducted to evaluate the statistical robustness of the OPLS-DA model(Figs.S2A and B).Good discrimination was observed between the two groups(Q2=0.880,R2Y=0.914,P<0.0005(0/2000)),revealing significant differences in the metabolic profiles of cancer versus control serum samples.Group separations were observed with OPLS-DA in the validation set(Fig.2D)and were confirmed by the good results of the permutation test(Q2=0.780,R2Y=0.932,P<0.0005(0/2000))(Figs.S2C and D).Potential serum BC biomarkers were selected on the basis of the S-plot resulting from the OPLS-DA model.Variables with|P(corr)|>0.5 were considered significant.Four variables(acetate,propionate,pyroglutamate,and choline)were positively correlated with the group separation,as determined by aP(corr)[1]score of>0.5,while one metabolite(isobutyrate)negatively correlated with the group separation,as assessed by-P(corr)[1]<-0.5(Fig.S1C).The S-plot of the OPLS-DA model in the validation set confirmed almost all of the selected metabolites(except for propionate)as the most significant for the differentiation of the BC and NC groups(Fig.S1D).Finally,four metabolites were identified as significant discriminators:acetate,pyroglutamate,and choline,which all exhibited higher concentrations in the sera of NCs,and isobutyrate,which was significantly elevated in the sera of BC patients.TheP-value of each variable was calculated using independentt-tests and only variables withP-values and false discovery rate<0.05 were considered significant.Metabolite concentration information for a set of 39 significant metabolites is presented in Tables S3 and S4.Next,univariate receiver operating characteristic(ROC)curve analysis was separately performed on both the training and validation sets to evaluate the diagnostic ability of the models.The quality of the ranking represents the area under the curve(AUC)above 0.7.The results indicated that in the serum samples,all four previously selected metabolites(acetate,choline,pyroglutamate,and isobutyrate)exhibited very high AUC(above 0.82).The best ROC analyses with the highest significance were obtained for isobutyrate(AUC=0.953,specificity=0.9,and sensitivity=0.9),followed by pyroglutamate(AUC=0.894,specificity=0.8,and sensitivity=0.9),propionate(AUC=0.859,specificity=1.0,and sensitivity=0.7),choline(AUC=0.828,specificity=0.8,and sensitivity=0.8),and acetate(AUC=0.824,specificity=0.8,and sensitivity=1.0).The range of concentrations compared to all these metabolites in the serum samples of cancer patients compared to NCs is reported in Fig.S3.The most significant results from our statistical analyses of compounds identified as potential biomarkers of BC are presented in Table 1.
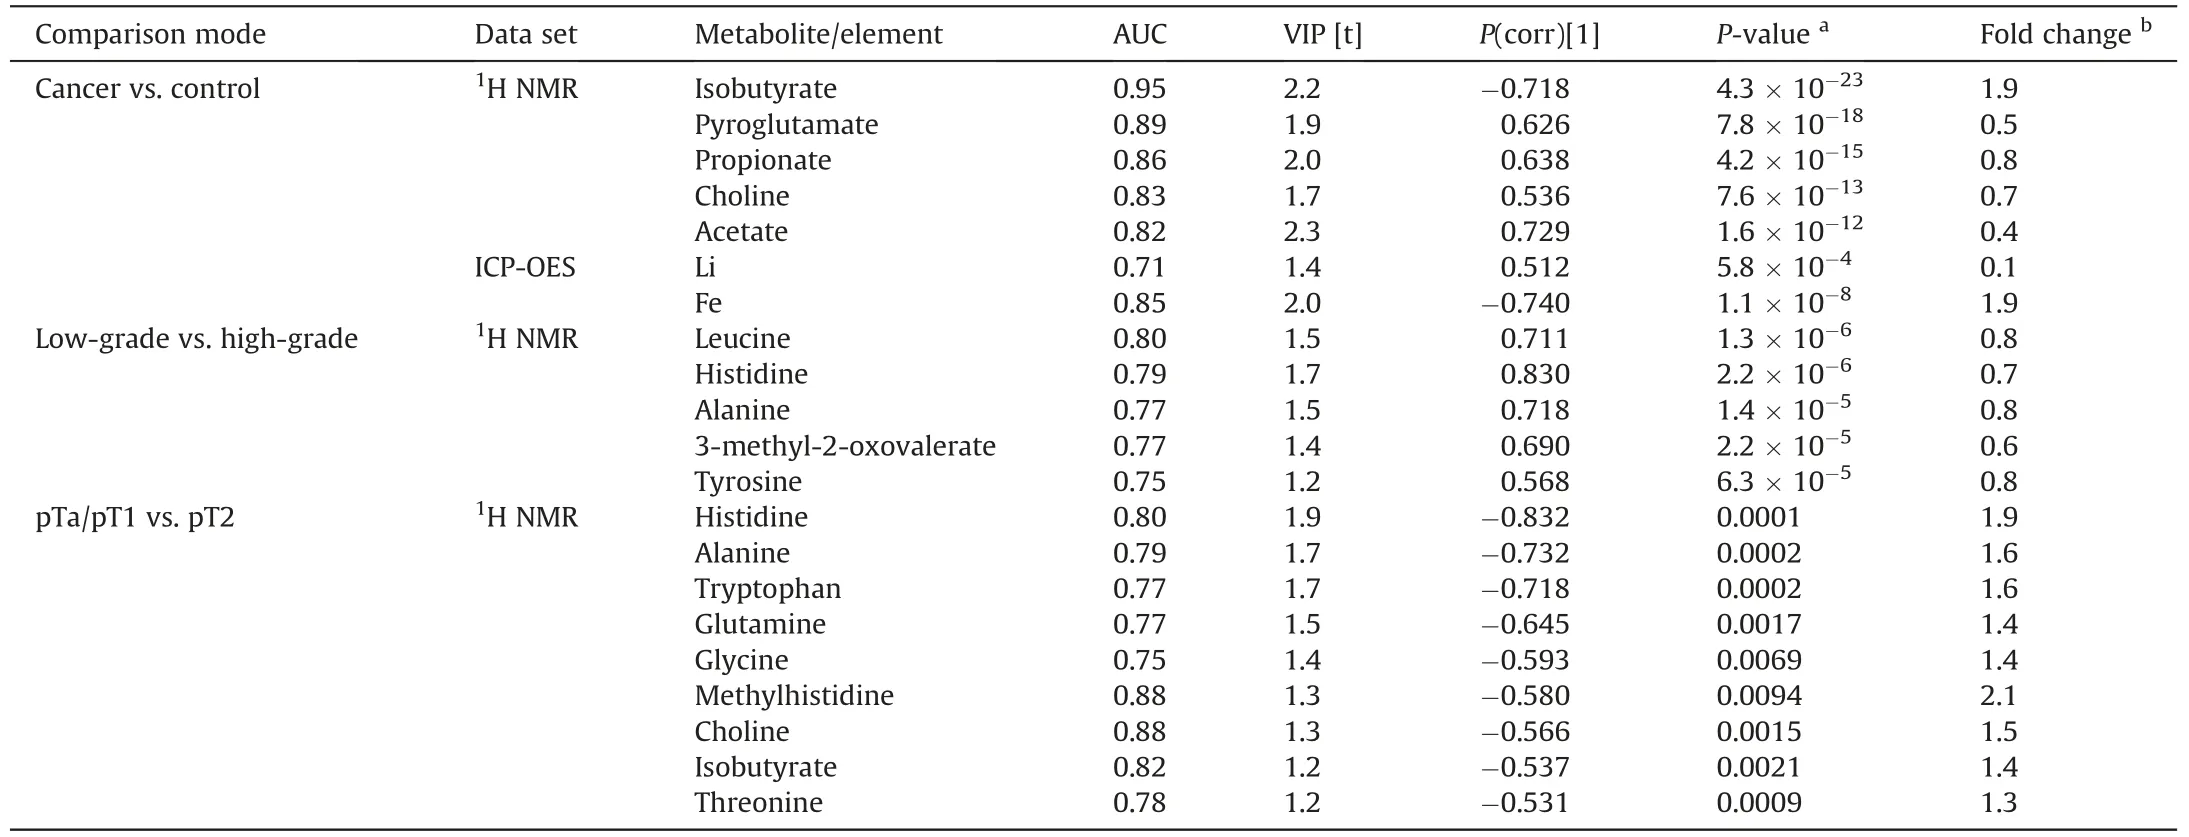
Table 1 Summary of targeted quantitative analysis of potential biomarkers of BC from proton nuclear magnetic resonance(1H NMR)and inductively coupled plasma optical emission spectrometry(ICP-OES)spectral analyses of serum samples(P-value<0.05;|P(corr)[1]|>0.5;area under the curve(AUC)>0.75).
The classification ROC model was built with the use of MetaboAnalyst 5.0 online service and was based on a random forest algorithm.As shown in Figs.2E and F,the combination of levels of these metabolites was a better discriminator(AUC>0.999)than each metabolite separately in both data sets.An excellent discriminating classification was found for four metabolites,i.e.,acetate,propionate,choline,and isobutyrate,with an AUC of 0.999.For this model,the confidence interval ranged from 0.994 to 1.000(Fig.2E).The validation of the ROC model is shown in Fig.S4 and a permutation test with 1000 permutations yielded aP-value<0.001,supporting the validity of the ROC analysis.The average of the predicted class probabilities of each sample and the average accuracy of the ROC curve demonstrated good classification discriminatory power,with most of the samples classified accurately in their respective groups.The results suggested that four specific metabolites,namely,acetate,propionate,choline,and isobutyrate,could significantly increase diagnostic potential and serve as useful discriminators of cancerous versus healthy phenotypes in patients diagnosed with BC.
3.2.Differences between grades of BC with 1H NMR
To determine whether metabolomics analysis of serum samples by1H NMR could help discriminate between different grades of BCs,PCA and OPLS-DA analyses were performed on the entire metabolite dataset.The analysis of BC included 95 serum samples from patients with a uniquely defined grade of cancer;three samples from patients with PUNLMP and two samples from patients with tumor only partially classified as HG were excluded.Finally,41 serum extracts from patients with HG cancer and 54 samples from patients with LG cancer were used for analysis.The 2D and 3D PCA score plots,which revealed relatively low discrimination between LG and HG cases with a few outliers,are shown in Figs.S5A and B.Likewise,the OPLS-DA score plots highlighted little separation between the HG and LG cancer groups(Fig.S5C),yet yielded an acceptableP-value(P=0.002).The statistical significance of the model was examined using Q2(0.192)and permutation tests(n=2000),which yielded aP-value lower than 0.05.Detailed assessments of the quality of the OPLS-DA model are shown in Fig.S6.The S-plot analysis of the OPLS-DA model indicated that 15 metabolites were significant contributors to the small separation observed between LG vs.HG samples in the 2D and 3D OPLS-DA score plot(Fig.S7).Of these 15 metabolites,leucine,histidine,alanine,3-methyl-2-oxovalerate,tyrosine,phenylalanine,choline,tryptophan,hypoxanthine,asparagine,valine,proline,threonine,2-hydroxybutyrate,and glutamine were found to be positively correlated with group separation with aP(corr)[1]score>0.5.These biomarker candidates were subjected to at-test to assess the significance of altered levels in LG versus HG.All 15 metabolites were found to exhibit statistically significant differences in concentration(P<0.05;q<0.05 and|P(corr)|>0.5),suggesting that examining the different levels of these metabolites in human sera may be an effective way to identify LG and discriminate LG from HG in patients with BC.AUC values for five of the 15 metabolites were found to be greater than 0.74(Fig.S8).Additionally,ROC curve analysis of these five metabolites(i.e.,leucine,histidine,alanine,3-methyl-2-oxovalerate,and tyrosine)only yielded a satisfactory AUC value of 0.775(Fig.S9A),and a valid permutation test with aP-value<0.001.The average accuracy based on 100 cross validations amounted to a value of 0.693(Fig.S9D).These analyses support that leucine,histidine,alanine,3-methyl-2-oxovalerate,and tyrosine may be good indicators discriminating bladder tumor grades.
3.3.Differences between stages of BC identified by 1H NMR
Analysis of tumor stages was also performed for the entire1H NMR dataset of serum metabolite extracts.Metabolite profiling analysis included 88 serum samples from patients with non-muscle invasive BC(pTa/pT1)and 12 serum samples from patients with muscle invasive BC(pT2).Preliminary PCA analysis was performed using the entire dataset of metabolite concentrations.PCA and OPLS-DA score plots indicated relatively low separation between the pTa/pT1 and pT2 stage of BC,with a few outliers that were removed prior to the further OPLS-DA analysis.Figs.S5D-F contain the 2D,3D-PCA,and OPLS-DA scores plots of the two groups that were classified by BC grades.The quality factors for the OPLS-DA model included Q2of 0.141 and R2Y of 0.347 and permutation testP-value lower than 0.05(Figs.S6C and D).The S-plot analysis of the OPLS-DA model revealed the 12 serum metabolites that appeared to be most relevant for sample differentiation between pTa/pT1 and pT2 cancer grade:histidine,alanine,tryptophan,glutamine,glycine,methylhistidine,choline,isobutyrate,threonine,phenylalanine,leucine,and 3-methyl-2-oxovalerate(Fig.S7C).All those compounds corresponded to|P(corr)|>0.05 and variable influence on projection(VIP)>1.2 and were found to be at a higher concentration in the sera of patients with noninvasive pTa/pT1 BC stage(Fig.S7D).However,the ROC analysis narrowed this group down to nine metabolites with an AUC greater than 0.75:histidine,alanine,tryptophan,glutamine,glycine,methylhistidine,choline,isobutyrate,and threonine.The ROC curve analysis of nine potential biomarkers is shown in Fig.S10.For those nine selected metabolites,a ROC curve analysis was performed to assess the performance of this model in distinguishing between pTa/pT1 and pT2 BC stages,and yielded an AUC value of 0.844,which indicated the good discriminatory ability of the model(Fig.S9E).The permutation test based on the measured area under the ROC curve(AUC)for that model yielded aP-value<0.01(Fig.S9F).The average of the predicted class probabilities of each sample across 100 cross validations and the associated permutation tests are shown in Figs.S9G and H.Analysis of the changes in metabolite concentration for a given stage of BC,i.e.,pTa/pT1 versus pT2,reveals higher levels of histidine,alanine,tryptophan,glutamine,glycine,methylhistidine,choline,isobutyrate,and threonine in the serum samples of BC patients with a pTa/pT1 stage of tumor compared to the sera of BC patients with a pT2 stage tumor.The comparison of the three groups of cancer stage(pT1 vs.pTa vs.pT2)did not reveal any statistically significant differences.
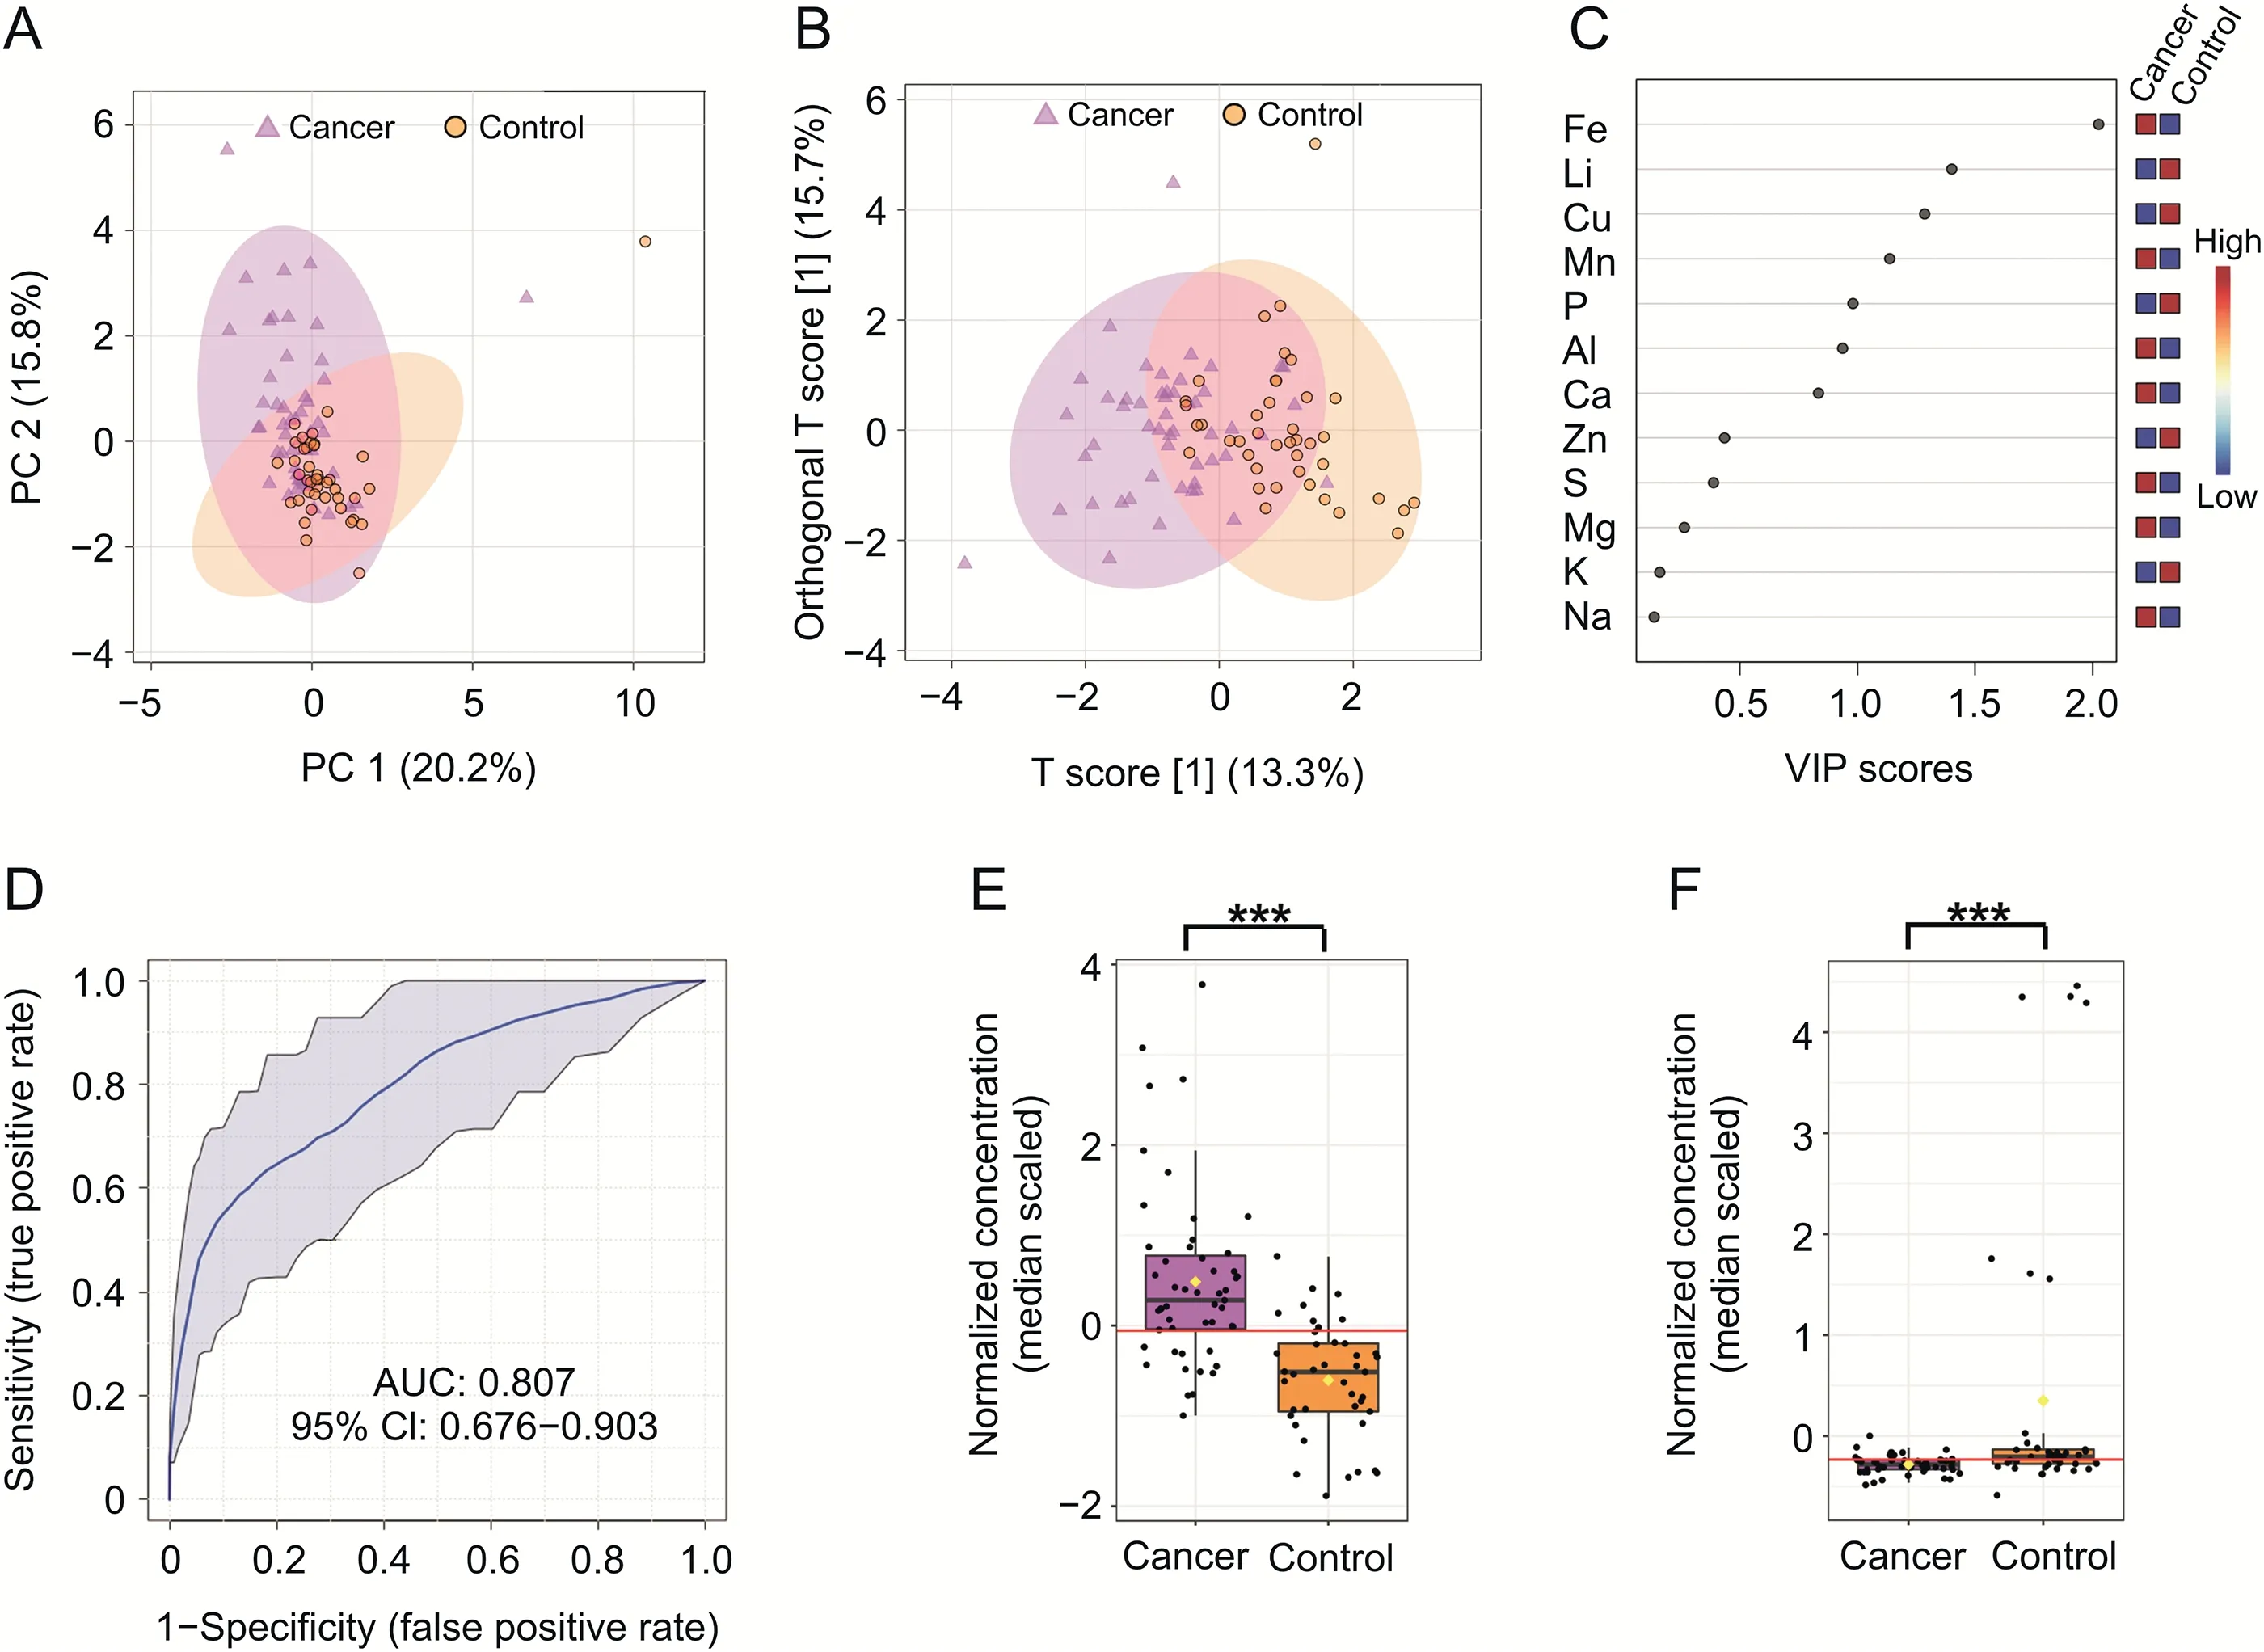
Fig.3.Statistical analysis of serum metabolite profiles created from inductively coupled plasma optical emission spectrometry(ICP-OES)data.Two-dimensional(A)principal component analysis and(B)orthogonal partial least-squares discriminant analysis(OPLS-DA)score plots of the tumor(violet)and control(orange)serum samples for ICP-OES data in the training set.(C)The potential discriminatory elements identified from the variable importance in projection(VIP)scores derived from the OPLS-DA model in the training set.(D)The receiving operator characteristic(ROC)curves of the combination of two differential elements,Fe and Li.(E and F)The box-and-whisker plots of Fe and Li level values observed in the control and BC serum samples.***P<0.001.PC:principal component;AUC:area under the curve;CI:confidence interval.
3.4.Elemental profile of serum in BC determined by ICP-OES
The concentrations of chemical elements obtained from ICP-OES analysis of 116 extracts of serum samples(65 BC and 51 NCs)were subjected to statistical data analysis.A total of 12 elements were identified and quantified.The mean concentration of each of these elements is summarized in Tables S5 and S6.Prior to statistical analysis,the data were randomly divided into two subsets:a training set(control,n=42 and cancer,n=52)and a validation set(control,n=10 and cancer,n=13).As shown in Fig.3A,the PCA score plot revealed a trend for separation between the two groups in the training set.Results from the OPLS-DA analysis,shown in Fig.3B,provided a slightly clearer separation(compared to the PCA analysis)between cancer and controls,and the validation parameters for the model were R2X and Q2values of 0.334 and 0.476,respectively(Fig.S11).The analysis of the VIP scores of the OPLS-DA model in the training set is presented at Fig.3C.
Three elements(Cu,Fe,and Li)could be used to distinguish between the two groups of study participants;however,only two of them(Cu and Fe)were confirmed to be the most significant discriminators following model validation assessments(Fig.S12).The loading S-plot of OPLS-DA of the training set revealed that Fe was negatively correlated with group separation,with-P(corr)[1]<-0.5,and indicated that a significantly higher level of this element was found in the serum of patients diagnosed with BC compared with the control group.Subsequently,Li was found to be positively correlated with the group separation,withP(corr)[1]>0.5,indicating that it was found in higher levels in the serum samples of NCs.ROC analysis revealed that Fe was the most significant,with an associated AUC value of 0.850,sensitivity of 0.8,and specificity of 0.8,whereas for Li,the AUC value was 0.710,sensitivity was 0.8,and specificity was 0.6.In addition,ROC curve analysis assessing the performance of the ICPOES model in distinguishing between cancer and control samples was performed using only two selected elements(Fe and Li).This analysis yielded an AUC value of 0.807 for the training set,which indicated good discriminatory power to separate the two(BC and NC)groups(Fig.3D).The permutation test yielded a significantP-value of<0.001.The average accuracy amounted to a value of 0.728(Fig.S13D).
These statistical analyses demonstrated that differential levels of Fe and Li are potentially good indicators of BC in human serum.The results from the statistical analyses of these two selected elements are summarized in Table 1.
3.5.Untargeted metabolic profiling by PFL-2D GS LASiS AuNPs and 109AgNPs LDI-MS
In total,335 and 650 features were detected in the serum samples of 200 participants analyzed with PFL-2D GS LASiS AuNPs and109AgNPs LDI-MS.Statistical analysis was performed using data randomly divided into two subsets:a training set(n=80 BC andn=80 NCs)and a validation dataset(n=20 BC andn=20 NCs).
2D-PCA and OPLS-DA score plots of mass spectral features created for PFL-2D GS LASiS109AgNPs LDI-MS data revealed clear discrimination between cancer and control serum samples in both subsets(Fig.S14).The analysis of both subsets(training and validation set)indicated 216 common features with|p[1]|and|P(corr)|above 0.5,of which 96m/zvalues were more abundant in serum from patients with BC compared with the control group,and 119 features displayed the opposite trend.The validation of the OPLSDA model using 2000 permutations resulted in R2Y and Q2values of 0.986(P<0.0005)and 0.982(P<0.0005)(Fig.S15).All 11 previously selectedm/zmass spectral features were found to exhibit AUC values of>0.73.Figs.S16A and D indicate the combination ofm/zvalues,which is a better discriminator(AUC>99%in the training and validation set)than independent evaluation of each feature,which reinforces the improved capacity of biomarker patterns to accurately distinguish between the BC and NC groups.In the next step,putative identification of mass spectral features was performed by searching various metabolite databases,i.e.,Human Metabolome Database[38],MetaCyc Metabolic Pathway Database[39],LIPID MAPS?Lipidomics Gateway[40],and Metlin[41].Seventeen mass spectral features were putatively identified as naturally occurring metabolites in the human body.Important mass spectral features and annotated metabolite IDs resulting from the PFL-2D GS LASiS109AgNPs LDI-MS analyses are reported in Table S7.All statistical data with mean feature abundance for control versus cancer serum samples based on PFL-2D GS LASiS109AgNPs LDI-MS in the training and validation datasets are presented in Tables S8 and S9.
The acquired data from untargeted PFL-2D GS LASiS AuNPs LDIMS analysis were also analyzed using PCA and OPLS-DA to identify novel metabolites.In both cases,score plots showed clear separation in both subsets,suggesting that the PFL-2D GS LASiS AuNPs LDI-MS-based serum metabolomics model could be used to identify BC(Fig.S17).The S-plots derived from the OPLS-DA model using the training set(R2Y=0.962,Q2=0.955)and the validation set(R2Y=0.982,Q2=0.964)generated a list of mass spectral features(m/z)of interest that were found to be important for group discrimination(Fig.S18).All relevant mass spectral features are reported in Tables S10 and S11.The analysis of both subsets(training and validation sets)identified 172 common features with|p[1]|and|P(corr)|above 0.5,of which 44m/zvalues were more abundant in the sera of BC patients compared to the control group,and 128 features exhibited the opposite trend.This analysis was followed by a multivariate ROC analysis.As shown in Fig.S19,the combination of mass spectral features in both subsets was found to be a more powerful discriminator between control and BC serum samples(AUC>99%),compared with that of any individual mass spectral feature.
The results presented above suggest that selected mass spectral features can significantly increase the performance of the diagnostic model and can be used to distinguish cancer serum samples from controls.Putative identifications of selected features allowed for the identification of eight compounds that are often present in the human body(Table S7).
3.6.Pathway analysis of potential cancer biomarkers
Metabolic pathway impact analysis suggested that 14 out of 25 metabolites identified in the NMR and LDI-MS analyses were relevant to human metabolism.Seven pathways(glycine,serine and threonine metabolism,glycerophospholipid metabolism,propanoate metabolism,glutathione metabolism,pyruvate metabolism,glyoxylate and dicarboxylate metabolism,and glycolysis/gluconeogenesis)were significantly impacted in BC compared with the controls.The results from this pathway impact analysis are shown in Fig.4A and Table S12.The bubble area(Fig.4A)reveals the degree of impact on the pathway and the color represents the significance(highest in red and lowest in white).Quantitative enrichment analysis found 10 additional pathways relevant to BC,i.e.,amino sugar metabolism,aspartate metabolism,betaine metabolism,ethanol degradation,fatty acid biosynthesis,methionine metabolism,phosphatidylcholine biosynthesis,phosphatidylethanolamine biosynthesis,phospholipid biosynthesis,and vitamin K(K1 and K2)metabolism(Fig.4B and Table S13).
4.Discussion
In this study,NMR,ICP-OES,and LDI-MS with both109AgNPs and AuNPs-based targets were employed to evaluate changes in serum metabolite and element levels between patients with BC and controls.BC is characterized by several metabolic changes that promote cancer cell proliferation and thus tumor growth[42].These changes in metabolism provide an essential source of energy for intracellular metabolism and building blocks for rapidly dividing tumor cells.The Warburg effect,a hallmark of cancer cell metabolic activity,involves aerobic glycolysis in the presence of an aerobic environment and fully functioning mitochondria,and relies on increased glucose uptake and the conversion of glucose to lactate.This type of energy gain for cancer cells is much less energy efficient than mitochondrial respiration(2 adenosine triphosphate(ATP)vs.36 ATP respectively)[43].However,studies have shown that the rate of glucose-to-lactate conversion is 10-100 faster compared with that of the complete mitochondrial oxidation of glucose[44].Moreover,the decoupling of glycolysis from oxidative phosphorylation offers a biosynthetic advantage for cancer cells by enabling the increased production of diverse biosynthetic precursors[45].
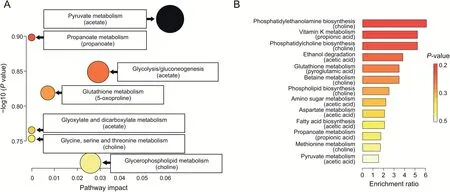
Fig.4.Pathway topology analysis of statistically significant metabolites in bladder cancer(BC)that were found in the nuclear magnetic resonance and mass spectrometry(MS)datasets.(A)Kyoto Encyclopedia of Genes and Genomes pathway analysis.(B)Quantitative enrichment analysis based on Small Molecule Pathway Database.
In this study,we investigated the serum metabolic profiles among LG BC,HG BC,non-muscle invasive bladder cancer(pTa/pT1),muscle invasive BC(MIBC,pT2),and healthy subjects.The OPLS-DA modeling of the1H NMR metabolomics data revealed a clear separation between the BC and control serum sample groups.Metabolites with the highest AUC values(>0.82)included isobutyrate,pyroglutamate,propionate,choline,and acetate.The differences in the concentration of pyroglutamate,acetate,propionate,and choline were statistically significantly and higher in the sera of healthy individuals,whereas isobutyrate concentrations were much higher in the sera of BC patients.
Negative charges of short-chain fatty acids are considered to be crucial metabolic and immune cell regulators[46].Acetate plays a key role in the metabolism of acetyl coenzyme A(acetyl-CoA),bioenergetics,cell proliferation,and regulation[47].In cells,acetate is mainly used to generate acetyl-CoA through an ATP-dependent reaction by acetyl-CoA synthetase.Tumor cells use acetate in the form of acetyl-CoA,primarily for fuel or as a carbon source for lipid synthesis[48].Acetyl-CoA synthetase 2(ACSS2),one of the enzymes capable of using acetate as a substrate,contributes to cancer cell growth and is highly upregulated in multiple cancer types[49].Based on these studies,we surmise that the lower levels of acetate in the serum samples of patients with BC may be due to its significant uptake and utilization by ACSS2 in cancer cells.Recently,Lee et al.[50]reported that acetate in urine,along with four urine metabolites,may contribute to the discrimination of different urological cancers.Their research showed that acetate levels in urine were slightly elevated in kidney cancer patients compared to patients with bladder and prostate cancer.Unfortunately,these results were not directly compared to those of a healthy control group[50].
Other metabolites present at lower concentration in the sera of BC cancer patients compared with healthy controls include choline and propionate.Studies have shown that the consumption of choline may protect against cancer[51].Propionate,a metabolite produced by the intestinal microbiota,reduces the proliferation of cancer cells in the liver and the lungs[52,53].Acetate and propionate are the end-products of the indigestible carbohydrate fermentation in the human colon,and are distributed systemically via blood circulation.These compounds have been shown to exhibit anti-inflammatory properties in immune cells,inhibit colon cancer cell growth,and induce cancer cell death by apoptosis[53,54].The levels of serum propionate are also associated with circulating immune cells in patients with multiple sclerosis,and lower serum propionate levels were found in patients with multiple sclerosis compared with the healthy controls[55].In our study,the increased absorption of propionate by cancer cells is reflected by the lower propionate concentration in the sera of the patients with BC.However,no study to date has focused on the role of propionate in the progression of BC.
Choline is a water-soluble quaternary amine that is often grouped with vitamin B owing to its chemical similarities,and is a key nutrient for humans.This compound has various key functions in the human body,especially with respect to neurochemical processes[56].Choline is involved in phospholipid production and triglyceride metabolism,and is therefore necessary for the proper structure and function of cell membranes.In this study,patients with BC had lower serum levels of choline compared with the controls,which could be a consequence of increased choline absorption by cancer cells.Our results are consistent with those of other studies that have shown that cancer cells often increase the synthesis of fatty acids;in turn,these can act as substrates for phosphatidylcholine synthesis,which is increased in tumor cells[57,58].Furthermore,the increase in serum choline levels in cancer patients is consistent with our previous study results,where choline levels were found to be decreased in the sera of patients with renal cell carcinoma compared with controls[59].The opposite situation was observed in urine,where urine choline levels were increased in patients with BC[60,61].
Ohara et al.[62]revealed that isobutyrate exerted an anticancer effect by suppressing the growth/metabolic networks supporting colorectal cancer.Previously,Wang et al.[63]showed that the levels of isobutyrate were lower in fecal samples of patients with colorectal cancer compared to those of healthy control individuals.To date,there is no report that isobutyrate is a potential biomarker of BC.In our research,isobutyrate levels were found to be significantly altered,as shown by the cancer-to-control mean concentration(fold change)ratio of 1.9.
Pyroglutamate is a cyclized derivative of L-glutamate and is related to the gamma-glutamyl cycle,which is the main pathway for glutathione synthesis[64].Glutathione is a major antioxidant produced in the human body,the levels of which can drop significantly as a result of oxidative stress or chemical exposure.In the case of low glutathione levels,the level of pyroglutamate from which it is reconstituted is also decreased[65].Pyroglutamate was found to be a promising biomarker for the diagnosis of nonalcoholic liver disease[64].Several studies have observed elevated levels of pyroglutamate in the biofluids of patients with several genetic disorders and an acetaminophen-induced metabolic disorder[66].Most of the research devoted to urinary or serum metabolomics of BC has suggested a higher level of pyroglutamate in patients with BC compared with healthy controls[22,67].However,both of these cited publications are based on GC-MS results with derivatization,which can be considered inferior in terms of quantitation compared to the measurement of unmodified extracts with NMR.
Fe is a crucial trace element in which the deficiency or excess is associated with numerous disease states[68].ICP-OES analysis indicated an increase in serum Fe in patients with BC,which is surprising,given that these patients often have micro/macrohematuria,so Fe deficiency would be expected[69].However,the higher level of Fe in serum of patients with BC may be explained by the activation of mechanisms stimulating Fe absorption from the gastrointestinal tract,which provides a possible compensation for the level of Fe in the blood.Moreover,previous studies have suggested that excess Fe in the sera of patients with cancer may be associated with malignant transformation and cancer progression[70].In tumor tissues,rapid cell proliferation and increased DNA synthesis are often observed,which require high Fe bioavailability.In the human body,the main source of Fe in the blood is heme,which is released following the breakdown of red blood cells[70].Further,our results are consistent with earlier studies that reported elevated serum Fe levels in various types of diseases,such as hepatocellular carcinoma,lung cancer,and colorectal cancer[71].
Li is an alkali metal used to treat psychiatric disorders,and has potential benefits for the treatment of leukemia or thyroid disorders[72].It inhibits several enzymes,including inositol monophosphatase and glycogen synthase kinase-3[73].However,the ingestion of Li causes many side effects,including hypercalcemia,cardiovascular,and gastrointestinal and parathyroid disorders[74].Recent studies demonstrated that Li uptake is associated with reduced tumor incidence,probably through inhibited cell proliferation,which may be linked to reduced DNA replication and Sphase cell cycle arrest[75].Wach et al.[29]detected significantly increased concentration of Li in the sera of patients with BC compared with healthy controls using ICP-OES.
Lower concentration of the serum amino acids histidine,alanine,tryptophan,glutamine,glycine,and threonine in patients with muscle invasive BC(pT2)in comparison to non-muscle invasive BC(pTa/pT1)may suggest the higher uptake of these amino acids and their potential role in protein synthesis underlying muscle cancer invasion.This inference is supported by proteomic studies that reported significant differences in tissue protein expression,which were correlated with BC ability to invade into muscle tissue[76].Another possibility as to why these amino acids are present at lower concentrations may be due to general state of cachexia and malnutrition observed in patients with MIBC,which is usually a systemic disease and often manifests at a stage when metastases are present.Interestingly,lower concentrations of serum amino acids(leucine,histidine,alanine,and tyrosine)can be also observed in LG BC when compared to HG BC.In healthy organisms,de novo lipogenesis is limited to hepatocytes and adipocytes.Cancer cells may reactivate this anabolic pathway,which relies on glucose,glutamine,and acetate to synthesize citrate.Both acetate and citrate are substrates for extramitochondrial acetyl-CoA production,which is essential for fatty acid and cholesterol biosynthesis[57].
To date,several papers have focused on metabolite analyses in urine and blood from BC patients in an effort to potentially differentiate the different grades of this cancer.However,to our knowledge,only two studies have explored the relationships between changes in metabolite levels in urine and different tumor stages(Ta/Tis,T1,and>T2)[61,77].At present,there are no reports of serum profiling in patients with different types of BC,probably owing to the fact that this type of analysis would require quite a large group of patients and healthy controls.
A pilot urine analysis conducted by Kim et al.[67]in 2010 studied a relatively small group of patients and revealed slightly elevated levels of alanine,glutamine,leucine,tyrosine,and glycine and slightly decreased levels of threonine and tryptophan in patients with BC compared with controls.Subsequent studies also using GC-MS confirmed higher levels of alanine in the serum of the healthy controls compared to patients with BC,but the levels of alanine were not found to be potentially diagnostic of BC stages[22].In our study,a slightly lower concentration of alanine in the serum of patients with BC was found compared to the control group;however,this trend was not found to be statistically significant in differentiating between the two groups.However,we measured significantly lower levels of alanine in the sera of patients with LG and pTa/pT1 BC,which has not been previously reported in the literature.
Troisi et al.[22]obtained comparable results to Kim et al.[67]study with respect to glutamine level changes,but also found higher levels of threonine in the sera samples from the LG group compared with the HG group,and a higher level of glycine in the HG group compared with the LG group.The results from our study indicated that differential concentrations of glycine,glutamine,and threonine in human sera may be used as diagnostic markers and may help distinguish between different stages of BC,as we have found that these metabolites were present at higher concentrations in the sera of patients with pTa/pT1 stage disease compared to those with pT2 stage.Bansal et al.[24]undertook an NMR-based study of serum metabolite profiles and identified glutamine as one of three metabolites that can differentiate between LG and HG BC,as it was reported to be slightly elevated in the sera of patients with HG BC[24].Our results on serum glutamine levels are consistent with published studies,and suggest that elevated levels of glutamine in the pTa/pT1 stage of BC may be the result of increased glutaminolysis,which is observed in some types of tumors as an important mechanism to provide an additional source of cellular energy[78].
Bansal et al.[24]also reported histidine as one of the six metabolites that can distinguish patients with LG and HG BC from healthy controls,and was reported to be in higher concentrations in the sera of LG BC patients compared to HG BC patients and healthy controls.The authors’finding about serum histidine levels was consistent with that of our study,which found higher serum levels of histidine in LG and pTa/pT1 BC cancer[24,79].The link between differential levels of serum histidine and BC progression,as well as concentration changes in methylhistidine,tyrosine,leucine,and tryptophan,has also been reported by Alberice et al.[80].The authors’study reported elevated levels of these metabolites in the sera of patients with bladder tumors compared to those of patients with early stages of BC[80].In contrast,an LC-MS-based study reported lower levels of histidine in the urine of patients with BC compared to healthy controls[56,81].Moreover,Li et al.[60]indicated an increased level of L-methylhistidine in the urine of patients with BC.Histidine is a precursor for histamine synthesis in a reaction catalyzed by histidine decarboxylase(HDC).The overexpression of HDC has been observed in various cancers.Histidine via histamine is associated with inflammation in the urinary bladder,which is commonly associated with cancer development in this organ[82].
Our research has shown a significant difference in serum leucine levels in BC patients with LG compared to HG.In addition to the research of Kim et al.[67]and Alberice et al.[80],the level of leucine in patients with BC was also examined by Cao et al.[23],who reported,using NMR,lower levels of leucine/isoleucine as well as tyrosine and glycine in the sera of patients with HG BC compared to LG BC,which was consistent with our findings.Another study,conducted by Loras et al.[83],reported increased levels of tyrosine and tryptophan in the urine of patients with BC compared to healthy controls.Our research results are also consistent with those of Yumba Mpanga et al.[84],which indicated significantly higher levels of tryptophan in the urine of patients with HG BC compared to LG BC group.
The use of the gold and silver-109-modified targets in LDI-MS experiments allowed for direct measurement of serum samples without analyte separation and extraction.Using this technique,serum analysis allowed the identification of 13 compounds that were found in greater concentrations in control serum samples compared to those of patients with BC,and 12 compounds that displayed the opposite trend;these included three compounds found independently using both silver-109-and gold-based MS methods.Most of these compounds were lipids,12 of which belonged to the class of sphingolipids,and the remaining contained fatty acyls,saccharolipids,polyketides,nucleosides or nucleotides,and others.
Lipid metabolism plays a key role in various processes associated with cancer cells.Fatty acids are the building blocks of complex lipids,which are used for energy storage or as building blocks of cell membranes[85].As reported by many authors,BC initiation and progression are associated with changes in lipid metabolism[86].Sphingolipids are a group of lipids comprising sphingoid bases(i.e.,set of aliphatic amino alcohols that include sphingosine)that play an important role in regulation of diverse cellular processes including cellular apoptosis,proliferation,angiogenesis,senescence,and transformation[87].The importance of sphingolipids in the regulation of cancer growth and pathogenesis has been well described in the literature[88].The sphingolipid metabolism may be responsible for the invasion and mobility of cancer cells in muscle-infiltrating BC[89].Human BC cells have also been shown to upregulate the cannabinoid receptors 2,which induces cell apoptosis by stimulating de novo ceramide synthesis[90].
Lastly,the gold-and silver-109-based LDI-MS spectral analyses shown in this work have indicated a higher concentration of serum cyanidin in healthy individuals.Cyanidin is classified as a natural antioxidant present in both fruits and vegetables,and has confirmed with anticancer properties.It has been reported to induce apoptosis and differentiation in prostate and renal cancer cells[91,92].
5.Conclusion
We demonstrate that high-resolution NMR,ICP-OES,and goldand silver-109-based LDI-MS,together with multivariate statistics,are powerful sets of tools for the characterization of the serum metabolome and elemental differences in BC.With regard to biomarker discovery using1H NMR spectroscopy,four potentially robust metabolic biomarkers were identified for 100 tumor serum samples from patients with BC patients after comparison against 100 healthy controls owing to the excellent predictive ability of AUC>0.999.Two elements(Fe and Li)exhibited significant concentration differences in the serum of NCs compared to that of patients with BC,suggesting that they may serve as useful biomarkers of BC.Additionally,22 compounds(mainly lipids)were observed to differentiate between cancer and control samples,as judged from laser MS results.We also identified five metabolites that might be used as potential biomarkers to distinguish LG and HG and nine metabolites that may serve to differentiate between the pTa/pT1 and pT2 stages of BC.Our results suggest that differential serum metabolite profiles and elements can help identify patients with BC compared with NCs,with significant discriminating power between different stages and grades of BC.Moreover,our findings demonstrate that combining serum metabolite profiles and elements has a stronger predictive value than either compound/element alone to assess disease severity and progression in BC.
CRediT author statement
Krzysztof Ossoli′nski:Investigation,Resources,Writing-Original draft preparation;Tomasz Ruman:Methodology,Resources,Data curation,Writing-Reviewing and Editing,Supervision;Val′erie Copi′e:Resources,Data curation,Writing-Reviewing and Editing,Funding acquisition;Brian P.Tripet:Resources,Data curation,Writing-Reviewing and Editing,Visualization,Funding acquisition;Leonardo B.Nogueira:Resources,Investigation,Data curation;Writing-Original draft preparation;Katiane O.P.C.Nogueira:Data curation,Writing-Original draft preparation;Artur Ko?odziej:Investigation,Data curation;Aneta P?aza-Altamer:Investigation;Anna Ossoli′nska:Resources;Tadeusz Ossoli′nski:Resources;Joanna Nizio?:Conceptualization,Methodology,Formal analysis,Investigation,Data curation,Writing-Original draft preparation,Reviewing and Editing,Visualization,Supervision,Project administration,Funding acquisition.
Declaration of competing interest
The authors declare that there are no conflicts of interest.
Acknowledgments
Research was supported mainly by the National Science Center(Poland)(Project SONATA No.:UMO-2018/31/D/ST4/00109).1H NMR spectra were recorded at Montana State University(MSU),Bozeman,USA,on a cryoprobe-equipped 600 MHz(14 T)AVANCE III solution NMR spectrometer housed in MSU's NMR Center.Funding for MSU NMR Center's NMR instruments has been provided in part by the National Institutes of Health Shared Instrumentation Grant program(Grant Nos.:1S10RR13878 and 1S10RR026659),the National Science Foundation(Grant Nos:NSFMRI:DBI-1532078 and NSF-MRI CHE 2018388),the Murdock Charitable Trust Foundation(Grant No.:2015066:MNL),and support from the office of the Vice President for Research,Economic Development,and Graduate Education at MSU.
Appendix A.Supplementary data
Supplementary data to this article can be found online at https://doi.org/10.1016/j.jpha.2022.08.004.
 Journal of Pharmaceutical Analysis2022年6期
- Journal of Pharmaceutical Analysis的其它文章
- Corrigendum to“The potential of miRNA-based therapeutics in severe acute respiratory syndrome coronavirus 2(SARS-CoV-2)infection:A review”[J.Pharma.Anal.11(2021)265-271]
- Development of a surface plasmon resonance biosensor for accurate and sensitive quantitation of small molecules in blood samples
- Peptide-RNA complexation-induced fluorescence“turn on”displacement assay for the recognition of small ligands targeting HIV-1 RNA
- Fluorescent aptasensor for detection of live foodborne pathogens based on multicolor perovskite-quantum-dot-encoded DNA probes and dual-stirring-bar-assisted signal amplification
- Tumor-targeting intravenous lipid emulsion of paclitaxel:Characteristics,stability,toxicity,and toxicokinetics
- A highly efficient protein corona-based proteomic analysis strategy for the discovery of pharmacodynamic biomarkers