
High-starchy carbohydrate diet aggravates NAFLD by increasing fatty acids inf lux mediated by NOX2
2023-01-03 11:30:08YuqiGoRuiHuKezhengPengYuemioYinChenyeZengYnnnGuoYidWngLiyunLiXueLiYingQiuZhoWng
食品科學與人類健康(英文) 2023年4期
Yuqi Go, Rui Hu, Kezheng Peng, Yuemio Yin, Chenye Zeng,Ynnn Guo, Yid Wng, Liyun Li, Xue Li, Ying Qiu, Zho Wng,*
a MOE Key Laboratory of Protein Sciences, School of Pharmaceutical Sciences, Tsinghua University, Beijing 100084, China.b School of Medicine, Tsinghua University, Beijing 100084, China
Keywords:
A B S T R A C T Nonalcoholic fatty liver disease (NAFLD) is a high-incidence lipid disorder that affects more than a quarter of the population worldwide, and dietary intervention is the recognized treatment. Starch is the main component of staple foods that are consumed daily, and the effects, metabolic pathway, and molecular mechanism of starch in the context of NAFLD remain unclear. Our study showed that a high-starch carbohydrate diet (HCD)led to the occurrence and exacerbation of NAFLD in mice. Transcriptomics and metabonomic analyses showed that the increased fatty acid influx mediated by NADPH oxidase 2 (NOX2) exacerbated NAFLD.Knocking down NOX2 specifically alleviated HCD-induced NAFLD in vivo and in vitro. Moreover, the large amounts of ROS produced by NOX2 further exacerbated insulin resistance and increased lipolysis in perirenal white adipose tissue (periWAT), thereby providing fatty acids for hepatic lipid synthesis. In addition,the interaction between AMPKα1 and p47phox was the pathway that mediated the high expression of NOX2 induced by a HCD. Our study systematically demonstrated the effect of a HCD on NAFLD. Elevated fatty acid inf lux is a unique molecular regulatory pathway that mediates HCD-induced NAFLD exacerbation, which is different from the effect of simple sugars. Additionally, NOX2 was suggested to be a specif ic and effective drug target for NAFLD.
1. Introduction
Nonalcoholic fatty liver disease (NAFLD) is characterized by a large amount of triglyceride deposition in the liver [1]. Due to the popularity of fast food, which is high in fat and sugar, NAFLD affects more than 1/4 of the global population [2]. Although the fatality rate of NAFLD is much lower than that of cardiovascular diseases,once NAFLD progresses to cirrhosis and hepatitis, the risk of death greatly increases [3,4]. Since no registered drugs for NAFLD are urrently available, diet and lifestyle changes are the only recommended treatments.
Previous studies have mainly focused on the impact of added sugars, such as glucose and fructose, on NAFLD [5]. These studies have shown that added sugars tend to increase lipogenesis and impair lipid oxidation [6,7]. In recent years, various explanations, such as ATP consumption, nucleotide turnover, uric acid generation, gut permeability, and microbiome composition, have been suggested to explain the effect of added sugars on NAFLD [5,8]. Population studies have shown that high-carbohydrate diets (combined analysis of starchy carbohydrates and added sugars) reduce the human lifespan and impair metabolic health [9,10]. Although starchy carbohydrates are the main components of staple foods that are consumed almost daily, their effects on NAFLD are not clear, and the metabolic characteristics have not been explained.
The liver is responsible for glucose and lipid metabolism,and is the site at which glucose is converted to lipids and ATP is released to ensure proper body function. Triglycerides (TG) in the liver accumulate in two ways. One is through lipid metabolism,which is mediated by enzymes in the liver. These processes include the tricarboxylic acid cycle (TCA), glucose-sensing pathway, and de novo lipogenesis pathway, which are responsible for lipid synthesis, and theβ-oxidation pathway, which is responsible for lipid decomposition [5,11].The other is through lipid transport, including lipid influx and efflux. Fatty acids, cholesterol and other molecules in the systemic circulation rely on lipid transfer in the liver to achieve lipid synthesis in the endoplasmic reticulum [12,13]. Preformed TG in the liver is transported out by a very low-density lipoprotein (VLDL)-TG complex, and ApoB is the main component of VLDL. Liver TG levels require a balance in lipid metabolism and lipid transport; changes in one process could not representative of the overall microenvironment.
NADPH oxidase 2 (NOX2) is a member of the NADPH oxidase family and is highly expressed in the liver. The main physiological function of NOX2 is to generate singlet oxygen by reducing oxygen molecules to oxygen ions [7]. NOX2 produces a large amount of ROS, which affects signal transduction and immune functions, by transferring NADPH electrons to molecular oxygen,and this process is involved in various physiological activities,such as cell proliferation and differentiation [14]. Overactivation of NOX2 leads to a ROS surge, which directly activates downstream inflammatory pathways and indirectly damages DNA and regulates protein phosphorylation, causing oxidative damage and increasing inflammation, which leads to the occurrence and worsening of cell dysfunction and diseases [15,16] and affects function and metabolism in tissues and organs [17,18]. Although ROS can be produced as a byproduct of mitochondrial respiratory chain activity and several other enzyme reactions [19], the NOX family has been recognized as the only group of enzymes whose function is to produce ROS.Moreover, increasing evidence shows that NOXs are the main sources of ROS in cardiovascular and cerebrovascular diseases [20,21].
When NOX2 is excessively activated, a series of diseases related to oxidative stress, inflammation, and fibrosis, such as ischemiareperfusion injury, chronic granulomatous disease, atherosclerosis,rheumatoid arthritis, and liver fibrosis, develop [22-25]. NOX2 is composed of 6 subunits: gp91phox, p22phox, p47phox, p67phox, p40phox,and Rac. The activation of NOX2 requires the transport of p47phox,p67phox, p40phoxand Rac from the cytoplasm to the cell membrane,where they bind with gp91phoxand p22phoxto form a complex. Among them, p47phoxplays an important role in sensing nutrient signals,which mediate transport from the cytoplasm to the membrane for NOX2 assembly and activation [26]. Population studies have shown that individuals with NAFLD have increased NOX2 activity [27,28],indicating a relationship between NOX2 and NAFLD.
In recent years, the regulatory role of NOX2 in glucose and lipid metabolism has gradually emerged. Inhibiting NOX activity in vascular endothelial cells and reducing oxidative stress induced by vascular NOX can protectApoE-knockout mice from atherosclerosis and endothelial dysfunction [29]. Atorvastatin can directly inhibit the expression of NOX2 in platelets, reduce platelet isprostaglandin and thromboxane A, and prevent coronary thrombosis [30], suggesting that the NOX family has a regulatory effect on lipid metabolism in blood vessels. In addition, adipose tissue-specificp47phox-knockout female mice showed significantly reduced mRNA expression levels of PPARγ and FAT/CD36, which are associated with energy metabolism,adipocyte differentiation, and fatty acid uptake. In addition,p47phoxknockout cells showed a stronger inhibitory effect on differentiation than WT cells [31], suggesting a potential association between p47phoxand adipose differentiation. Inhibiting activation of the NOX2 subunit Rac1 and NOX-derived ROS significantly improved liver fibrosis [32]. Analysis of 67 patient biopsies confirmed that NAFLD children exhibited increased NOX2 activity, as well as isoprostaglandin, cyclin, and lipopolysaccharide (LPS) levels.Multivariate linear regression analysis showed that triglycerides,high-density lipoprotein, the insulin resistance index (HOMA-IR),LPS and isoprolandin were positively correlated with the expression levels of NOX2 derivative peptide (sNOX2-DP). Furthermore,sNOX2-DP levels were linearly correlated with steatosis,inflammation, ballooning, fibrosis and NAFLD activity scores [27],further demonstrating that NOX2 plays an important role in regulating inflammatory and lipid metabolism-related diseases. In addition, studies have shown that the NOX family regulates insulin sensitivity [33], andNOX2-knockout mice were resistant to insulin damage caused by a high-fat diet [34]. A mouse model of NOX2 dysfunction in the absence of p47phoxor Rac1 was established, and significantly reduced glucose uptake and GLUT4 translocation in response to exercise stimulation was observed, suggesting that NOX2 can regulate glucose transport [26]. However, the underlying mechanism has not been verified. In addition, whether NOX2 can respond to a HCD and how ROS produced by NOX2 affect NAFLD need to be verified.
Our study showed that HCD leads to the occurrence and deterioration of NAFLD. The exacerbation of NAFLD was induced by the increased fatty acid influx, which was mediated specifically by NOX2. Furthermore, NOX2-induced ROS were the key factor that promoted insulin resistance and mediated periWAT lipolysis, thereby providing sufficient raw fatty acids for triglyceride synthesis. In addition, HCD-induced high expression of NOX2 was dependent on the interaction of AMPKα1/p47phox. Our study provides new insight into starchy carbohydrates and suggests that NOX2 is a specific target in HCD-induced NAFLD exacerbation by increasing fatty acid influx,which is quite different from the effect of simple sugars.
2. Materials and methods
2.1 Animals and diets
C57BL/6J mice (5 weeks old, male) were purchased and maintained in the Tsinghua University Animal Facility (Beijing,China) on a 12 h light/12 h dark cycle with free access to water at 22-23 °C. All mice were randomly group-housed (6 per cage) and fed a standard-carbohydrate diet (SCD), which was designed according to the American Institute of Nutrition (AIN)-93G diet [35].
According to the formula and ratio of the SCD, we designed a high-fat diet (HFD) and a high-starch carbohydrate diet (HCD).The specific formulas are shown in Table S1. Based on the calories consumed by the mice that were fed the HFD, mice that were fed the SCD and HCD were provided with the same calories/body weight at 7 a.m.each day.
2.1.1 Dietary intervention in healthy mice
Five-week-old male C57BL/6J mice were randomly divided into three groups, with 12 mice in each group. The HFD, SCD, or HCD were administered. After dietary adaptation for one week, a 16-week dietary intervention was performed. The body weights and food quantity of the mice were recorded daily. The isocaloric feed was administered at a fixed time every day (caloric conversion was conducted according to body weight).
2.1.2 Dietary intervention in NAFLD mice
A NAFLD mouse model (NAFLD mice,n= 90) was established in 5-week-old male C57BL/6J mice that were fed a HFD for 16 consecutive weeks and confirmed by measuring blood lipid levels and liver pathology.
NAFLD mice were randomly divided into three groups (n= 10 for each group). As described in section 2.1.1, equal-calorie diets were administered at the same time each day for 16 consecutive weeks. Then, related experiments were performed, and indicators were examined.
2.1.3 Drug intervention in NAFLD mice
NAFLD mice were randomly divided into 3 groups (n= 10 for each group). And isocaloric HFD was calculated according to body weight and administered at the same time each day. According to previous reports, acarbose and orlistat were prepared with normal saline at the minimum dose that worked. NAFLD mice were intragastrically administered normal saline, acarbose, or orlistat at 5 p.m. for 16 consecutive days. Then, related experiments were performed, and indicators were examined.
2.1.4 Dietary intervention in p47phox-knockdown NAFLD mice
NAFLD mice were randomly divided into 5 groups (n= 10 for each group). AAV9-RNAi (97903-1) was constructed by Genechem.Normal saline, empty virus, or AAV9-p47phox-RNAi virus was injected at a dose of 5 × 10¹¹viral genome/mL through the tail vein.
In 5 groups, the mice were injected with normal saline, empty virus, or AAV9-p47phox-RNAi virus and administered an isocaloric HCD. The fourth group of mice was injected with AAV9-p47phox-RNAi and kept on an isocaloric HFD diet, and the last group was maintained on a HFD. Related experiments were performed, and indicators were examined after 8 weeks of dietary intervention.
All experiments were performed in accordance with the guidelines of the Institutional Animal Care and Use Committee of Tsinghua University. All animal procedures were reviewed and approved by the Institute of Tsinghua University. The approval numbers for the various experiments were AP18-WZ1, AP19-WZ1, and AP20-WZ2.
2.2 Construction of the NAFLD AML12 Cell Model
AML12 cells were cultured in high-lipid medium for 24 h to construct a NAFLD AML12 cell model. The high-lipid medium was DMEM/F12 basal medium supplemented with 200 μmol/L oleic acid and 100 μmol/L palmitic acid. Oleic acid and palmitic acid were prepared with bovine serum albumin (fatty acid free).
2.3 RNAi-p47phox-shRNA plasmid transfection
All plasmids were constructed by Genechem (Shanghai, China).AML12 cells were transfected with RNAi-p47phox-shRNA plasmids using Lipofectamine 2000. The GFP vector was used to normalize the amount of transfected DNA in the control group, as well as to check transfection efficiency. LipoGeneTM2000 Star Transfection Reagent (BIORIGIN) was used to transfect negative control siRNA and p47phoxsiRNA (20 pmol per well in a 24-well plate) into AML12 cells. The cells were examined after 24 h, and puromycin was added to select positive cells and obtain si-p47phox-knockdown AML12 cells(si-p47 cells).
2.4 Measurement of intracellular ROS
AML12 and si-p47 cells were plated in a 6-well plate at a density of 1 × 10⁶cells/well. After being treated with high-fat medium and 30 mmol/L glucose, the medium was replaced with medium containing 10 mmol/L DHE dye, and the cells were incubated at 37 °C for 30 min in the dark and then washed with PBS to remove the excess dye. Hoechst dye was then added to stain the nuclei for 15 min, and the excess dye was washed off with PBS. The cells were observed and photographed under an inverted fluorescence microscope (Olympus IX81).
2.5 VLDL-TG secretion assay
Hepatic VLDL-TG secretion rates were assessed as described in previous studies [36]. In brief, mice were fasted for 8 hours before basal(time = 0) blood collection, and then Triton WR-1339 (500 mg/kg in PBS) was intravenously injected. Blood was then collected at 1, 2,and 3 h after injection. Serum TG concentrations were measured.
2.6 OCR measurement
The mitochondrial oxygen consumption rate (OCR) in cells was assessed using a Seahorse XF96 Extracellular Flux Analyzer(Agilent Technologies, US) according to the manufacturer’s protocol.Cells were plated in a specialized microplate (5 × 10⁴per well).Quantitative changes in the extracellular OCR were examined after the addition of oligomycin (1 μmol/L, ATP synthase inhibitor),FCCP (1 μmol/L, uncoupling agent), rotenone (1 μmol/L, complex I inhibitor) and antimycin A (1 μmol/L, complex III inhibitor). Protein concentrations were determined using a BCA Protein Assay Kit according to the manufacturer’s protocol. Wave software was used for data reconciliation with protein concentrations and to calculate basal respiration, proton leakage, maximal respiration, spare respiratory capacity, nonmitochondrial oxygen consumption, and ATP production.
2.7 Metabolomics analysis
Approximately 50 mg of liver tissue was collected and weighed accurately, and 80% (V/V) HPLC grade methanol was added. The tissue was ground on ice with a hand-held grinder, vortexed at 4 °C for 1 min, and stored at -80 °C overnight. The samples were centrifuged at 14 000 ×gand 4 °C for 20 min, and equal volumes of each sample supernatant were transferred to new centrifuge tubes. N2was used to dry the samples at room temperature. After being dried,the samples were stored at -80 °C. The samples were submitted to the Tsinghua University Metabolomics Platform for nontargeted metabolomics analysis. Data were then analyzed using MetaboAnalyst 5.0. Volcano plot analysis, correlation analysis using univariate analysis methods and principal component analysis using multivariate analysis methods were carried on.
2.8 Transcriptomics analysis
RNA was extracted from liver tissue in the HFD and HCD groups with TRIzol and sent to BGI for RNA sample quality inspection.The sample concentration, 28S/18S, and RIN/RQN were measured using an Agilent 2100. Once the three indicators passed the quality assessment, library construction and sequencing of the samples were then performed. The follow-up test was performed BGI gene and measured by BGISEQ. On average, each sample resulted in 1.14 G of data and expression information for approximately 18 000 genes. All analyses were performed on the BGISEQ platform.
2.9 Glucose uptake assay
As previously described [37], AML12 cells were inoculated in 96-well plates at a density of 3 000 cells per well. After glucosemimic treatment (72 h, 30 mmol/L glucose treatment in FLAML12). 2-NBDG was added at a final concentration of 200 g/mL and incubated for 10 min. Then, excitation/emission wavelengths of 480/530 nm were examined with a microplate reader.
2.10 IDE activity Analysis
IDE activity was examined using an IDE activity fluorimetric SensoLyte 520IDE activity assay kit according to the manufacturer’s instructions. AML12 cells were plated in a 96-well plate at a density of 4 000 cells/well. After glucose-mimic and ROS inhibitor (DPI or GSK2795039) treatment, lyase was added to each well. After the lysis reaction, 1 μL was taken from each well to measure the protein concentration by the BCA method. Then, 50 μL of fluorescent substrate solution was added to each well to start the enzymatic reaction. The samples were measured at 490 and 520 nm emission wavelengths on an Infinite M200 TECAN Multiplate Reader. The enzyme activity was normalized per mg of total protein.
2.11 Statistical analysis
The data are expressed as the mean ± SD and were analyzed using one-way ANOVA for variables among more than 3 groups and Student’st-tests for analyses between two groups in GraphPad Prism 6.0. Animal and cell experiments were replicated 3 times with at least 3 replicants per group. To analyze tissue section staining, tissues at the same position were selected for the experiment, and screenshots were taken for blind analysis. More than 3 fields of vision were selected for each section. Differences in values were considered significant when?P <0.05;??P <0.01;???P <0.001; and****P <0.000 1;n.s., non-significant (P> 0.05).
3. Results
3.1 A high-starch carbohydrate diet further exacerbates NAFLD.
To determine the effect of HCD on NAFLD, an isocaloric HFD (40% fat; 40% carbohydrate; 20% protein/total kcal),standard-carbohydrate diet (SCD, 20% fat; 60% carbohydrate;20% protein/total kcal), or high-starch carbohydrate diet (HCD,0% fat; 80% carbohydrate; 20% protein/total kcal) (Table S1)was administered to NAFLD mice (Fig. 1A). NAFLD mice were constructed by 16 weeks of HFD feeding (Figs. S1A-S1E). Currently,no studies have made a standard provision for the quantity of “high”in an HCD. In the HCD designed herein, all calories, except for the necessary intake of protein, come from starch, thus ensuring a“high” level of carbohydrates, as well as excluding the influence of exogenous lipids and simple sugars on hepatic TG levels. After 16 weeks of dietary intervention, although the body weights of NAFLD mice fed a HCD were significantly decreased (Figs. 1B, S1F), the serum levels of glucose, TC, and LDL-C were significantly increased(Fig. 1C). Additionally, increased lipid droplets and inflammatory factor infiltration were observed in mice fed a HCD, indicating the exacerbation of NAFLD compared to that in mice fed a HFD or SCD(Fig. 1D). TG and TC levels in the liver were also increased in mice fed the HCD (Fig. 1E). Moreover, serum ALT and AST levels showed the same trend as the degree of hepatic lipid accumulation (Fig. 1F).Because inflammation is present throughout the course of NAFLD and plays an important role in the progression of NAFLD [38], we also examined the level of inflammation in the liver. The intrahepatic inflammatory cytokines TNF-α and IL-1β and the inflammatoryrelated factor NF-κB (p65) were significantly elevated in mice fed a HCD (Fig. 1G). Dietary intervention in NAFLD mice showed that the HCD exacerbated NAFLD, which was more severe than that induced by the HFD.
To further confirm this finding, we designed a drug experiment to demonstrate the reverse effect of HCD on NAFLD by using acarbose to reduce the absorption of carbohydrates. Orlistat was used as a positive control (Fig. S1H). Treatment with acarbose did not change body weight (Figs. S1I, S1J), but NAFLD status was significantly improved, indicating the alleviation of NAFLD (Figs. S1K-S1M),which confirms that the HCD further exacerbated NAFLD.
3.2 A high-starch carbohydrate diet induces NAFLD
To examine whether the HCD could lead to the occurrence of NAFLD, the HFD, SCD, or HCD was administered to healthy mice (Fig. 1H). After 16 weeks of dietary intervention, the HCD decreased body weight in healthy mice, which is consistent with that of NAFLD mice (Figs. 1I, S1G). In addition, compared with mice fed the SCD, there were no differences in blood lipid levels, and only blood glucose showed a significant increase (Fig. 1J). Furthermore, the HCD did not cause significant lipid accumulation in the liver (Figs. 1K, 1N).However, an empty balloon-like change was observed in the hepatocytes of mice fed the HCD, as well as elevated levels of ALT and AST and increased expression of inflammatory factors (Figs. 1L, 1M).Then, the mice were fed under the same conditions for another 16 weeks, and a significant NAFLD phenotype appeared in mice fed the HCD at week 32 (Fig. 1N), which was accompanied by increases in hepatic lipid levels and inflammation levels (Figs. 1K-1M).The hepatic triglyceride levels of mice in the H-HCD group was lower than that of mice in the HCD group fed a high-starch diet under NAFLD conditions (Figs. 1D, 1E). However, the expression levels of the liver function indicators AST and ALT and the intrahepatic inflammatory factors TNF-α and IL-1β were similar to those in the HCD group (Figs. 1F, 1G). The HCD contributed to the occurrence of NAFLD, and importantly, inflammation occurred before lipid deposition during this process. These findings suggest that inflammation could be an important inducer of NAFLD during HCD feeding.
Next, we examined these effects at the cellular level. Cells are not able to directly interact with starch. Considering that starch is made of glucose and has a slow-release metabolic characteristic compared to glucose, we designed a long-term, low-toxicity glucose stimulation condition to mimic HCD feeding. We selected 72 h, which was the longest culture time without changing the medium for AML12 cells, as the intervention time. In addition, according to the animal experiments, NAFLD mice showed a faster change in an HCD than healthy mice. Therefore, a NAFLD cell model (FL-AML12) was constructed (Figs. S1N, S1O) before glucose intervention to enhance the effect of glucose. To determine the optimal glucose concentration,we treated AML12 and FL-AML12 cells with different glucose concentrations for 72 h and measured cell viability. We found that 30 mmol/L was the lowest concentration that reduced the viability of NAFLD cells but not AML12 cells (Fig. S1P). Therefore, in FLAML12 cells, 72 h, and 30 mmol/L glucose was selected to mimic the HCD intervention. Under this condition, AML12 cells showed elevated lipid levels (Figs. S1Q, S1R), which is consistent with the phenotypein vivo. Based onin vitroandin vivoexperiments, we confirmed that the HCD mediated the occurrence of NAFLD and led to further development and worsening of NAFLD.

Fig. 1 A high-starch carbohydrate diet mediated the occurrence and development of NAFLD. (A) Schematic diagram of the experimental process. Six-weekold male C57BL/6J mice were fed a HFD for 16 consecutive weeks to establish the NAFLD mouse model. NAFLD mice were randomly divided into three groups, and the HFD, SCD, and HCD groups were administered equal amounts of calories for 16 weeks. (B) Changes in the body weights of NAFLD mice after 16 weeks of HFD, SCD, or HCD consumption. (C) Serum glucose and lipid levels of NAFLD mice after 16 weeks of HFD, SCD, or HCD consumption. (D)Representative H&E images of the livers of NAFLD mice after 16 weeks of HFD, SCD, or HCD consumption. Scale bars, 50 μm. (E) Hepatic TG and TC levels(mmol/l) of NAFLD mice after 16 weeks of HFD, SCD, or HCD consumption. (F) Serum ALT and AST levels (IU/L) of NAFLD mice after 16 weeks of HFD,SCD, or HCD consumption. (G) Representative Western blot showing IL-1β, TNF-α, and NF-κB (p65) expression in the livers of NAFLD mice after 16 weeks of dietary intervention. The mRNA levels of IL-1β and TNF-α in the livers of NAFLD mice after 16 weeks of dietary intervention. (H) Schematic diagram of the experimental process. Six-week-old male C57BL/6J mice were randomly divided into three groups and fed a HFD, SCD, or HCD for 32 consecutive weeks.Relative analyses were constructed after 16 and 32 weeks of dietary intervention. (I) Body weight changes in healthy mice after 16 weeks of HFD, SCD, or HCD consumption. (J) Serum glucose, TG, TC, high-density lipoprotein cholesterol (HDL-C), and low-density lipoprotein cholesterol (LDL-C) levels of healthy mice after dietary intervention with HFD, SCD, or HCD for 16 weeks. (K) Hepatic TG and TC levels of healthy mice after dietary intervention with HFD, SCD, or HCD for 16 weeks and 32 weeks. (L) The mRNA levels of IL-1β and TNF-α in the livers of healthy mice after dietary intervention with HFD, SCD, or HCD for 16 weeks and 32 weeks. (M) Serum ALT and AST levels (IU/L) of healthy mice after dietary intervention for 16 weeks and 32 weeks. (N) Representative H&E images of the livers of healthy mice after HFD, SCD, or HCD for 16 weeks and 32 weeks. Scale bars, 100 μm. All data are presented as the mean ± SD. The data were analyzed by one-way ANOVA. * P < 0.05, ** P < 0.01, *** P < 0.001, **** P < 0.000 1. Error bars show the standard deviation (SD) in all panels.
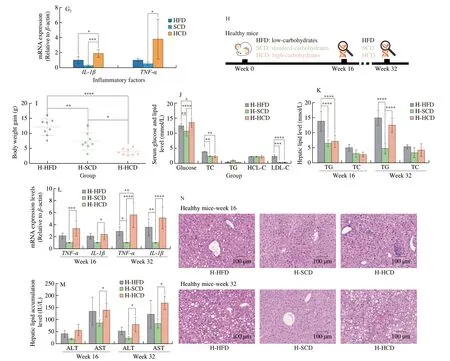
Fig. 1 (Continued)
3.3 Increased fatty acid influx but not endogenous lipogenesis induces HCD-mediated deterioration of NAFLD
NAFLD manifested as excess triglyceride deposition in the liver(Figs. 1E, 1K, S1L, S1O). Key enzymes in metabolic processes related to hepatic triglyceride levels were examined; however, no differences between NAFLD mice fed a HCD or HFD were observed (Fig. 2A).Metabolomics was used to examine 522 small molecule metabolites,which are substrates and products of metabolic pathways, in HCDor HFD-fed mice. Among the 522 metabolites examined, only 26 intermediate metabolites showed significant differences; 19 were decreased and 9 were increased (Fig. 2B). Heatmap statistical analysis of differential metabolites between the two groups showed that although there were 26 differentially expressed metabolites between the two groups, these differences were less than one fold, and most of these factors had little correlation with triglyceride synthesis (Fig. 2C).Principal component analysis of the metabolites showed that the level of PC1 was as high as 72.3%, and the two groups also showed obvious composition approximations (Figs. 2D, 2E). In addition, the correlation analysis between metabolites showed no differences between the two groups (Fig. 2F). Analysis of metabolic pathways in the liver and metabolomics analysis indicates that lipid metabolism is not the mechanism by which the HCD exacerbates NAFLD.
The liver absorbs exogenous fatty acids and synthesizes TG in the endoplasmic reticulum. Free fatty acids enter the liver through free diffusion, which does not require transport media or carriers, does not consume energy, and follows the principle of the concentration gradient.Mice fed a HCD exhibited increased free fatty acid levels in the liver and serum, as well as concentration differences (Fig. 2G), which showed robust ability to mediate free fatty acid transport in the liver.
For medium-long-chain fatty acids, fatty acid transporters are required to facilitate diffusion into the liver. Three fatty acid transporters have been identified: fatty acid transporters (FATPs),plasma membrane-associated fatty acid binding protein (FABP), and fatty acid translocase (FAT/CD36). Among them, each FATP family member has a clear expression profile and function in specific tissues,and there are differences among species [39,40]. FATP2 [41] and FATP5 [42] are mainly expressed in the mouse liver. By binding to long-chain fatty acids, FABPs reversibly bind hydrophobic ligands depending on affinity differences and transport them to coordinated sites of lipid metabolic signals [43]. FABPs have been widely found in the liver, myocardium, fat, breast, placenta, prostate, brain, kidney and other tissues [44]. FAT/CD36 transports fatty acids into the liver by esterifying fatty acids to form acyl-CoA and increasing the concentration difference on either side of the membrane [45,46].FATPs, FAT/CD36, and FABP are needed in to transport mediumand long-chain fatty acids, and these factors were significantly increased in NAFLD mice fed a HCD (Fig. 2H). Cholesterols have been reported to promote the progression of NAFLD [47]. LDL-R and SR-BI are transfer proteins for LDL and HDL. However, no differences were observed between mice fed a HFD and those fed a HCD (Fig. 2I). In addition, for lipid removal, VLDL-TG secretion showed a similar change (Fig. 2J), indicating that lipid efflux is not the reason for the elevated lipid levels caused by an HCD. Moreover,the expression of ApoB, which is a key protein for VLDL assembly and TG export, was higher in mice fed a HCD than in mice fed a SCD but was not different from that in mice fed a HFD (Fig. 2K).In addition, the apolipoproteins ApoA1 [48] and ApoA5 [48], which regulate hepatic triglyceride levels [49] and are related to abnormal lipid metabolism [49], were also measured. Hepatic ApoA1 and ApoA5 levels in the HFD and HCD groups were significantly reduced, and there was no significant difference between the HFD and HCD groups (Fig. 2L). Considering the changes in lipid metabolism and lipid transport, increased fatty acid influx is the reason for HCDmediated exacerbation of NAFLD.
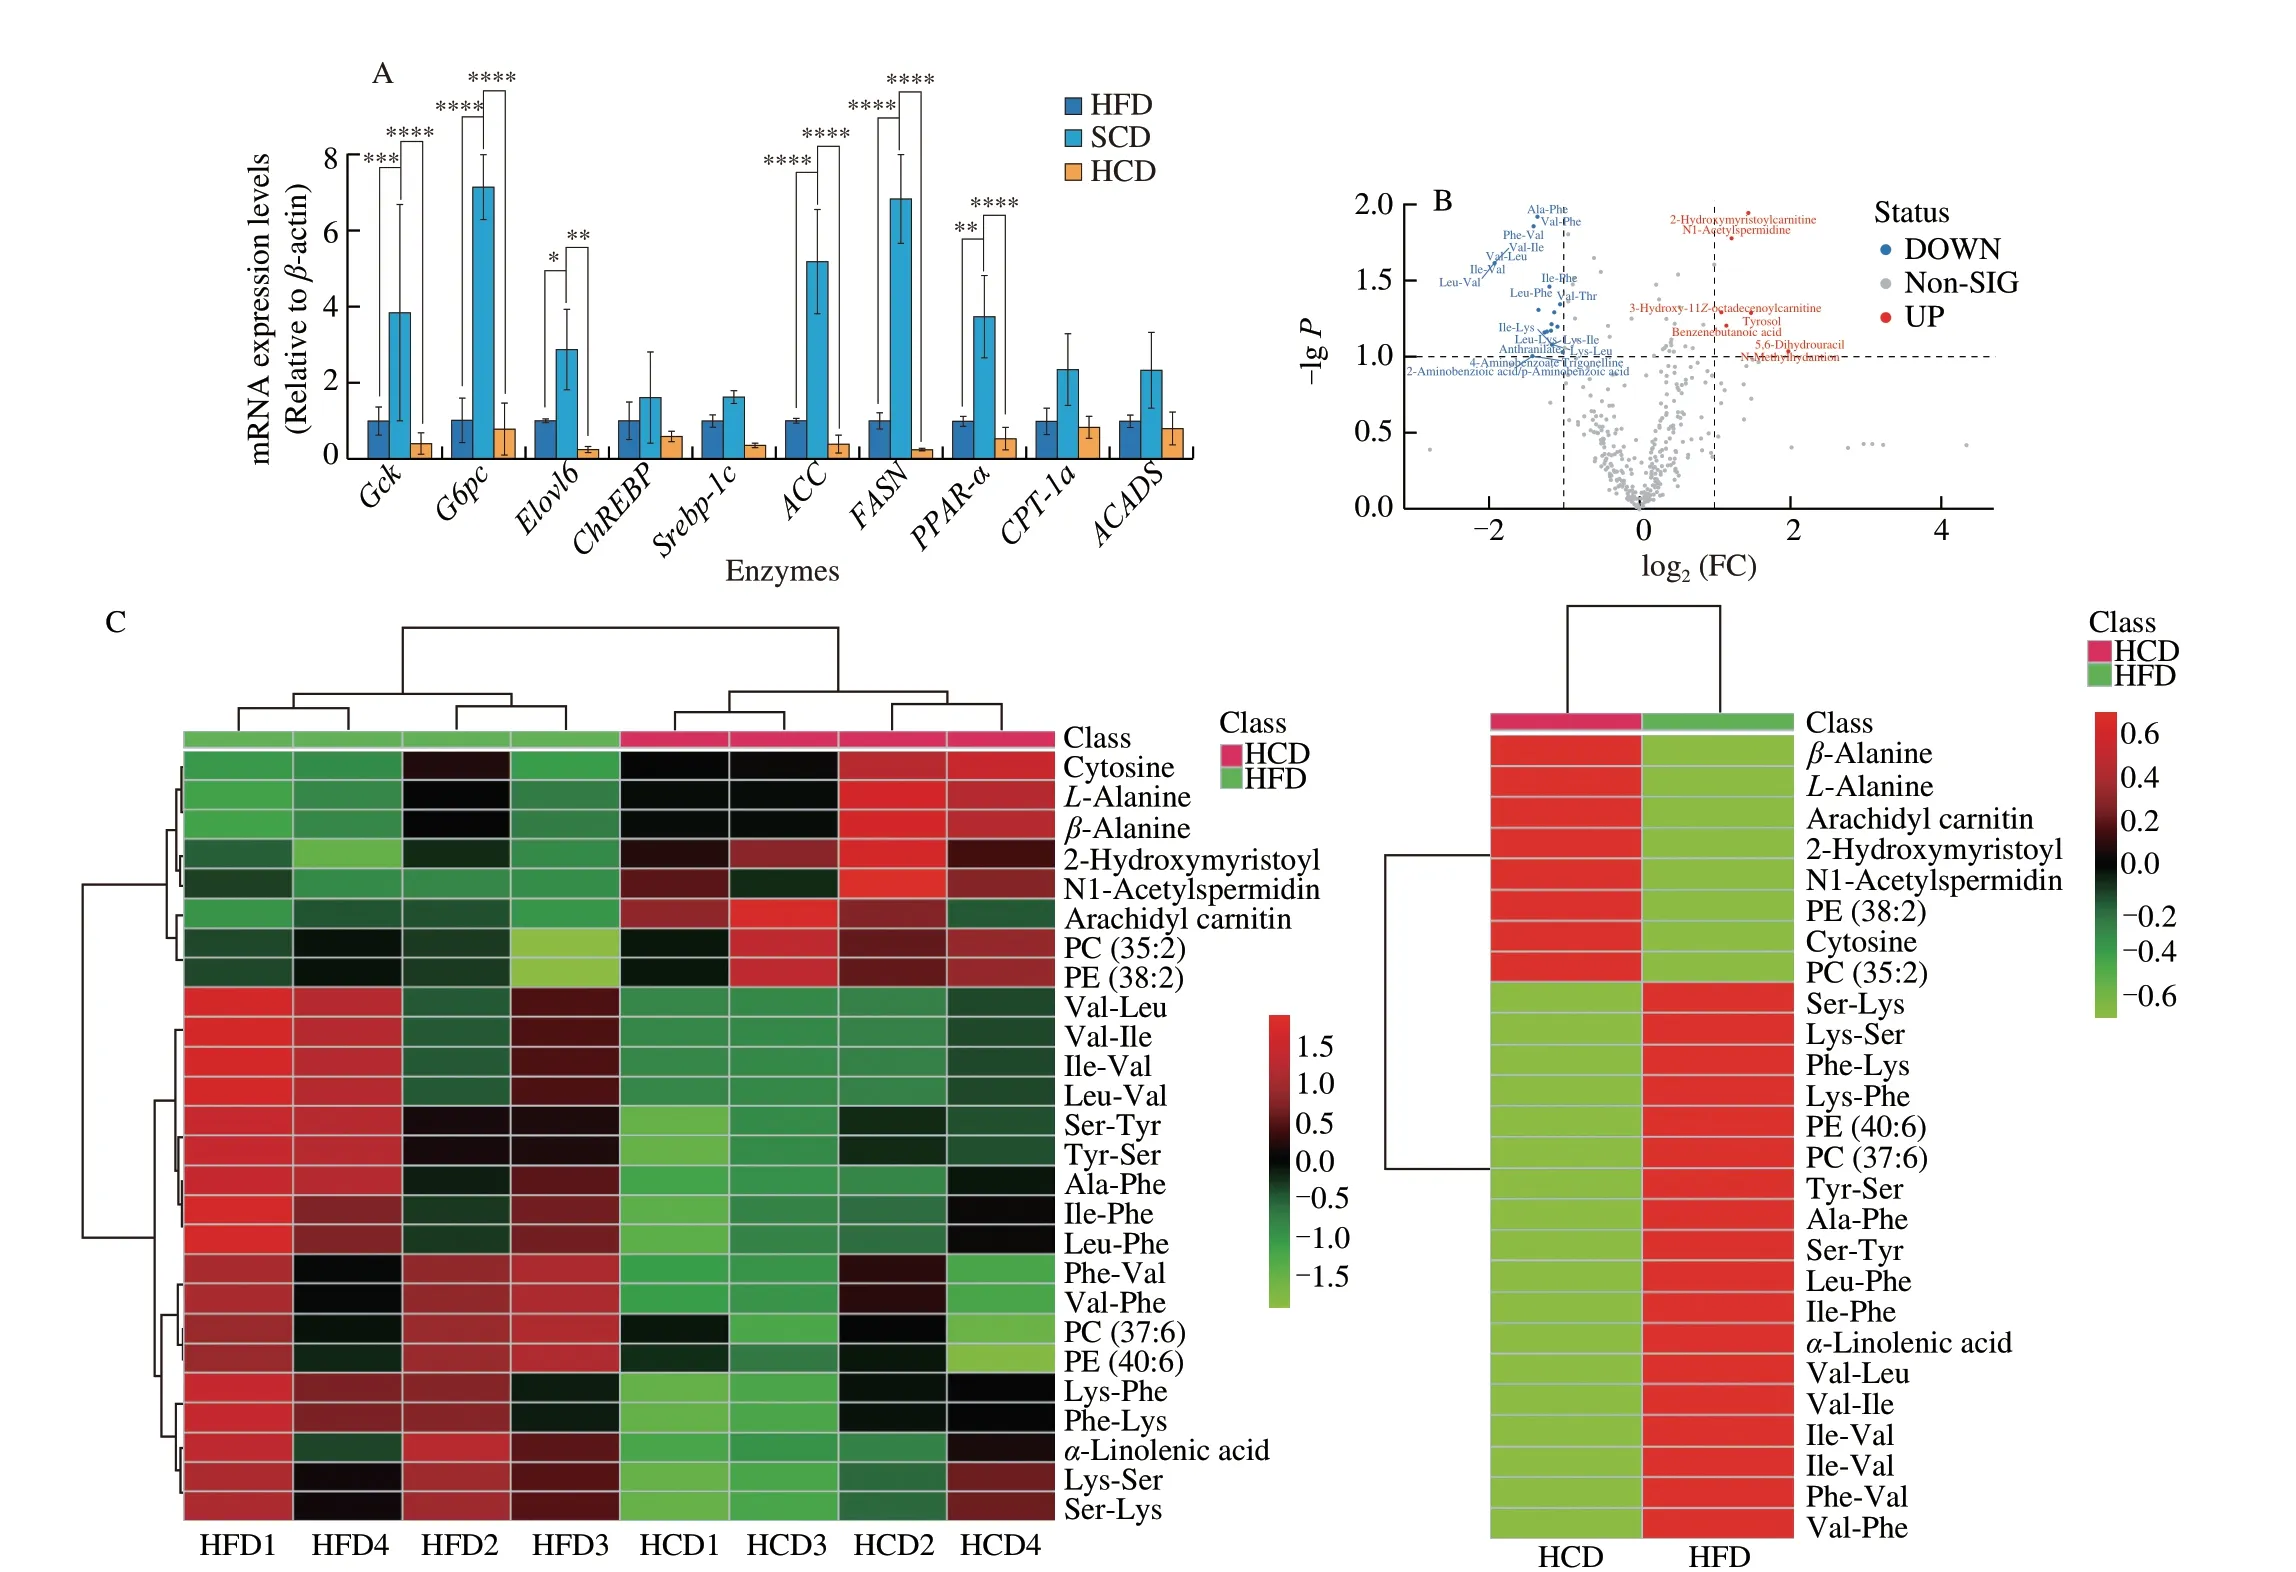
Fig. 2 A high-starch carbohydrate diet exacerbated hepatic lipid accumulation by elevating FFA influx rather than hepatic metabolism. (A) The expression of enzymes in the main metabolic pathways that transfer glucose to lipids in the liver was examined. Hepatic mRNA levels of enzymes in the tricarboxylic acid cycle(Gck and G6pc), the glucose-sensing pathway (Elovl6 and ChREBP), de novo lipogenesis (Srebp-1c, ACC and FASN), and the fatty acid β-oxidation pathway(PPAR-α, CPT-1a and ACADS) in NAFLD mice after dietary intervention for 16 weeks. (B) Volcano plot showing differentially expressed metabolites obtained from metabolomics analysis of the HFD and HCD groups. Important features were selected by a volcano plot with a fold change threshold (x) of 2 and t-test threshold (y) of 0.1. The red circles represent features above the threshold. (C) Heatmap showing metabolites with significant differences (t-test, P < 0.05) in the HFD and HCD groups (left) and group averages (right). (D) Pairwise score plots of HFD and HCD between the selected PCs. The explained variance of each PC is shown in the corresponding diagonal cell. (E) Scores plot of HFD and HCD between the selected PCs. The explained variances are shown in brackets. (F) The overall correlation heatmap of HFD and HCD, which showed the correlation of metabolites examined in the liver. (G) Hepatic free fatty acids (FFAs), serum FFAs and the difference in NAFLD mice after dietary intervention for 16 weeks. (H) Hepatic mRNA levels of FABP1, FATP2, FATP5, and FAT/CD36, which are lipid transfer proteins, in NAFLD mice after 16 weeks of dietary intervention. (I) Hepatic mRNA levels of LDL-R and SR-BI, which are cholesterol transfer proteins,in NAFLD mice after 16 weeks of dietary intervention. (J) Analysis of VLDL-TG secretion in NAFLD mice that were fasted overnight followed by intravenous injection of 500 mg/kg body weight Triton WR-1339. * Represents the comparison with SCD. (K) Representative images showing liver ApoB expression, as determined by immunohistochemistry, in NAFLD mice fed a HFD, SCD, or HCD. (L) Representative Western-blot and densitometric analysis of ApoA1, ApoA5 in the liver of NAFLD mice fed a HFD, SCD, or HCD. Scale bars, 50 μm. Quantitation of liver ApoB expression is shown as a percentage of the total histological area. All data are presented as the mean ± SD. The data were analyzed by one-way ANOVA. *P < 0.05, **P < 0.01, ***P < 0.001, ****P < 0.000 1. Error bars show the SD in all panels.
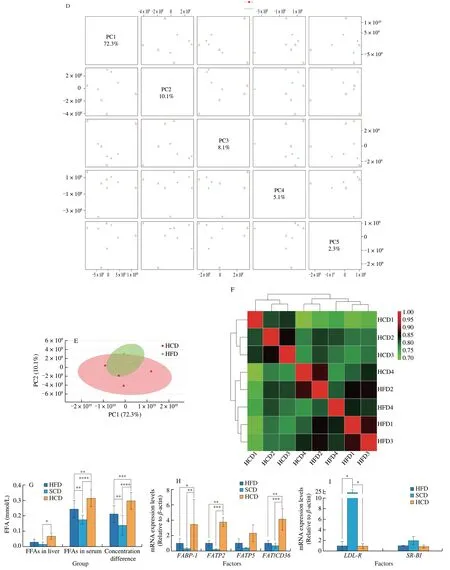
Fig. 2 (Continued)

Fig. 2 (Continued)
3.4 A high-starch carbohydrate diet results in high expression of NOX2
To systematically understand and clarify the underlying mechanism of the metabolic changes caused by the HCD, a transcriptomic analysis was performed on the livers of NAFLD mice fed the HCD and the HFD. By performing a functional classification of the KEGG pathways associated with the changed genes,metabolism- and inflammatory pathways were identified (Fig. 3A).The same result was obtained using GO enrichment analysis (Fig. 3B).GSEA showed that the phagosome pathway, which is related to metabolism and inflammation, was the second most significantly changed pathway (Fig. 3C). The heatmap of the top 26 altered genes in the phagosome pathway showed that the expression levels of 5 subunits of NADPH oxidase were significantly increased (Fig. 3D).To verify these results and determine which subtypes of NADPH oxidase are affected by the HCD, the expression of NADPH oxidases,which are present in the liver, was examined, and only NOX2 was significantly increased by HCD intervention (Fig. 3E). The expression levels of the NOX2 subunits p47phox, p67phox, p40phox, and p22phoxwere increased consistently (Fig. 3F).
NOX2 functions only when it is assembled into a complex, the most important part of which is the movement of intracellular subunits toward the cytoplasm. Cell membrane proteins and cytoplasmic proteins were isolated, and intracellular subunits of NOX2 were observed in the membrane and were increased in mice fed a HCD (Fig. 3G).Among these subunits, phosphorylated p47phoxis necessary for the assembly and activation of NOX2 [50]. Mice fed a HCD showed higher expression of phosphorylated p47phoxin the liver than mice fed a HFD or SCD (Fig. 3I). At the cellular level, after treating AML12 cells with the glucose mimic condition, the expression of p47phoxon the cell membrane and cytoplasm showed a stepwise reversal(Fig. 3H). The immunofluorescence of the intracellular subunit p47phoxand gp91phox, a subunit on the cell membrane, indicated increased colocalization in response to gradient glucose treatment (Fig. 3J),which further suggested that HCD increased the expression and promoted the assembly of NOX2. Furthermore, NOX2 produces ROS [51]. The oxidative stress marker 4-HNE was examined and was highly expressed in NAFLD mice fed a HCD and in AML12 cells under glucose mimic condition (Figs. S2A-S2C). In addition, the level of ROS was measured using DHE, which is a fluorescence probe for directly measuring ROS. The results showed that the HCD caused a high level of ROS in both NAFLD and healthy mice (Figs. S2D, S2E).Liver transcriptome analysis demonstrated that HCD mediated the high expression and activity of NOX2.

Fig. 3 High carbohydrate levels increased NOX2 expression in the liver. (A) KEGG pathway classifications of the differentially expressed genes in the HFD and HCD groups. (B) GO enrichment analysis of biological processes in NAFLD mice fed a HFD or a HCD. (C) Enrichment plot showing the phagosome signaling pathway in the liver, as determined by GSEA comparing NAFLD mice fed a HFD or an HCD. (D) Heatmap showing a clustering of the top 26 core enriched genes in the phagosome signaling pathway between NAFLD mice fed a HFD or a HCD. Five subunits of NADPH oxidase were identified. (E) Hepatic mRNA levels of NADPH oxidase subunits, NOX1, NOX2, and NOX4 in NAFLD mice after 16 weeks of dietary intervention with a HFD, SCD, or HCD. (F) Hepatic mRNA levels of the NADPH oxidase subtypes p47phox, p67phox, p40phox, and p22phox in NAFLD mice after 16 weeks of dietary intervention. (G) Representative Western blot showing the expression of NOX2 subunits in the cytoplasm and membrane of the livers of NAFLD mice after dietary intervention for 16 weeks. (H) Representative Western blot and densitometric analysis of p47phox in the membrane and cytosol of AML12 cells at 12, 24, 48, 72, 96, 108, and 120 h after glucose treatment.(I) Representative Western blot and densitometric analysis of p-p47phox in the livers of NAFLD mice after 16 weeks of dietary intervention. (J) Representative immunostaining images showing the colocalization of gp91phox and p47phox in AML12 cells treated with different concentrations of carbohydrates. Scale bars, 20μm. All data are presented as the mean ± SD. The data were analyzed by Student’s t-test or one-way ANOVA. In (F), * represents the comparison with Sal. *P < 0.05,**P < 0.01, ***P < 0.001, ****P < 0.000 1. Error bars show the SD in all panels.

Fig. 3 (Continued)
3.5 Inhibiting NOX2 expression alleviates NAFLD and blocks fatty acid influx
To further clarify the role of high NOX2 expression in HCDmediated NAFLD exacerbation, p47phox, one of the subunits of NOX2 that is responsible for NOX2 activation and assembly [52] as well as sensing nutrient signals [53,54], was specifically knocked down in the livers of NAFLD mice (AAV-sh-p47phoxmice) (Fig. 4A). Mice were fed an equicaloric HCD or maintained on the HFD for 8 weeks after AAV or saline injection (Fig. 4B). During this time, a similar trend in weight loss was observed in mice fed the HCD, but mice maintained on the HFD showed a consistent increase in body weight regardless ofp47phox-knockdown (Fig. 4C). Relative liver weight, serum TG levels,and ALT were significantly decreased only inp47phox-knockdown mice fed a HCD, but no changes were observed in mice fed a HFD(Fig. 4D-4F). Consistently, fewer lipid droplets, a lower degree of fibrosis, and less inflammatory cytokine expression were observed in AAV-sh-p47phox-HCD mice than Normal-HCD mice and AAV-sh-Ctrl-HCD mice, and no significant changes were observed inp47phoxknockdown mice fed a HFD (Fig. 4G). These results demonstrate that NOX2 has a specific regulatory effect on HCD. Furthermore,fatty acid influx was inhibited inp47phox-knockdown mice fed a HCD(Figs. 4H, 4I), but there were no changes in cholesterol transport, and the VLDL-TG test also showed no difference in lipid efflux no matter in mice with the HCD or the HFD (Figs. 4J, 4K). In addition, the ROS marker 4-HNE was decreased in the livers of AAV-sh-p47phox-HCD mice, and there were no significant changes in mice fed a HFD,even whenp47phoxwas knocked down (Figs. 4L, 4M). In addition,the inflammatory factors NF-κB, IL-1β, and TNF-α showed the same trend (Fig. 4L), further suggesting that specific knockdown of hepaticp47phoxexpression could alleviate the increase in hepatic ROS and inflammation caused by HCD feeding.
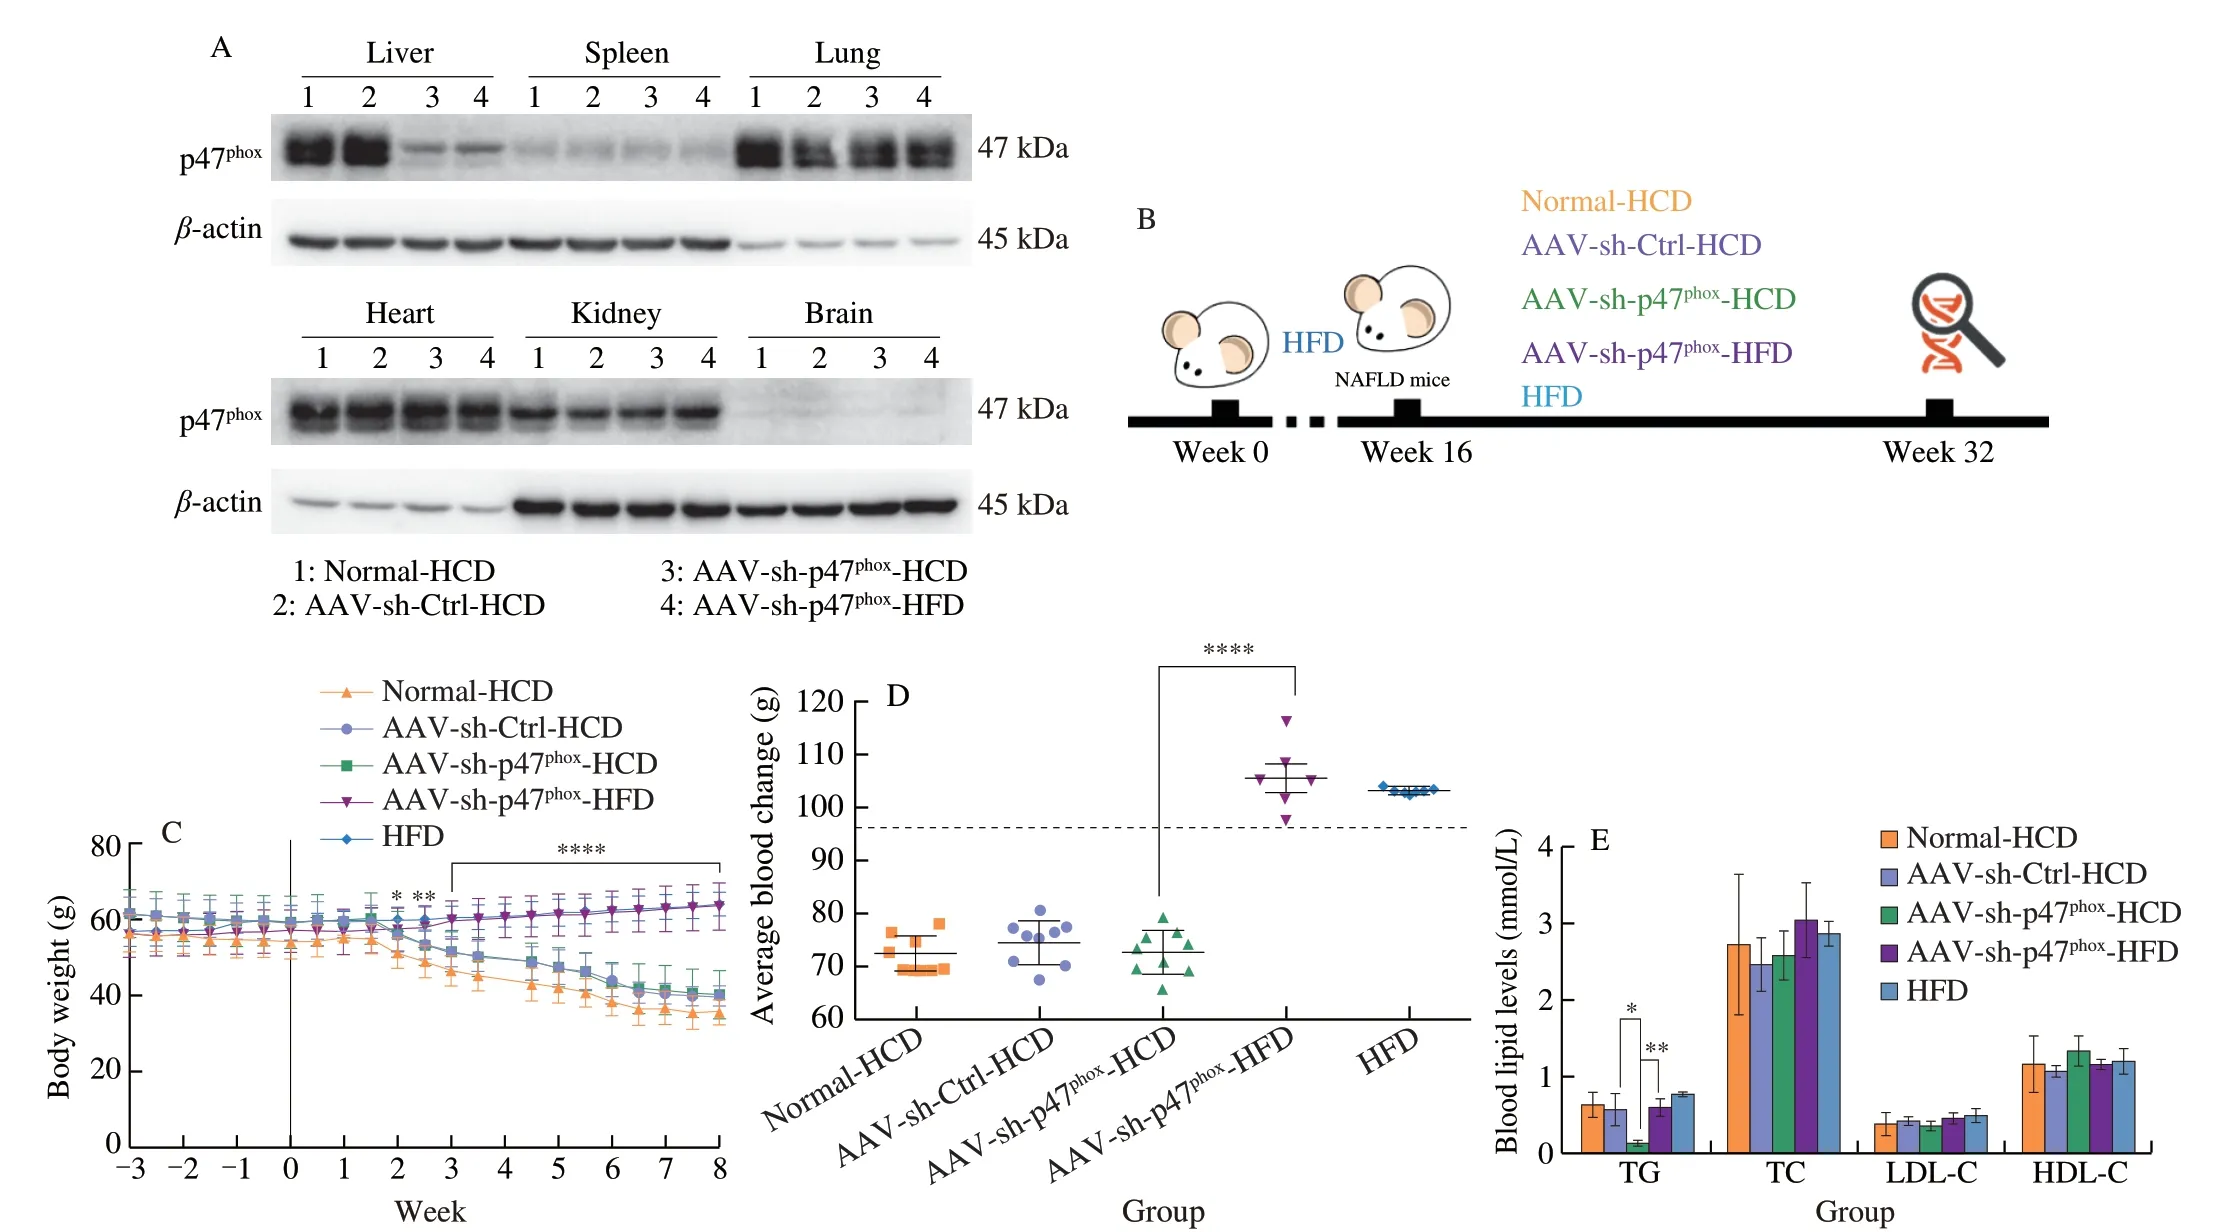
Fig. 4 Knockdown of p47phox impaired hepatic steatosis caused by high carbohydrate levels, which was accompanied by reductions in inflammation and fatty acid influx. (A) Representative Western blot showing p47phox expression in the main organs of NAFLD mice that were fed the HCD after being injected with normal saline (Normal-HCD), an empty AAV (AAV-sh-Ctrl-HCD), or AAV9-p47phox-RNAi (AAV-sh-p47phox-HCD) and in NAFLD mice that were maintained on a HFD after being injected with AAV9-p47phox-RNAi (AAV-sh-p47phox-HFD) for 3 weeks. (B) Schematic diagram of the experimental process. Six-week-old male C57BL/6J mice were fed a HFD for 16 consecutive weeks to establish the NAFLD mouse model. NAFLD mice were randomly divided into four groups. Specific treatments were as follows: NAFLD mice were fed the HCD after being injected with normal saline (Normal-HCD), empty AAV (AAV-sh-Ctrl-HCD), (AAV-shp47phox-HCD) and NAFLD mice were maintained on the HFD after being injected with AAV9-sh-p47phox (AAV-sh-p47phox-HFD). The diets were equal in calories and administered for 8 weeks. (C) Body weights of NAFLD mice fed a HCD or HFD after saline, empty AAV, or AAV9-sh-p47phox injection. (D) Relative liver weights were normalized to body weight in NAFLD mice fed a HCD or HFD for 8 weeks after saline, empty AAV, or AAV9-sh-p47phox injection. (E) Serum lipid levels of NAFLD mice fed a HCD or HFD for 8 weeks after saline, empty AAV, or AAV-sh-p47phox injection. (F) Serum ALT and AST levels (IU/L) after NAFLD mice were injected with saline, empty AAV, or AAV9-sh-p47phox and fed a HCD or HFD for 8 weeks. (G) Representative oil red O, H&E, and Masson staining images of the livers of NAFLD mice fed a HCD or HFD for 8 weeks after saline, empty AAV, or AAV9-sh-p47phox injection. Scale bars, 50 μm. (H) Hepatic FFAs,serum FFAs and the difference in NAFLD mice fed a HCD or HFD for 8 weeks after saline, empty AAV, or AAV9-sh-p47phox injection. (I) Hepatic mRNA levels of FABP1, FATP2, FATP5, and FAT/CD36 in NAFLD mice fed a HCD or HFD for 8 weeks after being injected with saline, empty AAV, or AAV9-sh-p47phox.(J) Hepatic mRNA levels of LDL-R and SR-BI in NAFLD mice fed a HCD or HFD for 8 weeks after being injected with saline, empty AAV, or AAV9-sh-p47phox.(K) Analysis of VLDL-TG secretion in NAFLD mice that were fasted overnight, followed by an intravenous injection of 500 mg/kg body weight Triton WR-1339.(L) Representative Western blot showing p47phox, 4-HNE, NF-κB (p65), TNF-α, and IL-1β in the livers of NAFLD mice fed a HCD or HFD for 8 weeks after being injected with normal saline, empty AAV, or AAV-sh-p47phox. (M) ROS production in the liver was examined with a DHE probe in NAFLD mice fed a HCD or HFD for 8 weeks after AAV injection and NAFLD mice of the same age that were maintained on a HFD. Scale bars, 100 μm. All data are presented as the mean ±SD. The data were analyzed by Student’s t test or one-way ANOVA. In (C), * represents the comparison with the AAV-sh-p47phox-HCD group. *P < 0.05, **P < 0.01,***P < 0.001, ****P < 0.000 1. Error bars show the SD in all panels.

Fig. 4 (Continued)
3.6 Inhibiting NOX2-derived ROS blocks high-starch carbohydrate-induced lipid accumulation.
ROS production is the main physiological function of NOX2,but NOX2 is not the only source of cellular ROS. Mitochondrial respiration was examined, and the results indicated that high carbohydrate levels do not alter mitochondrial respiration. A compensatory increase in mitochondrial respiration was observed only after knocking downp47phox(Figs. S3A, S3B), indicating that the increase in ROS caused by HCD was mediated by the catalysis of NOX2 but not mitochondrial oxidative phosphorylation.
GSK2795039, a specific inhibitor of NOX2, strongly inhibited the accumulation of lipids and inflammatory factor expression caused by HCD (Figs. S3C, S3D). Additionally, the increased expression of intracellular fatty acids and fatty acid transfer proteins caused by glucose mimic intervention was reversed by GSK2795039(Fig. S3E). In addition, DPI, which is an inhibitor of ROS production by flavoenzymes, has a broad spectrum of ROS inhibition. The effect of DPI showed a similar trend as GSK2795039 (Figs. S3C-S3E),which proved that NOX2 was the main source of HCD-induced ROS and that ROS produced by NOX2 played a crucial role in fatty acid transport and hepatic lipid accumulation.
3.7 Lipolysis in periWAT provides adequate fatty acids for hepatic lipid synthesis.
Furthermore, the source of fatty acids required for HCD-induced fatty acid transport is unclear. Fatty acids come from exogenous sources and endogenous synthesis. Because the HCD did not contain any lipids (Table S1), the exogenous supplementation could be excluded. Endogenous synthesis of fatty acids occurs mainly in the liver and adipose tissue [12,55]. Metabolomics sequencing showed no differences in the hepatic fatty acid synthesis pathway between the HCD and HFD groups (Figs. 2B, 2C). Therefore, we examined the changes in adipose tissues and found that periWAT was the only adipose tissue that exhibited relative weight loss in response to HCD feeding (Fig. 5A). Mice fed the HCD also showed smaller lipid droplets and lower lipolytic enzyme expression than mice fed the other diets (Figs. 5B, 5C).
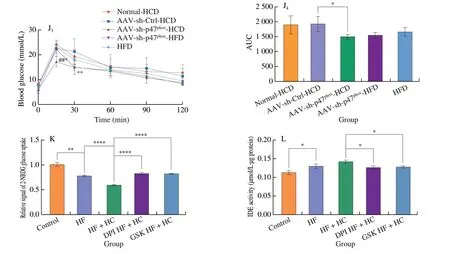
Fig. 5 (Continued)

Fig. 5 (Continued)

Fig. 5 Specific knockdown of p47phox in the liver decreased lipolysis in periWAT and improved insulin sensitivity in NAFLD mice. (A) Weights of major tissues and organs normalized by the body weight of NAFLD mice for 16-week dietary intervention. (B) Representative H&E images of periWAT from NAFLD mice after dietary intervention for 16 weeks. Scale bars, 100 μm. (C) The mRNA level of ATGL, which is responsible for lipolysis, in the periWAT of NAFLD mice after 16 weeks of dietary intervention. (D) Serum insulin levels (mg/mL) of NAFLD mice after dietary intervention with HFD, SCD, or HCD for 16 weeks.(E) Insulin tolerance test (E1, E2), glucose tolerance test (E3, E4) and pyruvate tolerance test (E5, E6) results of healthy mice at the same age and NAFLD mice after dietary intervention with a HFD, SCD, or HCD for 14-15 weeks. (F) Representative H&E images of the periWAT of NAFLD mice fed a HCD or HFD for 8 weeks after being injected with normal saline, empty AAV, or AAV9-sh-p47phox and NAFLD mice at the same age that were maintained on a HFD. Scale bars, 100 μm.(G) Hepatic mRNA level of ATGL in NAFLD mice fed a HCD or HFD for 8 weeks after being injected with normal saline, empty AAV, or AAV9-sh-p47phox and NAFLD mice at the same age that were maintained on a HFD. (H) Representative Western blot and densitometric analysis of ATGL expression in the periWAT of NAFLD mice fed a HCD or HFD for 8 weeks after being injected with normal saline, empty AAV, or AAV9-sh-p47phox. (I) Serum insulin concentrations of NAFLD mice fed a HCD or HFD for 8 weeks after AAV injection. (J) Glucose tolerance test (J1, J2) and insulin tolerance test (J3, J4) results of NAFLD mice fed a HCD or HFD for 8 weeks after being injected with normal saline, empty AAV, or AAV9-sh-p47phox. (K) Glucose uptake and (L) IDE activity of of AML12 cells treated with or without the ROS inhibitors DPI and GSK2795039. * represents the comparison with the Control AAV group, and # represents the comparison with the Control group. All data are presented as the mean ± SD. The data were analyzed by Student’s t-test or one-way ANOVA. *P < 0.05, **P < 0.01, ***P < 0.001,****P < 0.000 1; #P < 0.05, ##P < 0.01, ###P < 0.001. Error bars show the SD in all panels.
Insulin resistance has been reported to be the main cause of adipose tissue lipolysis [56]. Serum insulin levels were increased in mice fed a HCD (Fig. 5D), and insulin sensitivity and glucose tolerance were also impaired (Fig. 5E), indicating insulin resistance in mice fed the HCD. NOX2 was reported to lead to pancreatic β-cell failure and decreased insulin sensitivity [57]. To identify whether changes in insulin sensitivity and lipolysis are regulated by NOX2, relative indicators were examined inp47phox-knockdown mice. Reductions in lipolysis-like changes, inflammatory cytokine production, and lipolytic enzyme expression were observed in the periWAT ofp47phox-knockdown mice fed a HCD (Figs. 5F-5H),indicating resistance to HCD-induced lipolysis. Moreover, insulin levels were significantly decreased in HCD-fedp47phox-knockdown mice (Fig. 5I), and insulin sensitivity and glucose tolerance were greatly improved (Fig. 5J). ROS have been reported to further exacerbate insulin resistance [58], and the high level of ROS produced by NOX2 could promote HCD-induced insulin resistance, leading to the exacerbation of NAFLD by increasing fatty acid influx.
Next, glucose absorption capacity and IDE activity were examined using 2-NBDG and IDE activity kit in AML12 cells treated with DPI(ROS inhibitor) and GSK (specific NOX2 inhibitor). High-fat and high-glucose treatment significantly reduced glucose uptake, while DPI or GSK significantly ameliorated the impaired glucose uptake(Fig. 5K). Correspondingly, IDE activity was reduced in the DPIand GSK-treated groups (Fig. 5L). These results further indicated that ROS produced by NOX2 play a functional role in influencing insulin resistance induced by HCDin vitro.
3.8 HCD mediates the high expression of NOX2 via AMPKα1/p47phox.
AMPK is activated in response to glucose shortage and is suppressed in response to excess glucose [59-61]. In our study, AMPK activation was significantly suppressed in the livers of NAFLD mice and FL-AML12 mice in response to the HCD or glucose mimic treatment (Fig. 6A). We then investigated the relationship between AMPK and NOX2. When treated with the AMPK activator A-769662 and AICAR, AML12 cells showed reduced expression ofp47phox(Fig. 6B), which indicated that the activation of AMPK inhibited NOX2 expression. Moreover, knocking downp47phoxhad no effect on the activation of AMPK (Figs. 6C, 6D), showing that AMPK phosphorylation is an upstream event that regulates NOX2.

Fig. 6 AMPKα1 binds to p47phox to regulate NAFLD exacerbated by high-starch carbohydrates. (A) Representative Western blot and densitometric analysis of p-AMPKα (Thr172), AMPKα, and p-ACC (Ser79) in NAFLD mice after dietary intervention for 16 weeks. (B) Representative Western blot showing p47phox,p-AMPKα (Thr172), and AMPKα in AML12 cells treated with 30 mmol/L glucose and pretreated with or without the AMPK activator A-769662 or AICAR. (C)Representative Western blot showing p47phox, p-AMPKα (Thr172), and AMPKα in NAFLD mice fed a HCD after AAV injection for 3 weeks. (D) Representative Western blot showing p-AMPKα (Thr172) and AMPKα in AML12, si-p47 and si-control cells. (E) Co-IP assay analysis and densitometric analysis of the interaction of p47phox with AMPKα1 and AMPKα2 in NAFLD mice after dietary intervention for 16 weeks. All data are presented as the mean ± SD. The data were analyzed by one-way ANOVA. *P < 0.05, **P < 0.01, ***P < 0.001, ****P < 0.000 1. Error bars show the SD in all panels.

Fig. 6 (Continued)
Previous studies have not clarified whether there is an interaction between AMPK and NOX2 in the liver. Moreover, since both AMPK and NOX2 are multisubunit proteins, it is unclear whether these subunits interact. The Co-IP results showed that p47phoxinteracts with both AMPKα1 and AMPKα2 in the liver, but only the interaction of AMPKα1 and p47phoxwas increased in mice fed a HCD comparing to mice fed a HFD. Moreover, relative to the original levels of p47phox,more p47phoxwas phosphorylated (Fig. 6E), which resulted in more NOX2 assembly and function in mice fed a HCD.
4. Discussion
This study reported that an HCD can exacerbate NAFLD by increasing fatty acid influx in the liver, which is mediated by the high expression of NOX2. ROS produced by NOX2 were the main source of ROS during HCD feeding and promoted insulin resistance and periWAT lipolysis. In addition, the HCD induced high expression of NOX2 through the interaction between AMPKα1 and p47phox.
In previous studies, inflammation was often considered to be a symptom of NAFLD, and inflammation and lipid formation were difficult to observe due to the rapid induction of NAFLD in most experiments [62,63]. Due to the slow induction of NAFLD in response to the HCD, inflammatory cytokine production and vesicular degeneration were observed first in healthy mice fed an HCD, and then lipid deposition was observed (Fig. 1N). Similarly, the HCD appears to exert effects more quickly in mice with NAFLD, which is a condition that causes inflammatory damage, than in healthy mice(Fig. 1). Furthermore, based on inflammation levels in NAFLD mice,HCD rapidly induces liver injury, leading to faster deterioration of NAFLD. Even though knockdown ofp47phoxprevented the damage caused by an HCD and reduced the number of lipid droplets,vacuolar changes in hepatocytes still occurred (Fig. 4G), and these changes may be irreversible damage caused by inflammation. Our results suggest that inflammation could play an important role in the occurrence and development of NAFLD.
HCD consumption elevated NOX2 levels (Fig. 3). The Mediterranean diet is currently the only recognized dietary pattern that improves NAFLD [64]. In population-based studies, people who successfully lost weight on a Mediterranean diet had reduced serum levels of NOX2, reduced oxidative stress and improved arterial dysfunction [65]. In addition, it has been suggested that NOX2 activation is triggered by glucose transport and is independent of glucose metabolism [50]. This finding is consistent with our results that the level of NOX2 was increased in NAFLD mice fed a HCD,but there was no difference in hepatic glucose metabolism between NAFLD mice fed a HCD and those fed a HFD (Fig. 2A).
Inhibiting p47phoxprevented the increase in hepatic lipid levels and inflammatory damage induced by the HCD, but there were no improvements in HFD-fed mice (Figs. 4G, 4L). In HCD-fed mice,p47phoxknockdown decreased fatty acid transport and inflammation (Figs. 4H-4L), suggesting a specific regulatory effect on HCD-mediated lipid transport. The Seahorse results excluded the possibility that ROS produced by mitochondrial respiration were induced by glucose mimic intervention. Furthermore, DPI and GSK showed the same effect, indicating that the majority of HCD-induced ROS come from the catalysis of NOX2. When NOX2 was inhibited,lipid deposition, inflammation, and the increase in lipid transport caused by HCD were all reversed (Fig. S3), further confirming that ROS produced by NOX2 mediated fatty acid influx and hepatic inflammation and that ROS could be a second messenger to mediate the function of NOX2.
The HCD induced insulin resistance, which was more severe than that induced by the HFD (Figs. 5D, 5E). On the one hand, ROS accumulated during insulin resistance, and the high level of NOX2-induced ROS could promote insulin resistance. On the other hand,insulin is the main component of lipolysis. According to the sources of fatty acids, we excluded exogenous intake and fatty acid synthesis from the liver; thus, adipose tissue lipolysis was the only source of fatty acids. Interestingly, only periWAT showed increased lipolysis(Figs. 5A-5C), which suggests that lipolysis occurs in specific adipose tissue; this will be further investigated in our follow-up work.
In summary, our study systematically investigated the effect of an HCD on NAFLD and found NOX2 was a specific regulatory factor that exacerbated NAFLD by increasing fatty acid influx, which is different from the effect of simple sugars. In addition, the binding of AMPKα1/p47phoxwas necessary for the HCD-induced high expression of NOX2.
A large number of studies have shown that carbohydrates can be used as signaling molecules to regulate biological activities,but digestion of the different types of carbohydrate, the metabolic pathways and the regulatory mechanisms are not the same.
From the perspective of phenotypic effects, different types of carbohydrates exert different effects on the body. In a population study in Japan, 29 076 male residents were followed for 16 consecutive years, and starch intake was inversely proportional to the total mortality rate, while glucose, fructose, sucrose and maltose intake were positively correlated with the total mortality rate [66].In addition, some studies have shown that body weight gain is only related to sucrose and fructose intake but not starch intake [67],indicating that different types of carbohydrates have different effects on the body.
From the perspective of digestive process, starch is a high molecular carbohydrate formed byα-glycosidic bonds after the dehydration of glucose. The basic constituent unit of starch isα-Dglucopyranose, which does not contain fructose or lactose. Therefore,based on the material composition of starch, like maltose, starch only participates in glucose metabolism in the body [68]. Starch digestion depends on activities in the mouth, stomach and small intestine.α-Amylase, pancreatic amylase,α-glucosidase andα-critical dextrin act to completely decompose glucose [69]. Because starch must be digested by enzymes in saliva and the gut, it is a slower energy release process than that of simple sugar, which is broken down and absorbed directly by the body and makes you feel fuller for longer. In addition,based on the metabolic characteristics of starch, it has a lower glycemic index (GI) than simple sugars; that is, rate of blood glucose increase after eating is slower than that of simple sugars [70,71].
From the perspective of regulatory mechanism, glucose intake significantly affects lipid metabolism in the liver. Multiple studies have shown that glucose intake promotes fat synthesis and inhibits fatty acid oxidation, and this conclusion has been verified in many species, such as nematodes, mice, and humans [72]. These effects manifest as increased expression of ChREBP [73] and sterol regulatory element binding protein 1c (SREBP-1c) [74]. Upregulated acetyl-CoA carboxylase (ACC) [75], fatty acid synthase (Fasn) [76], longchain fatty acid family member 6 (encoded by Elovl6) and Scd1 [77]are downstream in the de novo lipogenesis pathway. Glucose also promotes the expression of enzymes associated with glycolysis, such as G6PC [78]. In addition, glucose inhibits lipid clearance pathways associated with lipid metabolism, such as the fatty acid β oxidation pathway [79,80]. Metabolomics analysis showed that glucose intake induced CPT1A methylation and thereby reduced the risk of metabolic disease [81].
However, none of these enzymes regarding to lipid metabolism progress were observed changing in the exacerbation of NAFLD mediated by high-starch carbohydrates. A HCD does not affect lipid metabolism in the liver, and according to current reports, glucose affects the expression of the glucose transporters SGLT1, SGLT2 [82],GLUT10 [83] and GLUT1 [84], but there have been few convincing studies on the effect of fatty acid transporters. Combined with liver metabolomics analysis, we showed that the high-starch diet caused intrahepatic lipid accumulation due to a further increase in fatty acid transport into the liver. However, this effect was not related to liver metabolism pathways.
In general, the differences between starchy carbohydrates and simple sugars could be summarized in 3 ways. Starch is the main component of staple foods that makes up a large part of the daily diet, and it has the characteristics of slow outcomes and few effects.However, free sugars are often not a fixed long-term intake, and their effects on the body are often acute. In terms of digestion, starch has more complicated digestion than free sugar, which results in lower GI and satiety. In terms of its effect on metabolism, free sugars have an effect on liver lipid metabolism pathways, including the glycolysis,de novo lipid synthesis, fatty acidβ-oxidation, and regulatory factors such as CHREBP and SREBP1c. However, starch interferes with liver lipid accumulation by increasing fatty acid transport without affecting liver metabolism.
Conflicts of interest
The authors declare no competing interests.
Acknowledgments
This work was financially supported by grants from the National Natural Science Foundation of China (82170873; 81871095), the National Key R&D Program of China (2018YFC2000304), and the Tsinghua University Spring Breeze Fund (20211080005).
Appendix A. Supplementary data
Supplementary data associated with this article can be found, in the online version, at http://doi.org/10.1016/j.fshw.2022.10.026.

- 食品科學與人類健康(英文)的其它文章
- Call for Papers from Journal of Future Foods
- GUIDE FOR AUTHORS
- Cross-protective effect of acid adaptation on ethanol tolerance in Salmonella Enteritidis
- Metabolomics and gene expression levels reveal the positive effects of teaseed oil on lifespan and aging process in Caenorhabditis elegans
- Ameliorative effect of Lacticaseibacillus rhamnosus Fmb14 from Chinese yogurt on hyperuricemia
- Study on the interaction between β-carotene and gut microf lora using an in vitro fermentation model