
Borana rangeland of southern Ethiopia: Estimating biomass production and carrying capacity using field and remote sensing data
2022-12-20 06:48:24YeneyehuFenethunYouYunXinWenXuYongDongWng
植物多樣性 2022年6期
Yeneyehu Fenethun , You Yun , Xin-Wen Xu , Yong-Dong Wng ,*
a National Engineering Technology Research Center for Desert-Oasis Ecological Construction,Xinjiang Institute of Ecology and Geography,Chinese Academy of Sciences, 818 South Beijing Road, Urumqi 830011, Xinjiang, China
b University of Chinese Academy of Sciences, Beijing,100049, China
Keywords:NDVI Biomass Carrying capacity Rangeland Borana Season
A B S T R A C T Assessing rangeland productivity is critical to reduce ecological degradation and promote sustainable livestock management. Here, we estimated biomass productivity and carrying capacity dynamics in the Borana rangeland of southern Ethiopia by using field-based data and remote sensing data (i.e.,normalized difference vegetation index (NDVI)). Data was collected from both rainy and dry seasons when biomass production was high and low respectively. Results of linear regression showed that both biomass production (R2adj = 0.672) and NDVI value (R2adj = 0.471) were significantly decreased from 1990 to 2019. Field data and NDVI values for mean annual biomass showed a significant linear relationship. The model accuracy in the annual relationship between the observed and predicted biomass values was strong (R2adj = 0.986) but with high standard error, indicating that the observed biomass production in the rangeland area was not in good condition as compared with the predicted one. This study suggests that, using NDVI data and field-based data in combined way has high potential to estimate rangeland biomass and carrying capacity dynamics at extensively grazed arid and semi-arid rangelands. And to use for estimating stoking rates and predicting future management techniques for decision making.
1. Introduction
Rangelands play an important role in livestock feeding in arid and semi-arid regions (Arzani et al., 2006) and also improve ecosystem services for the welfare of pastoral societies.Rangeland biomass production and status are mainly affected by patterns of rainfall, infestation rate of invasive alien species, anthropogenic activities,drought,and livestock grazing intensity(Kassahun et al.,2008; Lemus 2010). Further, rangeland forage biomass production and carrying capacity highly change in space and time due to variability of seasonal rainfall (Gommes et al., 2009). In southern Ethiopia,the Borana rangelands are used for communal grazing and extensive livestock production with natural grazing as the main feed base(Alemayehu,2006).Unfortunately,most rangeland areas of Ethiopia, including the Borana rangelands, have become degraded due to climate change and human activity (Angassa and Oba, 2010; Angassa, 2014; Dalle et al., 2015). Thus, estimating rangeland conditions(e.g.,forage biomass production and carrying capacity) is critical for the sustainable utilization of natural resources.
Recent studies have highlighted that the decline of both forage biomass production and carrying capacity of rangeland is driven by significant changes in species composition(Angassa and Oba,2010;Siraj and Abdella, 2018; Meshesha et al., 2019). In the Borana rangelands, the major factors that affect biomass production and carrying capacity are seasonal variability (temperature and rainfall),replacement of native grass species with unpalatable invasive plant species, soil degradation, grazing intensity and management practices (Snyman,1998; Van der Westhuizen et al., 2005; Arzani et al., 2008; Adisu, 2009; Tessema et al., 2011). Reduction of rangeland productivity may decrease livestock productivity, which in turn directly affects the socio-economic conditions of pastoralist communities within the region(Gong et al.,2015).In the past,local pastoralist commonly undertook seasonal migrations to overcome shortages in forage and water accessibility (Oba et al., 2008;Habtamu, 2013; Takele et al., 2014).
Estimating biomass production and carrying capacity potential can be used to guide rangeland management, including balancing livestock population with forage production (Herlocker, 1999;Ganskopp and Bohnert,2001;Arzani et al.,2006;Bikila et al.,2014;Haile,2017;Keno and Suryabhagavan,2018).Previous studies have assessed rangeland conditions by using a variety of indicators. For example, studies have estimated carrying capacity potential with vegetation productivity (Keno and Suryabhagavan, 2018). Most studies that have estimated vegetation status and biomass production in rangelands rely on vegetation indices using field sample collection (Casady et al., 2013; Tsalyuk et al., 2015). Long-term assessment of changes in both rangeland productivity and carrying capacity has become more effective by using remote sensing data(Bella et al.,2004;Baeza et al.,2010;Jia et al.,2016).However,no studies have combined field sample data and remote sensing data to estimate biomass production and carrying capacity dynamics of the Borana rangeland.
The most commonly used remote sensing satellite index to evaluate changes in biomass and carrying capacity across rangelands is the normalized difference vegetation index (NDVI)(Johansen and T?mmervik, 2014; Gong et al., 2015; Tsalyuk et al.,2015). Remote sensing data of vegetation indices, such as NDVI value,are strongly correlated with growing season,and biomass of the area (Lumbierres et al., 2017), and, thus, serve as good estimators of changes in aboveground biomass (Hamel et al., 2009).Previous studies have combined NDVI values with traditional field data to evaluate changes in biomass production and/or carrying capacity in the Patagonian steppes and in forests of eastern China(Gait′an et al.,2013;Gao et al.,2013).However,researchers have yet to determine the efficacy of NDVI as a predictor of biomass and carrying capacity dynamics in rangeland.However,no studies have combined field sample data and remote sensing data to estimate biomass production and carrying capacity dynamics of the Borana rangeland. However, previous studies have yet to determine the efficacy of NDVI as a predictor of biomass and carrying capacity dynamics in rangeland.Thus,estimating rangeland conditions(e.g.,forage biomass production and carrying capacity)is critical for the sustainable utilization of natural resources. The objective of this study was to assess changes in biomass production and carrying capacity in the Borana rangeland from 1990 to 2019.We also aimed to determine whether direct field measurements and NDVI values of biomass production and carrying capacity are directly related.Specifically, we asked the following questions: (1) Do both field data and remote sensing data reveal a significant change in biomass production in the Borana rangeland from 1990 to 2019?(2)To what extent does seasonal variation impact biomass production and carrying capacity potential? (3) Are field data and NDVI values directly correlated?
2. Materials and methods
2.1. Study area
The study was conducted in the Borana zone of Southern Ethiopia, specifically at Teltele district (Fig. S1) which covered an area of 15,430 km2of which 68% (10,492 km2) is rangeland (Billi et al., 2015). The site was selected because of it is one of the most arid rangeland parts of Borana zone and, therefore, the pastoral communities of this region are the most vulnerable to the rangeland degradation as a result of both human and climatic factors.It is located 666 km South of Addis Ababa,the capital city of Ethiopia.It lies approximately between 4°56′23′′and 5°49′21′′N and 37°41′51′′and 38°39′37′′E and mean elevation is about 496-1500 m,with a maximum of 2059 m above sea level. The annual mean temperatures vary from 28 to 33°C with little seasonal variation(Fig.S2).The rainfall in the region is characterized as bi-modal,i.e.,60% occurring from March to May, and 27% from September to November, and with high temporal and spatial fluctuations (Dalle et al., 2015). However, rainfall has recently decreased while temperatures have increased, which has resulted in a decline in biomass production.Potential evapotranspiration is 700-3000 mm(Billi et al.,2015).The soil in the study area includes red sandy loam soil,black clay,silt clay and silt.The major land covers of the Borana rangelands are shrub land, grassland, woodland, cultivated land,and exposed surfaces (Dalle et al.,2015).The rangeland composed of different vegetation types with the dominance of encroaching woody species, and those that frequently thinned out, include Senegalia mellifera, Vachellia reficiens and Vachellia oerfota(Coppock, 1994; Gemedo et al., 2005). According to the latest census conducted in 2017, a total 100,501 of population was reported in this district,with 51,670 men and 48,831 women.Cattle,goats, sheep, camels, mules, donkeys and horses are the main livestock species in the region.
2.2. Field based data collection
In 2019,we collected field-based data on biomass and livestock carrying capacity in the Borana rangeland study site. These data were used to capture grass species conditions during the dry season(December to February)and growth status during the rainy season(March to April). To assess long-term changes in rangeland conditions,we used published field-based data collected at the study site from 1990 to 2015(see Barrow,1991;Kebrom et al.,1996;Oba and Kotile, 2001; Gemedo et al., 2005; Angassa and Oba, 2010; Dalle et al., 2015).
Our sampling methods were the same as all previous studies.Briefly, one linear 5-km transect was assigned and six sampling plots (25 × 25 m2) were systematically placed at 500 m intervals.Within each plot three sub-plots (5 × 5 m2) were randomly assigned for a total of 18 subplots.Finally,five quadrants(1×1 m2)were assigned(for a total of 90)by throwing randomly to the back side in order to minimize any biases resulting from selective placement within each sub-plot for herbaceous and grass species sample collection. And all the above ground forage samples were harvested by using cutter and collected in paper bag. The fresh weight of forage sample was measured in the field with a scale.And samples were taken to Yabello Pastoral and Dry land Agriculture Research Center laboratory and oven dried for 24 h at 105°C to determine the biomass. Then the dry matter measured after 24 h dried and converted into kilogram per hectare (Kg ha-1), and the proper use factor (PUF) have been taken as 30% to calculate available forage(Sintayehu,2006;Meshesha et al.,2019).Thereafter,dry matter (DM) biomass and livestock carrying capacity were determined following procedures described by (Niguse, 2008). And the field data were collected with three replications for each season.
2.3. Satellite data
To monitor spatial and temporal conditions of rangeland vegetation, we used the annual average of third Generation Standard Difference Vegetation Index (NDVI3g) data(1990-2019). The satellite data was downloaded from the European Space Agency Climate Change Initiative (ESA CCI) Land Cover project and the National Advisory Committee for Aeronautics (NACA) team. The Digital Elevation model (DEM) used to extract data from the study area and remove the biased from our data in order to adopt the change analysis is summarized in Fig. S3. The general characteristics of the data from Landsat Thematic Mapper (TM) Enhanced Thematic Mapper Plus (ETM+)is presented in Table S1. Data derived from the Global Inventory Modeling and Mapping Studies (GIMMS) has 8-km grid resolution. To increase the resolution, we resampled data by using a 300-m resolution of a digital elevation model of Ethiopia. To reduce disturbance in NDVI grid cell values, such as those attributable to bare soil and sparsely vegetated areas, we simply used the maximum, minimum, and average annual mean values(Slayback et al., 2003; Wang et al., 2011). Vegetation maps of the Teltele district from 1990-2019 were obtained from the remote sensing data with a spatial scale of 1:100,000. To evaluate the relationship between NDVI values and forage biomass, we used the NDVI data sets with a grid resolution of 8 km.This allowed us to understand the differences between the available data sets and exact NDVI values obtained from 300-m resolution after resampling from the Landsat TM and ETM + images acquired in 1990, 1995, 2000, 2005, 2010, 2015 and 2019 for both dry and rainy season.
2.4. Livestock carrying capacity
To estimate carrying capacity in the Borana rangeland, we collected data on the total number and types of livestock in the region obtained from the district Livestock and Agriculture Office.The types of livestock include sheep,goat,cattle,donkey,horse and mules. The numbers of livestock consist of average values for each five-year interval from 1990 to 2019. We used the concept of tropical livestock unit (TLU)to calculate the carrying capacity (CC)of the range.In our case,we used a use factor of 30%(0.3);TLU was taken at 2.5% of the body weight as proposed for Ethiopia by Serunkuma and Olso (1998) and was calculated according to Derege et al. (2019).
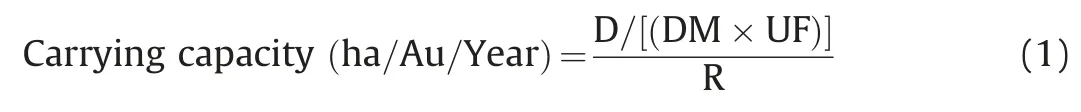
where,D = number of days in a year, DM= Total dry matter yield from the area (Kg ha-1), UF = utilization factors (0.3 in our case),R = daily dry matter requirement (Kg/TLU), 2.5% of bodyweight,which is 11.25 kg for an AU (450 kg grazing animal (cattle). The analysis included number of animals, and grazing rangeland area.And all group were converted to TLU.
2.5. Data analysis
Since, in the Borana rangeland rainfall is the main determinant for forage biomass production variability,regression analyses were carried out for the scatter diagrams linking biomass to NDVI for each season(dry and rainy)separately.In this method,time is the independent variable and the biomass of each season is the dependent variable;the slope of the regression of each season then is used to indicate the trend of biomass change across the period of interest(Penget al.,2012).The regressionmodel coefficientof determination(R2adj) was used to test the relationships between the NDVI value and biomass measured by field data. To evaluate the linkage between NDVI and biomass collected from 1990 to 2019, we used a linear regression model with Colville River Delta (CRD) (log10(biomass)=0.812+1.762(NDVI))to estimate the biomasspredicted(Kg ha-1) and observedbiomass= 17.17 + 0.676 (biomasspredicted)(Kyle et al.,2017).All statistical analyses were performed with Statistical Package for Social Sciences (SPSS). A positive slope value corresponds to an increasing trend in biomass change over the past 30 years,and a negative value corresponds to a decreasing trend in biomass change.The general flowchart of our project was presented in Fig.1.
3. Results
3.1. Yearly and seasonal rainfall,temperature and NDVI distribution in the study area
In the Borana rangeland,the quantity and temporal distribution of rainfall and temperature are directly linked with NDVI value in both the dry and rainy seasons(Fig.2).NDVI values increased when rainfall was high and temperature was low;NDVI values decreased when rainfall was low and temperature was high (Table S2). This pattern indicates that rainfall and NDVI are positively correlated,whereas temperature and NDVI value are negatively correlated, as NDVI is highly correlated with vegetation productivity or greenness.
3.2. Spatiotemporal dynamics of biomass and NDVI value
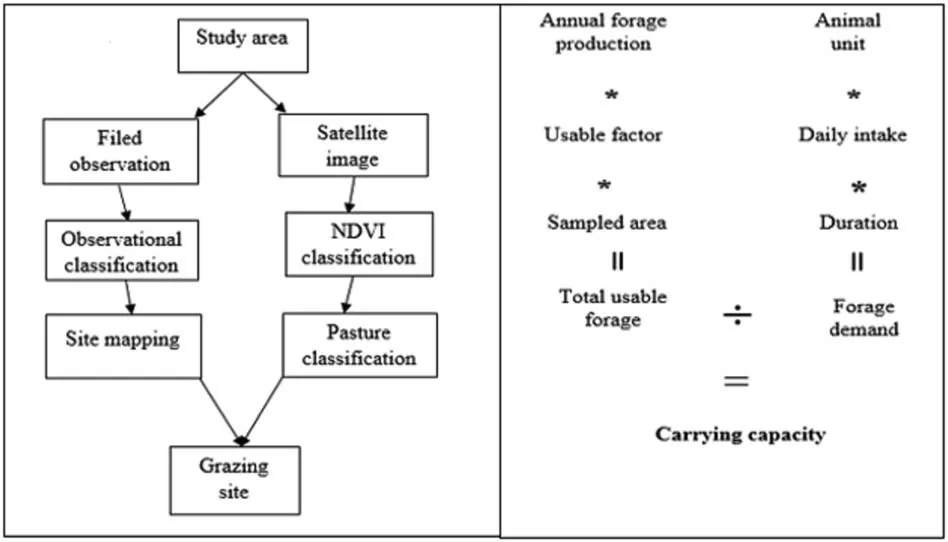
Fig.1. Schematic representation of the grazing capacity model for extensive grazing Borana rangeland.
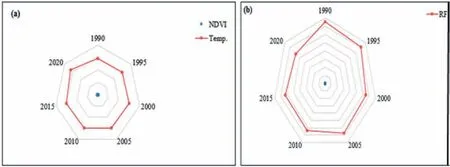
Fig. 2. The relation coefficient between yearly temperature and NDVI value (a), rainfall (mm) and NDVI value (b) of Borana rangeland for 1990,1995, 2000, 2005, 2010, 2015 and 2019. (Note: The blue color in both figure indicates NDVI values, Temp = temperature, RF = rainfall).
In general, field-based data and NDVI values indicated that biomass production of the Borana rangeland decreased from 1990 to 2019 (Table 1; Figs. 3 and 4). Field measurements indicate that biomass decreased by 57.9%in the rainy season and 49.2%in the dry season;between seasons,biomass decreased 25.2%.NDVI reflection over the same time period indicate that biomass production in the Borana rangeland decreased by 26.8%in the rainy season and 22%in the dry season; between seasons, biomass production decreased 17.9%.Both biomass and NDVI varied significantly within and across seasons. Field-based rangeland biomass estimation during the rainy season varied between 1456 and 3456 kg ha-1;during the dry grazing season, biomass was estimated to vary between 1906 and 968 kg ha-1.NDVI values during the rainy season ranged from 0.56 to 0.41;during the dry season,these estimations ranged from 0.41 to 0.31.
3.3. Relations between NDVI and field measured biomass
The relationship between NDVI and biomass production of the Borana rangeland was presented in Fig. 5. There was a significant linear relationship between NDVI(the satellite image of vegetation indices) and field (primary) collected biomass. The higher value was recorded during the dry season(R2adj=0.632)than during the rainy season (R2adj= 0.551) with annual mean linear relation(R2adj=0.746)based on the data obtained from 1990 to 2019 with five years interval (Fig. 6).
3.4. Livestock carrying capacity dynamics
We estimated spatiotemporal dynamics of carrying capacity in the Borana rangeland during each grazing season by using fielddata on useable forage biomass and NDVI values. Our estimations indicate that from 1990 to 2019 rangeland carrying capacity decreased by 137.4%(6.98 ha AU-1Y-1)during the rainy season and by 97.2%(5.44 ha AU-1Y-1)during the dry grazing season(Table 2).The estimated carrying capacity only focuses on home or domestic animals because data on wild animals living in the study area(e.g.,number, food preference, and daily usage) has yet to be determined.Consequently,our estimated carrying capacity is likely high.
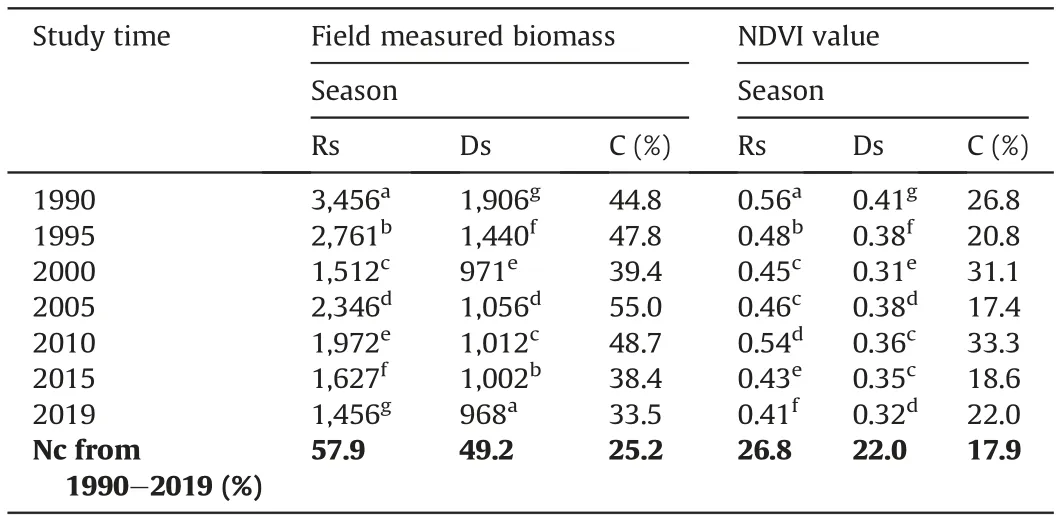
Table 1 Field measured biomass (Kg ha-1) and NDVI value statistics from 1990 to 2019.
3.5. Livestock population dynamics
Tropical livestock units (TLU) increased for all livestock found within the study area (e.g., cattle, goat, sheep, horses, mules, donkeys, and camels). The highest number of tropical livestock units was recorded in 2019 (Table 3).
4. Discussion
In this study,both field data and remote sensing data revealed a significant decrease in biomass production in the Borana rangeland from 1990 to 2019. Our field-based data indicated that rangeland biomass was highest in 1990 and that rangeland biomass was lowest in the 2000 and 2019 growing seasons. These findings are consistent with the NDVI values, which were highest in 1990 and lowest during the 2000 and 2019 growing seasons.This decrease in production biomass was likely due to environmental factors,including variations in temperature and rainfall induced by El Ni~no.Further,higher NDVI values confirmed greater biomass production,indicating that NDVI can be used to estimate the status of rangeland. However, abnormal distribution of rainfall during the 2010 rainy season was the reason for low biomass production,when the NDVI value was high as compared with 1995 and 2005. This indicates that high rainfall also can have a significant impact on normal vegetation growth and may decrease forage biomass production in the grazing rangeland. These findings are consistent with previous studies of rangeland in Morocco (Acherkouk et al.,2012; Hamid et al., 2018). In addition, biomass production in arid and semi-arid rangeland varied significantly both annually and across seasons. The variation in biomass production in the Borana rangeland is in line with the data reported from Senegal (Diouf et al., 2015), and is mainly due to the impact of both climatic and anthropogenic factors. Regression models were used to estimate spatiotemporal dynamics of biomass production in both seasons.Our findings indicate that field-based data on biomass during the dry season are strongly linked to NDVI values. This conclusion is consistent with results reported from California rangelands(Maˇskov′a et al.,2008)and the Qinghai-Tibet Plateau rangeland(Liu et al., 2017). One potential explanation for this relationship is that biomass production and vegetation greenness are highly linked to rainfall availability.Rainfall during the dry grazing season increases greenness and biomass production. Conversely, without rainfall,greenness and biomass production decrease during the dry seasons, mainly because of a slight reduction in rates of respiration.Thus, the linkage between rangeland productivity and NDVI strengthens the theory that NDVI provides an accurate estimation of photosynthetic activity over a large area of rangeland. In our study, field-based data and NDVI values differed in the extent to which biomass production decreased over the past 30 years. For example, field-based data indicated that biomass production decreased nearly 50%during the rainy seasons from 1990 to 2019;in contrast, NDVI values decreased only 22% during the same period. For remote sensing data, accurate estimation of rangeland dynamics using a single model are influenced by several factors,including on-the-ground spectral inversion data and the quality of the selected remote sensing image data. Satellite images can be affected by various factors, including cloud cover, bare areas, and high sun angle. These factors likely explain why linear regression models using NDVI values predicted biomass poorly (Bhatt et al.,2010;Diouf et al.,2015).Furthermore,validation was conducted for observed biomass and predicted biomass using an NDVI plot-based model derived by CRD. Spatiotemporal variation was especially focused in the biomass validation exercise.In the rainy season,the relationship between the observed and predicted biomass values was strong, although, the error was high. Similar results were observed in both the dry season and annually. This indicates that the observed biomass production in the rangeland area is not as good as the predicted biomass. Estimates of long-term changes in rangeland biomass can guide future planning, management, and policy-making decisions.Our study is the first attempt to estimate changes in biomass production using NDVI and field data.Furthermore, we have validated the observed and predicted rangeland biomass in Borana rangeland in southern Ethiopia. This research serves as a reference point for further research and management of the Borana rangeland as well as other rangelands.We recommend that future research focus on using an integrated approach to estimate arid rangeland dynamics. The carrying capacity of the Borana rangeland decreased from 1990 to 2019. This decrease in carrying capacity is likely due to both climatic and anthropogenic factors,including long-term overgrazing,infestation of invasive plant species,drought,livestock and human population growth, expansion of farming, and urbanization. The carrying capacity of grazing land was unevenly distributed in the rainy and dry seasons. In the rainy seasons, grazing land area was smaller, in other words,the carrying capacity was higher,than that in the dry seasons. Hence, overgrazing appears to be more common in the Borana rangeland during the dry season.This seasonal imbalance in grazing intensity can cause rapid degradation of rangeland (Zhou et al., 2005). Increased grazing intensity often leads to lower levels of aboveground plant biomass and general vegetation. Both the field survey and satellite image data of the Borana rangeland confirmed that aboveground plant biomass and general vegetation have decreased.High grazing intensity in rangeland with low levels of biomass may lead livestock to consume unpalatable invasive plant species, which can cause health problems for livestock and further affect the economy of pastoralists.
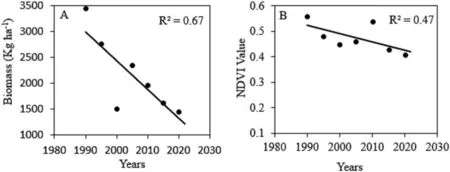
Fig. 3. Annual trends in biomass and NDVI at the Borana rangeland from 1990 to 2019: (A). Biomass derived from field data collection, (B) NDVI derived from Thematic Mapper remotely sensed imaging data.
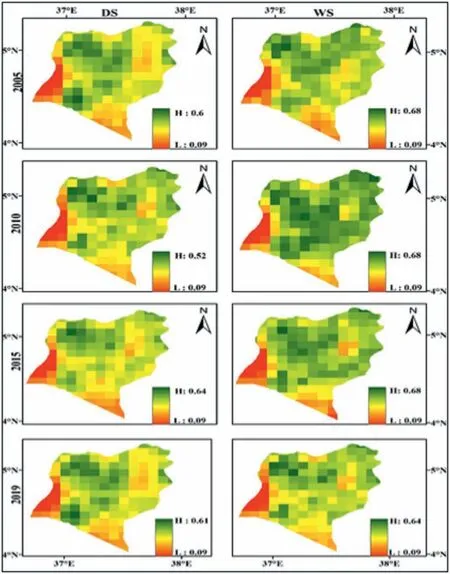
Fig.4. Spatiotemporal dynamics of vegetation greenness and estimation of biomass production using NDVI value from 1990 to 2019.DS=dry season,WS=wet season,H=high,L = low).
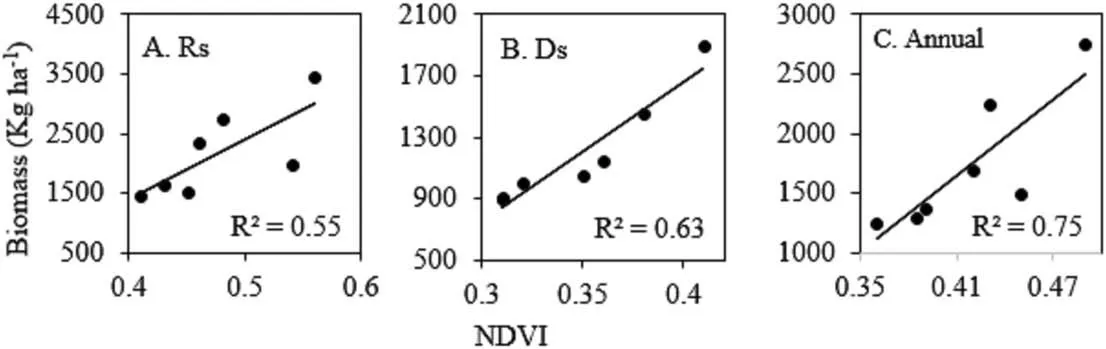
Fig.5. Linear regression model relation of field measured biomass (Kg ha-1)and NDVI values: (A)rainy season,(B) dry season and (C)annual.Ds=dry season, Rs=rainy season from 1990 to 2019.
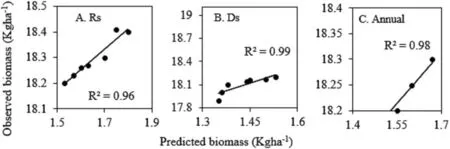
Fig. 6. Relationship between observed biomass (Kg ha-1) and the predicted biomass (Kg ha-1) of Borana rangeland based on the model log10 (biomass) = 0.812 +1.762(NDVI),NDVI values were derived from Landsat data from 1990 to 2019: (A) during rainy season, (B) during dry season, (C) annual. Rs = rainy season, Ds = dry season.
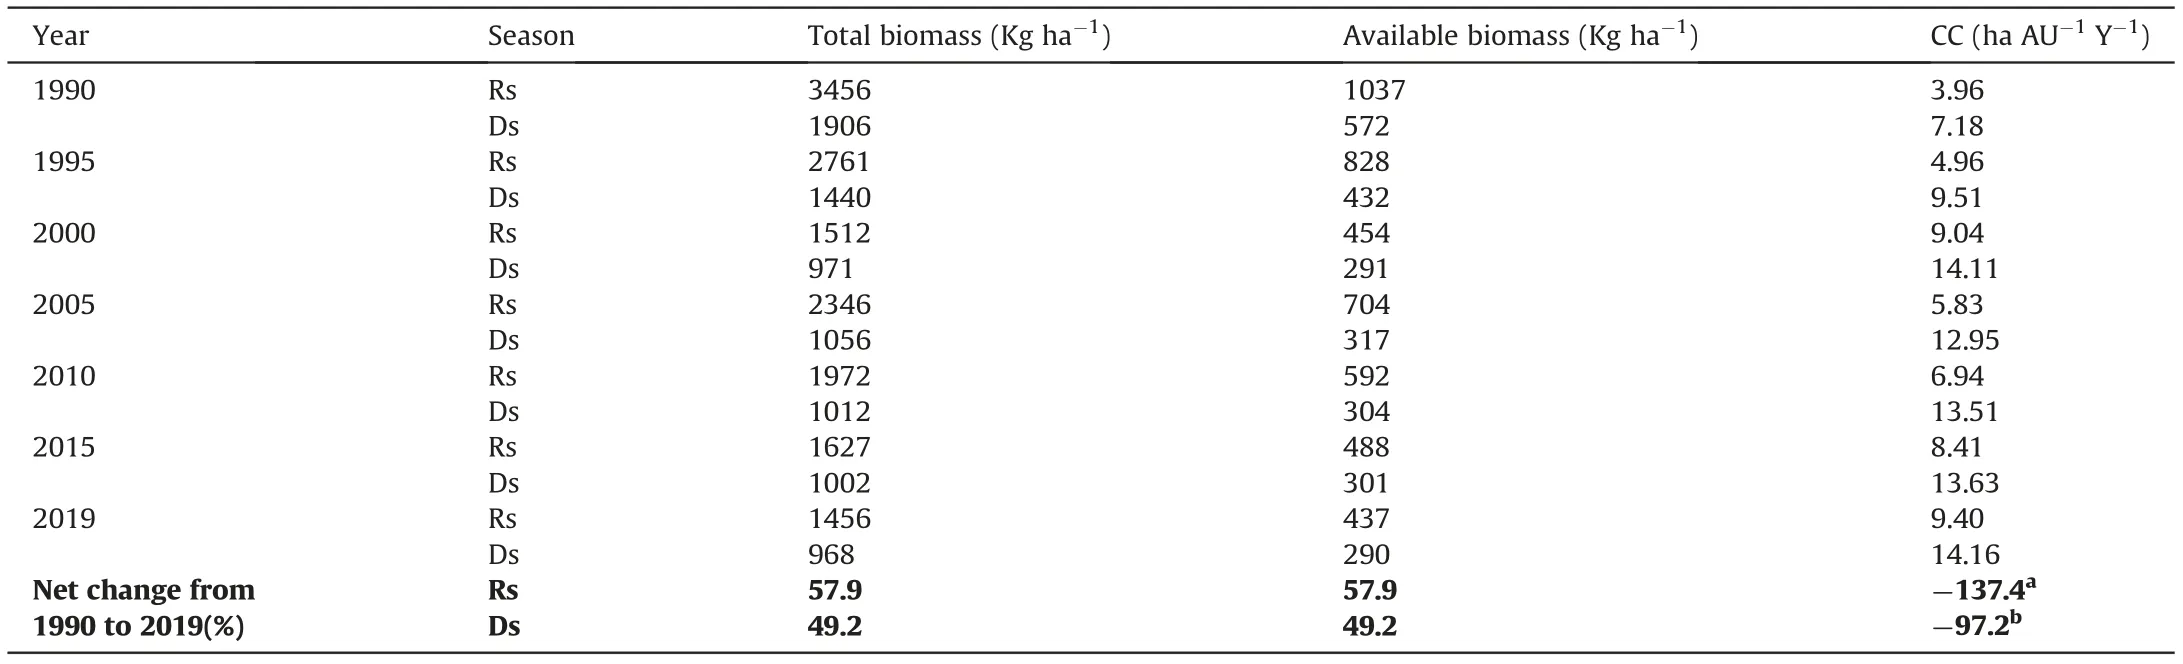
Table 2 Carrying capacity dynamics of Borana rangeland from 1990 to 2019.

Table 3 Livestock population and feed requirements dynamics in Borana rangeland.
We found that for the last 30 years rangeland biomass production was inversely related to the size of the livestock population.Specifically, as stated earlier, rangeland biomass production decreased from 1990 to 2019,whereas the livestock population and demand for feed increased significantly.Overall,rangeland biomass production did not meet the feed requirements of the livestock,which resulted in overgrazing that, in turn, acted as the primary driver of rangeland degradation in the study area. These findings are consistent with assessments of the Borana rangeland(Solomon et al., 2007). Thus, adjusting grazing intensity with carrying capacity during the grazing season is urgently needed. Balancing livestock type with vegetation composition is often economically advantageous to stocking with a single livestock type (Bat-Oyun et al., 2016). Shortages in livestock forage lead to reduced livestock quality and prices.One potential side effect of these changes is that pastoralists may be forced to adopt alternative activities as a source of income, including cultivation of land, which will only further degrade rangeland.Thus,it is crucial to raise awareness and set appropriate policy and management strategies in terms of destocking and restocking livestock.
In general,when rangeland become severely degraded,not only the grass biomass and vegetation status, but the soil physicochemical properties also change (Wei et al., 2005). The current rapid degradation of the Borana rangelands will affect local pastoral communities and governmental agencies within the area and across Ethiopia. Our current assessment of the Borana rangeland shows that the primary factor in rangeland degradation is overgrazing. Thus, we strongly recommend that immediate and scientific management techniques and livestock balancing based on the rangeland biomass production potential and livestock feed preference be taken.
5. Conclusion
Our study demonstrates strong correlations between NDVI and field collected data and provides scientific basis information for understanding the Borana rangeland biomass and carrying capacity dynamics and the management and balancing of livestock with rangeland production potential.Results of both field and NDVI data showed significant variability on seasonal and annual biomass and carrying capacity of rangeland. This is due to both climatic and anthropogenic effects on the spatiotemporal distribution and vegetation status of rangeland. The overall biomass production in the Borana rangeland did not satisfy the feed requirements of Tropical Livestock Unit in the area. The rangeland dynamics evaluated from NDVI and field-based biomass data used to evaluate the general status of rangeland and further decision-making for management and sustainable utilization of rangeland.The current study was first attempt in validation of NDVI data in semi-arid Borana rangeland and can be used as a reference for others both regional and international researchers to conduct further study in other part of both arid and semi-arid rangeland of Ethiopia. In general,balancing the livestock grazing with rangeland forage production should be used for both economic and ecological sustainability of pastoralist livelihood and rangeland ecosystem. So spatiotemporal estimation of livestock number related with biomass production is suggested for future action.
Availability of data and materials
All the data generated or analyzed during this study are included in this published article and publicly available.The overall data included within this paper was generated by the authors from the satellite data,field collected sample,processing and laboratory analysis.
Author contributions
Available data collection, writing up and gap assessment and design was done by Y.F.,while editing,proofing,provide important advice as well as supervision of the whole work during this project were performed by Y.Y., X.X and Y.D.W.
Declaration of competing interest
The authors declare that they have no competing interests.
Acknowledgements
The authors wish to thank the University of Chinese Academy of Science (UCAS) and CAS-TWAS fellowship program that provide funding and the PhD Scholarship for the first author. They also acknowledge the African Great Green Wall Adaptation Technical Cooperation Research and Demonstration (2018YFE0106000), Science and Technology Partnership Program,Ministry of Science and Technology of China (Grant No. KY201702010), Integration and application of appropriate technologies for desertification control in Africa(Grant No.SAJC202108,and International cooperation and Exchanges NSFC (Grant No. 41861144020) financial support to do this paper and the CAS Key Technology Talent Program support.Our thanks also goes to the support of the“Tianchi doctor program”of Xinjiang Uygur Autonomous Region in 2020. We are deeply acknowledging the ESA CCI Land Cover project and the NASA team to provide remote sensing data. Also, our great thanks go to the local community and stakeholder of the Teltele district for giving us the basic information that are still the challenge for them for our next research step. Once again, Yabello Pastoral and Dryland Agricultural Soil Research Center deserve many thanks for providing us the laboratory and other facilitates while conducting our experiment.

- 植物多樣性的其它文章
- Plastome characteristics and species identification of Chinese medicinal wintergreens (Gaultheria, Ericaceae)
- Molecular cytogenetic study on the plants of Elymus nutans with varying fertility on the Qinghai-Tibet Plateau
- Seedling survival after simulating grazing and drought for two species from the Pamirs, northwestern China
- An ethnobotanical study of medicinal plants in Güce district,north-eastern Turkey
- Does the critically endangered Rhododendron amesiae deserve top priority for conservation?
- Fertile Woodwardia from the middle Eocene of South China and its implications for palaeogeography and palaeoclimate