
Amplification of Flood Risks by the Compound Effects of Precipitation and Storm Tides Under the Nonstationary Scenario in the Coastal City of Haikou, China
2022-12-09 03:21:40HongshiXuXiZhangXinjianGuanTianyeWangChaoMaDenghuaYan
Hongshi Xu · Xi Zhang · Xinjian Guan · Tianye Wang · Chao Ma · Denghua Yan ,4
Abstract In the context of climate change, coastal cities are at increased risk of extreme precipitation and sea level rise, and their interaction will aggravate coastal floods.Understanding the potential change of compound floods is valuable for flood risk reduction.In this study, an integrated approach coupling the hydrological model and copulabased design of precipitation and storm tides was proposed to assess the compound flood risk in a coastal city—Haikou, China.The copula model, most-likely weight function, and varying parameter distribution were used to obtain the combined design values of precipitation and storm tides under the nonstationary scenario, which were applied to the boundary conditions of the 1D-2D hydrological model.Subsequently, the change of the bivariate return periods, design values, and compound flood risks of precipitation and storm tides were investigated.The results show that the bivariate return period of precipitation and storm tides was reduced by an average of 34% under the nonstationary scenario.The maximum inundation areas and volumes were increased by an average of 31.1% and 45.9% respectively in comparison with the stationary scenario.Furthermore, we identified that the compound effects of precipitation and storm tides would have a greater influence on the flood risk when the bivariate return period is more than 50 years, and the peak time lag had a significant influence on the compound flood risk.The proposed framework is effective in the evaluation and prediction of flood risk in coastal cities, and the results provide some guidance for urban disaster prevention and mitigation.
Keywords Copula function · Flood risk · Haikou City · Nonstationary scenario · Urban hydrological model
1 Introduction
Floods are one of the most frequent natural hazards around the world, and cause significant damage to human lives and properties (Didovets et al.2019; Hu et al.2021; Tellman et al.2021).Coastal cities are more vulnerable to floods due to the concentration of population and property, and flood events are more frequently occurring in coastal cities owing to the compound effects of precipitation and storm tides (Shen et al.2019).In this study, compound floods refer to the simultaneous occurrence of precipitation and storm tides and the complex interplay of which leads to or exacerbates their impacts in coastal regions.Compared with floods caused by a single driver, compound floods are usually expected to result in more severe damage and greater impacts.For instance, typhoon Rammasun attacked Haikou, China, and brought heavy precipitation and high tides with daily precipitation of 509.2 mm and maximum storm tide of 3.83 m on 18 July 2014 and resulted in severe floods, and more than 800,000 people were affected.According to the Sixth Assessment Report of the Intergovernmental Panel on Climate Change (IPCC), sea-level rise and extreme precipitation exhibit an increasing trend in the changing environment, which directly impact the compound flood risk for coastal cities (Almar et al.2021).
Many scholars have investigated the compound floods caused by precipitation and storm tides based on statistical analysis and hydrological model.For statistical analysis, previous studies have evaluated the dependence and compound risk of precipitation and storm tides by copulas (Lian et al.2013; Moftakhari et al.2017; Xu et al.2019; Santos et al.2021), Bayesian networks (Couasnon et al.2018), bivariate logistic threshold-excess model (Zheng et al.2013), and other statistical methods such as threshold excess, point process, and conditional methods (Zheng et al.2014).For example, Xu et al.( 2019) adopted copula functions to explore the bivariate return period (RP) and failure probability of compound precipitation-storm tide events.Couasnon et al.( 2018) proved that considering the compound effect through building a copula-based Bayesian network was crucial for flood risk assessment in coastal cities.Numerous statistical analyses have reported the significant correlations between precipitation and storm tides at different spatial scales, such as global (Ward et al.2018; Lai et al.2021; Nicholls et al.2021), continental (Bevacqua et al.2019), national (Zheng et al.2013; Wahl et al.2015; Wu et al.2018; Fang et al.2021), and local (Svensson and Jones 2002; Svensson and Jones 2004; Lian et al.2013; Zheng et al.2014; Bengtsson 2016; Zellou and Rahali 2019), and flood risks would be severely underestimated if the dependence is ignored (Zheng et al.2014; Xu et al.2019).These studies mainly focused on the dependence, joint probability, and return period analyses, but have not directly given the inundation risk of compound floods, which could provide richer information for disaster risk reduction.
In recent years, increasingly more scholars have applied hydrological models to assess compound flood risks of coastal cities under different precipitation-storm tide combinations (Bass and Bedient 2018; Bilskie and Hagen 2018; Kumbier et al.2018; Mohanty et al.2020; Hsiao et al.2021; Wang et al.2021).Kumbier et al.( 2018) investigated the compound flood risk in an estuary of Australia by the Delft3D hydrodynamic model, and found that the inundation area would be underestimated by 30% and the average inundation depth would be underestimated by 0.34 m if the combined effect was not considered.Hsiao et al.( 2021) built a coastal flooding model by coupling SCHISM and COSFlow models, and pointed out that the maximum inundation area would increase 70% as a result of the combined effect of precipitation and storm tides for a 50-year flood in the coast of Taiwan Island.These studies can provide more practical information (for example, inundation areas, inundation volumes, and so on) for compound flood management.
However, there are still some challenges for compound flood analysis.First, hydrological models are a useful tool for evaluating compound flood risk, but they usually take specific frequency precipitation (for example, RP = 50 years) and specific storm tides (for example, multi-year average value) as the boundary conditions (Lian et al.2017; Shen et al.2019; Mohanty et al.2020; Hsiao et al.2021) instead of the combined design values of precipitation and storm tides, thus ignoring correlations and joint distribution characteristics between precipitation and storm tides, which may not provide a comprehensive understanding of the compound flood risk.Second, the nonstationary scenario of precipitation and storm tides can aggravate the inundation risk of compound floods, but few studies have focused on the change of bivariate RPs, design values, and compound flood risk of precipitation and storm tides under the nonstationary scenario.Understanding the potential variability of compound floods is valuable for deciding whether further assessment of disaster risks is needed.Therefore, tackling these challenges is meaningful for accurately quantifying and understanding the potential impacts of compound floods under the nonstationary scenario.
In this study, we proposed an integrated framework for evaluating compound flood risks by coupling a hydrological model and copula-based design of precipitation and storm tides for coastal cities.The 1D-2D hydrological model is established by Personal Computer Storm Water Management Model (PCSWMM).The combined design values of precipitation and storm tides are obtained by the varying parameter distribution (VPD) model, copula model, and most-likely weight function under the nonstationary scenario.The remaining part of the article is organized as follows: Sect.2 presents materials and methods, including copula-based design method of precipitation and storm tides, urban hydrological models, and a description of the case study.The change of compound flooding risk under nonstationary scenario is reported and discussed in Sect.3.Finally, conclusion is provided in Sect.4.
2 Materials and Methods
This section introduces the integrated method based on the copula-based design of precipitation and storm tides and a 1D-2D hydrological model for evaluating compound flood risks, and the proposed method is applied in a coastal city—Haikou, China.
2.1 Copula-Based Design of Precipitation and Storm Tides under the Nonstationary Scenario
In this study, the copula model, most-likely weight function, and varying parameter distribution are used to obtain the combined design values of precipitation and storm tides under the nonstationary scenario.2.1.1 Bivariate Copula Models of Precipitation and Storm Tides
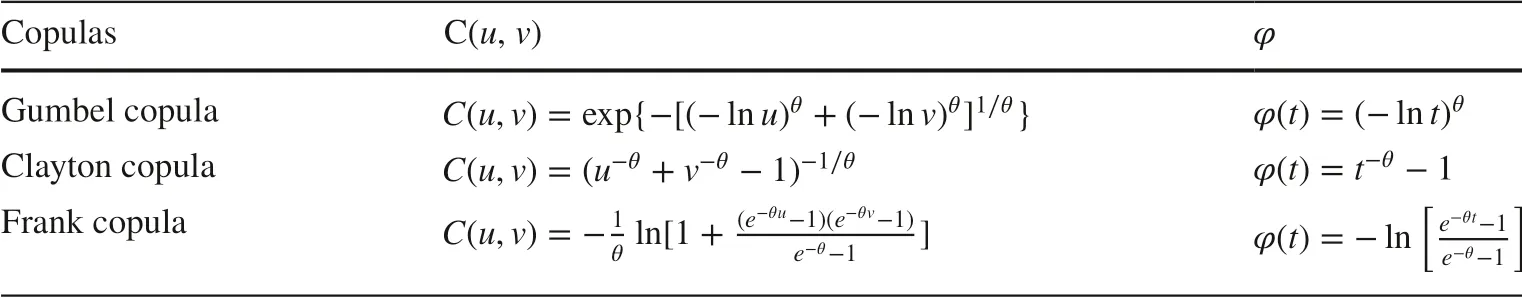
Table 1 Archimedean copulas and generators φ
Copula functions can well depict the dependence structure between variables, and are not restricted by types of marginal distributions.Thus, it is widely used in multivariate analysis.In this study, the joint distribution of precipitation and storm tides is established by copula functions.According to Sklar theorem (Sklar 1959), if the marginal distributionsu=F(H) andv=F(Z) are continuous, the copula modelC(u,v) can be described as follows.
whereF(H) andF(Z) are marginal distributions of precipitation and storm tides, respectively; andHandZare variables of precipitation and storm tides, respectively.
In this study, marginal distributions of precipitation and storm tides are fitted by six univariate functions (that is, Lognormal, Normal, Weibull, Gamma, GEV, and Gumbel functions).The joint distribution is established based on three Archimedean copulas (Table 1).The parameters of marginal and joint distribution functions are estimated through the maximum likelihood method (Prescott and Walden 1980).The goodness of fit is tested by the Kolmogorov—Smirnov (K—S) test, and the ordinary least squares criteria (OLS) is used to select the best-fit function (Xu et al.2019).
Three bivariate RPs of precipitation and storm tides, that is Kendall RP (T k), co-occurrence RP (T∩), and joint RP (T∪), are analyzed under the changing environment and stationary scenario.T∩,T∪, andT kare described as follows (Xu et al.2019).whereKc(p) is the Kendall distribution function (Genest et al.2006);p∈(0,1) is a probability level;I(·) is an indicator function that equals to 1 when the expression is correct and equals to 0 otherwise; and (h,z) is the combined value of precipitation and storm tides.
The traditional multivariate return period (that is, joint RP, co-occurrence RP) may have a deviation in the identification of the dangerous region (Salvadori et al.2011; Xu et al.2019).For Kendall RP, the dangerous region is divided by the joint probability value, thus avoiding the overestimation or underestimation of dangerous region, and the bivariate RP of each combined event can be described reasonably.Therefore, it was adopted in this study to calculate the boundary conditions (that is, the design values of precipitation and storm tides) for the urban hydrological model.
2.1.2 Varying Parameter Distribution Model
Traditional frequency analysis assumes that environmental factors will not change the distributions of hydrologic variables.However, due to the changing environment, the intensity and frequency of extreme precipitation and storm tide events exhibit nonstationary changes (Jongman et al.2012; Almar et al.2021).To cope with the influence of these changes, researchers have developed various methods for nonstationary hydrological frequency analysis.The most common approach is to assume that the parameters of the distribution function vary with time (Mailhot and Duchesne 2009; Villarini et al.2010; Gilroy and McCuen 2012; López and Francés 2013; Read and Vogel 2015; Xu et al.2020; Nie et al.2021; Ossandón et al.2021), that is the varying parameter distribution (VPD) model.In general, there are three assumptions for the VPD model (Mailhot and Duchesne 2009): (1) the average value (that is, location parameter of distributions) changes, but the variability of distributions (that is, scale parameter and shape parameter) remains unchanged; (2) the variability of distributions changes, but the average value remains unchanged; (3) both the average value and variability of distributions change over time.
In this study, the location parameter is assumed to be a function of time under nonstationary scenario (Mailhot and Duchesne 2009; Nie et al.2021), since long-term observations are lacking for determining the scale parameter (Cheng et al.2014; Nie et al.2021).Taking the commonly used GEV (generalized extreme value) function as an example, the distribution under the nonstationary scenario can be described as follows.
whereμ,α, andkare the location, scale, and shape parameter of the GEV function under the changing environment;μ0,α0, andk0are the location, scale, and shape parameter under the stationary scenario; andμ1is the increase rate of the location parameter over time.
2.1.3 Most-Likely Weight Function
The combined design of precipitation and storm tides is the boundary condition for urban flood simulation in coastal cities.Generally, the copula models in Sect.2.1.1 are used to calculate the bivariate RP of precipitation and storm tides first, and then the bivariate design method is used to derive the combined value for a specific return period.Commonly used bivariate design methods include the most-likely weight function (Salvadori et al.2011; Tu et al.2018) and equalized frequency method (Li et al.2013).In this study, the most-likely weight function is adopted to determine the combined design value of precipitation-storm tides according to the maximum product of the joint and marginal probability densities.The calculation formulas are as follows.
where (h m,z m) is the selected combination for the design values of precipitation and storm tides against flooding;c(uh,vz) is the probability density function of the copula function;fH(h) andfZ(z) are the probability density functions of precipitation and storm tides respectively; andare the inverse functions of the marginal distribution.
2.2 Urban Hydrological Model Coupled 1D and 2D
In the study, the PCSWMM is adopted to simulate the hydrological and hydraulic processes of urban floods, which is developed by Computational Hydraulics International (CHI), Canada and widely used to establish urban hydrological models (Ahiablame and Shakya 2016; Paule-Mercado et al.2017; Xu et al.2018; Xu et al.2020; Qi et al.2021).The PCSWMM model includes a 1D drainage model and a 2D floodplain model.The 1D drainage model is used to simulate 1D conduit flow and river flow, and is composed of drainage conduit, 1D inspection wells with storage and connection functions, and outlets.The hydraulic motion in the drainage conduit is simulated by the dynamic wave method.The continuity and momentum equations are described in Eqs.14 ? 15.The 2D floodplain model can simulate unsteady 2D surface flow above ground, and is composed of 2D inspection wells and 2D grids.The 2D inspection wells are generated based on the digital elevation model (DEM) of the study area, and the water depth of the 2D inspection wells is taken as the surface inundation depth in the 2D grid.The 1D drainage model and 2D floodplain model are integrated by the orifice connection method (CHI 2014).The schematic diagram of the 1D-2D coupled hydrodynamic model is shown in Fig.1.When the water depth of the 1D inspection well is greater than the well depth, the water flow in the 1D inspection well can enter the 2D inspection well through the orifice, thereby realizing the coupling of the 1D drainage model and the 2D floodplain model.
whereAis the section area of conduits;Qis the discharge;lis the distance of conduits;h Lis the local energy loss of every meter conduit;gis the gravity acceleration;S fis the friction slope; andHis the pressure head.
The infiltration process can be simulated by the Horton model, the GreenAmpert model, and the runoff curve numerical method in PCSWMM.Based on the specific circumstances of the study area—for example, the study area is a small catchment and there is not enough soil data—the Horton model was used to calculate infiltration, since it is suitable for small catchments and areas wheresoil data are lacking.The equation of Horton model is described as follows.
wheref pdenotes the infiltration capacity into soil, mm/s;f∞denotes the minimum or equilibrium value off p(att s= ∞), mm/s;f0denotes the maximum or initial value off p(att s= 0), mm/s;t sdenotes the time from the beginning of a storm, s; andk ddenotes the decay coefficient, s ?1 .
2.3 Case Study
The integrated approach proposed in this study is demonstrated and applied in Haidian Island in the north of Haikou City—the capital city of Hainan Province in the northwestern part of the South China Sea, and a key free trade port developed by the Chinese government (Fig.2).in October 1996 with heavy precipitation (294.2 mm) and high tide (3.65 m).
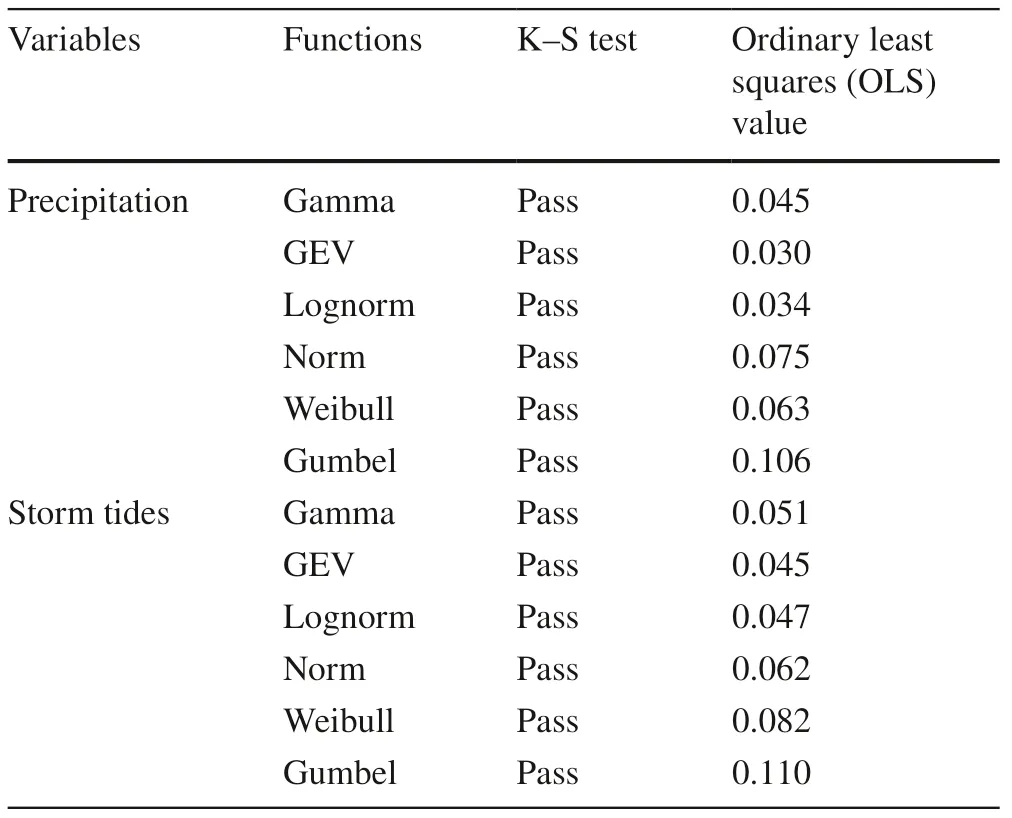
Table 2 Goodness of fit for the Log-normal, normal, weibull, gamma, GEV, and Gumbel functions
The data used in the study include two parts.The first part is for the statistical model of precipitation and storm tides.Daily precipitation data were accessed from the China Meteorological Administration Meteorological Data Center.1http://data.cma.cn/data/cdcdetail/dataCode/A.0012.0001.htmlDaily storm tides during 1974 to 2012 in Haikou station were obtained from the Haikou Municipal Water Authority.The annual maximum daily precipitation and its corresponding storm tides during 1974 to 2012 are applied to build the marginal and joint distributions of precipitation and storm tides.The second part of the data is used to establish the hydrological model.The DEM data were obtained from the Institute of Geographic Sciences and Natural Resources Research, Chinese Academy of Sciences.22 http://www.resdc.cn/Default.aspxThe conduit, inspection well, and river data were obtained from the Haikou Municipal Water Authority.The calibration data (that is, inundation depths) in different observations were obtained
2.3.1 Study Area and Data
Haidian Island is close to the Qiongzhou Strait and is usually affected by typhoons at an average of 4—5 times a year.The typhoon events of Rammasun and WILLIR brought the most severe floods in Haikou in recent years.Typhoon Rammasun occurred in July 2014 with heavy precipitation (505.5 mm) and high tide (3.83 m), and WILLIR attacked Haikou through field investigation during Typhoon Rammasun on July 2014.
2.3.2 Marginal Distributions of Precipitation and Storm Tides
Six commonly used functions (Log-normal, Normal, Weibull, Gamma, GEV, and Gumbel) are explored to fit the marginal distributions of precipitation and storm tides.Table 2 shows the goodness of fit for the six functions.It indicates that all functions pass the K—S test.The GEV distribution is chosen as the best-fit function of precipitation and storm tides due to the smallest ordinary least squares (OLS) values.The fitted maps of the six functions are shown in Fig.3, and the correlation coefficients of empirical and theoretical probability calculated by the GEV function are 0.996 and 0.990 for precipitation and storm tides, respectively.It indicates that the GEV function could be adopted for the marginal distributions of precipitation and storm tides.
As mentioned above, the marginal distributions of precipitation and storm tides are fitted by the GEV function under the stationary scenario, and the location parametersμ0= 122.51 and 2.35 respectively.In this study, the VPD model is used to determine the marginal distributions under the changing environment, and increase ratesμ1of precipitation and storm tides are 2.53 mm/year and 1.94 mm/year respectively based on the historical data from 1974 to 2012.Therefore, the marginal distributions of precipitation and storm tides under the nonstationary scenario can be described as Eqs.17 ? 20, respectively.
2.3.3 Urban Hydrological Model
In this study, the urban hydrological model is established by PCSWMM.First, the conduit distribution was generalized into the conduit model through geographic information system technology for simple data processing.The 1D drainage model consists of 2,667 inspection wells and 2,042 conduits (Fig.4).The study area was divided into 13 subcatchments according to the urban flood control and drainage planning of Haikou City (2013—2030) and the distribution of elevation, buildings, roads, and rivers in the study area.Then, a 2D floodplain model was established in PCSWMM, which was composed of 21,188 2D cells with a resolution of 25 m.The mesh type is hexagonal and the roughness is set as 0.085.
For coastal cities, the precipitation is discharged into the river channel through the ground and conduits, and then flows into the sea.When the heavy precipitation and high tide events occur at the same time, the drainage of the river channel is blocked by the high tide, causing the river water level to rise rapidly, which in turn causes river overflow and inundation.In order to simulate the effect of high tide level, the boundary conditions of the PCSWMM model are input for both precipitation and storm tide processes.The Wuxi Road Nullah, Baisha River, and Yawei River in the study area discharge directly into the sea, and the storm tide process is added at the outlets of the above rivers.The boundary conditions of precipitation and storm tides are calculated by the most-likely weight function in different RPs, and the temporal distributions of design precipitation and storm tides are the same as that of the rainstorm event on 18 July 2014 based on the severe flooding scenario (Xu et al.2018, 2020).The urban hydrological model is calibrated by the actual inundation data during Typhoon Rammasun on 18 July 2014.Figure 5 presents the calibration results of the urban hydrological model; the Nash-Sutcliffe Efficiency (NSE) equals to 0.725, indicating that the model has good simulation performance.
3 Results and Discussions
This section presents the results of this study and discussions, which include the bivariate copula model of precipitation and storm tides under the nonstationary scenario, the influence of the nonstationary scenario on the return period and combined design of precipitation and storm tides, and the change of compound flood risk under the nonstationary scenario.
3.1 Bivariate Copula Model of Precipitation and Storm Tides Under the Nonstationary Scenario
Three Archimedean copulas are explored to establish the joint probability distribution of precipitation and storm tides.The three copulas all pass the K—S test and the Gumbel copula is the most suitable function with the minimum OLS value of 0.039.The correlation coefficient of empirical and theoretical probability is 0.989, indicating the good fit of the Gumbel copula (see dots in Fig.6).
The Gumbel copula is also the best-fit model of precipitation and storm tides in the changing environment with
3.2 Return Period and Combined Design of Precipitation and Storm Tides Under the Nonstationary Scenario
In this section, we investigated the influence of the nonstationary scenario on bivariate RPs (that is, Kendall RP, co-occurrence RP, and joint RP) and the combined design of precipitation and storm tides.
3.2.1 Influence on the Return Period
Figure 8 presents the change of the univariate RP after considering the nonstationary scenario.Compared with the stationary scenario, the RPs of precipitation and storm tides under the changing environment are significantly reduced, with an average reduction of 49.5% and 10.3%, respectively.For instance, when the precipitation is 352.97 mm, the RP is 50 years under the stationary scenario and 24.64 years under the nonstationary scenario (in year 2030), with a reduction the minimum OLS value of 0.042.The comparison of the joint distribution between the stationary scenario and the changing environment are presented in Fig.7.As shown in the figure, the cumulative probability in the changing environment is higher than that in the stationary scenario, with the maximum increase of 37.9%.It indicates that the same combinations of precipitation-storm tides are more likely to occur in the changing environment.of 50.7%.It demonstrates that the same precipitation or storm tide event is more likely to occur under the changing environment, and the urban drainage designs that meet the current urban flood requirements may not meet future requirements under the nonstationary scenario.Therefore, it is essential to consider the impact of environmental changes on the design of precipitation-storm tides for coastal cities.
Figures 9, 10 and 11 exhibit bivariate RPs of precipitation-storm tides under the stationary scenario and a changing environment.Compared with the stationary scenario, the bivariate RP decreases significantly in the changing environment, with an average decrease of 34%.For a 50-year precipitation and 50-year storm tide event, the bivariate Kendall RP is 177.7 years under the stationary scenario, while it decreases to 119.2 years under the changing environment (see Fig.9).The co-occurrence RP (Fig.10) and joint RP (Fig.11) show similar changes, with a decrease of 13.3% to 45.7% and 8.9% to 55.1%, respectively.It indicates that the compound flood risk caused by precipitation and storm tides significantly increases when the impact of environmental changes is considered.
3.2.2 Influence on the Combined Design
The combined design of precipitation and storm tides are the boundary conditions of urban hydrological model in coastal cities.In this study, the most-likely weight function is adopted to obtain the combined design values corresponding to different RPs, and the influence of the nonstationary scenario on the combined design value is also analyzed.Figure 12 presents the contour plot of the Kendall RP, joint RP, and co-occurrence RP, and the combined design values of RP = 50 years under the stationary and nonstationary scenarios.As shown in the figure, it is clear that the design value of precipitation and storm tides gradually increases as the return period increases.Furthermore, the bivariate RP contour lines shift to the right under a changing environment compared with that under the stationary scenario.It indicates that the combined design values are significantly increased when considering the impact of the nonstationary scenario.For example, when the joint RP is 50 years, the design values of precipitation and storm tides under the stationary scenario and the changing environment are (393.70 mm, 3.90 m) and (445.20 mm, 3.94 m) respectively (see Fig.12 b), and the increase of precipitation and storm tide values are 13.08% and 1.03% respectively under the nonstationary scenario.Furthermore, two actual flood events (that is, Typhoon Rammasun and Typhoon WILLIR) are taken as the examples to further illustrate the influence of the changing environment.For example, the joint RPs of Typhoon Rammasun and WILLIR events are about 75 years and 16 years respectively under the stationary scenario, while they are about 55 years and 9 years respectively under the nonstationary scenario.It indicates that the compound flood events are more likely to occur in the changing environment.Ignoring the above influence may inappropriately characterize the coastal flood risk, and can lead to its underestimation.
3.3 Compound Flood Risk of Precipitation and Storm Tides Under the Nonstationary Scenario
Since the Kendall RP can describe the dangerous areas more accurately for multivariate scenario (Xu et al.2019), it is adopted to calculate the boundary conditions (that is, the design values of precipitation and storm tides) for the urban hydrological model.The inundation risk (maximum inundation areas, volumes, and depths) of compound floods under the nonstationary and stationary scenarios is presented in Sect.3.3.1.In addition, the influence of the combined effect of precipitation-storm tides on the coastal flood risk is explored by changing the boundary conditions of the urban hydrological model (for example, combined design or univariate design), and the result is exhibited in Sect.3.3.2.
3.3.1 Influence of the Nonstationary Scenario
As shown in Figs.13, 14, and 15, with the increase of the Kendall RP, the maximum inundation area, volume, and depth are all significantly increased.For instance, when the Kendall RP increases from 5 years to 500 years, the maximum inundation area increases from 0.84 to 3.82 million m 2 (under the stationary scenario).The maximum inundation areas and volumes under the nonstationary scenario are significantly higher than those under the stationary scenario, with an average increase of 31.1% and 45.9%, respectively.For example, the maximum inundation volume is 0.58 million m 3 with the RP = 50 years under the stationary scenario, while it is increased to 0.76 million m 3 under the nonstationary scenario (Fig.15).It indicates that the changing environment has a significant influence on the inundation range and degree of coastal floods.This is consistent with what has been found in Taiwan Island by Hsiao et al.( 2021).Furthermore, Wahl et al.( 2015), Moftakhari et al.( 2017), Bevacqua et al.( 2019), and Fang et al.( 2021) also demonstrated the increasing risk of compound flood by statistic models.
3.3.2 Influence of the Compound Effect of Precipitation-Storm Tides
As shown in Fig.16, when the RP is low, such as less than 50 years, the combination of precipitation-storm tides has a slight effect on the maximum inundation area and volume.As the RP increases, the inundation extent increases more obviously when the compound effect is considered, indicating that the compound effect of precipitation-storm tides would have a greater influence on the flood risk under extreme scenarios (for example, RP > 50 years).For example, for a RP = 500 year event, the maximum inundation volume is 1.02 million m3without considering the compound effect of precipitation-storm tides, and it is 1.30 million m3when taking the compound effect into account, with an increase of 27.3%.Therefore, the interaction of precipitation and storm tides aggravates flood disasters, and more attention should be paid to the compound effect of precipitation and storm tides when extreme flooding events occur in coastal cities.
In addition, different peak time lags of precipitation and storm tides would have different impacts on compound flood risk.In this study, taking a 50-year compound event as an example, it is assumed that the precipitation processes and storm tide processes remain unchanged, only the peak time lags of precipitation and storm tides change from ? 5 to 9 h.We considered 15 different combined scenarios of precipitation and storm tide phases, which include that the precipitation peaks occur during tidal decreasing phase, tidal increasing phase and the precipitation peak and storm tide peak occur at the same time.The maximum inundation areas, volumes, and depths for different peak time lags are presented in Fig.17.With the increase of the peak time lag, the maximum inundation areas and volumes show a trend of increasing first and then decreasing, and when the peak time lag is 6 h, the inundation area and volume are the maximum for the study area.When precipitation and storm tide processes are accurately predicted, the above information can provide support for coastal flooding prevention and control.
3.4 Limitations
In this study, the VPD model is used to predict precipitation and storm tides under nonstationary scenario, which was also adopted by Xu et al.( 2020), Rohmer et al.( 2021), Nie et al.( 2021), Ossandón et al.( 2021), and others.However, many scholars use climate models or machine learning techniques for precipitation and storm tide prediction under a changing environment.In the future, the above methods can also be applied to improve the accuracy of precipitation and storm tide prediction to better analyze the compound flood risk in coastal cities under the changing environment.
4 Conclusion
Precipitation and storm tides are the driving factors of coastal floods, and their interaction will aggravate flood disasters in coastal cities.Knowing the potential change of the compound flood risk caused by precipitation and storm tides is valuable for coastal flood risk reduction under the nonstationary scenario.In this study, we explored the compound flood risk by integrating the hydrological model and copula-based design of precipitation and storm tides.The VPD model, copula model, and the most-likely weight function were used to obtain the combined design values of precipitation and storm tides under the nonstationary scenario.The combined design values were applied to the boundary conditions of the 1D-2D hydrological model.Subsequently, the change of the bivariate RPs, design values, and compound flood risks were investigated under the nonstationary scenario.The results show that: (1) The bivariate RP of precipitation and storm tides decreases significantly under the nonstationary scenario, and the combined design values are significantly increased when considering the impact of the nonstationary scenario.(2) The compound flood risk has been significantly increased under the changing environment.(3) The compound effects of precipitation-storm tides would have a greater influence on the flood risk when the bivariate RP is more than 50 years, and the peak time lags significantly impact the compound flood risk.
The methods and results of this study can be used as a reference for other coastal cities, and the compound flood risk of precipitation and storm tides will be assessed at a national scale or global scale under nonstationary scenario in our future work.Future measures for compound flood mitigation should also be investigated to deal with the changing environment and increase the flood resilience of coastal cities.
AcknowledgmentsThis study was supported by the National Natural Science Foundation of China (Grant Numbers 52109040, 51739009), China Postdoctoral Science Foundation (Grant Number 2021M702950), Scientific and Technological Projects of Henan Province (Grant Number 222102320025), and Key Scientific Research Project in Colleges and Universities of Henan Province of China (Grant Number 22B570003).Additionally, our cordial gratitude should be extended to the editor and anonymous reviewers for their professional and pertinent comments and suggestions, which are greatly helpful for further quality improvement of this manuscript.
Open AccessThis article is licensed under a Creative Commons Attribution 4.0 International License, which permits use, sharing, adaptation, distribution and reproduction in any medium or format, as long as you give appropriate credit to the original author(s) and the source, provide a link to the Creative Commons licence, and indicate if changes were made.The images or other third party material in this article are included in the article’s Creative Commons licence, unless indicated otherwise in a credit line to the material.If material is not included in the article’s Creative Commons licence and your intended use is not permitted by statutory regulation or exceeds the permitted use, you will need to obtain permission directly from the copyright holder.To view a copy of this licence, visit http://creativecommons.org/licenses/by/4.0/.
 International Journal of Disaster Risk Science2022年4期
- International Journal of Disaster Risk Science的其它文章
- International Journal of Disaster Risk Science
- Quick Responses of Canadian Social Scientists to COVID-19: A Case Study of the 2020 Federal COVID-19-Specific Grant Recipients
- Territorial Resilience Through Visibility Analysis for Immediate Detection of Wildfires Integrating Fire Susceptibility, Geographical Features, and Optimization Methods
- Extreme Weather Loss and Damage Estimation Using a Hybrid Simulation Technique
- Using Multidisciplinary Analysis to Develop Adaptation Options against Extreme Coastal Floods
- Impact of Tropical Cyclone Avoidance on Fishing Vessel Activity over Coastal China Based on Automatic Identification System Data during 2013–2018