
Assimilation of All-sky Geostationary Satellite Infrared Radiances for Convection-Permitting Initialization and Prediction of Hurricane Joaquin (2015)※
2022-12-07 10:27:46LeiZHUZhiyongMENGYonghuiWENGandFuqingZHANG
Advances in Atmospheric Sciences 2022年11期
Lei ZHU, Zhiyong MENG, Yonghui WENG, and Fuqing ZHANG
1Key Laboratory of Meteorological Disaster, Ministry of Education (KLME)/Joint International Research Laboratory of Climate and Environmental Change (ILCEC)/Collaborative Innovation Center on Forecast and Evaluation of Meteorological Disasters (CIC-FEMD), Nanjing University of Information Science and Technology, Nanjing 210044, China
2Laboratory for Climate and Ocean-Atmosphere Studies, Department of Atmospheric and Oceanic Sciences,School of Physics, Peking University, Beijing 100871, China
3I.M. System Group (IMSG), at Environmental Modeling Center (EMC), NCEP, NWS,NOAA, College Park, MD 20740, USA
4Department of Meteorology and Atmospheric Science, and Center for Advanced Data Assimilation and Predictability Techniques, The Pennsylvania State University, University Park, Pennsylvania 16802, USA
ABSTRACT Intensity forecasting is one of the most challenging aspects of tropical cyclone (TC) forecasting. This work examines the impact of assimilating high-resolution all-sky infrared radiance observations from geostationary satellite GOES-13 on the convection-permitting initialization and prediction of Hurricane Joaquin (2015) with an ensemble Kalman filter (EnKF)based on the Weather Research and Forecasting (WRF) model. Given that almost all operational global and regional models struggled to capture Hurricane Joaquin (2015)’s intensity, this study examines the potential in improving Joaquin’s prediction when assimilating all-sky infrared radiances from GOES-13’s water vapor channel. It is demonstrated that, after a few 3-hour cycles assimilating all-sky radiance, the WRF model was able to forecast reasonably well Joaquin’s intensity,including its rapid intensification (RI). The improvement was largely due to a more realistic initial hurricane structure with a stronger, warmer, and more compact inner-core. Ensemble forecasts were used to further explore the important physical mechanisms driving the hurricane’s RI. Results showed that the RI forecasts were greatly impacted by the initial inner-core vortex structure.
Key words:all-sky infrared radiance, TC intensity, EnKF, inner-core structure
1.Introduction
It is well known that tropical cyclone (TC) track forecasting has greatly improved; however, intensity forecast errors have only largely decreased in recent years, and almost no improvements had occurred from the 1970s to the early 2000s (Cangialosi et al., 2020). The improvement in track forecasting is possibly due to the fact that hurricane motion is mainly controlled by large-scale environmental features,such as steering flow (Chan and Gray, 1982), which have been well forecasted by current operational numerical models. The difficulties of intensity forecasting may come from insufficient model resolution, incomplete understanding and/or inaccurate representation of physical processes, poor initialization of the initial vortex structure due to inadequate inner-core observations and/or ineffective data assimilation algorithms, and the inherently more limited predictability(Zhang and Sippel, 2009; Emanuel and Zhang, 2016, 2017).Recent studies have shown that TC intensity forecasts can be significantly improved when high-resolution inner-core observations are assimilated (Zhang et al., 2009, 2011;Weng and Zhang, 2012; Zhu et al., 2016).
Weather radars and satellites are the only currently available high-resolution observation platforms that are able to routinely observe inner-core structures of TCs. Radar observations, either airborne or ground-based, have their limitations.Airborne radar observations are available routinely only for some of the TCs over the Atlantic Basin. Ground-based radars are not able to cover the open ocean. However, geostationary satellites are located over a fixed location at a high altitude (around 35 786 km), thus, they can observe a broad area at a high temporal resolution and continuously monitor TCs.
Efforts have been made in using geostationary satellite radiances to improve TC intensity forecasts. Most previous studies have focused on the impact of clear-sky radiance observations on TC forecasts (Stengel et al., 2009; Qin et al.,2013; Kazumori, 2014; Zou et al., 2015; Yang et al., 2017).Since clear-sky radiance observations do not cover convective areas, especially TC inner-core regions, their impacts on improving TC intensity forecasts are rather limited (Yang et al., 2017). All-sky radiance observations cover clear-sky areas as well as cloudy and rainy areas of the TC inner-core regions. However, efficiently assimilating all-sky radiance is still challenging (e.g., Geer and Bauer, 2011; Okamoto et al., 2014; Otkin and Potthast, 2019). The satellite observations over the cloudy or rainy areas often have large errors and uncertainties. For example, large representative errors are likely to be caused by unavoidable uncertainties in the forecast system and/or nonlinear observation operator (such as the radiative transfer model), particularly in the areas with strong moist processes. Most recently, studies have shown that new-generation geostationary satellite observations under all-sky conditions are able to improve predictions of mesoscale convective systems (MCSs) and TCs, although the predictions are still far from perfect (Okamoto, 2017;Minamide and Zhang, 2018; Zhang et al., 2019, 2021a,2021b; Minamide et al., 2020). The cloudy-affected radiance observations are able to obtain the vertical and horizontal structures of the moisture field and cloud conditions, which is one of the most important factors for the accurate prediction of MCSs and TCs. Additional details on the progress and challenges of all-sky satellite radiance assimilation in the data assimilation (DA) research community and at operational forecast centers have been summarized in Li et al. (2022),Li et al. (2016), and Geer et al. (2018).
The potential benefit of assimilating real-world last-generation geostationary satellite (e.g., GEOS-13/14 in America, FY2 series in China) infrared radiance data under allsky conditions for TC intensity forecasting has not been explored. GOES-13 was the operational GOES-East from April 2010 to December 2017. It covers the eastern side of the continental United States, the Gulf of Mexico, and part of the Atlantic Ocean, and was able to provide continuous,high-resolution observations for TCs over those areas. Moreover, how the practical predictability of tropical cyclone intensity can be improved with infrared radiance data, even from the previous-generation geostationary satellite GOES-13,has not been examined.
This work aims to answer the abovementioned questions by assimilating real-world all-sky infrared radiances from GOES-13’s water vapor channel for the analysis and prediction of Hurricane Joaquin (2015), especially for intensity forecasting. Hurricane Joaquin (2015) was chosen in this study because almost all the operational forecasts exhibited enormous errors not only on intensity but also on track. Nystrom et al. (2018) explored sources of the forecast errors through an ensemble forecast initialized with the PSU WRF-EnKF real-time analysis and a series of sensitivity experiments.They found that the dominant source of track errors was in the region between 600 km and 900 km from the TC center,while the intensity errors were from the region within 300 km from the TC center.
Section 2 describes the methodology used in this study,including the data assimilation and forecast system, the observations, and the experimental designs. Section 3 examines the detailed impacts of infrared radiance data assimilation on the analyses and forecasts of TC intensity and structure.A summary and conclusions are provided in section 4.
2.Methodology
2.1.The forecast model and data assimilation system
A convection-permitting data assimilation and forecast system was used in this study. It was initially designed as a regional-scale WRF-EnKF system (Meng and Zhang, 2008)and further developed for quasi real-time hurricane prediction at PSU (Zhang et al., 2011). The Advanced Research WRF(ARW) model version 3.7.1 (Skamarock et al., 2008) was employed with three two-way nested domains. The outermost domain (D01) had 379 (lon.) × 244 (lat.) horizontal grid points with a 27-km grid spacing. The intermediate domain(D02) had 298 × 298 horizontal grid points with a 9-km grid spacing. The innermost domain (D03) had 298 × 298 horizontal grid points with a 3-km grid spacing. All the domains had 43 vertical layers with a model top at 10 hPa. The initial and boundary conditions were provided by the National Centers for Environmental Prediction (NCEP) Global Forecast System (GFS) operational analysis (available online at https://www.ncdc.noaa.gov/data-access/model-data/modeldatasets/global-forcast-system-gfs). The model configurations and physics were set similar to those in Weng and Zhang (2016), with the Grell-Devenyi cumulus scheme(Grell and Dévényi, 2002, only used in D01), Yonsei State University (YSU) planetary boundary layer scheme (Noh et al., 2003), Monin-Obukhov surface layer scheme, thermal diffusion land surface scheme, and WRF single-moment sixclass microphysics with graupel scheme (Hong et al., 2004).The Community Radiative Transfer Model (CRTM, Weng,2007), which was developed for rapidly calculating satellitebased radiance observations, was utilized as satellite observation operator in the data assimilation system. Due to the inevitable errors in the imperfect model and real-case applications, we used relaxation to prior perturbation (RTPP;Zhang et al., 2004) for covariance relaxation with a coefficient of 0.9. The successive covariance localization (SCL, Zhang et al., 2009) method was also used in this study to assimilate dense infrared radiance observations using varying degrees of data thinning over different domains.
Since the global model often captures large-scale environmental systems (e.g., steering flow) better than regional models, only model variables within 600 km from the best-track TC center were updated during data assimilations, while the variables beyond 600 km were directly provided by GFS data. Specifically, the region within 300 km from the TC center fully used the ensemble posterior, while the region between 300 km and 600 km from the TC center were updated using a weighted combination of GFS and posterior.The weight combination linearly increased from zero at the radius of 300 km to one at 600 km.
2.2.Experimental setup and assimilated observations
A 60-member ensemble was initiated by randomly sampling the background error covariance default in the WRF three-dimensional variational data assimilation system(3DVar, Barker et al., 2004) at 0000 UTC 28 September 2015. The ensemble was integrated for 12 h to 1200 UTC 28 September to obtain a flow-dependent background error covariance. Two experiments named RAD and NoRAD were carried out in order to examine the forecast performance from assimilating the GOES-13 all-sky infrared radiances.In the NoRAD experiment, only the conventional observations in the Global Telecommunication System (GTS) and TC position and intensity information (HPI) from National Hurricane Center (NHC) best track were assimilated (GTS +HPI). Except from the data assimilated in the NoRAD experiment, the RAD experiment also assimilated the GOES-13 all-sky infrared radiance observations (GTS + HPI + GOES-13). Data assimilation was performed from 1200 UTC 28 September to 1200 UTC 4 October 2015 at a 3-h interval.Although other studies such as Honda et al. (2018) have suggested that a shorter assimilation interval for all-sky infrared radiances might be beneficial for TC analysis and prediction, the 3-h interval is sufficient for this study as revealed by the results in the next section. Deterministic forecasts of 144 h were initialized every 6 h from the ensemble posterior mean. In order to explore how the satellite data is able to improve the practical predictability and the relationship between the initial structure and the forecast intensity,ensemble forecasts were performed and initiated at 1200 UTC 29 September for both experiments. Also, due to computational limitations, only 39-h ensemble forecasts were run.Moreover, in order to differentiate the impacts of the all-sky radiance observations from the clear-sky ones, another sensitivity experiment (clrRAD) was carried out, in which the experimental setup was the same as the RAD experiment except that it assimilated the clear-sky GOES-13 (GTS +HPI + clear-sky GOES-13). Also considering the limited computational and storage resources, the cycled data assimilation in the clrRAD experiment was performed every 3 h from 1200 UTC 28 September to 0000 UTC 1 October 2015, and 72-h deterministic forecasts were run every 6 h with the ensemble posterior mean. Most of the analyses in this study are focused on the RAD and NoRAD experiments, except for the deterministic forecast statistics and the radiance comparisons (Figs. 1-3).
The satellite radiance data assimilated in the RAD experiment were the upper tropospheric water vapor channel (channel 3) infrared radiances from GOES-13 under all-sky conditions over the domains of D02 and D03 (available online at https://www.avl.class.noaa.gov/saa/products/search?data type_family=GVAR_IMG). Channel 3 was chosen because it gave the minimum analysis root-mean-square error(RMSE) throughout all the assimilation cycles among all the infrared channels according to our sensitivity experiment results (Fig. 3a). The total number of radiance observations from channel 3 over D02 and D03 is around 50 000 for a given time. In this study, one third of the observations (over 15 000) over the D02 (including D03) region were selected randomly for data thinning. These observations had a horizontal resolution of ~12 km, which is similar to that from Zhang et al. (2016). The observation error was set to 5.0 K,which includes both instrumental and representativeness errors. To limit erroneous analysis increments for the cloudy or rainy-area radiance data, we adopted the adaptive observation error inflation (AOEI) method proposed in Zhang et al. (2016). The process to extract the clear-sky radiance data was the same as in Minamide and Zhang (2018)and was originally proposed by Harnisch et al. (2016).
3.Results and discussions
3.1.Deterministic forecasts of TC track and intensity
Overall, the differences in the track forecasts among the RAD, clrRAD, and NoRAD experiments were not significant, as revealed by the track forecast errors for different forecast lead times (Figs. 1a, d). The deterministic track forecasts initiated from the EnKF posterior mean in the three experiments behaved rather poorly in the first several days(Fig. 1a) in comparison to the NHC best track. These poor performances were similar to the operational forecasts (not shown), though the RAD experiment had smoother, more well-behaved forecast tracks than the NoRAD experiment,likely because many NoRAD forecasts for the first several days failed to intensify (Figs. 1b, c), making their centers difficult to track.

Fig. 1. Deterministic forecasts of track (a) and intensity in terms of both 10-m maximum wind speed (Vmax) (b) and minimum sea level pressure (Pmin) (c) initiated with the posterior analysis mean every 6 hours, and the average mean absolute errors (MAEs) of the forecasts (d, e, f) at different forecast lead times for the RAD (red), NoRAD (blue), and clrRAD (green) experiments. The colors change from light to dark with the initiated forecast times in (a)-(c).

Fig. 2. Comparison of the simulated channel 3 infrared radiance (shaded) between the RAD (a, e, i) and NoRAD (b, f, j)analyses, clrRAD (c, g, k) analyses, and the observations (d, h, l) at 1200 UTC 29, 1800 UTC 29, and 0000 UTC 30 September, respectively. The black contours in the RAD and NoRAD analyses are the sea level pressures.

Fig. 3. Infrared radiance RMSE (a) and bias (b) in the analysis mean of the RAD experiment (red), NoRAD (blue) and clrRAD (green) experiments from the first to the last data assimilation cycle. The solid and dashed lines are for channel 3(CH3) and channel 4 (CH4), respectively.
The poor track forecast in the RAD experiment, even with the cycled satellite data and the GTS data, was attributed to the nature of the assimilated observations in this study. The GOES-13 infrared radiance observations can only observe the cloud-top information, and no other information beneath the cloud can be obtained. However, the largescale thermodynamic information (e.g., temperature and geopotential heights) was quite important for the track forecast in this case (Wang et al., 2017, Nystrom et al., 2018).
Unlike the comparable track forecasts among the three experiments, large differences were observed in the deterministic intensity forecasts from early on. The RAD experiment,whose initial conditions (ICs) assimilated all-sky infrared radiances, showed significantly improved intensity forecasts(Figs. 1b, c). The intensity evolution was successfully captured even when the radiance data was only assimilated for five cycles (12 hours). As the all-sky infrared radiance assimilation continued, the intensity forecasts became progressively closer to the best track estimate. Meanwhile, the deterministic forecasts in the NoRAD experiment continued to be much weaker than observed TCs and failed to capture the RI process. RI is defined as an increase in maximum sustained winds of a TC of at least 30 knots in a 24-hour period(Kaplan and DeMaria, 2003). Although the forecasts with the NoRAD posteriors after 30 September could capture the intensifying process to some extent, the intensifying process from the model was still much weaker compared to the best track. More specifically, of the 11 deterministic forecasts initiated with the posterior mean from the first DA time to 0000 UTC 1 October (almost at the end of the RI process),nine were able to capture the RI process in the RAD experiment, while only two captured RI in both the NoRAD and clr-RAD experiments (Fig. 1b). This result demonstrates the remarkable impacts of assimilating high resolution all-sky radiance observations on TC intensity prediction, particularly on RI forecasts for Hurricane Joaquin (2015). Moreover, the intensity forecasts in the clrRAD experiment had similar performances to those in the NoRAD experiment, which further demonstrates the impacts of the cloud-affected infrared radiance observations on TC intensity prediction.
The improvement in TC intensity forecasting achieved by assimilating all-sky radiance observations is shown more clearly by the mean absolute errors (MAEs) of the intensity forecasts averaged over all forecast leading times (Figs. 1e,f). The intensity MAEs in the RAD experiment, in terms of both maximum surface wind speed (Vmax) and minimum Sea Level Pressure (Pmin), stayed much smaller at all lead times than those in the NoRAD experiment. The MAEs of Vmax and Pmin in the RAD experiment were around 7 m s-1and 10 hPa, respectively, which were more than 50%smaller than those in the NoRAD experiment for most forecast lead times. This magnitude in error reduction for this particular hurricane was comparable to that obtained by assimilating airborne radar observations in Zhang and Weng (2015)with the same model configurations. The largest improvements in TC intensity forecasts were obtained at 48-96-h lead times (Fig. 1e). Though the NoRAD experiment also captured the RI process after 0000 UTC 1 October, the predicted intensities were still much weaker than the best track and those in the RAD experiment.
3.2.Comparisons in observation space
In order to understand where the significant improvements in the intensity forecasts come from, the impacts of assimilating all-sky radiance observations on TC structures were further examined. This section presents the comparisons of the analyses of infrared radiances of the water vapor channels (channel 3 and channel 4) with the observations and the corresponding RMSE and bias during the whole data assimilation cycles.
Figure 2 shows the comparisons between the simulated brightness temperatures (BTs) of channel 3 in the RAD, clr-RAD, and NoRAD experiments and the observations. At 1200 UTC 29 September (the 5th cycle, or 12 hours since the first cycle), the EnKF posterior mean in the RAD experiment captured the general structure of Joaquin over the inner-core region (Fig. 2a), although it was still much weaker in comparison to the observed TC (higher BTs in the RAD experiment compared with the observations). In the clrRAD and NoRAD experiments, at the same time, the convective structures were very disorganized (Figs. 2b, c).The deterministic forecast initiated with the RAD posterior at this time captured the RI process (Figs. 1b, c), which was possibly due to the better TC structure in the initial field, particularly over the inner-core area (see section 3.3). In contrast, the deterministic forecasts initiated with both the NoRAD and clrRAD posterior at this time failed to intensify. The relationship between the inner-core structure and the intensity forecast will be discussed in section 3.3.
With more data assimilation cycles, the structures of Joaquin in the RAD posteriors were much closer to the observations in both the inner core and outer environment of the TC (Figs. 2e, h, i, l). The pattern of the radiances in the RAD analyses exhibited a clear hurricane structure. The increasingly better deterministic intensity forecasts were achieved with the increasingly more realistic simulated structures of Joaquin in the initial fields (Figs. 1b, c). The TC structures still had not been depicted well in both the clrRAD and NoRAD experiments (Figs. 2f, g, j, k), with only some disorganized convective systems having been simulated around the observed TC center area. In addition to the general TC structures, some small-scale convective clouds outside the inner core area (e.g., west of the TC, around 74°W in Figs. 2i and 2l) were considerably improved in the RAD experiment compared to observations, unlike in the NoRAD and clrRAD experiments (Figs. 2j, k). In addition to the structures, the RAD experiment’s SLP and TC center match reasonably well with the best-track observations, while the SLP in the NoRAD experiment was still too weak. A comparison between the simulated BTs of GOES-13 channel 4,which were not assimilated in the experiments, and the observations was also performed (figure not shown). Joaquin’s inner-core structure and its evolution were captured well, consistent with those for channel 3 (Fig. 2). It should be noted that the simulated BTs in channel 4 over this domain were much lower than those in the observations, particularly over the clear-sky region. Potential reasons for this are model errors in CRTM and surface emissivity uncertainties, both of which need to be further explored and improved in the future.
In order to quantify the impacts of assimilating all-sky infrared radiance data, the RMSEs and bias of the radiances were calculated for all three experiments over D03 at each data assimilation cycle (Fig. 3). Compared with the NoRAD and clrRAD experiments, the RAD experiment showed much smaller RMSEs at almost every cycle (Fig. 3a), especially before 3 September for channel 3 and 2 September for channel 4. This is because the ICs in the RAD experiment were much closer to the observations than those in the NoRAD and clrRAD experiments, including more realistic hurricane structures. Moreover, the bias in channel 3 was remarkably reduced with radiance data assimilation throughout all the data assimilation times (Fig. 3b), while the reduction of bias is smaller for channel 4. The RMSEs and bias of radiances were progressively reduced, which was consistent with the increasingly improved intensity forecasts. The largest error reductions in the RAD experiment, compared with the NoRAD and clrRAD experiments, in both the RMSEs and bias were achieved during the first several days,especially during the RI period from 1200 UTC 29 September to 0000 UTC 2 October, which suggests that the all-sky infrared radiance data are beneficial for forecasting the RI evolution of a hurricane. Consistent with the aforementioned results, the RMSEs and bias for channel 4 were overall much larger than those for channel 3, but the magnitudes of the RMSEs and bias in the RAD experiment were greatly reduced when the infrared radiance data was assimilated for both channel 3 and channel 4.

Fig. 4. The EnKF-analysis increments (a-f) and posterior analyses (g-l) of 850-hPa potential temperature (shaded, K)and horizontal wind (vector, m s-1), as well as the sea level pressure (contour, hPa) for the RAD and NoRAD experiments, valid at 1200 UTC 29, 1800 UTC 29, and 0000 UTC 30 September 2015. The red cross is the observed TC center.
Nevertheless, comparisons of the simulated radiances from the analysis versus the GOES-13 observations suggest that, despite the reduction of bias compared to the NoRAD experiment and improvements in the initial structure and subsequent intensity forecasts, the current assimilation of allsky radiances from GOES-13 is still far from perfect. Future research is necessary to fully unveil the potential of all-sky radiances from geostationary satellites, as well as those from microwave sensors on board polar-orbiting satellites(e.g., Zhang et al., 2021a).
3.3.Improvements in the TC structures
Previous studies have shown that intensity forecast errors mostly come from the IC errors in position, intensity,and moisture conditions over the TC inner-core area(Emanuel and Zhang, 2017; Nystrom et al., 2018). In this subsection, we will discuss how the all-sky radiance data assimilation modified the initial dynamical and thermodynamical structures of Hurricane Joaquin.
Figure 4 shows the increments and EnKF posterior for 850-hPa horizontal wind and potential temperature, respectively, in the RAD and NoRAD experiments. Large wind increments were concentrated over the observed hurricane center, and big temperature increments were spread over the cloudy-sky or convective area in the RAD experiment (Figs.4a-c). The EnKF analysis of the RAD experiment produced a clear asymmetric cyclonic pattern around the observed center of Joaquin with the largest increments appearing to the east, which resulted in a much stronger horizontal wind circulation compared to other experiments (Figs. 4g-i). Correspondingly, there was an overall increase (decrease) of potential temperature inside (just outside) the inner-core area. On the contrary, much smaller wind increments and some large temperature increments concentrated near the TC center were apparent in the NoRAD analyses (Figs. 4d-f). As a consequence, a strong inner-core circulation was simulated in the RAD experiment, while a much weaker inner-core circulation was simulated in the NoRAD experiment (Figs. 4g-i vs.Figs. 4j-l). At the same time, much lower SLP was also simulated in the RAD experiment with the infrared radiance observations being assimilated, which was consistent with the best track.
Vertical cross sections of the analyzed horizontal wind speed and potential temperature across the simulated TC center are shown in Fig. 5. Joaquin’s structure was changed significantly with the assimilation of all-sky infrared radiances,which was seen in the vertical cross sections through the simulated TC center. With infrared radiance observations being continuously assimilated into the ICs, stronger, more compact, deeper, and warmer inner-core structures were captured in the inner-core region. Asymmetric wind structures appeared, especially in the low levels (Figs. 5a-c). Without the infrared radiance data, even with much more cycled DA,analyzed TC structures in the NoRAD experiment were still too weak, and no clear warm inner core could be found over the TC center (Figs. 5d-f). The RAD experiment’s TC had a smaller radius of maximum winds (RMW) and a deeper warm core. A stronger thermal gradient in the eyewall region is consistent with stronger tangential winds, suggesting that the ensemble-based covariance estimate is congruent with the underlying TC dynamics. To further show how the structures of Joaquin were changed with the use of the infrared radiance data, the azimuthally averaged storm-relative structures of radial wind, tangential wind, and perturbation temperature of the RAD and NoRAD experiments were examined next to see the evolutions of Joaquin’s dynamical and thermodynamical structures.

Fig. 5. East-west vertical cross sections of the analyzed horizontal wind speed (shaded, m s-1), potential temperature(contours, K) across the simulated TC center from (a)-(c) RAD and (d)-(f) NoRAD analyses valid at 1200 UTC 29, 1800 UTC 29, and 0000 UTC 30 September 2015.
Figure 6 shows the azimuthally averaged storm-relative radial and tangential winds. With the radiance data having been assimilated, the tangential wind speeds in the low levels were increased to 16 m s-1with the RMW near 150 km(Fig. 6a), while the speeds were weaker and the RMW was larger in the NoRAD analyses (Fig. 6d). With the additional 6-h and 12-h cycled data assimilation, the tangential wind speeds were extensively intensified, reaching 30 m s-1, and the RMW was narrowed to around 50 km near the surface(Fig. 6c). However, without radiance data having been assimilated, the wind speeds and RMW in the later times remained similar to those at 1200 UTC 29 September in the NoRAD experiment (Figs. 6d-f). Overall, with radiance data having been assimilated, a stronger primary circulation was captured in the RAD experiment (Figs. 6a-c). For the secondary circulation, the low-level inflow and middle/upper-level outflow formed and strengthened in the RAD experiment, while for the NoRAD experiment, the inflow and outflow during almost the whole simulation period were much weaker(Figs. 6g-l).

Fig. 6. Comparison of the storm-relative radius-height structure of (a-f) tangential wind and (g-l) radial wind speed(shaded, m s-1) between the RAD and the NoRAD experiments valid at 1200 UTC 29, 1800 UTC 29, and 0000 UTC 30 September 2015. The RMW is denoted by black dashed line in (a)-(f).
A warm-core structure is one of the most distinguishing features of a TC. Azimuthally averaged perturbation temperature is usually used to describe TC warm-core structure(Stern and Nolan, 2012; Stern and Zhang, 2016). Figure 7 shows the radius-height cross section of azimuthally averaged storm-relative perturbation temperature for both the RAD and the NoRAD analyses. The temperature perturbation was calculated as the difference from the environmental temperature, defined as the mean temperature at each vertical level between 600 km and 800 km from the TC center. In the RAD experiment, the warm-core structures developed rapidly in the assimilation cycles (Figs. 7a-c). The warmcore structure was associated with a distinct maximum perturbation temperature, indicating that assimilating infrared radiance data strengthened the warm-core structure either through direct analysis increments or through favorable conditions for the subsequent short-term forecast before the next EnKF cycle. A distinct compact, strong, and deep warmcore structure of hurricane Joaquin was established in the posterior (Figs. 7a-c), which is consistent with the finding of previous studies (Hawkins and Imbembo, 1976; Durden, 2013)that a maximum inner-core perturbation temperature center occurred between 250-300 hPa. Furthermore, a secondary maximum center was captured near 850 hPa after the allsky infrared radiance data were continuously assimilated into the ICs (Figs. 7b, c). This is also consistent with previous observational and numerical simulation studies, although the exact vertical levels were not the same (Stern and Nolan,2009, 2012). Figures 6-7 show that the flow-dependent ensemble-based covariances can update the inner-core vortex structure in a dynamically consistent manner. When only conventional observations were assimilated in the NoRAD experiment, the typical warm-core structure of Joaquin was unable to be depicted even under many DA cycles (Figs. 7g-l), and the secondary center never occurred.
3.4.Ensemble forecasts and sensitivity analyses
In addition to deterministic forecasts initiated from the EnKF mean analyses, 60-member ensemble forecasts were initialized from the ensemble analyses at 1200 UTC 29 September of the RAD and NoRAD experiments in order to see how the intensity practical predictability could be improved with the infrared radiance data, even with the previous-generation geostationary satellite GOES-13.
Figure 8 shows the simulated intensity evolution for both Pmin and Vmax in the two ensemble forecasts. In the NoRAD experiment, all the 60-member intensity forecasts failed to capture the RI process, in terms of both Pmin and Vmax, even for some initially strong members (Figs. 8c, d).On the contrary, a lot of RAD experiment members were able to successfully predict the RI process, even though the rate of the intensification was somehow weaker among some of the members (Figs. 8a, b). Moreover, the intensity forecast spread increased significantly in the RAD experiment compared with the NoRAD experiment (Fig. 8).

Fig. 7. Comparison of the storm-relative radius-height structure of perturbation temperature (shaded, K) between the RAD (a-c) and the NoRAD (d-f) experiments valid at 1200 UTC 29, 1800 UTC 29, and 0000 UTC 30 September 2015.
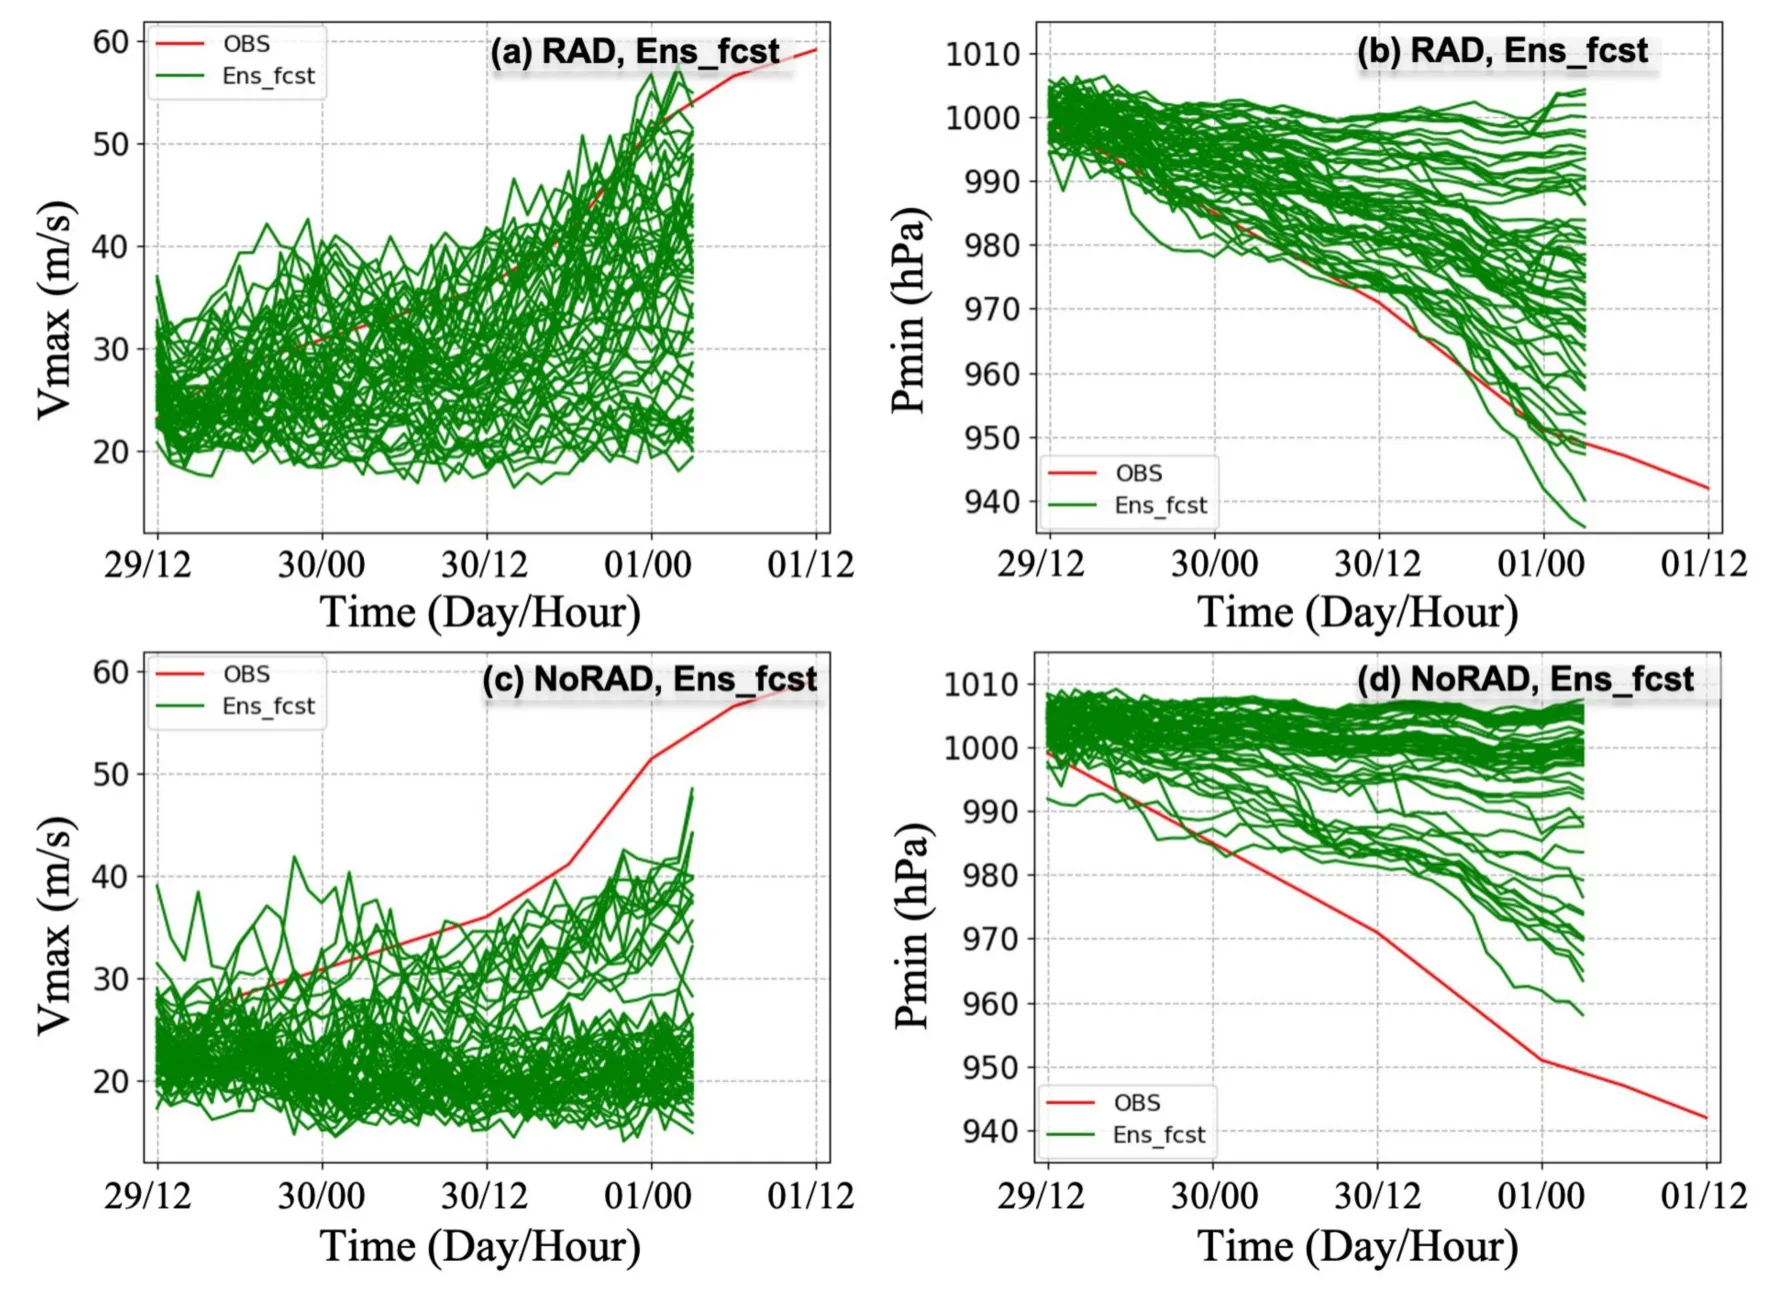
Fig. 8. Comparison of the 60-member ensemble forecasts initiated from 1200 UTC 29 September between the RAD and NoRAD EnKF-posterior analyses. The NHC best track observation is denoted by the red line.

Fig. 9. Ensemble storm-relative radius-height correlations of initial (a) perturbation temperature, (b) radial wind speed, and(c) tangential wind speed to the minimum central pressure at 39 h. Stippling denotes regions where the statistical significance exceeds the 99% confidence interval, and dashed line in (c) denotes the RMW.
To explore the different reasons for the uncertainty in the intensity forecasts between the two ensemble forecasts with and without infrared radiance data having been assimilated into the ICs, we examined the storm-relative correlations between several variables in the ICs of the ensemble forecasts and the Pmin at 39 h (end of the ensemble forecasts; Fig. 9).The strongest, statistically significant negative correlations between the anomaly perturbation temperature and Pmin at 39 h occur at the height of 4-11 km and within 200 km from the storm center (Fig. 9a). This indicates that a stronger warm-core structure is beneficial to capturing the RI process, consistent with the findings of previous studies(e.g., Chen and Zhang, 2013; Stern and Zhang, 2016). Large positive correlations between the initial radial wind and the forecasted intensity occurred in the low levels (< 1 km)inside 300 km from the TC center (Fig. 9b), which indicates that stronger initial low-level inflow was closely related with the RI process (a stronger forecasted TC). Correspondingly, there was a negative correlation between the upperlevel radial wind and forecasted Pmin, which means that stronger initial outflow is beneficial for a stronger forecasted TC (Fig. 9b). Lastly, the strongest and most significant negative correlations between the initial tangential wind speed and the forecasted Pmin were found around 150 km from the simulated TC center (Fig. 9c), which indicated that stronger primary circulation near the RMW area was closely related with the forecasted lower Pmin (stronger intensity).
With the larger uncertainty in the initial TC structure in the analyses in the RAD experiment, how the forecasted TC structure evolved was further examined. Figure 10 shows the RAD experiment’s 60-member ensemble mean and ensemble standard deviation of the variables at forecast hours 24 and 36, respectively. At 24 h in the ensemble forecast, the ensemble mean maximum tangential wind speed reached 20 m s-1with standard deviation exceeding 8 m s-1and RMW near 50 km at 1 km height (Fig. 10c), which means that strong simulated inner-core structures were captured among the analyses. For the secondary circulation in terms of the radial wind, the ensemble mean of the lowlevel inflow was over 6 m s-1within the lowest 1 km beyond 50 km from the TC center and upper-level outflow was in excess of 8 m s-1near the height of 15 km, with standard deviations of 2.0 m s-1and 2.5 m s-1, respectively(Fig. 10b). Moreover, the maximum ensemble mean anomaly perturbation temperature was around 4 K at 10-km height with a standard deviation around 1.5 K, and the secondary center was also found at around 4 km (Fig. 10a). By forecast hour 36, the magnitudes of all the variables for both ensemble mean and standard deviation were getting larger(Figs. 10d-f), which further demonstrates that much stronger warm-core structures were captured with a more uncertain vortex structure in the analysis.

Fig. 10. The storm-relative radius-height structure of perturbation temperature, radial wind speed, and tangential wind speed for 24-h forecasts (a-c) and 36-h forecasts (d-f) initiated at 1200 UTC 29 September 2015 with the RAD analyses. The shading and contours represent ensemble mean and standard deviation for each panel, respectively.
Overall, with the radiance data having been assimilated into the ICs, much stronger and warmer inner-core TC structures were simulated in the forecast among the ensemble members, which was associated with the more successful RI process prediction for both the deterministic and ensemble forecasts. Complementary to previous investigations, it is demonstrated that assimilation of satellite infrared radiance observations is helpful to better capture the initial inner-core structure and intensity and to subsequently improve the deterministic and ensemble analyses and forecasts of the hurricane’s structure and intensity.
4.Conclusions and discussions
This study examined the impact of assimilating high-resolution all-sky infrared radiance observations from water vapor channel 3 of geostationary satellite GOES-13 on the analysis and prediction of Hurricane Joaquin (2015), particularly on the intensity and inner-core structures, using an ensemble Kalman filter (EnKF) data assimilation and forecast system.
The results demonstrate that significant improvements on TC intensity forecasts were obtained by assimilating allsky infrared radiance data for several cycles. The improvements in TC intensity forecasts were potentially due to the changes in TC structures in the ICs. Stronger, warmer, more compact, and thus, likely closer to the actual hurricane’s inner core, dynamic and thermodynamic structures were captured with the assimilation of infrared radiance data.
The results suggest the potential of a decades-long future 4-dimensional reanalysis of Atlantic hurricanes over the GOES-13 era, which could likely extend even further back with older GOES satellites, as no other dataset is so continuous with such unimpeded coverage and spatiotemporal resolution. The results show that the last-generation geostationary satellites can help to rebuild the TC reanalysis dataset, which is urgently needed for the big data era since advanced AI methods are being used to improve TC forecasts, especially for intensity. This study indicates clear promise in improving hurricane prediction by assimilating the new generation of geostationary satellites. Multiple studies have shown the potential benefits to TC prediction from such satellites, including Himawari-8/9 (Japan), GOES-16/17 (America), and FY-4A/B (China), which provide observations with much higher spatiotemporal resolution and are equipped with more channels for monitoring ongoing convective activity than previous generation satellites (e.g., Cintineo et al., 2016; Honda et al., 2018; Zhang et al., 2018).
Although the assimilation of all-sky infrared radiances greatly improved the intensity forecast of Hurricane Joaquin,the intensity and structure simulations were still far from perfect. There are many issues that need to be further explored to fully unveil the potential of all-sky radiance observations from geostationary satellites, such as the quality control of the radiance observations, data thinning, data selection, and the localization in both the horizontal and vertical directions,to name a few. How to reasonably account for model errors and separate them from systematic biases in the NWP and radiative transfer models in the ensemble-based data assimilation method is also still unclear. In this study, we only focused on the impact of upper-tropospheric infrared radiance observations. Impacts of observations from other channels need to be further examined. Besides, the potential of assimilating all-sky radiances from geostationary satellites in improving TC intensity forecasting also needs to be further explored in combination with assimilating observations from microwave sensors on board polar-orbiting satellites(e.g., Zhang et al., 2021a).
Acknowledgements. Lei ZHU is supported by the Natural Science Foundation of China (Grant No. 41905096). Zhiyong MENG is supported by the Natural Science Foundation of China (Grant Nos. 42030604, 41875051, and 41425018). The authors thank Yunji ZHANG (PSU) and Robert G. NYSTROM (NCAR) for their valuable comments on the earlier version of this manuscript.The simulations were performed on the Stampede supercomputer of the Texas Advanced Computing Center (TACC). All data are freely available from sources indicated in the text. The authors are grateful to the Editor and the three anonymous reviewers for their valuable comments and suggestions on this manuscript.
 Advances in Atmospheric Sciences2022年11期
- Advances in Atmospheric Sciences的其它文章
- Sub-seasonal Prediction of the South China Sea Summer Monsoon Onset in the NCEP Climate Forecast System Version 2
- Reexamination of the Relationship between Tropical Cyclone Size and Intensity over the Western North Pacific
- Discrepancies in Simulated Ocean Net Surface Heat Fluxes over the North Atlantic
- A Causality-guided Statistical Approach for Modeling Extreme Mei-yu Rainfall Based on Known Large-scale Modes—A Pilot Study
- The Impact of an Abnormal Zonal Vertical Circulation in Autumn of Super El Ni?o Years on Non-tropical-cyclone Heavy Rainfall over Hainan Island
- The Asymmetric Connection of SST in the Tasman Sea with Respect to the Opposite Phases of ENSO in Austral Summer