
The Asymmetric Connection of SST in the Tasman Sea with Respect to the Opposite Phases of ENSO in Austral Summer
2022-12-07 10:27:50XueqianSUNShuanglinLIandStefanLIESS
Advances in Atmospheric Sciences 2022年11期
Xueqian SUN, Shuanglin LI, and Stefan LIESS
1Climate Change Research Center (CCRC), Institute of Atmospheric Physics,Chinese Academy of Sciences, Beijing 100029, China
2Department of Atmospheric Science/Centre for Severe Weather and Climate and Hydro-geological Hazards,China University of Geosciences, Wuhan 430074, China
3College of Earth and Planetary Science, University of Chinese Academy of Sciences, Beijing 100049, China
4Department of Soil, Water, and Climate, University of Minnesota, Twin Cities, St. Paul MN 55108, Minnesota, USA
ABSTRACT This study uses linear regression and composite analyses to identify a pronounced asymmetric connection of sea surface temperature (SST) in the Tasman Sea with the two opposite phases of El Ni?o-Southern Oscillation (ENSO) during austral summer. In El Ni?o years, the SST anomalies (SSTAs) in the Tasman Sea exhibit a dipolar pattern with weak warmth in the northwest and modest cooling in the southeast, while during La Ni?a years the SSTAs exhibit a basin-scale warmth with greater amplitude. Investigations into the underlying mechanism suggest that this asymmetry arises from a mechanism related to oceanic heat transport, specifically the anomalous Ekman meridional heat transport induced by the zonal wind stress anomalies, rather than the surface heat fluxes on the air-sea interface. Further analysis reveals that the asymmetry of oceanic heat transport between El Ni?o and La Ni?a years is driven by the asymmetric atmospheric circulation over the Tasman Sea stimulated by the asymmetric diabatic heating in the tropical Pacific between the two opposite ENSO phases.
Key words:El Ni?o-Southern Oscillation, SST in the Tasman Sea, asymmetric connection, surface heat fluxes, oceanic heat transport
1.Introduction
The Tasman Sea is a boundary sea off the southeastern coast of Australia, surrounded by Tasmania Island in the west, New Zealand in the east, and the Coral Sea in the north. From an oceanic perspective, the Tasman Sea is affected by a strong western boundary current, the East Australian Current (EAC), which parallels the east coast of Australia and flows southward. Its main mass meanders away from Australia around 32°S and flows eastward into the Tasman Sea, giving rise to intensified oceanic eddy activity and air-sea exchanges (Sprintall et al., 1995). Meanwhile, the warm water brought poleward by EAC is in strong contrast with the cold water in the south, resulting in an oceanic temperature front called Tasman Front (Andrews et al., 1980;Sloyan and O’Kane, 2015). From an atmospheric perspective, the Tasman Sea is situated in the exit region of the upper atmospheric subtropical westerly jet during austral summer (DJF) (Fig. 1a) and is also closely connected with the climatological storm track of the Southern Hemisphere (SH),although the SH upper westerly jet and the storm track exhibit evident seasonal variations over a year (Fig. 1). In terms of its atmospheric and oceanic features, the Tasman Sea region bears a resemblance to the extension region of the Kuroshio in the Northwest Pacific or to the Gulf Stream in the North Atlantic, where active air-sea interaction can be found and where sea surface temperature (SST), as well as the SST front, may exert a substantial influence on the overlying atmosphere (Nakamura et al., 2004; Kwon et al., 2010).In other words, the SST in the Tasman Sea may provide some potential predictability for the climate system.
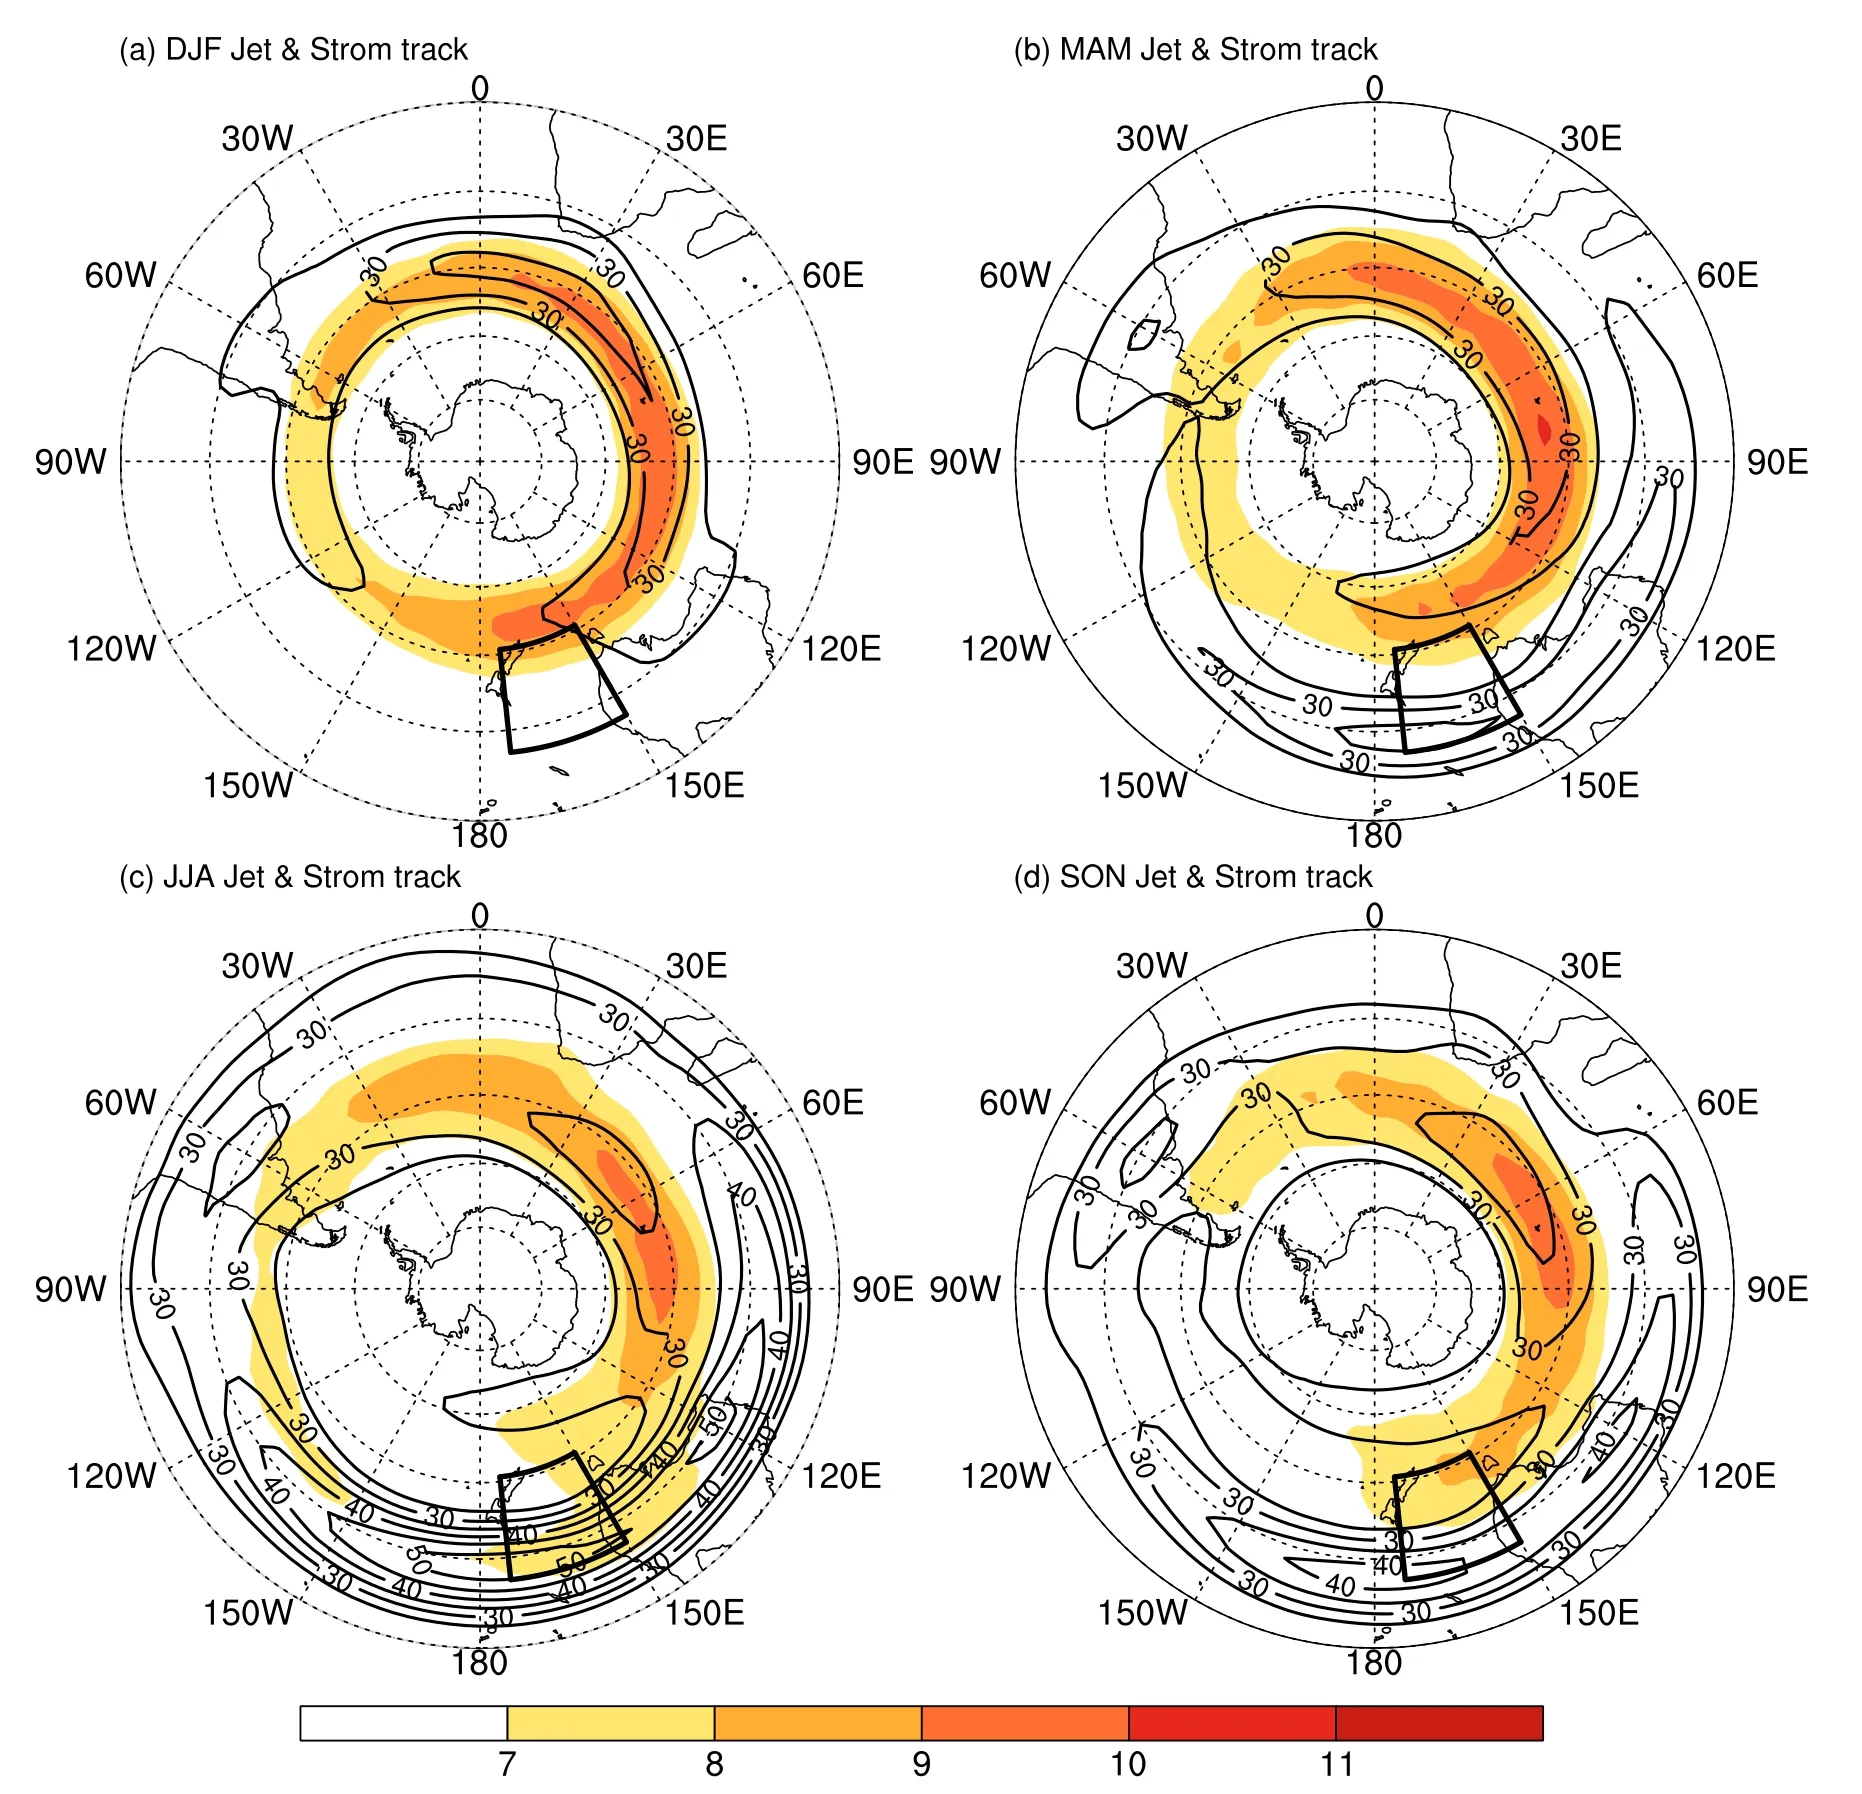
Fig. 1. The 200-hPa climatological zonal wind (contour, units: m s-1) contoured every 5 m s-1 above 25 m s-1 and the upper-tropospheric storm track (shaded, units: m s-1) based on the standard deviation of the band-pass filtered (2.5-6-day periods) 300-hPa meridional wind for (a) DJF, (b) MAM, (c) JJA, and (d) SON. Shaded areas denote values greater than 7 m s-1. The box in each panel represents the Tasman Sea region (26°-46°S, 150°-174°E).
Previous studies suggest that, on interannual timescales,the Tasman Sea SST is an important factor for local and remote climates. First, it influences the weather and climate of Australia and New Zealand (Hopkins and Holland, 1997;Pook et al., 2006, 2013; Risbey et al., 2009) through impacting the formation and maintenance of the atmospheric blocking high over the Tasman Sea (Simpson and Downey, 1975;Baines, 1983) and the activity of Australian east coastal cyclones (Browning and Goodwin, 2013). Second, it affects the occurrence of extreme marine heatwaves (MHWs), the synoptic-scale anomalous warm water events with durations of five days or longer (Hobday et al., 2016), which may cause devastation of the marine ecosystems and even severe economic tensions (Garrabou et al., 2009; Mills et al., 2013;Wernberg et al., 2013; Oliver et al., 2017). During those years with higher SST, the occurrence of MHWs in the Tasman Sea generally increases (Oliver et al., 2018). Finally,the SST in the Tasman Sea may be a potential precursor for the remote Asian climate by influencing the cross-equatorial atmospheric teleconnection or the lower-tropospheric crossequatorial flows (Liess et al., 2014; Zhao et al., 2019). A recent study suggests that warming in the Tasman Sea promotes increases in air temperature over the Antarctic Peninsula through a poleward shift of Southern Ocean storm tracks (Sato et al., 2021). Therefore, understanding the variability of SST in the Tasman Sea is of great social and climatic significance.
The processes responsible for the interannual variability of SST in the Tasman Sea are complicated. Frankignoul and Hasselmann (1977) suggested that a large fraction of the SST variability could be explained as a red-noise oceanic response to shorter time scale atmospheric random forcing such as surface heat flux. Consistent with this, Fauchereau et al. (2003) demonstrated that the SST anomalies (SSTAs)in the Tasman Sea seemed to be a response to anomalous latent heat release related to anomalous near-surface winds.More recently, by using the ECCOv4 ocean reanalysis,Bowen et al. (2017) found that the air-sea heat flux contributes to the SSTAs around New Zealand. In addition to these atmospheric flux forcings, the SST is concurrently affected by the heat transport of the ocean current like the EAC, whose strength and extension respond to changes in the South Pacific wind field (Hill et al., 2008; Holbrook et al., 2011;Wu et al., 2012; Chung et al., 2017; Li et al., 2020). Both Ridgway (2007) and Roemmich et al. (2007) suggested that SST warmth in the Tasman Sea was related to the enhanced southward transport of EAC. In agreement with this, Hill et al. (2008) found the variations in temperature at Tasmania can be explained by the heat transport of EAC, and a recent study by Li et al. (2020) showed that a total of 51% of the historical MHWs in the Tasman Sea was primarily due to the increased poleward transports of EAC. Mechanically, the southward extension of EAC, particularly the portion south of 33°S, often causes an unsteady train of mesoscale eddies,increasing eddy mixing (Stammer et al., 2006).
Aside from local and adjacent atmospheric and oceanic factors, SSTAs in the Tasman Sea are also influenced by remote forcings like El Ni?o-Southern Oscillation (ENSO),the most prominent mode of interannual climate variability(Philander et al., 1984; McPhaden et al., 2006; Deser et al.,2010). ENSO excites a Pacific-South America (PSA) teleconnection to influence the southern extratropics (Hoskins and Karoly, 1981). The surface atmospheric feedback processes linked to ENSO may alter the extratropical SST through a so-called atmospheric bridge (Alexander et al., 2002).Verdy et al. (2006) illustrated that ENSO drives a low-level anomalous circulation pattern over the South Pacific, which causes surface heat flux anomalies and subsequently the SSTAs in the regions of the Antarctic Circumpolar Current.Similarly, Ciasto and England (2011) demonstrated that the ENSO-related atmospheric circulation coincides well with the turbulent heat flux and contributes to the SST variability in the Southern Ocean. Guan et al. (2014) suggested that the ENSO-related PSA pattern generates persistent anomalies in sea level pressure and surface winds around New Zealand and the mid-latitudinal South Pacific. These anomalies cause surface air-sea heat flux anomalies through the evaporation-wind feedback or Ekman drift, and the arched SSTA pattern, which consists of the two major centers of the South Pacific Ocean Dipole (SPOD) pattern during austral summer. In addition, the ENSO-associated oceanic flow and oceanic waves may also affect the extratropical SST through an oceanic tunnel (oceanic bridge) (Liu and Alexander, 2007). Holbrook et al. (2005) suggested that the 3-3.5-yr oscillation of oceanic temperature variability in the upper Southwest Pacific was connected to the EAC and its extension, which might be explained as the forced result of westward propagating oceanic Rossby waves. Also, studies demonstrated the ENSO-related SSTAs in the Southern Hemisphere projects strongly onto the ENSO-related Ekman heat transport due to ocean dynamics (Ciasto and Thompson,2008; Ciasto and England, 2011). Cetina-Heredia et al.(2014) identified a lagged increase/decrease of southward EAC heat transport approximately 6-9 months after the end of an El Ni?o/La Ni?a event. The increased/decreased southward heat transport might alter the SST nearby (Ridgway,2007; Roemmich et al., 2007; Li et al., 2020). These studies suggest a substantial remote influence of ENSO on southern mid-latitudinal SSTAs, including those in the Tasman Sea,where the strongest SST variability occurs in the peak phase of ENSO, December-January-February (DJF) (Fig. 2).
However, from several randomly selected cases as displayed in Table 1, the connection of SST in the Tasman Sea to ENSO seems asymmetric with respect to the opposite phases of ENSO (Fig. 3). In La Ni?a years, the SSTAs generally increase over the whole basin (Figs. 3b, d, f). In contrast, in El Ni?o years there is no general basin cooling, but a dipolar pattern with warmth in the northwest and cooling in the southeast (Figs. 3a, c, e). In our understanding, such an asymmetric relationship has not been sufficiently investigated. Research on this issue will contribute to a better understanding of the interannual variability of SST in the Tasman Sea, also yielding insight into the non-linear relationship between East Australian rainfall and ENSO (Power et al.,2006; Cai et al., 2010; King et al., 2015; Chung and Power,2017), since the moisture availability in the southwest Pacific has been proposed as a possible mechanism explaining such a relationship (King et al., 2015).

Fig. 2. Spatial distribution of seasonal mean climatological SST (contour, units: °C) and the standard deviation (shaded, units:°C) of detrended SSTAs for (a) DJF, (b) MAM, (c) JJA, and (d) SON. The box in each panel represents the Tasman Sea region as in Fig.1.
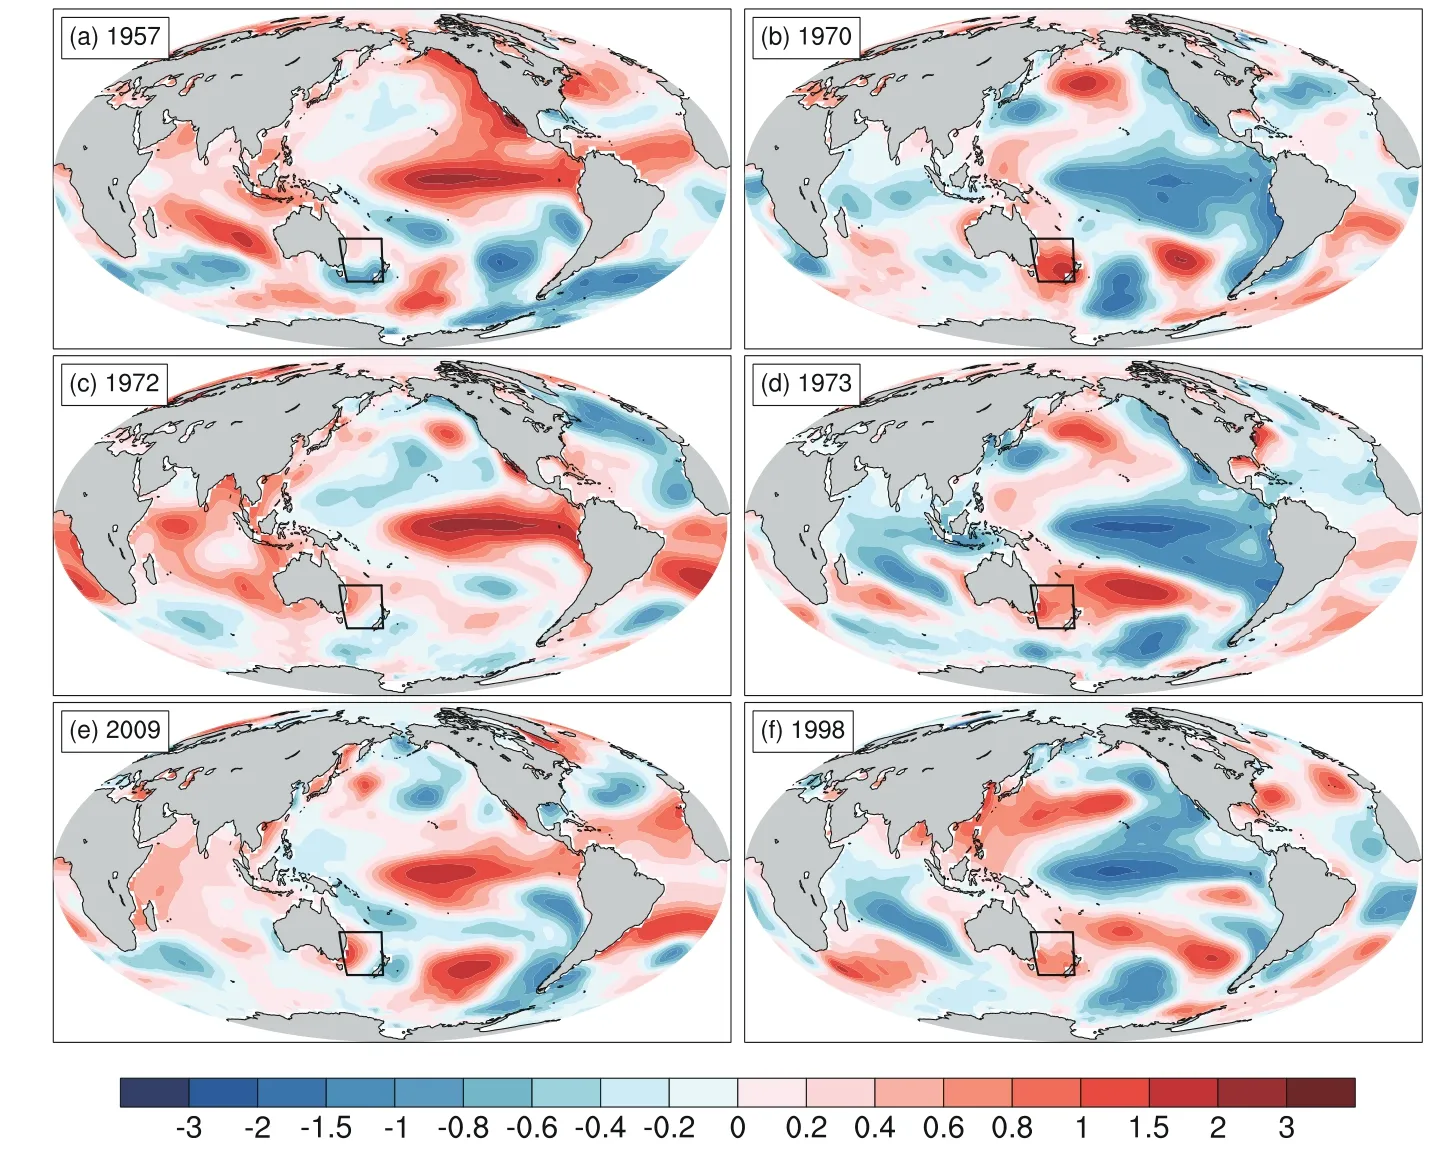
Fig. 3. The DJF-mean global SST anomaly patterns (units: °C) in (a) 1957, (b) 1970, (c)1972, (d) 1973, (e) 2009, and (f) 1998. The left and right columns show SSTAs in El Ni?o years and La Ni?a years, respectively. The year in the top left of each panel is the year of December. The box in each panel represents the Tasman Sea region as in Fig. 1.
This paper is structured as follows. Section 2 outlines the data and methods adopted in this study. Section 3 examines the connection of SSTAs in the Tasman Sea with those in the tropical central-eastern Pacific and identifies the asymmetric connection with respect to the phase of ENSO. Section 4 analyzes the possible mechanisms for the asymmetry of SST in terms of local air-sea heat fluxes and heat advection by oceanic currents. The roles of the above two factors are further diagnosed by examining a heat budge in the local ocean mixed layer in section 5. Finally, a summary is presented in section 6.
2.Data and Methods
2.1.Data
The National Oceanic and Atmospheric Administration(NOAA) Extended Reconstructed SST monthly data (version 5, ERSSTv5) (Huang et al., 2017), with a resolution of 2.5° ×2.5° from 1950 to 2019, is used in this study. Reanalysis of monthly sea level pressure (SLP) and multi-level geopotential height spanning 1950-2019 with a resolution of 2.5° × 2.5°are obtained from the National Centers for Environmental Prediction-National Center for Atmospheric Research (NCEP/NCAR) (Kalnay et al., 1996). Monthly zonal and meridional wind stress data from 1950 to 2019 also comes from the NCEP/NCAR, but with a resolution of 1.9° × 1.9°. One previous study (Kumar and Hu, 2012) suggests that the ENSOrelated wind stress anomalies from this dataset exhibit a qualitative consistency with several other reanalyses, although the ENSO-related air-sea coupled variabilities inherent to this dataset have the largest biases compared with other reanalyses. Thus, it seems plausible to use wind stress from the NCEP/NCAR dataset.
The surface heat fluxes, including net surface shortwave and longwave fluxes and sensible heat and latent heat fluxes,come from the ERA-Interim (Dee et al., 2011), which has a resolution of 1° × 1° and spans 1979-2019. One should note that the ERA-Interim cannot precisely reflect the observations due to its lack of observation constraint in the uncoupled data assimilation systems, although the ERA-Interim heat fluxes are widely used to explore the reasons behind the SST anomalies (Montoya-Sánchez et al., 2018; Hu et al.,2019; Jo et al., 2019) and there were substantial improvements regarding the handling of data biases (Berrisford et al.,2011; Dee et al., 2011). The monthly precipitation data, on a 2.5° × 2.5° grid, is obtained from the precipitation reconstruction (PREC) (Chen et al., 2002). In addition, the monthly oceanic temperature, total sea-surface downward heat flux, and the ocean current velocity from the global ocean data assimilation system (GODAS) (Behringer and Xue, 2004) are also employed. The GODAS is developed at the NCEP and spans the period from 1980 to the present with a resolution of 0.333° × 1.0°.
This study focuses on the austral summer (DJF), when the SST variability in the Tasman Sea (Fig. 2), the ENSOrelated anomalies (Wei et al., 2020; Ham et al., 2021), and the ENSO-associated SH teleconnections (Yuan, 2004;Ciasto and England, 2011) are seasonally strongest.Because it crosses a calendar year, for a specific case, the year corresponding to the season is marked as the year of December (the earlier year). As in Cai et al. (2012), all datasets are linearly detrended to ensure that any generated relationship is not a result of long-term trends in the respective time series. The climatological norm is calculated as the mean throughout the period 1981-2010.
2.2. Methods
2.2.1.Analysis technique
The main statistical tools used include linear regression and composite analysis. Linear regression analysis is utilized to preliminarily estimate the asymmetry in ENSO teleconnection with the Tasman Sea SSTAs. Composite analysis allows for comparison between the SSTAs in El Ni?o and La Ni?a events to further isolate the asymmetric relationship. Halves of the differences (sums) between the composite La Ni?a and El Ni?o events are defined as the symmetric(asymmetric) components associated with ENSO (Li et al.,2007; Wang et al., 2010). In other words, the symmetric components are approximated by (La Ni?a - El Ni?o)/2, and the asymmetric components are estimated by (La Ni?a + El Ni?o)/2.
ENSO is defined with the Ni?o-3.4 index (the area-averaged SSTAs over 5°S-5°N, 170°-120°W), and a total of 11 El Ni?o years and 10 La Ni?a years during 1950-2018 are selected following the threshold of one standard deviation of DJF mean Ni?o-3.4 index (Table 1). Given the lengths of different datasets and our purpose of discussing air-sea interactions, only 7 El Ni?o and 6 La Ni?a cases since 1980 are used for composite analysis to ensure a relative consistency in the atmospheric and oceanic anomalies during the same periods. The Tasman Sea is bounded by 26°-46°S, 150°-174°E (boxed in Fig. 1), as in Perkins-Kirkpatrick et al.(2019).

Table 1. Years of El Ni?o and La Ni?a during the period of 1950-2018 following the threshold of one standard deviation of DJF mean Ni?o-3.4 index.
2.2.2.Ekman heat transport
Following Alexander and Scott (2008), the heat flux due to Ekman drift current is computed using

wherecpis the specific heat capacity of seawater, 4100 J(Kg °C)-1,fis the Coriolis parameter, τxand τyare the zonal and meridional wind stress, and ?SST/?xand?SST/?yare the zonal and meridional SST gradients. Considering the greater importance of the poleward heat flux linked to EAC, we only analyze the meridional component(cpτx?SST/f/?y)ofHek.
2.2.3.Ocean mixed layer heat budget
To compare the relative roles of air-sea heat fluxes and oceanic dynamics in driving ENSO-related SSTAs in the Tasman Sea and isolate the relative contributions of different physical processes, we perform the ocean mixed layer heat budget analysis as in previous studies (Zhang et al., 2007;Ren and Jin, 2013). Ignoring the second-order non-linear terms (Ren and Jin, 2013), the mixed layer averaged temperature tendency equation can be expressed as

where an overbar denotes a climatological mean and a prime represents anomalies relative to the climatological mean;T,u,v,ware the oceanic temperature, zonal current,meridionalcurrent,andverticalcurrentvelocity,respectively. ParametersQ′
net,ρ,cpandHstandfor the netsurface heat flux anomaly, the density of seawater (ρ= 1024 kg m-3), the specific heat of seawater,and the climatological monthly depth of mixed layer in the Tasman Sea obtained from the World Ocean Atlas (Monterey and Levitus, 1997),individually. The last term,Ris the residual term, which is not considered in this study.
The mean vertical advection in Eq. (2) can be further decomposed into two terms in an approximation (Jin and Neelin, 1993; An et al., 1999; Zhang et al., 2007) as follows

Following Ren and Jin (2013), we regroup Eq. (2) into seven feedback terms as follows

where

Here, MC, EK, ZA, MA, TD, and TH represent mean circulation feedback, Ekman pumping feedback, zonal advection feedback, meridional advection feedback, thermodynamic feedback, and thermocline feedback, respectively.
2.2.4.An anomaly AGCM
To isolate the direct effect of the ENSO-related asymmetric heating, a diagnostic experiment with an anomaly atmospheric general circulation model (AGCM) (Li, 2006) is conducted. This anomaly AGCM is a modified dry version of the Princeton AGCM (Held and Suarez, 1994) with five evenly distributed sigma levels (σ= 0.1, 0.3, 0.5, 0.7, 0.9 from top to bottom level) and a horizontal resolution of T42.It is linearized by the specified three-dimensional seasonal mean basic state so that the model response to a specific heating anomaly can be examined. In our experiment, the 3D DJF-mean state, which comes from the long-term mean of the NCEP-NCAR reanalysis, is prescribed as the model basic state. Rayleigh friction with a strong momentum damping rate of 1 d-1is applied in the lowest model level (σ=0.9). Newtonian cooling with an e-folding time scale of 10 days is applied to all model levels in both momentum and heat equations. It takes about 25 days for the AGCM response to reach an equilibrium state under these damping terms, and we choose the last 20 days of a 60-day integration to estimate the atmospheric responses to the tropical forcing.More details about this model can be found in Li (2006) and Li et al. (2014).
3.Connection of SST in the Tasman Sea to ENSO
As illustrated in the introduction, ENSO affects the interannual variability of the southern extratropical SST. The regression results show that SSTAs in much of the Tasman Sea tend to be cooler when the Ni?o-3.4 values are positive(Fig. 4a), indicating a negative relationship between them.This is consistent with a significant correlation coefficient of -0.24 (p-value = 0.043) between the area-averaged SSTAs in the Tasman Sea and the Ni?o-3.4 index. To examine whether the connection is asymmetric or not, we calculate the regression of SSTAs when ENSO is positive (Fig. 4b)and when ENSO is negative (Fig. 4c), respectively. When comparing Fig. 4b with Fig. 4c, a remarkable asymmetry is seen regarding the distribution and the amplitude of SSTAs,in that the El Ni?o-related SSTAs are manifested as a dipole pattern with modest warming in the northwest and weak cooling in the southeast of the Tasman Sea (Fig. 4b). In contrast,the SSTAs associated with La Ni?a show significant basinwide warming (Fig. 4c).
To shed light on the asymmetry, a composite analysis is performed for the El Ni?o and La Ni?a cases, respectively.The composite SSTAs for the El Ni?o and La Ni?a cases(Figs. 5a-b) bear a close resemblance to their corresponding SST regressions (Figs. 4b-c), with spatial correlation coefficients of 0.86 and 0.64, respectively. There is weak warming in the northwest Tasman Sea along with a modest cooling in the southeast in the El Ni?o cases (Fig. 5a), but there is significant warming in nearly the entire Tasman Sea in the La Ni?a cases (Fig. 5b). This indicates greater amplitudes of SSTAs corresponding to La Ni?a, in addition to the asymmetry between their spatial patterns. The asymmetry of SSTAs in the Tasman Sea between the La Ni?a and El Ni?o cases is further seen from their symmetric and asymmetric components (Figs. 5c-d). The symmetric component shows remarkable consistency with the composite in the La Ni?a cases.The asymmetric component exhibits a monopole pattern with the maximum offshore southeast to the Australian coast. One additional calculation is performed based on the HadISST1 dataset (Rayner et al., 2003), and a similar composite pattern has been obtained (not shown), implying that the asymmetry is robust and insensitive to the datasets used.The possible mechanisms responsible for the asymmetrical response to ENSO phase are explored in the next section.

Fig. 4. The SSTAs (units: °C) regressed by the Ni?o-3.4 index using (a) all samples, (b) samples with positive Ni?o-3.4 values, and(c) samples with sign-reversed negative Ni?o-3.4 values. Hatching indicates significance at the 90% confidence level. The black boxes represent the Tasman Sea region as in Fig. 1.

Fig. 5. Composite DJF mean SSTAs (units: °C) for (a) El Ni?o years and (b) La Ni?a years. Panel (c) are the symmetric components estimated by half of the difference of (b) and (a). Panel (d) shows the asymmetric components estimated by half of the sum of (b) and (a). Hatching indicates significance at the 90% confidence level.
4.Processes responsible for ENSO’s asymmetric influence on the Tasman Sea
4.1.Surface air-sea heat flux
Alexander et al. (2002) suggest that the surface heat fluxes are the key components of the atmospheric bridge driving extratropical SSTAs. In austral summer, the SST in the Southwest Pacific is susceptible to air-sea exchanges due to the shallow mixed layer depth (Guan et al., 2014; Bowen et al., 2017). Thus, the surface heat fluxes may be especially important for the formation of SSTAs in the Tasman Sea.
Figure 6 depicts the composite surface heat flux anomalies of El Ni?o and La Ni?a and their asymmetric components. Here, a downward heat flux has a positive sign, and thus a positive (negative) anomaly indicates the forcing role of the above atmosphere (ocean beneath) on the ocean beneath (above atmosphere). In El Ni?o years, the surface heat flux mainly features insignificant positive anomalies over the Tasman Sea, along with scattered negative anomalies in the center (Fig. 6a). The positive anomalies in the southeast Tasman Sea suppress the cold SST anomalies therein (compare Fig. 6a and Fig. 5a). In La Ni?a years, the heat flux anomalies manifest themselves as significant negative values, which inhibit the formation of warm SST anomalies(compare Fig. 6b and Fig. 5b). The spatial correlation of the heat flux composite with the corresponding SSTA composite in the Tasman Sea is -0.21 and -0.44 for the El Ni?o and La Ni?a years, respectively. Also, the asymmetric component of composite surface heat fluxes is negatively correlated with that of composite SSTAs with a value of -0.48. These indicate that the surface heat fluxes play a damping role in shaping the ENSO-related SSTAs in the Tasman Sea. This result is consistent with previous investigations on the role of surface heat fluxes over other frontal regions like the Kuroshio in the North Pacific and the Gulf Stream in the North Atlantic, where heat fluxes damp the low-frequency SST anomalies (Kwon and Deser, 2007; Kwon et al., 2010)along with a positive correlation of local SST with surface heat flux (where a sign of positive indicates upward) (Tanimoto et al., 2003; Park et al., 2005).
As for the individual roles of components composing the surface heat flux, area-averaged shortwave (SW) and longwave (LW) radiative flux, and sensible heat (SH) and latent heat (LH) flux, as well as the total heat flux (Sum), are compared in Fig. 7. In the El Ni?o years, the LW and SH are negligible, and the SW and LH contributed to the positive net heat fluxes that warmed the SST in the Tasman Sea (Fig.7a). In comparison, in La Ni?a years, the SW and LW radiative fluxes tend to offset each other. The negative net radiative flux strengthens the negative SH and LH, leading to a negative residual which tends to reduce the SST (Fig. 7b). When considering that the observed composite SSTAs in El Ni?o and La Ni?a years are neutral and positive, different from the contribution of net heat flux, then the surface fluxes are not the dominant factor for the SSTAs in the Tasman Sea. This is verified by the diagnosis of the asymmetric component (Fig.7c), in which the net effect of surface heat flux does not contribute to the asymmetry of the SSTAs.
4.2.Oceanic dynamics
Previous studies revealed a time-lagged relationship between ENSO and the heat transport induced by the EAC but did not focus on the differences in heat transport between the two phases of ENSO (Ridgway, 2007; Cetina-Heredia et al., 2014; Pattiaratchi and Siji, 2020). In this section, the oceanic horizontal heat transport induced by Ekman drift is investigated for the two opposite phases of ENSO. In El Ni?o years, there is cold oceanic advection related to a weakened EAC in the eastern Tasman Sea (Fig.8a), which has contributed to the observed negative SSTAs there (compare Fig. 8a and Fig. 5a). In contrast, in La Ni?a years, almost the entire Tasman Sea is dominated by intensified southward currents, leading to enhanced warm advection and positive SSTAs (compare Fig. 8b with Fig. 5b). An evident difference is seen in the amplitude of advection between two opposite ENSO phases (compare Fig. 8a and Fig. 8b), yielding an asymmetry in the heat advection (Fig.8c) and then SSTAs (Fig. 5d). Therefore, the ENSO-related horizontal heat advection by oceanic currents may have played a substantial role in the ENSO-related SSTAs in the Tasman Sea as well as their asymmetry. Notably, the intensification of the EAC in the western Tasman Sea in the La Ni?a years is even more evident than in the El Ni?o years(Figs. 8a-b). This may lead to less predictability in the SSTAs or Marine Heat Waves over the Tasman Sea region for El Ni?o years compared to La Ni?a years.

Fig. 6. Composite DJF mean surface heat flux anomalies (positive: downward; units: W m-2) for (a) El Ni?o events and (b)La Ni?a events. Panel (c) shows the asymmetric components between (a) and (b). Hatching indicates significance at the 90%confidence level.

Fig. 7. The region-averaged shortwave (SW), longwave (LW)radiative heat flux, sensible heat (SH) and latent heat (LH) flux anomalies and their sum (units: W m-2) over the Tasman Sea for (a) El Ni?o events, (b) La Ni?a events and (c) the asymmetric components between (a) and (b). Positive heat fluxes are directed into the ocean. The number in the top right of each panel indicates the area-averaged SSTAs (units: °C).
Previous studies suggested that the Ekman heat transport is instrumental in creating extratropical SSTAs (Alexander et al., 2002; Rintoul and England, 2002; Ciasto and England,2011). Figure 9 shows the meridional Ekman heat transport induced by zonal wind stress. The anomalous easterlies in the Tasman Sea drive a poleward Ekman transport during La Ni?a cases, leading to positive heat transport anomalies(Fig. 9b). The situation is opposite in El Ni?o events but features weaker westerlies and smaller heat flux anomalies (Fig.9a). Thus, the spatial pattern of the asymmetric components is dominated by the anomalies in the La Ni?a events (compare Figs. 9c and 9b). The overall similarity of the SSTAs to the meridional Ekman heat transport anomalies indicates that the anomalous Ekman heat transport dominates the ENSOrelated SSTAs in the Tasman Sea (compare Fig. 5 and Fig.9).
Given that the upper atmospheric teleconnections originating from the tropics can propagate into the extratropics and influence the extratropical lower atmospheric circulation through baroclinic adjustment, eddy momentum, and heat flux adjustment, this will further affect the upper oceanic currents through Ekman drift or thermodynamic processes. The ENSO-related atmospheric circulation shows a baroclinic Southern Oscillation (SO) pattern in the tropics and an equivalent barotropic PSA pattern in the southern extratropics (Fig.10). In El Ni?o years, the Australia-Tasman Sea sector is dominated by positive SLP anomalies, which causes the anomalous southwesterly current to prevail in the eastern Tasman Sea (compare Fig. 10a and Fig. 8a). In contrast, during La Ni?a years, the SLP anomalies are characterized by a dipole pattern in the Tasman Sea, which results in the prevalence of anomalous northeasterly currents (compare Fig. 10b and Fig. 8b). Moreover, the anomalous atmospheric circulation is nearly symmetric in the tropics but significantly asymmetric in the Tasman Sea (Figs. 10c, f, i).

Fig. 8. Composite oceanic current anomalies (vector, units: m s-1) at 5-m depth and the horizontal temperature advection anomalies (shaded, units: 10-8 °C s-1) driven by the currents for (a) El Ni?o events and (b) La Ni?a events. Panel (c) shows the asymmetric components between (a) and (b). Only the currents with speeds greater than 0.004 m s-1 are displayed in (a, b)and those greater than 0.002 m s-1 are displayed in (c).

Fig. 9. As Fig. 8, but for the meridional Ekman heat transport anomalies (shaded, units: W m-2) and wind stress anomalies(vector, units: N m-2). Only the vectors with speeds greater than 0.005 N m-2 are displayed in (a, b) and those greater than 0.0025 N m-2 are displayed in (c).

Fig. 10. Composite DJF mean SLP anomalies (a-c, units: hPa), 500-hPa (d-f) and 200-hPa (g-i) geopotential height anomalies (units: m) for El Ni?o events (left column), La Ni?a events (middle column) and asymmetric components (right column). Dotted areas are significant at the 90% confidence level.
5.Discussion
5.1.The relative importance of meridional heat transport and surface heat flux
The above analyses illustrate the damping role of the surface heat fluxes and the influential role of the oceanic heat transport in producing the ENSO-related SSTAs as well as their asymmetry with respect to the phase of ENSO. To verify this, as in Chen and Li (2021) and Jo et al. (2019), we perform a heat budget analysis of the oceanic mixed layer temperature for the early phase of ENSO (October-November-December-January, ONDJ) by using GODAS data based on Eq. (4)(see section 2). This approach is effective in understanding and monitoring the SST variability (Huang et al., 2010).The results suggest that the MA term related to the Ekman meridional heat transport and the TD term associated with the surface heat flux are dominant (Fig. 11). In El Ni?o years, the TD term contributes to the warming tendency and damps the cool SST anomalies, while the MA term offsets the warming tendency and favors cooling anomalies (Fig.11a). In comparison, in La Ni?a cases, the MA term contributes to both warm SST anomalies and positive SST tendency with a contribution rate of 0.10°C month-1, but the TD term damps the SSTAs and the SST tendency. The contribution of the MA term is mostly counteracted by the TD term, leading to a much weaker SST tendency of 0.016°C month-1(Fig. 11b). The asymmetric SSTAs and warming tendency are explained well by the MA term, rather than the TD term (Fig. 11c). Quantitatively, the MA term contributes 89.6% to the tendency of the asymmetric SST. This result verifies the critical role of the meridional heat transport in generating ENSO-related SSTAs. The damping role of the surface heat fluxes, shown in Figs. 11b-c is in agreement with the above finding that ENSO’s connection with SST in the Tasman Sea cannot be attributed to the anomalous surface heat flux.

Fig. 11. Composite SSTAs (T′, units: °C) and mixed-layer heat budget for each term(units: °C month-1) during ONDJ of (a) El Ni?o, (b) La Ni?a, and (c) their asymmetric components averaged in the Tasman Sea. The x-axis label “sum”represents the sum of terms on the right side of Eq. (4) except R term.
5.2.Cause of the asymmetry
As mentioned above, the asymmetry in anomalous atmospheric circulation between the El Ni?o and La Ni?a years may result in asymmetry in SSTAs in the Tasman Sea.Figure 12 shows the composite precipitation anomalies and SSTAs, along with their symmetric and asymmetric components about the phase of ENSO. The positive SSTAs in the tropical eastern Pacific during El Ni?o are stronger than the negative SSTAs during La Ni?a, whereas the negative SSTAs in the tropical central Pacific during La Ni?a are stronger and extend farther westward (compare Fig. 12a and 12c), which leads to dipolar asymmetric SSTAs in the tropical middle-eastern Pacific (Fig. 12g). Corresponding to the SSTAs, the asymmetric precipitation anomalies also show a dipolar pattern with increased precipitation in the tropical eastern Pacific and decreased precipitation in the central Pacific(Fig. 12h). These results are consistent with those of Wu et al. (2010), although the ENSO years they used were selected from 1949-2002. The asymmetry in precipitation anomalies may play an important role in shaping the asymmetry in SSTAs through the direct induction of an asymmetry in atmospheric circulation.
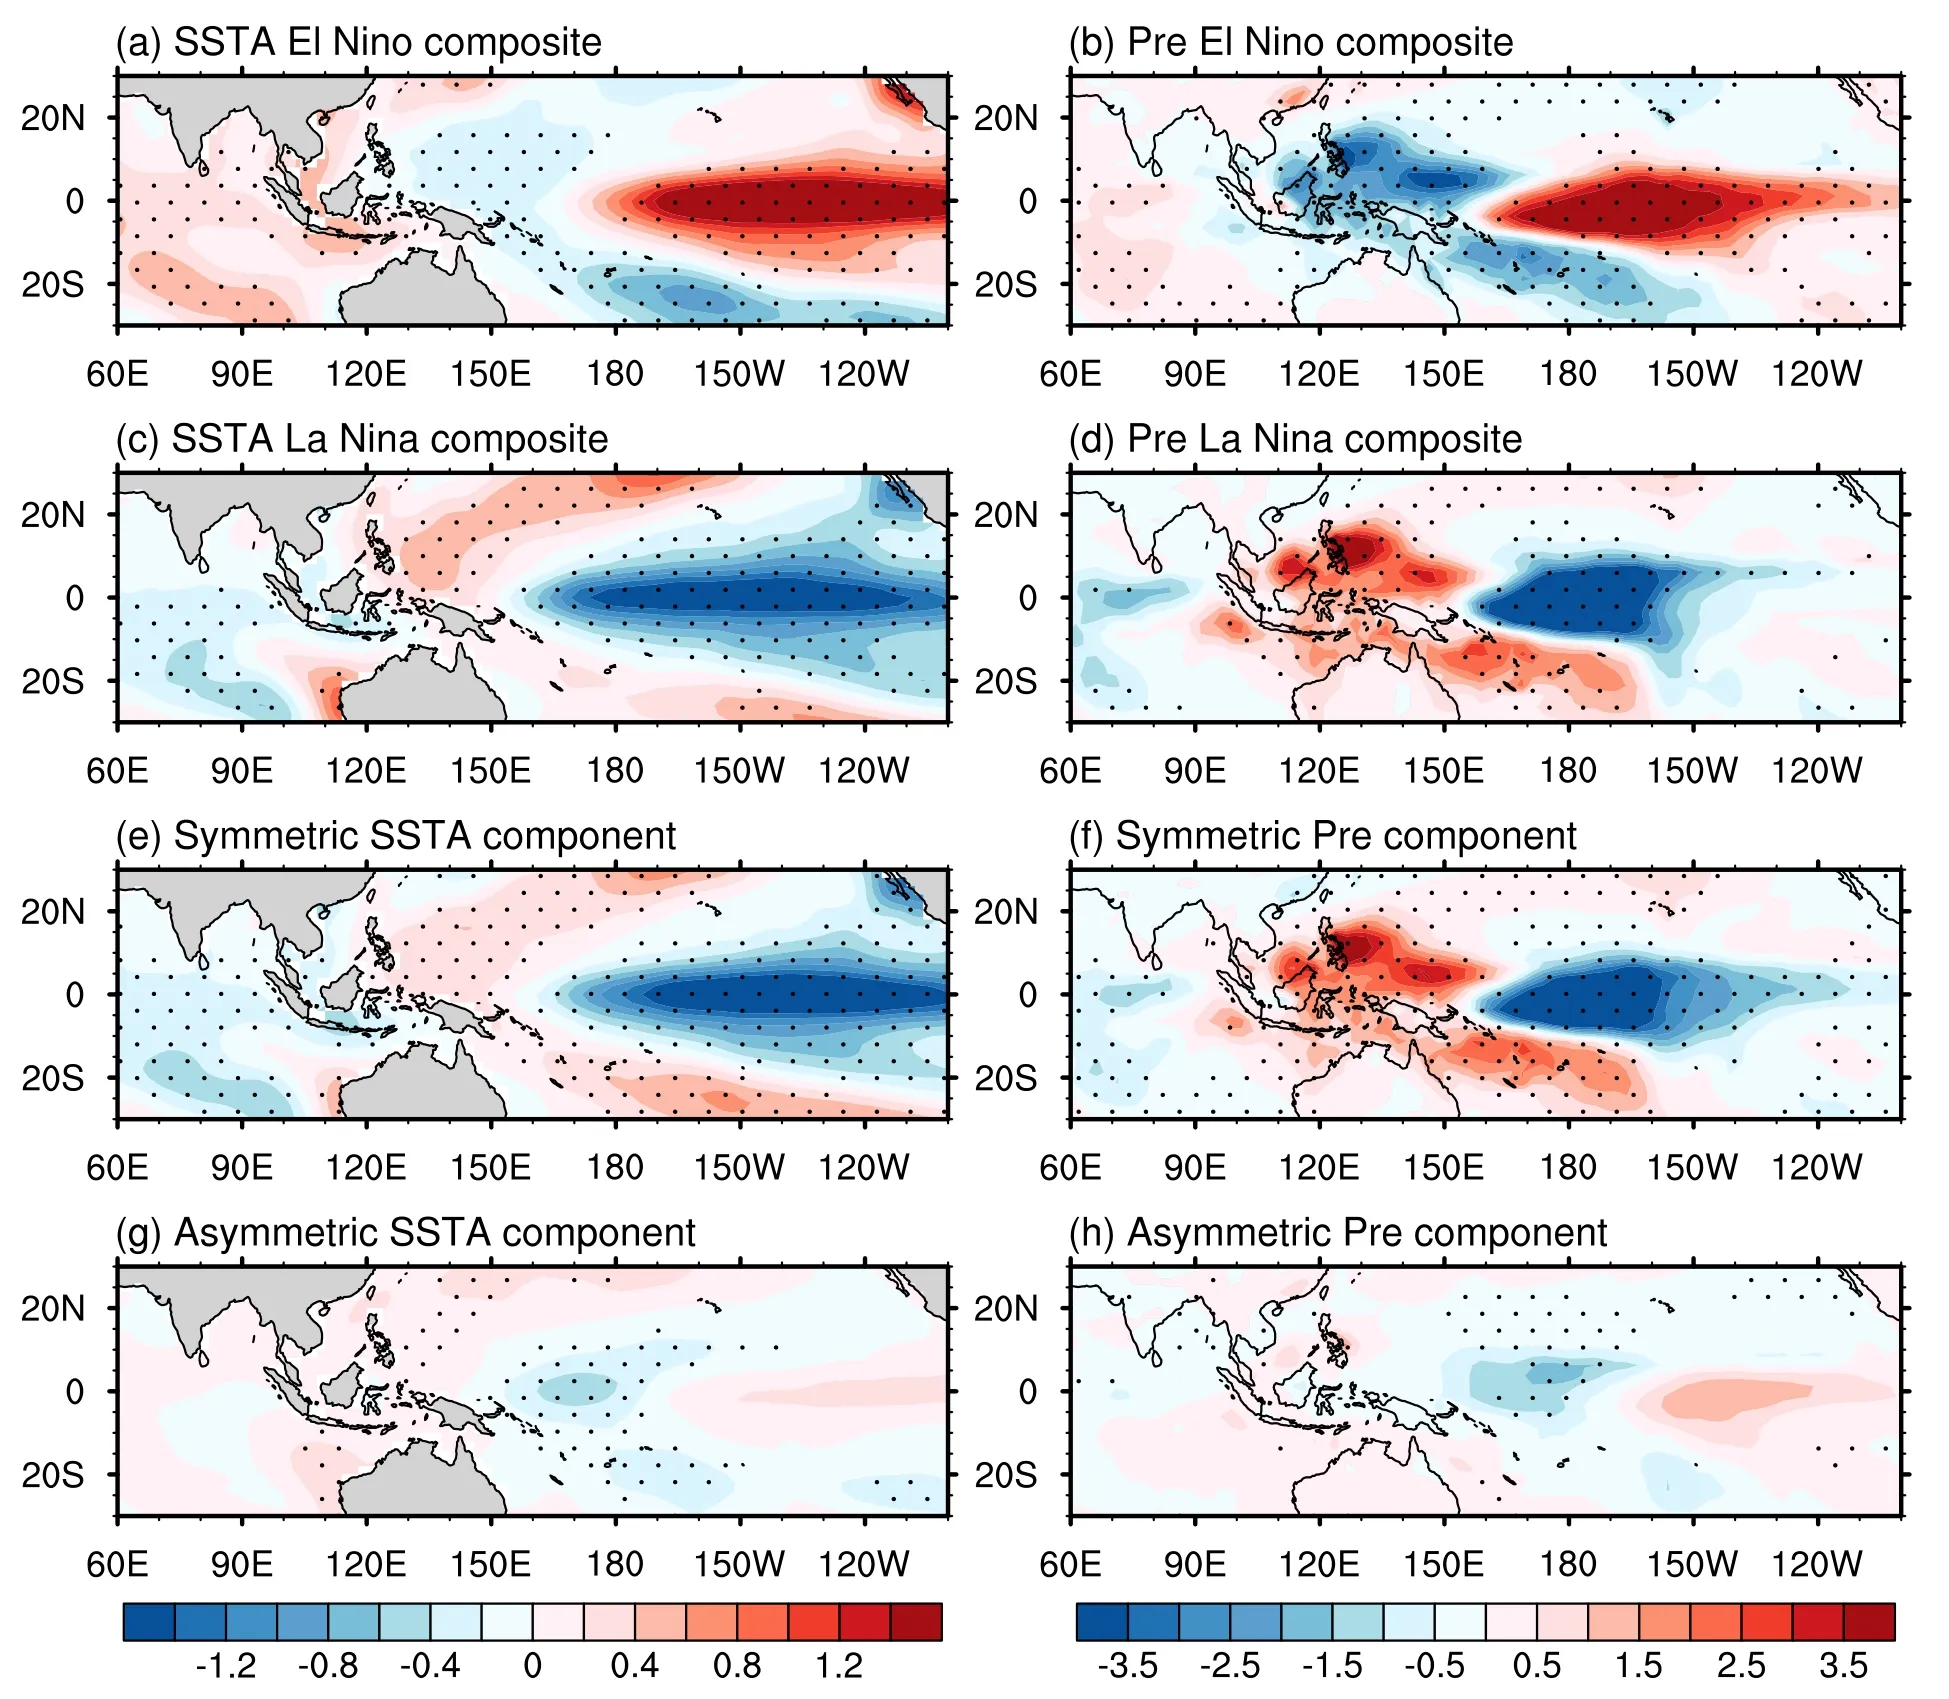
Fig. 12. Composite DJF mean SSTAs (a, c, e, g; units: °C) and precipitation anomalies (b, d, f, h; units: mm d-1) for (a, b) El Ni?o events and (c, d) La Ni?a events. Panels (e) and (f) are the symmetric components estimated by half of the difference between (c) and (a), and (d) and (b), respectively. Panels (g) and (h) are the asymmetric components estimated by half of the sum of (a) and (c), and (b) and (d), respectively. The areas dotted are significant at the 90% confidence level.
To verify our conjecture and exclude other factors, a diagnostic experiment with an anomaly AGCM is conducted(see section 2.2.4). Previous studies have suggested that the latent heat release by precipitation dominates the total diabatic heating (e.g., Hagos et al., 2010). Thus, we use the asymmetric components of precipitation (Fig. 12h) in the tropical Pacific (150°E-90°W, 10°S-10°N) to calculate the diabatic heating (Fig. 13). The horizontal pattern of the heating rate at 500 hPa is displayed in Fig. 13a, which shows an identical distribution to that of asymmetric precipitation anomalies(compare Fig. 13a and Fig. 12h). The vertical profile of the diabatic heating prescribed over the dot in Fig. 14a has a maximum at about 500hPa (σ= 0.5) to mimic the tropical rainfall-induced convective heating (Fig. 13b). The AGCM response features a wave-train-like structure with alternative positive and negative centers in the extratropical South Pacific (Fig. 14). It bears a resemblance to the asymmetric atmospheric circulation between the El Ni?o and La Ni?a years, although the intensity and position of the centers exhibit certain differences (compare Fig. 14 and Figs. 10c, f,i). The above results illustrate that the diabatic heating derived from the asymmetric precipitation about the phase of ENSO excites a propagating teleconnection wave train in the southern extratropics. Coupled with transient feedback,an anomalous low-level atmospheric circulation appears and influences the Ekman drift as well as the SSTAs.

Fig. 13. (a) The horizontal distribution of the initial diabatic heating anomalies (units: K d-1) at 500 hPa. (b) The vertical heating profile (units: K d-1) for the dot in (a). The vertical coordinate in (b) represents sigma levels in the model.
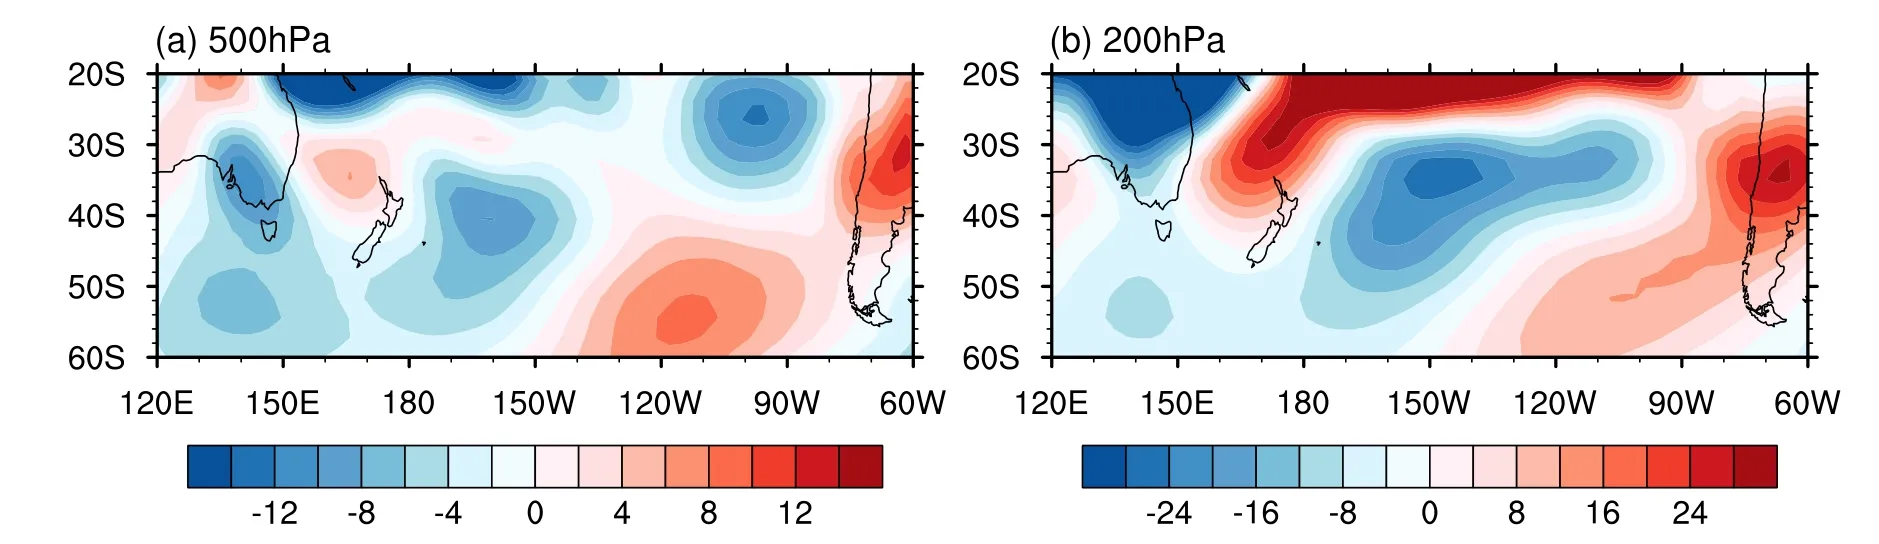
Fig. 14. (a) 500-hPa and (b) 200-hPa geopotential height responses (units: m) to the asymmetric diabatic heating simulated by the linearized AGCM in the presence of the 3D DJF-mean flow.
6.Summary
This study identifies an asymmetric connection of SST in the Tasman Sea to the opposite phase of ENSO during austral summer. The major findings are summarized below.
Based on the linear regression, SSTAs in much of the Tasman Sea tend to be negatively correlated with ENSO(Fig. 4a). But this connection is visually asymmetric in terms of both distribution and amplitude of SSTAs between two opposite ENSO phases. Specifically, the El Ni?orelated SSTAs are manifested as a dipole pattern with weak warming in the northwest and modest cooling in the southeast(Figs. 4b and 5a), while the La Ni?a-related SSTAs exhibit much stronger warmth on a basin scale (Figs. 4c and 5b).
The physical mechanisms for ENSO’s asymmetric connection with SST in the Tasman Sea were then investigated.The results suggest a damping role of the local air-sea heat fluxes (Fig. 7) and a contributive role of the oceanic heat transport especially the meridional Ekman heat transport by the zonal wind stress (Figs. 8 and 9) in the connection between ENSO and SST in the Tasman Sea. This conclusion is confirmed by the quantitative diagnosis based on the mixed layer heat budget equation (Fig. 11). Further analysis indicates the asymmetry in oceanic heat transport derives from the asymmetry in the atmospheric circulation over the Tasman Sea (Fig. 10), which may be excited by the asymmetric precipitation anomalies in the tropical Pacific (Fig. 14).
Finally, the preliminary points about the asymmetric connection of SST in the Tasman Sea to the opposite phase of ENSO are summarized in Fig. 15. In the El Ni?o years, the anomalous atmospheric circulation features a PSA pattern,and the Australia-Tasman Sea sector is dominated by positive SLP anomalies. The prevailing southwesterly oceanic currents and wind stress bring about cold advection and northward Ekman heat transport, leading to the negative SSTAs therein (Fig. 15a). In the La Ni?a years, the PSA pattern moves northwestward and the Tasman Sea is characterized by dipole SLP anomalies. The northeasterly oceanic currents and wind stress result in warm advection and southward Ekman heat transport and generate positive SSTAs (Fig.15b). The asymmetry in diabatic heating between El Ni?o and La Ni?a years stimulates the asymmetry in the lowlevel atmospheric circulation, which further induces the asymmetry in SSTAs through affecting the oceanic advection and Ekman heat transport (Fig. 15c).

Fig. 15. Summary diagram of identified influence from tropical middle-eastern Pacific on the Tasman Sea for (a) El Ni?o events, (b) La Ni?a events, and (c) the asymmetry between El Ni?o and La Ni?a, where “+Precip” indicates positive precipitation anomalies and “-Precip” indicates negative precipitation anomalies; L indicates negative SLP anomalies and H indicates positive SLP anomalies. The solid arrows show the direction of advection driven by oceanic currents and the hollow arrows show the direction of Ekman heat transport.
It should be noted that ENSO varies coherently with the Indian Ocean Basin Mode (IOBM), the dominant mode of SST variability in the Indian Ocean (Du et al., 2009; Xie et al., 2009), and with the southern annular mode (SAM;L’Heureux and Thompson, 2006) in austral summer. Cai and Van Rensch (2013) show that the modulating effect of the SAM is limited; in particular, the SAM does not modify the ENSO teleconnection pattern. However, the IOBMinduced wave train appears to be incorporated onto the ENSO-induced PSA pattern, modifying the structure of the PSA with a rather prominent pressure center situated over the Tasman Sea latitudes during the negative phase of IOBM. Thus, the connection between ENSO and SST in the Tasman Sea may be indirectly modulated by IOBM. The issue deserves a further study.
Acknowledgements. This work was jointly supported by the Strategic Priority Research Program of the Chinese Academy of Sciences (Grant No. XDA19070402) and the National Natural Science Foundation of China (Grant Nos. 41790473 and 41731177).
Open AccessThis article is licensed under a Creative Commons Attribution 4.0 International License, which permits use, sharing,adaptation, distribution and reproduction in any medium or format,as long as you give appropriate credit to the original author(s) and the source, provide a link to the Creative Commons licence, and indicate if changes were made. The images or other third party material in this article are included in the article’s Creative Commons licence, unless indicated otherwise in a credit line to the material.If material is not included in the article’s Creative Commons licence and your intended use is not permitted by statutory regulation or exceeds the permitted use, you will need to obtain permission directly from the copyright holder. To view a copy of this licence,visit http://creativecommons.org/licenses/by/4.0/.
 Advances in Atmospheric Sciences2022年11期
- Advances in Atmospheric Sciences的其它文章
- Sub-seasonal Prediction of the South China Sea Summer Monsoon Onset in the NCEP Climate Forecast System Version 2
- Reexamination of the Relationship between Tropical Cyclone Size and Intensity over the Western North Pacific
- Discrepancies in Simulated Ocean Net Surface Heat Fluxes over the North Atlantic
- A Causality-guided Statistical Approach for Modeling Extreme Mei-yu Rainfall Based on Known Large-scale Modes—A Pilot Study
- The Impact of an Abnormal Zonal Vertical Circulation in Autumn of Super El Ni?o Years on Non-tropical-cyclone Heavy Rainfall over Hainan Island
- Different Impacts of Intraseasonal Oscillations on Precipitation in Southeast China between Early and Late Summers