
The Derivation of Nutrient Criteria for the Adjacent Waters of Yellow River Estuary in China
2022-10-24 05:46:28LOUQiZHANGXueqingZHAOBeiCAOJingandLIZhengyan
LOU Qi, ZHANG Xueqing, ZHAO Bei, CAO Jing, and LI Zhengyan, 3), *
The Derivation of Nutrient Criteria for the Adjacent Waters of Yellow River Estuary in China
LOU Qi1), ZHANG Xueqing1), ZHAO Bei2), CAO Jing2), and LI Zhengyan1), 3), *
1)College of Environmental Science and Engineering, Ocean University of China,Qingdao 266100, China 2)North China Sea Environmental Monitoring Center, State Oceanic Administration, Qingdao 266033, China 3)Key Laboratory of Marine Environmental Science and Ecology, Ministry of Education, Qingdao 266100, China
Ecological protection and high-quality development of the Yellow River basin are becoming part of the national strategy in recent years. The Yellow River Estuary has been seriously affected by human activities. Especially, it has been severely polluted by the nitrogen and phosphorus from land sources, which have caused serious eutrophication and harmful algal blooms. Nutrient criteria, however, was not developed for the Yellow River Estuary, which hindered nutrient management measures and eutrophication risk assessment in this key ecological function zone of China. Based on field data during 2004–2019, we adopted the frequency distribution method, correlation analysis, Linear Regression Model (LRM), Classification and Regression Tree (CART) and Nonparametric Changepoint Analysis (nCPA) methods to establish the nutrient criteria for the adjacent waters of Yellow River Estuary. The water quality criteria of dissolved inorganic nitrogen (DIN) and soluble reactive phosphorus (SRP) are recommended as 244.0μgL?1and 22.4μgL?1, respectively. It is hoped that the results will provide scientific basis for the formulation of nutrient standards in this important estuary of China.
water quality criteria; nutrient; Yellow River Estuary; frequency distribution; classification and regression tree; eutrophication
1 Introduction
Excessive discharge of nutrients and organic matter can lead to eutrophication of seawater, and harmful algal blooms, which can seriously endanger the ecological environment and biological communities, and even endanger the mariculture, human health and ecological security (Glibert and Burkholder, 2006; Hallegraeff, 2010). Coas- tal waters are often affected by human activities and result in serious eutrophication. In particular, the estuaries and bays usually polluted by nitrogen (N) and phosphorus from land sources (Cloern, 2001). According to Bouw- man. (2005), the increase of river N export to oceans would reach 13% globally by 2030, and it would hit about 27% in developing countries. In this sense, nutrient tran- sport from rivers to offshore areas is an important environmental issue which should not be ignored.
Ecological protection and high-quality development of the Yellow River basin have been promoted as a major national strategy (Zhang, 2020). As the second largest river in China, the Yellow River contributes the largest runoff to the Bohai Sea (Xu., 2019; Ding., 2020). It is approximately 5687km long, with a drainage basin covering approximately 813122km2(Jiang., 2019). According to the Marine Environment Bulletin of North China Sea area for the year of 2016, the total amount of dissolved inorganic nitrogen (NH4, NO3and NO2) carried by the Yellow River runoff into the sea was about 16614t in the year. The large amount of freshwater and high concentrations of river-borne nutrients entering the sea provided abundant nutrients to support the growth and reproduction of phytoplankton, which seriously affected the ecosystem of the Yellow River Estuary (Wu., 2016; Shi., 2020). From 1952 to 2017, the red tide broke out 11 times in the sea area near the Yellow River Estuary at Dongying, with a cumulative area of more than 4600km2(Zhou., 2020). According to the Bulletin on Marine Environmental Status of China for the year of 2020, the Yellow River Estuary remained sub-heal- thy, and the seawater stay eutrophic. Notably, the existing methods of environmental governance in the Yellow River Estuary including eutrophication assessment and Nutrient Criteria formulation are lack of basis, thus its essential to establish a nutrient standard to address eutrophication related problems near the Yellow River Estuary.
In general, Nutrient Criteria are defined as the maximum level of concentrations acceptable to a particularly designated beneficial use of the waterbody (US EPA, 1998). The formulation and application of nutrient criteria offer some measures to effectively prevent water eutrophication, and present a scientific basis for the comprehensive monitoring, evaluation and management of estuarine nutrients. These recommended criteria provide guidance for the formulation of water quality standards. Water quality standards are legally enforceable considering both economic impacts and technological feasibility of meeting the standards, whereas, recommended water quality criteria are based solely on scientific data and judgments (Russo, 2002).
The United States (US) is one of the countries which first conducted environmental criteria research. According to the principle of ecology and combined with the act- ual water environment characteristics, the US researchers published the Nutrient Criteria Technical Guidance Manual for different environmental types. By far, they have developed the Nutrient Criteria Technical Guidance Manual for Rivers and Streams (USEPA, 2000a), Lakes and Reservoirs (USEPA, 2000b), Estuarine and Coastal Marine Waters (USEPA, 2000c), and Wetlands (USEPA, 2008).
The estuary, as the transitional zone between inland freshwater and coastal marine environments, has a relatively fragile and sensitive ecosystem (Yang., 2006; Whitfield and Elliott, 2011). Under the same nutrient con- ditions, the response indicators of primary productivity (biomass and chlorophyll-concentration) can be signifi- cantly different (Zhou., 2008). Sea Water Quality Standards (GB 3097-1997) and Environment Quality Standards for Surface Water (GB 3838-2002) were originally established for sea water and inland surface freshwater, which might not be suitable for estuarine environment in China.
The environmental conditions of estuaries and bays can vary, with unique circulation, complex topography, vertical gradient, and different dynamic characteristics of the boundary of river and sea, also many environmental impact factors (Li., 2011, 2016). Therefore, nutrient criteria values are site-dependent, and different results can occur at other locations depending on the physical and biogeochemical characteristics of an estuary. Recently, some scholars have studied different estuarine waters in China (cf. appendix A) and established some nutrient cri- teria for Pearl River Estuary (Zhao., 2013), Yangtze River Estuary (Yang., 2019; Wu., 2020), Daliao River Estuary (Yang, 2016), Liaohe Estuary (Hu., 2011; Su., 2016), Jiulong River Estuary (Liu., 2018). Nevertheless, the study on nutrient criteria for the adjacent waters of Yellow River Estuary has not conducted.
Based on frequency distribution method and stressor- response model, this study makes an attempt to determine, the nutrient criteria (SRP and DIN) of the Yellow River Estuary. The study purpose is to provide a scientific basis for the formulation of nutrient criteria, the nutrient monitoring, evaluation and management for the Yellow River Estuary of China, and offer some guidance for studying the nutrient criteria for other estuaries in China.
2 Materials and Methods
2.1 Study Area
The main red tide species in the sea area near the Yellow River Estuary areand(Huang., 2016; Zhou., 2020).is a heterotrophic plankton, and phy- toplankton is its main food source. High chlorophyll-(Chl-) value can be used as an important indicator for monitoring the red tide of(Xie and Li, 1993). Therefore, we take the Chl-as the response variable.
2.2 Data Sources
In this study, the data are from field investigations and long-term monitoring data of the Yellow River Estuary monitored by the State Oceanic Administration. The mo- nitored parameters are seawater salinity, pH values, dissolved oxygen (DO), chemical oxygen demand (COD), soluble reactive phosphorous (SRP), dissolved inorganic nitrogen (DIN) and dissolved silicon (DSi). The sampling methods are based on the China Marine Monitoring Standards (GB 17378.4-2007).
The sampling time was from 2004 to 2019. Here we used the data of Chl-from 2004 to 2015 and 2017 to 2019; the data of active silicate from 2004 to 2009 and 2019; and the data of other water quality factors from 2004 to 2019 (Fig.1).

Fig.1 The time and locations of the sampling sites.
2.3 Methods
For the study of nutrient criteria in lakes, estuaries and other waters, the commonly used methods are reference condition approach and stressor-response analysis documented in the Nutrient Criteria Technical Guidance (Evans-White., 2013; Olson and Hawkins, 2013; Zhang., 2016; Koh, 2019).
In this paper, we select the nutrient (DIN and SRP) concentrations as the stressor variables, and the concentration of Chl-as the response variable. The nutrient cri- teria can be derived from the estimated relationship using stressor-response modeling. The common stressor-respon- se analysis models are correlation analysis, Linear Regression Model, Classification and Regression Tree, and Changepoint analysis (US EPA, 2010; Huo., 2018).
SPSS (originally, Statistical Package for the Social Sciences) is a computer program used for survey authoring and deployment (IBM SPSS Data Collection), data mining (IBM SPSS Modeler), text analytics, statistical analysis, and collaboration and deployment (Jamshidi and Mohebbalipour, 2014). In this paper, we apply the IBM SPSS Statistics 25 to perform statistical analysis, correlation analysis and regression analysis.
2.3.1 Correlation analysis
Correlation analysis is a method to study the relationship among quantitative data. The results of correlation analyses may be represented by the correlation coefficient to measure the strength of linear association between two variables. Pearson correlation is mainly used to meet the quantitative data of normal distribution, which belongs to parameter method; Spearman correlation is a nonparametric method and should be more suitable (compared with Pearson correlation) when data are nonnormally distributed or not continuous (Zou, 2001; Eberly, 2007; Bishara and Hittner, 2012; Jamshidi and Mohebbalipour, 2014).
2.3.2 Frequency distribution
Developing the criteria is based on plotted as frequency distributions and the calculated 5th to 25th percentile of the data while sample sizes are more than thirty (US EPA, 2000a).
Due to the heavy input with high concentration of DIN of waste loads from watersheds and human activities, the Yellow River Estuary and adjacent waters are in sub- health and serious eutrophication (Bulletin on Marine En- vironmental Status of China for the year of 2020). Therefore, the lower 25th percentile of the population frequency distribution was used to develop the nutrient criteria.
2.3.3 Linear Regression Model (LRM)
LRM can estimate the linear relationship between the response variables and the explanatory variable. The result of single linear regression (SLR) is a straight line specifying by two coefficients, representing the modeled relationship the two variables. Multiple linear regression (MLR) can be used to simulate the comprehensive relationship of many different cause variables and response variables.
2.3.4 Classification and Regression Tree (CART)
The CART model can explain the relationship between complex ecosystems, and can be used in environmental and ecological research to explain the complex hierarchical, high-order and nonlinear relationship between response variables and stressor variables. It is often applied to uncover complex interactions between predictors which may be difficult or impossible to uncover using traditional multivariate techniques. As a predictive tree model, the CART is a recursive algorithm in data mining that explores the structure of a set of data (De’ath and Fabricius, 2000; Fakiola., 2010).
The splitting rule in regression trees is made in accordance with the squared residuals minimization algorithm, which means that the expected sum variances for two resulting nodes should be minimized. Gini coefficient is used as the criterion to select the best test variables and segmentation threshold in the CART (Choubin., 2018).
2.3.5 Changepoint analysis (CPA)
A threshold or a changepoint refers to the position of a stressor variable that leads to an abrupt change of the response variable. Depending on whether the probabilistic model of data is known or not, one can distinguish among parametric, semi-parametric and non-parametric methods (Gichuhi., 2012).
Non-parametric changepoint analysis (nCPA) has been used to identify the threshold analysis of plant or invertebrate response to nutrients in freshwater system (King and Richardson, 2003; Qian., 2003). In this study, the deviation reduction method is adopted to evaluate the environmental threshold and analyze the non-parametric changepoint. In this paper, the uncertainty of changepoint is simulated by bootstrap (Efron and Tibshirani, 1993) and expressed by 90% confidence interval (Huo and Xi, 2014).
3 Results and Discussion
3.1 Data Statistics
Among the 164 sets of data from 2004 to 2019, 32.9% of DIN was higher than the fourth-class seawater standard in China (Appendix B), and 0.6% for SRP. The concentrations of DO and COD were lower than the fourth-class seawater standard in China, while more than 80% of them were lower than the first-class. Thus, it can be seen from above that, the main pollutant in the Yellow River Delta is DTN.
3.2 Correlation Analysis Result
Bivariate correlation analysis was conducted among the indicators (Tables 1–3). The results of the two correlation analysis methods are basically consistent. Since the Chl-is the response variable in this paper, the variables that are strongly related to it are the stressor variables. According to the correlation analysis, DO and pH are, however, not significantly positively correlated to Chl-. In addition, previous studies demonstrated that when the average content of Chl-exceeds 10μgL?1, a significant positive correlation exists between DO and Chl-, and also between pH and Chl-. There is no significant correlation when the average content is below 10μgL?1(Huang., 2011). In this study, the mean value of Chl-as a response factor is 2.6μgL?1, which is far below 10μgL?1, with the maximum value of 10.1μgL?1. Thus, pH and DO are not taken as the stressor factors.

Table 1 Statistics of variables in study area

Table 2 Pearson correlation coefficients and significance test results of various index factors in the study area
Note: The two-tailed the correlation test is significant at 0.01 probability level (<0.01).

Table 3 Spearman correlation coefficients and significance test results of various index factors in study area
Note: Two-tailed the correlation test is significant at 0.01 probability level (<0.01).
If Si:P>22 and DIN:P>22, P limitation; if DIN:P<10 and Si:DIN>1, N limitation; if Si:P<10 and Si:DIN<1, Si limitation (Dortch and Whitledge, 1992; Justic., 1995). The average value of DIN:P in the study area is 227.52, Si:P is 144.88 and Si:DIN is 1.78, so the area is obviously in P limitation.
Concentrations of COD and nutrient are significantly correlated with salinity, indicating that the runoff of the Yellow River brought a lot of fresh water and carried rich nutrients and organic pollutants. It can be seen from the results of two correlation analysis methods suggest that the SRP is the variable most correlated with Chl-. There- fore, SRP and DIN are taken as causal variables in the study area. Correlations between nutrients and salinity are also explored (Fig.2). DIN concentrations are significantly correlated with salinity, due to the rich nutrients in the runoff of the Yellow River and the dilution of open seawater. The SRP is however not as significantly related to salinity as DIN, suggesting that there exists buffering system for SRP. The buffering system was also discovered in other estuaries such as Changjiang River Estuary (Huang., 1983).

Fig.2 Relationship between nutrient concentrations and salinity in the adjacent waters of the Yellow River Estuary.
3.3 Frequency Distribution Result
Data that are not normally distributed are often transformed into a distribution more approximating the normal distribution by taking the logarithm of each value.
Fig.3 shows the frequency distributions of all the logarithm of data presently available. The lower 25th percentile for DIN, SRP, Chl-can be selected as the reference threshold for criteria, since it can be seen from the above discussion, the Yellow River Estuary has been seriously polluted (US EPA, 2000a). Distributions of log-trans- formed DIN, SRP and Chl-are both unimodal and appear to be nearly normally distributed. The corresponding values are identified as the candidate nutrient criteria as listed in Table 4.
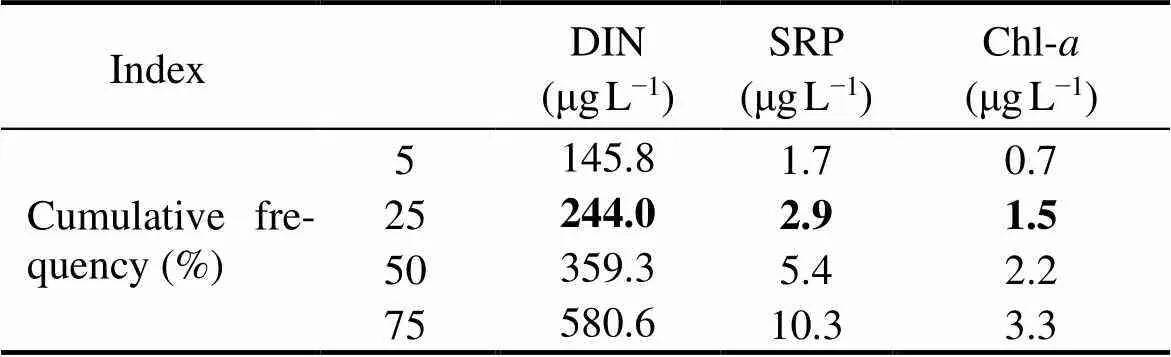
Table 4 Frequency distribution results of variables in the Yellow River Estuary (μgL?1)
The bold values show the recommended criteria values of the variables in each segment of the study area.

Fig.3 The frequency distributions of the logarithm data of DIN, SRP and Chl-a. The positions of the dotted lines are the lower 25th percentile values.
3.4 LMR Result
Before data analysis, data that are far outside of the central distribution should not be excluded from the data set. However, they should be considered for logarithmic transformed to symmetrize the distribution. To reduce the influence of spatial differences, the data are analyzed on an annual average. The linear regression chart obtained by univariate linear analysis (Fig.4) shows that SPR is significantly correlated with Chl-logarithm. We substitute the Chl-value of 1.5μgL?1obtained by the frequency distribution method into regression equation and take the calculated SPR value of 3.5μgL?1as the threshold. DIN in the adjacent waters of Yellow River Estuary far exceeded the standard, and there is no significant correlation between the concentrations of DIN and Chl-. Thus, we can not use this method to obtain the DIN thre- shold.

Fig.4 Linear regression analysis of logarithm of data.
In Fig.5, the broken line chart indicates the consistent downward trends of nutrients and Chl-during 2004– 2019. Considering the relationship of phosphate to nitrate uptake for photosynthesis, DIN and SRP in water and absorbed by plants are restricted and influenced each other according to the theory of Redfield ratio (Redfield, 1958). DIN and SRP are used as bivariate to conduct mul- tiple linear regression analysis, and the optimal regression model is obtained as follows:
lgChl-=0.112?0.078lgDIN+0.525lgSRP. (1)
Using the lower 25th percentile value of frequency dis-tribution, each two variable values are substituted into the Eq. (1) to get the third variable value. The threshold value is shown in Table 5.

Table 5 Bivariate linear regression results of variables in the Yellow River Estuary (μgL?1)

Fig.5 Inter-annual variation of the annual mean concentrations of DIN, SRP, Chl-a and the simulated Chl-a in the study area.
3.5 CART Result
We performed the CART analysis using the RPART package in R (Galimberti., 2012). The CART analy- sis can be used to identify the most important stress variables that affect response variable concentrations (Huo., 2018). Taking DIN and SRP as the predictive variables of the CART and it can be seen from the Fig.6(a) that the variable corresponding to the first node is SRP, which is determined as the primary predictor of Chl-volatility. It also shows that when the DIN exceeds, the amount of phytoplankton is mainly limited by SRP.
DIN (Fig.6b) and SRP (Fig.6c) are used as the single variable of the classification regression tree respectively, and the first node value is obtained as the threshold reference value: SRP=22.4μgL?1, DIN=191.8μgL?1. When the concentration of SRP is less than 22.4μgL?1, the average concentration of Chl-is 2.5μgL?1. When the concentration of SRP is more than or equal to 22.4μgL?1, the average concentration of Chl-is 4.6μgL?1, which is positively correlated with the concentration of SRP. When the concentration of DIN is 191.8μgL?1or higher, the average concentration of Chl-is 2.5μgL?1, while a reverse change of 3.9μgL?1occurs when the concentration of DIN is less than 191.8μgL?1, which could be related to the phosphorus limitation in this area. Due to the Redfield ratio (N/P=16:1), the increase of phosphorus concentration promoted the absorption of nitrogen by phytoplankton (Fan and Huang, 2008).
While the CART model cannot accurately predict Chl-concentration, it can provide valuable information for water quality management. The box-plot shows that the concentration of Chl-fluctuates greatly in the case of high SRP concentration. Therefore, the effective manage- ment of water quality requires special attention to the regulation of phosphorus concentration.
3.6 nCPA Result
Ecological change does not always happen suddenly (Muradian, 2001). The confidence interval can be used to represent the change area of inflection point (see the vertical line in Fig.7). These confidence intervals show the potential threshold ranges of DIN and SRP when inflection point occurs.
The lower and upper bounds of confidence interval of DIN are 166μgL?1and 931.9μgL?1, respectively; While the lower and upper bounds of SRP are 3.7μgL?1and 27 μgL?1, respectively. The range of estimated confidence interval can reflect the degree of uncertainty of inflection point (Bonett and Wright, 2000). The posterior distribution of changepoint is wide, which indicates that the study area has great uncertainty. There are many reasons for this uncertainty, and one possibility is that the correlation between response variables and nutrients is affected by other environmental factors.
3.7 Recommended Criteria
Based on the frequency distribution method, the recommended criteria value of DIN is 244.0μgL?1. As mentioned in the paper, P content is limited whereas nitrogen is excessive in the study area. The poor correlation between Chl-and DIN also proves this point. The recommended criteria DIN was from this method because it has weak correlation with Chl-. However, for the SRP in the study area, more than 80% of the concentration data were lower than the first-class seawater standard, indicating that the phosphorus deficiency of the study area. Therefore, the results of frequency distribution method are small, and the criteria SRP value comes from the methods related to Chl-. Moreover, the thresholds obtained by the first two methods in Table. 6 are not within the 90% confidence interval of changepoint, so the recommended criteria of SRP is 22.4μgL?1obtained by the CART model, which is related to Chl-.

Table 6 Nutrient criteria obtained by various methods and other studies

Fig.6 CART model of Chl-a for DIN and SRP in the adjacent waters of the Yellow River Estuary and the Box-plot of Chl-a. The standard error (SE) of Chl-a concentration was used as a measure of data dispersion. The box-plot at the bottom represents the concentration distribution of Chl-a at each terminal node, which is arranged from small to large according to the average Chl-a concentration.

Fig.7 Changepoint distribution of DIN (a) and SRP (b) obtained by nCPA. The broken line represents the step change of Chl-a mean at the change point, the vertical line represents the 90% confidence interval, the data is represented by circles.
4 Conclusions
In this study, the frequency distribution approach, cor- relation analysis, Linear Regression Model (LRM), Clas- sification and Regression Tree (CART) and nonparametric changepoint analysis (nCPA) methods were adopted to analyze the adjacent waters of Yellow River Estuary in China. The results of this study showed a significant positive correlation between DO and pH. Besides, concentrations of COD and nutrient were significantly correlated with salinity, indicating that the runoff of the Yellow River contributed a lot of freshwater. However, it also contributed rich nutrients and organic pollutants to the sea. Moreover, the concentration of SRP was most correlated with Chl-. By analyzing the field data in the study area during 2004–2019, we conclude that the recommended criteria values of dissolved inorganic nitrogen (DIN) and soluble reactive phosphorus (SRP) are 244.0μgL?1and 22.4μgL?1, respectively.
Acknowledgement
The study is supported by the National Key Research and Development Program of China (No. 2018YFC1407 601).
Appendix
A Nutrient criteria from literatures (mgL?1), the multiple values from the same literature are obtained by different methods or zones

LocationDINSRPLiterature Pearl River Estuary1.580 (NO3-N)0.033Zhao et al., 2013 0.047 (NH4-N) Yangtze River Estuary1.050–1.2400.03–0.036Yang et al., 2019 0.2000.010 0.6140.029Wu et al., 2020 0.2950.008 Daliao River Estuary0.8930.009Yang, 2016 0.2350.037 Liaohe Estuary0.7700.005Su et al., 2016 0.1100.006Hu et al., 2011 Jiulong River Estuary0.8960.028Liu et al., 2018 0.2940.024 0.1960.028
B Sea water quality standard (GB 3097-1997) (mgL?1)

Class IClass IIClass IIIClass IV DO>6543 COD≤2345 DIN (N)≤0.20.30.40.5 SRP (P)≤0.0150.03 0.030.045
Bishara, A. J., and Hittner, J. B., 2012. Testing the significance of a correlation with nonnormal data: Comparison of Pearson, Spearman, transformation, and resampling approaches.,17(3): 399-417,https://doi.org/10.1037/ a0028087.
Bonett, D. G., and Wright, T. A., 2000. Sample size require- ments for estimating Pearson, Kendall and Spearman correlations.,65(1): 23-28,https://doi.org/10.1007/ bf02294183.
Bouwman, A. F., Van Drecht, G., Knoop, J. M., Beusen, A. H. W., and Meinardi, C. R., 2005. Exploring changes in river nitrogen export to the world’s oceans., 19 (1): 1-14, https://doi.org/10.1029/2004gb002314.
Choubin, B., Darabi, H., Rahmati, O., Sajedi-Hosseini, F., and Klve, B., 2018. River suspended sediment modelling using the CART model: A comparative study of machine learning techniques.,615:272-281, https://doi.org/10.1016/j.scitotenv.2017.09.293.
Cloern, J. E., 2001. Our evolving conceptual model of the coas- tal eutrophication problem.,210:223-253, https://doi.org/10.3354/meps210223.
De’ath, G., and Fabricius, K. E., 2000. Classification and regres- sion trees: A powerful yet simple technique for ecological data analysis., 81(11): 3178,https://doi.org/10.2307 /177409.
Dortch, Q., and Whitledge, T. E., 1992. Does nitrogen or silicon limit phytoplankton production in the Mississippi River plu- me and nearby regions?,12(11): 1293-1309,https://doi.org/10.1016/0278-4343(92)90065-r.
Eberly, L. E., 2007. Correlation and Simple Linear Regression., 404: 143-164, https://doi. org/10.1007/978-1-59745-530-5_8.
Efron, B., and Tibshirani, R. J., 1993. An introduction to the bootstrap., 89 (428): 436.
Evans-White, M. A., Haggard, B. E., and Scott, J. T., 2013. A Review of stream nutrient criteria development in the United States.,42(4):1002, https://doi.org/10.2134/jeq2012.0491.
Fakiola, M., Mishra, A., Rai, M., Singh, S. P., O’Leary, R. A., Ball, S.,., 2010. Classification and regression tree and spatial analyses reveal geographic heterogeneity in genome wide linkage study of Indian Visceral Leishmaniasis., 5(12): e15807,https://doi.org/10.1371/journal.pone.00 15807.
Fan, H., and Huang, H., 2008. Response of coastal marine eco- environment to river fluxes into the sea: A case study of the Huanghe (Yellow) River mouth and adjacent waters.,65(5): 378-387,https://doi.org/10. 1016/j.marenvres.2008.01.003.
Galimberti, G., Soffritti, G., and Maso, M. D., 2012. Classification trees for ordinal responses in R: The rpartScore Package., 47 (10): 1-25.
Gichuhi, A. W., Franke, J., and Kihoro, J. M., 2012. Parametric change point estimation, testing and confidence interval applied in business., 14 (2): 136-148.
Glibert, P. M., and Burkholder, J. M., 2006. The complex relationships between increases in fertilization of the earth, coa- stal eutrophication and proliferation of harmful algal blooms., 341-354,https://doi.org/10.1007/ 978-3-540-32210-8_26.
Hallegraeff, G. M., 2010. Ocean climate change, phytoplankton community responses, and harmful algal blooms: A formidable predictive challenge.,46(2):220- 235,https://doi.org/10.1111/j.1529-8817.2010.00815.x.
Hu, Y. Y., Wang, J. Y., Zhang, Z. F., Zong, H. M., and Chen, S. M., 2011. Establishment of recommended benchmark valuesfor nutrients in the coastal waters of Liaohe Estuary.,31 (6):996-1000 (in Chinese with English abstract).
Huang, H. Y., Kang, L. C., Yang, Y., Yang, L., Liu, S. M., Wang, Q. L.,., 2016. Research on the species and distribution of red tide triggering species in my country’s coastal waters in 2013.,11: 17-27 (in Chinese with English abstract).
Huang, S. G., Yang, J. D., Ji, W. D., Yang, X. L., and Chen, C. X., 1983. Spatial and temporal variation of reactive Si, N, P and their relationship in the Changjiang Estuary water., 5 (2): 114-123 (in Chinese with English abstract).
Huang, S. L., Zang, C. J., Du, S. L., Wu, M., Gao, F., Lin, C.,., 2011. Research on the correlation between pH, dissolved oxygen, and chlorophyllII: Non-aquaculture waters., 5(8): 1681-1688 (in Chinese with English abstract).
Huo, S. L., and Xi, B. D., 2014.,, Beijing, chap5(5.2.1): 109-110.
Huo, S. L., Ma, C. Z., Xi, B. D., Zhang, Y. L., Wu, F. C., and Liu, H. L., 2018. Development of methods for establishing nutrient criteria in lakes and reservoirs: A review., 67: 54-66, https://doi.org/10.1016/ j.jes.2017.07.013.
Jamshidi, S., and Mohebbalipour, N., 2014. Biodiversity phe- noltypic and genotypic polymorphism data correlation analysis using SPSS 16.0 software.,August 4-5.
Jiang, X. H., Lu, W. X., Gao, Y., and Chang,Y. Y., 2019. The historical changes of the Yellow River and the evolution of the area and length characteristic data.,41 (1): 10-13 (in Chinese with English abstract).
Justi?, D., Rabalais, N. N., Turner, R. E., and Dortch, Q., 1995. Changes in nutrient structure of river-dominated coastal waters: Stoichiometric nutrient balance and its consequences.,40(3): 339-356,https:// doi.org/10.1016/s0272-7714(05)80014-9.
King, R. S., and Richardson, C. J., 2003. Integrating bioassess- ment and ecological risk assessment: An approach to developing numerical water-quality criteria.,31 (6): 795-809, https://doi.org/10.1007/s00267-002- 0036-4.
Koh, H. S., 2019. Using algal biomass-phosphorus (P) relationships and nutrient limitation theory to evaluate the adequacy of P water quality criteria for regulated monsoon rivers and reservoirs.,35 (5): 408-430, https:// doi.org/ 10.1080/02757540.2019.1567719.
Li, G., Gao, K., Yuan, D., Zheng, Y., and Yang, G., 2011. Relationship of photosynthetic carbon fixation with environmental changes in the Jiulong River Estuary of the South China Sea, with special reference to the effects of solar UV radiation., 62(8): 1852-1858,https://doi.org/ 10.1016/j.marpolbul.2011.02.050.
Li, J. L., Zheng, B. H., Zhang, L. S., Jin, X. W., and Shao, J. B., 2016. Eutrophication characteristics and difference analysis of major estuaries and bays in China., 36(2):506-516 (in Chinese with English abstract).
Liu, B., Cao, W., Huang, Z., Chen, W., Chen, H., and Liu, L., 2018. Developing nutrient criteria for the Jiulong River Estuary, Southeast China., 37(2): 1-13,https://doi.org/10.1007/s13131-017-1121-0.
Muradian, R., 2001. Ecological thresholds: A survey., 38(1): 7-24,https://doi.org/10.1016/s0921-8009 (01)00146-x.
Olson, J. R., and Hawkins, C. P., 2013. Developing site-specific nutrient criteria from empirical models.,32(3): 719-740, https://doi.org/10.1899/12-113.1.
Qian, S. S., King, R. S., and Richardson, C. J., 2003. Two statistical methods for the detection of environmental thresholds, 166 (1-2): 87-97, https://doi.org/10. 1016/s0304-3800(03)00097-8.
Redfield, A. C., 1958. The biological control of chemical factors in the environment., 46 (3): 230A, 205- 221, https://doi:10.2307/27827150.
Russo, R. C., 2002. Development of marine water quality criteria for the USA., 45 (1-12): 84-91, https://doi:10.1016/s0025-326x(02)00136-4.
Shi, H., Li, Q., Sun, J., Gao, G., Sui, Y.,Qiao, S.,., 2020. Variation of Yellow River runoff and its influence on salinity in Laizhou Bay., 19(6): 1235-1244, https://doi.org/10.1007/s11802- 020-4413- 5.
Su, J., Yang, F. X., Su, R. G., and Yao, Q. Z., 2016. Establishment method of nutrient reference value in Liaohe Estuary., 46(9): 78-84 (in Chinese with English abstract).
US EPA, 1998. National Strategy for the Development of Regional Nutrient Criteria.EPA-822-R-98-002. U.S. Environmental Protection Agency, Office of Water,Washington, D. C.
US EPA, 2000a. Nutrient Criteria Technical Guidance Manual Rivers and Streams.Water Quality Criteria for the Protection of Human Health, EPA-822-B-00-002.U.S. Environmental Protection Agency, Office of Water, Washington, D. C.
US EPA, 2000b. Nutrient Criteria Technical Guidance Manual Lakes and Reservoirs.WaterQuality Criteria for the Protection of Human Health, EPA-822-B-00-001.U.S. Environmental Protection Agency, Office of Water, Washington, D. C.
US EPA, 2000c. Nutrient Criteria Technical Guidance Manual Estuarine and CoastalMarine Waters. EPA-822-B-01-003. U.S. Environmental Protection Agency, Office of Water, Washington, D. C.
US EPA, 2008. Nutrient Criteria Technical Guidance ManualWetlands.EPA-822-B-08-001.U.S. Environmental Protection Agency, Office of Water, Washington, D. C.
US EPA, 2010. Using Stressor-Response Relationships to Derive Numeric Nutrient Criteria. EPA-820-S-10-001. U.S. Environmental Protection Agency, Office of Water, Washington, D. C.
Whitfield, A., and Elliott, M., 2011. Ecosystem and biotic classifications of estuaries and coasts.,1: 99-124,https://doi.org/10.1016/b978-0- 12-374711-2.00108-x.
Wu, X., Duan, H., Bi, N., Yuan, P., Wang, A., and Wang, H., 2016. Interannual and seasonal variation of chlorophyll-off the Yellow River Mouth (1997–2012): Dominance of river inputs and coastal dynamics., 183: 402-412,https://doi.org/10.1016/j.ecss.2016.08. 038.
Wu, Y. N., Zhang, H. F., Wang, L., and Li, Z. Y., 2020. Water quality benchmark study of inorganic nitrogen and active phosphate in the Yangtze River Estuary.,51(5):104-117 (in Chinese with English abstract).
Xie, J., and Li, J. R., 1993. The relationship betweenspp. red tide and environmental factors.,12(2): 1-6 (in Chinese with English abstract).
Xu, H. Y., 2020. Study on the transition of nutrient status and nutrient standards in the Bohai Sea. Ministry of Natural Resources, Maser thesis. First Institute of Oceanography,
Xu, X.,Chen, Z., and Feng, Z., 2019. From natural driving to artificial intervention: Changes of the Yellow River Estuary and delta development., 174(5):63-70, https://doi.org/10.1016/j.ocecoaman.2019.03.009.
Yang, F., Mi, T., Chen, H., and Yao, Q., 2019. Developing numeric nutrient criteria for the Yangtze River Estuary and adjacent waters in China., 579: 124188,https://doi.org/10.1016/j.jhydrol.2019.124188.
Yang, F. X., 2016. Research on the establishment method and influencing factors of nutrient reference valuesin the Daliao River Estuary.MasterThesis. Ocean University of China.
Yang, Y. F., Wang, Q., Chen, J. F., and Pang, S. X., 2006. Research progress of zooplankton ecology in estuary., 26 (2): 576-585 (in Chinese with English abstract).
Zhang, J. L., 2020. The Yellow River Basin ecological protection and high-quality development water strategy thinking., 416 (4): 5-10 (in Chinese with English abstract).
Zhang, Y., Huo, S., Xi, B., Ma, C., and He, Z., 2016. Establish ing nutrient criteria in nine typical lakes in China: A conceptual model.,44(10):1335-1344, https://doi.org/10.1002/clen.201500505.
Zhao, X., Liu, M. Q., Liao, Y., and Guo, Z. R., 2013. Threshold analysis of the Pearl River Estuary nutrient brine quality standard based on aquatic organism evaluation., 3151-3158 (in Chinese with English abstract).
Zhou, J., Wang, W., Wu, Z. H., Wang, Q. X., Wang, Y., and Gao, X.,2020. The basic characteristics of red tide disasters along the coast of Shandong and suggestions for prevention and control measures.,39(4):537-543 (in Chinese with English abstract).
Zhou, M., Shen, Z., and Yu, R., 2008. Responses of a coastal phytoplankton community to increased nutrient input from the Changjiang (Yangtze) River.,28(12): 1483-1489,https://doi.org/10.1016/j.csr.2007.02.009.
Zou, L., 2001.nutrient enrichment experiment in the Bo- hai and Yellow Sea.,23(10): 1111-1119,https://doi.org/10.1093/plankt/23.10.1111.
July 26, 2021;
April 12, 2022;
May 2, 2022
? Ocean University of China, Science Press and Springer-Verlag GmbH Germany 2022
. Tel: 0086-532-66786381
E-mail: zhengyan@ouc.edu.cn
(Edited by Ji Dechun)
 Journal of Ocean University of China2022年5期
- Journal of Ocean University of China的其它文章
- Stress Analysis of Wire Strands by Mesoscale Mechanics
- Effect of Temperature on the Carbon, Nitrogen, and Phosphorus Nutrient Budgets of Steelhead Trout (Oncorhynchus mykiss) with Different Sizes
- Impact of Evaporation Duct on Electromagnetic Wave Propagation During a Typhoon
- A New α-Cyclopiazonic Acid Alkaloid Identified from the Weizhou Island Coral-Derived Fungus Aspergillus flavus GXIMD 02503
- Design of Copper Oxide Nanosheets-Loaded Zeolite with Efficient Inhibition of Marine Bacteria
- 3-D Marine CSEM Modeling in General Anisotropic Media by Using an Adaptive Finite Element Approach Based on the Vector-Scalar Potential