
HI Vertical Structure of Nearby Edge-on Galaxies from CHANG-ES
2022-09-02 12:24:38YunZhengJingWangJudithIrwinQDanielWangJiangtaoLiJayanneEnglishQingchuanMaRanWangKeWangMaritaKrauseTokyRandriamampandryandRainerBeck
Yun ZhengJing WangJudith IrwinQ.Daniel WangJiangtao LiJayanne EnglishQingchuan MaRan WangKe WangMarita KrauseToky H.Randriamampandryand Rainer Beck
1Kavli Institute for Astronomy and Astrophysics,Peking University,Beijing 100871,China; jwang_astro@pku.edu.cn
2 Department of Physics,Engineering Physics &Astronomy,Queen’s University,Kingston,ON,K7L 3N6,Canada
3 Astronomy Department,University of Massachusetts,Amherst,MA 01003,USA
4 Department of Astronomy,University of Michigan,Ann Arbor,MI,48109-1107,USA
5 Purple Mountain Observatory,Chinese Academy of Sciences,Nanjing 210023,China
6 Department of Physics and Astronomy,University of Manitoba,Winnipeg,Manitoba,R3T 2N2,Canada
7 Max-Planck-Institut für Radioastronomie,Auf dem Hügel D-69,53121 Bonn,Germany
Abstract We study the vertical distribution of the highly inclined galaxies from the Continuum Halos in Nearby Galaxies—an EVLA Survey (CHANG-ES).We explore the feasibility of photometrically deriving the H I disk scale heights from the moment-0 images of the relatively edge-on galaxies with inclination>80°,by quantifying the systematic broadening effects and thus deriving correction equations for direct measurements.The corrected H I disk scale heights of the relatively edge-on galaxies from the CHANG-ES sample show trends consistent with the quasiequilibrium model of the vertical structure of gas disks.The procedure provides a convenient way to derive the scale heights and can easily be applied to statistical samples in the future.
Key words: galaxies: ISM–galaxies: spiral–galaxies: structure
1.Introduction
The vertical structure of H I gas disks is an important tracer of the galactic potential and dynamical effects in spiral galaxies.Under the assumption of hydrostatic equilibrium,the H I gas vertical structure exhibits a force balance between the self-gravity of the disk and the effective pressure of H I(Boulares &Cox1990;Piontek &Ostriker2007;Koyama &Ostriker2009;Ostriker et al.2010;Krumholz et al.2018).The effective pressure,largely supported by the turbulence(Mac Low1999;Tamburro et al.2009),further reflects an energy balance between the radiative dissipation and the energy input that comes from stellar feedback and galactic-scale gas inflows driven by non-axisymmetric torques (Krumholz &Burkert2010;Forbes et al.2012,2014).Real gas disks can be additionally influenced by gas accretion (Kere? et al.2005;Dekel &Birnboim2006;Oosterloo et al.2007;Dekel et al.2009;Zheng et al.2017),and tidal interactions (Toomre &Toomre1972;Barnes &Hernquist1992;Di Matteo et al.2007),as well as energetic feedback from active nuclei(Sijacki et al.2007;Fabian2012;Cicone et al.2014).
Observationally,the vertical structure of an H I disk is quantified by the scale height to first order(Randriamampandry et al.2021),which reflects properties consistent with the hydrostatic equilibrium model.The H I scale heights are nearly constant in the inner region of the galaxy and increase appreciably as a function of radius (the so-called flaring phenomenon) in the outer region between 5 and 35 kpc(Dickey&Lockman1990;Kalberla&Kerp2009).Narayan&Jog (2002) explained this radial trend of the Galactic H I scale heights and emphasized the importance of gravitational coupling between gas,stars and dark matter.They concluded that in addition,to the contributions from stars,gravity from the atomic and molecular gas helps set the scale heights in the inner region,while the atomic gas is more important than the molecular gas at intermediate radius;at large Galactic radius,the H I scale heights flare because the gravitational force decreases quickly and the dark matter halo dominates the gravity.The sharpness of the H I flares at large galactic radius is explained by the truncation of the stellar disks (Van Der Kruit1988).H I flares are found to be common in spiral galaxies (Brinks &Burton1984;Bigiel &Blitz2012),though they are not as sharp as in the Milky Way,as truncated stellar disks are not observed in all galaxies (Bland-Hawthorn et al.2005).
The vertical hydrostatic equilibrium model of the H I disk serves as a useful tool to derive properties involved in this equilibrium.Typically,for face-on galaxies,observational studies easily obtain the gas velocity dispersion but rely on the equilibrium model when deriving the gas disk thickness,while for edge-on galaxies,the situation is the other way round.Olling (1995) and Narayan et al.(2005) developed a model using the flare of H I to constrain the shape,mass and size of the dark matter halo.Krumholz et al.(2018) identified the isothermal nature of gas based on the vertical force balance between the gravitational drag force of gas,stars and dark matter and the gas thermal,turbulent and magnetic pressure.Recent developments include Bacchini et al.(2019) deriving the H I volumetric density to study the volumetric star formation law.They found that the volumetric star formation law is much tighter than the surface star formation law,particularly,the previously known break in the slope of the surface star formation law(Bigiel et al.2008;Leroy et al.2008)is more likely due to disk flaring rather than a decrease of the star-forming efficiency at low surface densities(Bacchini et al.2019).
The vertical structure of the H I disk is more complex than described by this simple hydrostatic equilibrium model.A thick H I layer,also called extraplanar gas or H I halo in the literature,with a typical 1–2 kpc scale height (in contrast to 100–200 pc for the thin disk)is directly observed in edge-on galaxies,with a lag in rotation with respect to the thin H I disk (Oosterloo et al.2007;Kamphuis et al.2013).The Galactic intermediatevelocity clouds can be viewed as a form of extraplanar gas(Oort1970;Wakker &van Woerden1997).The extraplanar gas is also modeled and found to be prevalent in external galaxies that are not edge-on (Fraternali et al.2001).Marasco et al.(2019) did a systematic study of extraplanar gas in 15 nearby late-type galaxies and concluded that both the mass and kinematics of extraplanar gas are in good agreement with the galactic fountain model which is powered by stellar feedback(Shapiro&Field1976;Bregman1980).In the fountain model,gas is pushed away from the disk by the supernova feedback and falls back with extra gas from the circumgalactic medium(CGM) after metal enrichment.
More complexities come from the fact that the edge-on views of H I disks are not necessarily flat but warped outside the edge of optical disks(Burke1957;Kerr1957;Sancisi1976;Newton &Emerson1977;Bosma1978;Briggs1990).Warps are found to be ubiquitous in disk galaxies (Sancisi1976;García-Ruiz et al.2002).The fact that they usually onset at the edge of optical disks suggests that the inner flat disk and the outer warped disk have different formation histories and probably involve different epochs (Van der Kruit2007).The mainstream explanation for the formation of warps seems to be the accretion of material with an angular momentum vector misaligned with that of the main disk (Jiang &Binney1999;Shen&Sellwood2006;Ro?kar et al.2010).Other explanations include the torques from the misaligned inner disk and the associated inner oblate halo (Dekel &Shlosman1983;Toomre1983;Sparke &Casertano1988),and the tidal force from companion galaxies (Weinberg1995;Weinberg &Blitz2006).
An observational census would usefully gain more insights into the physics that shape the vertical extent of H I disks.We use the highly inclined galaxies from the Continuum Halos in Nearby Galaxies—an EVLA Survey(CHANG-ES)(Irwin et al.2012;Wiegert et al.2015;Irwin et al.2019).The H I information of 19 edge-on galaxies in CHANG-ES is published in Zheng et al.(2022).Two galaxies are for the first time presented in H I interferometric images and twelve of the galaxies have better H I spatial resolutions and/or sensitivities of intensity maps than literature.The H I data are not well resolved kinematically,but we manage to derive the radially averaged scale height for the 15 most edge-on galaxies (inclination>80°,Section3) with a similar method as another CHANG-ES study Krause et al.(2018) used to measure the scale height of continuum halos.In the literature,the scale heights have been derived with sophisticated kinematical modelings based on data of much higher spectral resolutions,particularly when the galaxies are less inclined(Yim et al.2014,2020).Most of those modeling methods need to assume a quasi-equilibrium between the gravity and the gas pressure,and thus are most accurate for unperturbed galaxies.The procedure to derive the scale heights in this paper is mostly photometric using images,but we carefully correct the measurements for several types of observational artifacts,also called systematic biases or systematic broadening effects,including point spread function(PSF)smearing,planar projection and edge-on projection(Sections3.2and3.3).Thus the procedure and measurements presented in this paper provide an alternative and convenient way to derive the scale heights without significant assumptions for the dynamic states of gas.It can easily be applied to statistical samples in the future,and may potentially provide an indicator for the dynamic states of H I gas when compared to results or expectations from kinematically derived scale heights.We investigate possible dependence of the H I scale height on other galactic properties(Section4),and also more closely discuss the uncertainties and effects of the external environment(Section5).We assume a ΛCDM cosmology (H0=73 km s?1Mpc?1) and Kroupa initial mass function (Kroupa2001).
2.Data
2.1.Sample and HI Data
CHANG-ES is a deep radio continuum survey at 1.5 GHz(L-band) and 6 GHz (C-band),targeting 35 nearby edge-on galaxies (Irwin et al.2012).The galaxies were observed with the The Karl G.Jansky Very Large Array(VLA)using theB,CandDconfigurations in theC-andL-bands,and the observational details have been previously described by Irwin et al.(2012)and Wiegert et al.(2015).CHANG-ES paper XXV(Zheng et al.2022,Z21hereafter) produced the H I data atLbandC-configuration observation through the program of Common Astronomy Software Applications(CASA)(McMullin et al.2007).Nineteen galaxies in the CHANG-ES sample were successfully reduced into H I data cubes,which have an average beam size of ~145 in terms of full width at half maximum(FWHM),typical velocity resolution of 52.8 km s?1and an average root mean square (rms) of ~0.4 mJy beam?1.This sample is dominated by star-forming,H I-rich galaxies.
The resolution and depth of H I data are not sufficient for us to distinguish thin H I disks from thick H I disks,so we onlyinvestigate the averaged scale heights of the whole H I disks.We study the H I scale heights in galaxies with inclinations larger than 80?,based on the same criteria adopted by Krause et al.(2018)who investigated the scale height of continuum halos from the CHANGE-ES sample.This criterion is to mitigate contamination from the projected disk plane.A total of 15 galaxies in the CHANG-ES H I sample meet this criterion.The basic information on the 15 galaxies is listed in Table1.We take the coordinates,the optical size (R25,the 25 mag arcsec?2isophote semimajor axis in theB-band) from CHANG-ES Paper I (Irwin et al.2012),and distances from CHANG-ES Paper IV (Wiegert et al.2015).The H I information,including H I mass (MHI),H I radius(RHI),position angle(PA)of H I disk,FWHM and rms of H I intensity maps,is obtained fromZ21.The H I radius was calculated through the H I size-mass relation from Wang et al.(2016).

Table 1Galaxy Sample
2.2.SFR and Mass Densities
We take the star formation rate (SFR) from Vargas et al.(2019),who calculated SFR based on fluxes from narrow-band Hα images and fluxes from the Wide-field Infrared Survey Explorer 22 μm images.Because NGC 5084 lacks Hα observation,we exclude this galaxy from SFR related analysis.The SFR values are listed in Table2,in which the SFR of NGC 5084 is only estimated by 22 μm data.The star formation surface density is estimated as
The total (or dynamic) mass surface density within the optical radius ΣMtot,r25is taken from Paper IX (Krause et al.2018),who calculated it based on the inclination corrected line widths of the H I spectrum.
We also derive the baryonic mass surface density withinR25,ΣMbaryon,r25.We take the stellar massM* fromZ21,who derived it based on thei-band luminosity andg?icolor correlated mass-to-light ratio (Bell et al.2003).We further measure the H I mass withinR25,MHI,r25.The baryonic mass is calculated as the sum of the stellar mass and gas mass withinR25,Mbaryon,r25=M*,r25+1.4MHI,r25,where 1.4 is the standard correction factor to account for helium and metals.Then the baryonic mass surface density is calculated asThese surface densities are listed in Table2.
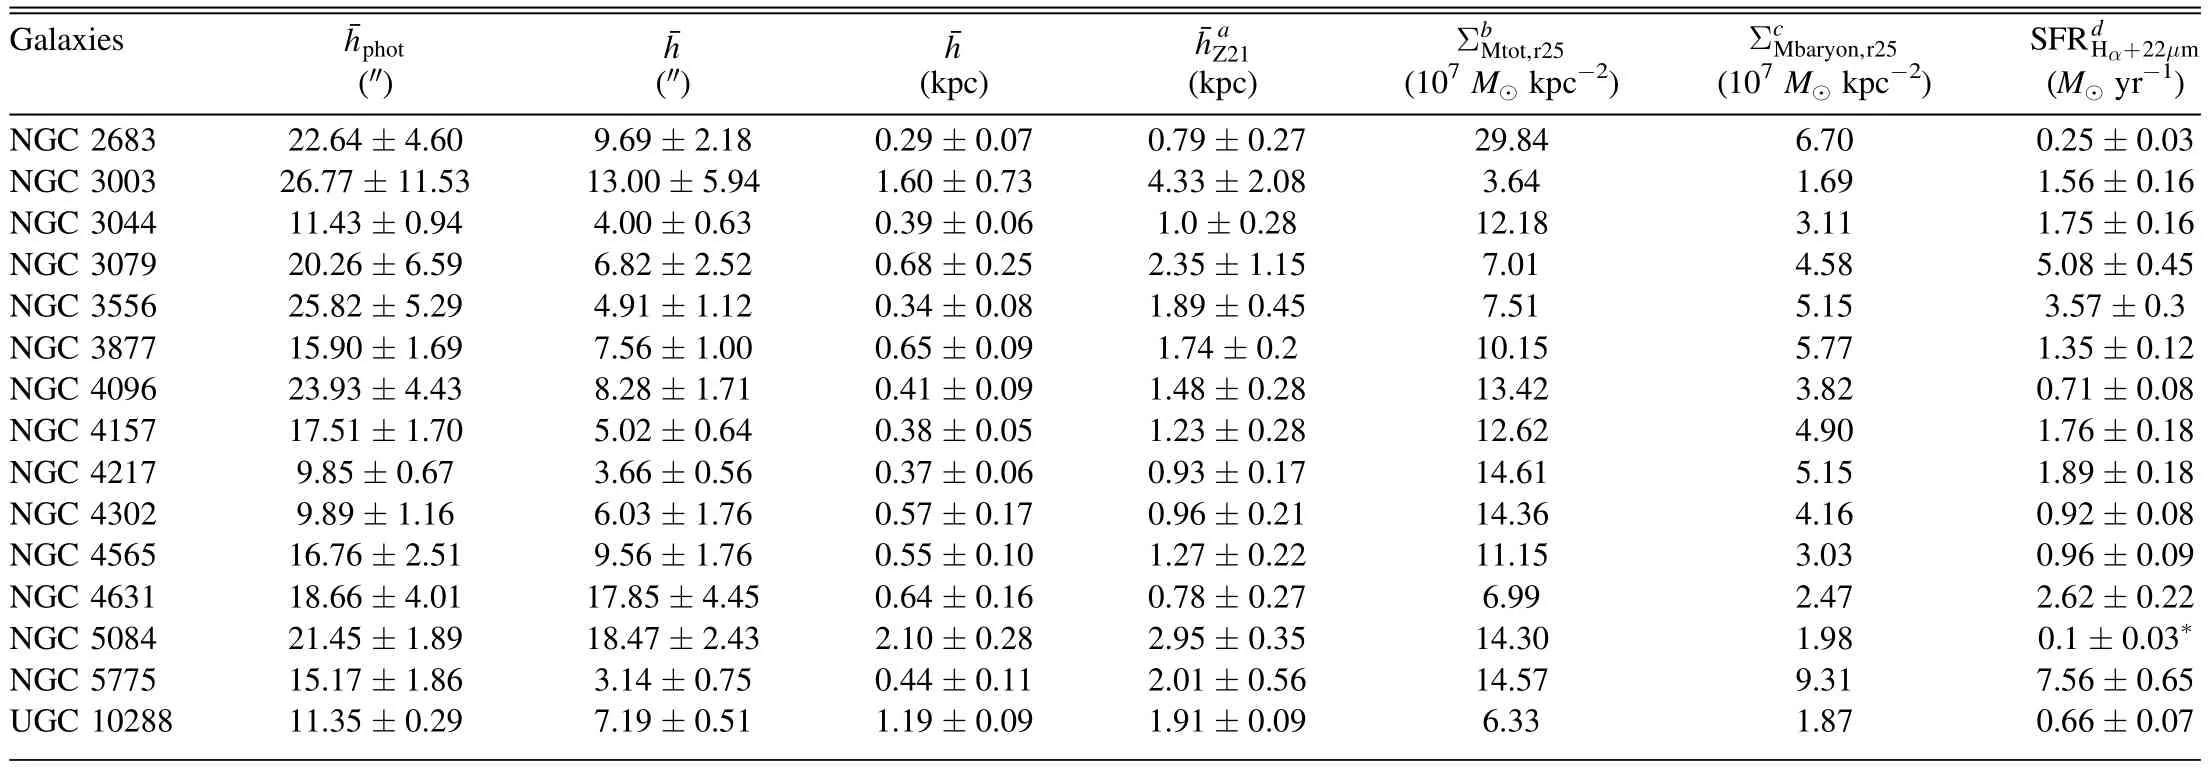
Table 2The H I Scale Height and Other Physical Parameters
3.Deriving the H I Scale Height
We use a photometric approach instead of kinematic approach to determine scale heights due to two characteristics of our sample.First the accuracy of three-dimensional (3D)kinematic modeling routines is challenged by highly inclined observations.Second,the low-velocity resolution of the CHANG-ES H I cubes does not permit accurate modeling.
We first derive the raw photometric H I scale height(hphot)in a similar way as inZ21(see Section3.1),but skip their relatively simple correction for beam smearing and planar projection (caused by the not perfectly edge-on inclinations of galaxies).Instead,we investigate in detail and design a more robust procedure to correct for systematic biases including these two effects inZ21and additional edge-on projection effect (mainly caused by flaring).
3.1.Deriving the Raw Photometric Scale Heights
The raw photometric scale heightshphotare derived in two steps: deriving the vertical profile of surface densities in strips perpendicular to the disk midplane,and fitting the vertical distribution profiles with a Gaussian function to obtain the width.8In Z21,to directly compare with the radio continuum scale height,we fit an exponential function.Changing from an exponential function to a Gaussian function here improves the fitting result as the median of reduced χ2 decreases from 7.61 to 6.16,and the major trends presented in Z21 do not significantly change,which we demonstrate later in Figures 5 and 6.
These steps are similar to the “BoxModels” task in the new NOD3 program package (Müller et al.2017).Krause et al.(2018)applied the“BoxModels”task to measure the radio halo scale height of the CHANG-ES sample.However,the H I disks are thin and asymmetric compared with the radio halos.Z21thus designed additional steps specifically for measuring H I scale heights.They derived the PA of the H I plane instead of using the optical PA.They also measured the vertical distributions on both sides separately.
As inZ21,we only use the radially averagedhphotwithin the optical radiusR25(phot) in the analysis.This is because the nearly edge-on view prevents us from recovering the flaring shape of the radial profile of scale heights.photshould thus be only viewed as an indicator of the H I disk thickness.The error of eachphotcombines the uncertainty from the model fitting and the scatter ofhphotin the profile.
Figure1shows the radial profile ofhphotand the value ofphot(black dashed line) in each galaxy.We present four profiles in each galaxy.The fitting results of the “up” and “l(fā)ow” represent two sides with respect to the midplane of a disk,while the“l(fā)eft”and“right”are two sides with respect to the minor axis of a disk.The “up” and “l(fā)ow” profiles here correspond to (but are not the same,as the deriving methods are different) the red and blue fitting curves in Figure A2 ofZ21.We show these profiles mainly to demonstrate howphotvalues are derived,but emphasize that onlyphotvalues are considered reliable in the following analysis.

Figure 1.The radial profile of hphot.The black dashed lines represent the phot.The profiles in warm colors(pink and purple) and profiles in cool colors (green and blue)represent the results of two sides with respect to the galactic midplane(“x-axis”),which are labeled by“up”and“l(fā)ow”,respectively.The profiles in dark colors(purple and blue)and profiles in light colors(pink and green)represent the results of two sides with respect to the minor axis(“y-axis”),which are labeled by“l(fā)eft”and“right”,respectively.
3.2.New Procedure to Correct for Artificial Broadening
Krause et al.(2018) andZ21mainly considered the beam smearing effect and planar projection effect,which have artificially increased the measured scale heights.For galaxies with an inclination lower than 90?,the flux distribution away from the midplane is considered to be a mixture of the intrinsic vertical component and the projected planar component of fluxes from the disk.In the observed data,such a mixture is further convolved with the beam PSF.These smearing effects need be removed fromhphotbefore we obtain the final measurements of H I scale height.As we describe below,we correct for these effects in different ways from that of Krause et al.(2018) andZ21.
InZ21,the contamination of the planar projection was accounted for as a pseudo increment of the PSF FWHM along the z direction in a radially dependent way:ΔF WHM =Rcos(r*π2)cosi,whereRwas the disk size,rwas the radius andiwas the inclination.The broadened PSF then had an effective FWHM along the z direction:FWHMeff,z=.InZ21,this effective PSF was convolved with the strip profile model before being compared with the data,so the best-fit scale heights were expected to be clean from those contaminating effects.Our new procedure to correct for these two effects does not assume the effective FWHM.We first derive the photometric scale heights without corrections,and then apply correction equations which are calibrated by comparing the real and measured values of scale heights from moment-0 images of mock cubes.The details are described in Section3.3.
Additionally,we consider a third systematic effect artificially increasingphotbut not considered inZ21,called edge-on projection.This effect is the projection of emission from outer disks even when the disk is perfectly edge-on,as most disks have the flaring feature (Brinks &Burton1984;Bigiel &Blitz2012).Such an effect is exacerbated in the H I observations as the H I disks are flat and extended in H I-rich galaxies (de Blok et al.2008;Walter et al.2008).The correction for this edge-on projection effect on the photometric scale heights is presented in Section3.3.
3.3.Investigation of Scale Height Broadening Based on Mock Cubes
We use mock cubes to quantify the extent of overestimating the scale heights due to effects of PSF smearing,planar projection and edge-on projection.The errors are calculated as 1σ.
We generate mock H I cubes with the GALMOD task of BBarolo (Di Teodoro &Fraternali2015),using the H I scale height profiles derived in Bacchini et al.(2019) for eight THINGS galaxies,along with the velocity dispersion profiles,surface density profiles and rotation curves in that paper.We have excluded two galaxies from the original sample of Bacchini et al.(2019),DDO 154 and NGC 2976,because of their low stellar masses log=7.1 and 9.1,while the lowest stellar mass of the CHANG-ES edge-on sample is=9.96.We call these eight galaxies the input sample.
The inclinationiand maximum radius of ringrmax(larger thanR25in all cases) are fixed for each model disk,but vary between model disks.Each model disk is built with rings of different radiusr.For eachr,the H I ring has scale heighthr,rotation velocityvr,velocity dispersion σrand surface density Σr,with values determined by interpolating the related radial profiles of a galaxy from the input sample.The last data point in a radial profile is repeated ifrmaxexceeds that.The cube and resulting moment-0 map are first generated at the original THINGS resolution (i.e.,the highest resolution) with GALMOD.Later,the spatial resolution of the output moment-0 maps can be changed through convolving with Gaussian kernels.We add Gaussian noise with sigma equivalent to the median rms of the CHANG-ES HI moment-0 maps to the model moment-0 maps.Similar to how we treat the CHANGES data,when derivinghphot,we only utilize the data points with signal to noise ratio larger than 3 along each vertical strip to fit Gaussian models.We use the scale height averaged within the radius R25,,as the parameter to be tested.We compare the photometrically measured(phot) to the realof models (true).
In the following,we first investigate separately each of the effects causing systematic biases,including PSF smearing,planar projection and edge-on projection.Then we take these effects together and correctphotagainsttrue.
3.3.1.Effect of PSF Smearing
For the test of the PSF smearing effect,we fix the inclination of the mock galaxies to 90° and vary the beam’s major axis(bmaj) of the data cube from the highest resolution ofbmaj=15 (pixel size of the THINGS data) to the lowest resolution corresponding to the minimum value of the uncorrectedphotbmajin the CHANG-ES edge-on sample,with a step of Δbmaj=15.We generate 117 mock H I cubes.We quantify,with decreasing resolution,howphotis increasingly overestimated with respect to the measurement at the best resolution.The result is shown in Figure2.The median trend of the overestimation has a relatively small scatter of 1.85% and is fitted with the following equation

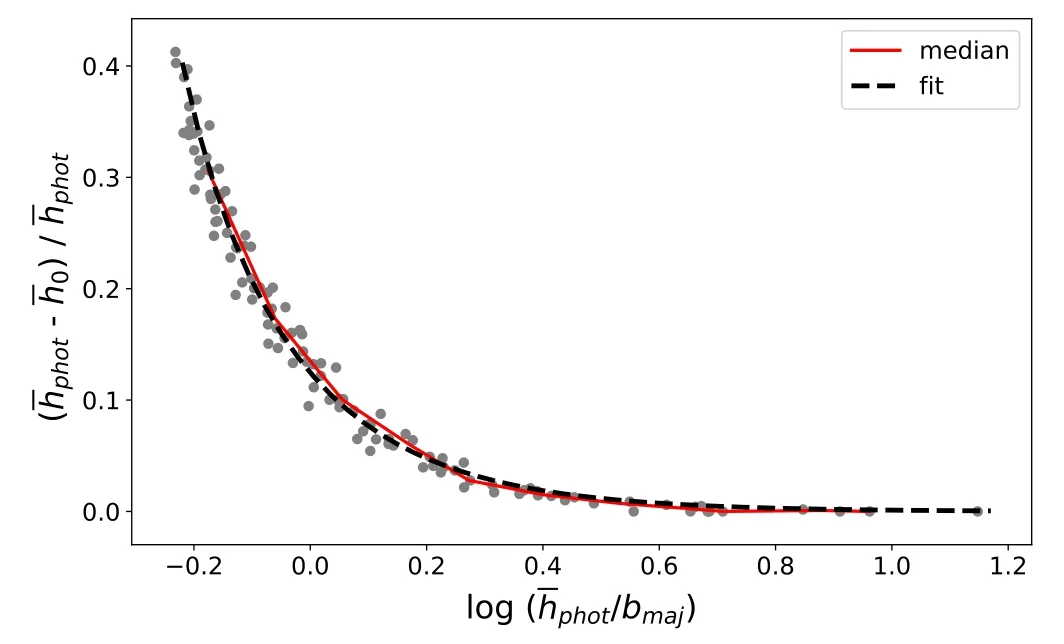
Figure 2.The PSF smearing on photometric scale height phot,with the best-fit(black dashed) line and median distribution (red line).
which could be approximated as a convolution with an effective Gaussian kernel.When the beam is less than 25%ofphot,thephotwill have an uncertainty due to PSF smearing of 0.19%.
3.3.2.Effect of Planar Projection
In the following,we investigate the planar projection effect,which however is likely to interfere with the edge-on projection effect.We use the highest resolution of 15,and vary the inclination of the galaxy disk from 80°to 90°with a step of 1°.We also vary the disk sizes in the mocks,rmax.The range ofrmaxis set such thatrmaxR25values are between 1 and maximumRHI/R25of the CHANG-ES H I sample.We build 21 mock cubes for each inclination,thus in total 231 mock cubes.
We quantify,with decreasing inclination angle,howphotis increasingly overestimated with respect to the measurement when the galaxy is perfectly edge-on90.Figure3(a)shows the result of the 231 mocks (points),with the median distribution(red line).At a given inclination,the planar projection effect has large scatter varying between different input galaxies.As we explain and justify below,the edge-on projection is likely responsible for this large scatter.

Figure 3.Mock tests about planar and edge-on projections.(a)The planar projection effect:the relation between y′ =( phot -90) phot andcos i.Thered curve is the median relation.(b)The effect of edge-on projection in causing the scatter in panel a:the relation between Δ ′y and parameters describing the shape of flaring of disk.The red line is the 1:1 line.(c)Similar to(a),but 90 is replaced bytrue.The black dashed curve is the best-fit 3rd order polynomial relation to the red curve.(d)Similar to (a),but Δy is the offset of data points from the best-fit relation (black dashed curve) in (c).
3.3.3.Effect of Edge-On Projection
The edge-on projection is mainly caused by disk flaring.It interferes with the planar projection because each line of sight intercepts different (and more) disk rings in a flared disk from in a flat disk.
To parameterize the shape of underlying H I flaring,for each galaxy in the input sample,we fit the scale height radial profile with a 3rd order polynomial equationh(r)=ahr3+bhr2+chr+dh.The four coefficients of the polynomial equation,together withrmax,are parameters to quantify the effect of edge-on projection.We define,so that the scatter of data points from the median curve (the red line in Figure3(a)) is quantified as Δy′ =y′-median (y′).We fit a linear relation of the five parameters describing the edge-on projection to predictΔy′(dashed line in Figure3(b)).The strong linear correlation with a small scatter of 5.32% implies that the effect of edge-on projection indeed accounts for a large fraction of the scatter around the median relation in Figure3(a).
The analysis in Figures3(a) and (b) demonstrates that the edge-on projection effect is indeed involved in the planar projection effect.The underlying flaring shape andrmaxused to fitΔy′ in3(b) are inputs of mocks which cannot be directly measured in observations.Motivated by the quasi-static equilibrium model of gas (based on which Bacchini et al.2019derived the scale heights of the input sample),we considerM*,MHI,RHI,R25and SFR as candidate parameters that may mimic the combined effect of the underlying shape of H I flaring andrmax.We test different combinations of these candidate parameters and find that the combination ofM*,RHIandR25is enough to derive a similarly tight relation withΔy′as when usingrmaxand the four coefficients describing the underlying shape of H I flaring.
In addition to interfering with planar projection,the edge-on projection further causes a difference between the perfectly edge-on90and model inputtrue.This is because in an edgeon view,the flaring outer disk can dominate the surface brightness at highz,wherezis the vertical distance from the midplane.Thus,in the following,we consider the planar projection and edge-on projection effects together,and correct
3.3.4.Correcting for Both Planar and Edge-on Projection Effects Together
We correct two projection effects fromphotto derivetrue.We do it in a similar way as in the last section,with two major modifications:90is replaced bytrue,and the parameters describing the flaring profile shapes are replaced byM*,RHIandMHI.
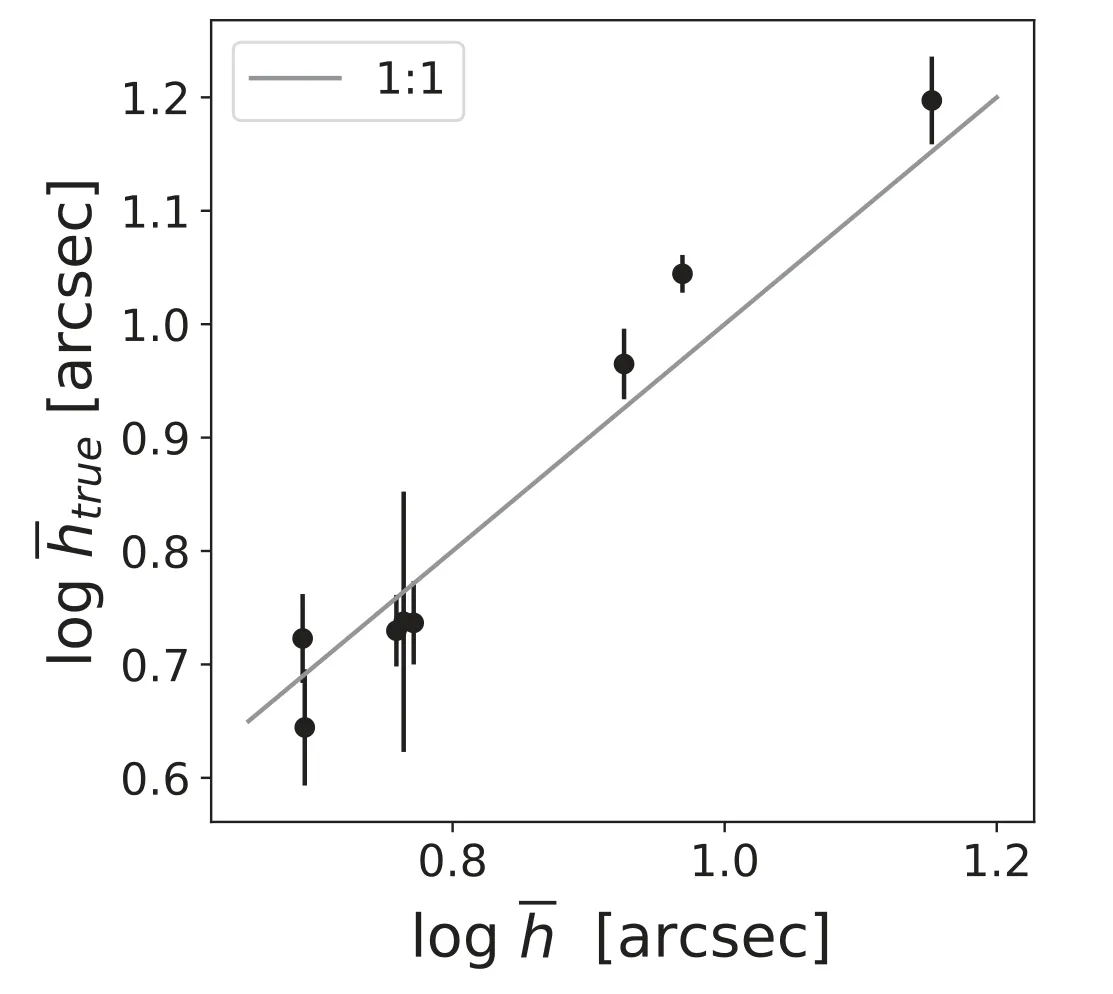
Figure 4.The corrected scale heights of mock cubes with CHANG-ES edgeon sample median parameters vs.input value true.The grey line is the 1:1 line.

in whichc3=?97.91,c2=7.15,c1=5.36 andc0=0.18.

We use Equations (1)–(3) derived above to correct for the three associated observational effects together from photometric scale heights.To test the goodness of such a methodology,we produce mock cubes with the median beam size (15″) and median inclination angle (85°) of the CHANGES edge-on sample.We obtain the photometric scale heights,and correct for the observational effects as described above.Figure4shows that the corrected scale heights agree very well with the true scale heights.The fit demonstrates that the uncertainty in the photometrically measured scale height is typically 9.36% of the true scale height,when the mock galaxies have median properties of CHANG-ES galaxies.
We do not consider the projection effect of warps,for with the limited sensitivity and spectral resolution,as well as the nearly edge-on nature of the sample,it is difficult to reliably identify warps misaligned with respect to the inclination of the main disk.For example,most warps start near or beyondR25(Briggs1990) but due to our limited sensitivity we are unable to detect much H I beyondR25(medianRHI/R25=1.14±0.33).Fortunately,this may reduce a putative warp?s contribution to our photometric determination ofphot.Additionally,the potential contamination from warps is difficult to quantify even when kinematical modeling is involved (Yim et al.2014;Bacchini et al.2019).For these reasons we leave the effect of warps as a caveat to be investigated in the future.
In summary,these mock tests justify that photometrically derived scale heights can indicate the true scale heights of galaxies after properly accounting for the observational effects of PSF smearing,planar projection and edge-on projection.
3.4.Deriving the Corrected Scale Heights
We apply the correction equations estimated from the mock tests to the CHANG-ES photometric measurementsphot,and calculate the corrected scale heights,which are presented in Table2.The final errors ofin this table include the uncertainties associated with these corrections and the propagated uncertainty of the disk inclination (±1°).The scientific analysis will be conducted based on these corrected values.We note that the galaxies largely effected by beam smearing are NGC 4302,NGC 5084,and UGC 10288 due to their low resolution compared with uncorrected photometric scale height,while the uncertainties in Table2for NGC 3877 and NGC 4157 are dominated by inclination angle.The edgeon projection correction significantly reduces the putative overestimate of the photometric scale height.After these corrections,NGC 5084 whose H I are distributed in a large ring,and the tidally perturbed galaxy NGC 3003 which has the lowest mass density among the sample,still have large,while the remainder of the galaxies have scale heights approaching those in the literature (Bacchini et al.2019).
4.Results
We present how the H I scale heights averaged within the optical radius,,correlate with other galactic properties in the left panels of Figures5and6.As labeled in the figures,the Pearson correlation coefficient (R) is calculated based on the whole sample excluding NGC 5084.
NGC 5084 is excluded from the correlation coefficient calculation (and fitting for linear relations as well) because of the globally peculiar structure of the whole disk.Most of its H I is distributed on an outer ring-like structure.This H I “ring” is following a faint optical outer ring and is tilted with respect to the main optical disk by about 5° (Gottesman &Hawarden1986;Zeilinger et al.1990).The origin of the misaligned H I ring is possibly external gas accretion from satellites,as NGC 5084 is one of the most massive galaxies in its group environment.As the H I ring is beyond the optical disk,its scale height is unlikely to be strongly related with the stellar properties.We keep it in the sample,mainly to demonstrate how far galaxies can deviate from major scaling relations when they are globally unsettled.
For the other galaxies,we use different colors to separate the tidally interacting systems(red)from the relatively unperturbed galaxies (blue).
The right panels of Figures5and6depict the corresponding previous results presented inZ21as comparisons.The averaged Gaussian H I scale heights from the method ofZ21are labeled asZ21(see Table2).InZ21,those figures with exponential scale height were presented in Figures7and 8 but not discussed in detail,for the systematic broadening effects had not been investigated and quantified.In this paper,we can look into the trends in figures in more detail.
Figure5(a) features a correlation betweenandRHI.The black dashed line shows the best-fit linear relation log= 0.49 logRHI-0.89.The most significant outliers include two tidally interacting systems (NGC 3003 and NGC 5775) and the peculiar galaxy N5084.From Figure5inZ21,NGC 3003 presents a signature of recent gas-rich minor merger in the southwest corner.From literature studies,NGC 5775 seems to be in the early stage of a major merger and H I masses are likely transferred from its neighbor galaxy NGC 5774.This result shows that H I disks grow thicker when their diameters are larger,which has been found for disks in other wavelengths,for example the optical(de Grijs&Peletier1997;Zasov et al.2002) and the radio continuum (Krause et al.2018).InZ21,we obtained a similar relation betweenZ21andRHIbut with a different slope,forZ21values there were not sufficiently corrected for artificial broadening.
In Figure5(b),is significantly anticorrelated with total mass surface density ΣMtot,r25.The globally peculiar galaxy NGC 5084 is again an outlier.Interestingly,most of the tidally perturbed galaxies in our sample do not behave as outliers in the relation.It implies that normal tidal interaction effects are not dominant in determining the thickness of those H I disks.To confirm this speculation,we also test and find no clear correlation betweenand the local number density of galaxies ρ(taken from Paper I;Irwin et al.2012).This result holds even when we select galaxies with low mass densities.The data points fromZ21show similar strong anticorrelation betweenZ21and ΣMtot,r25,indicating that the trend is strong enough to show itself above the systematic biases.
In Figure5(c),there is a moderate anticorrelation betweenand baryonic mass surface density ΣMbaryon,r25.The correlation is weaker than that of ΣMtot,r25(implications are discussed in Section5).Different from the anticorrelation presented here,the trend ofZ21shows no correlation withRvalue equal to?0.19 with a scatter of 0.28.This inconsistent result implies that the analysis of the systematic biases in this work is useful and a correction is necessary.
In Figure6(a),for our whole sample,there is no clear correlation betweenand star formation rate surface density ΣSFR.We also study the possible relation ofwith the ratio between ΣSFRand ΣMtot,r25in Figure6(b)and no correlation is observed.This is consistent withZ21in which no correlation was found betweenZ21and ΣSFR,or betweenZ21and ΣSFR/ΣMtot,r25,when the broadening effects are not as properly corrected for as in this paper.
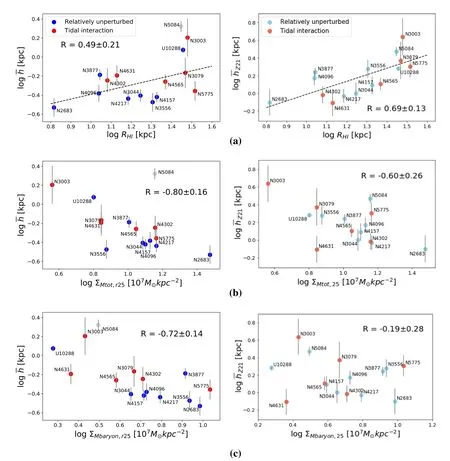
Figure 5.The relation between the average H I Gaussian scale height () and (a) H I radius (RHI),(b) total mass surface density (ΣMtot,r25) and (c) baryonic mass surface density (ΣMbaryon,r25).The left panels show relations of derived in this work,while the right panels display relations of Z21 from Z21.The blue points represent the relatively unperturbed galaxies,and the red points are obvious tidally interacting galaxies.The Pearson correlation coefficient (for the edge-on sample excluding NGC 5084) of each relation is listed in the corresponding panel.The black dashed line in (a) presents the best-fit linear relation (for the edge-on sample excluding NGC 5084) of log = 0.49 log RHI -0.89.
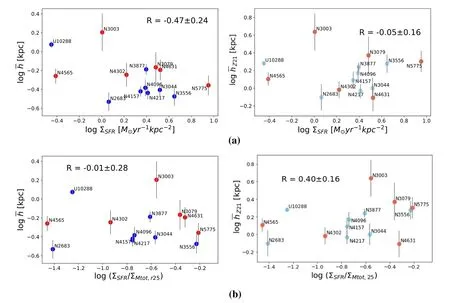
Figure 6.(a)The relation of the average H I Gaussian scale height()vs.the star formation rate surface density(ΣSFR).The edge-on sample is separated into high-(pink dots)and low-ΣMtot,r25(dark cyan dots)subsets.(b)The relation of vs.the ratio between the star formation rate surface density and total mass surface density(ΣSFR/ΣMtot,r25).The colors of points represent different environments like in Figure 3.The left panels show the relations of from this work,while the right panels display the relations of Z21 from Z21 like in Figure 3.

Figure 7.The relation of RHI vs.(a)the total mass surface density(ΣMtot,r25),(b)the baryonic mass surface density(ΣMbaryon,r25),(c)the star formation rate surface density(ΣSFR),and(d)the ratio between the star formation rate surface density and total mass surface density(ΣSFR/ΣMtot,r25).The color and label here are the same as in Figures 5 and 6.
5.Discussion on the Scaling Relations of the Scale Height
One of the major results in this paper is that we find the averaged H I scale heightto be significantly anticorrelated with the total mass surface density ΣMtot,r25.Such a relation seems largely expected from the vertical hydrostatic equilibrium model of H I,as gravity restores the H I to the midplane of the disk.However,in theory,only the mass within the disk layers contributes effectively to the gravity that restores the H I(Forbes et al.2012;Krumholz et al.2018),which our mass density parameters do not strictly indicate.For ΣMtot,r25,the dark matter certainly extends beyond the disk layers,though there has been evidence that dark matter halos can be oblate in shape and thus concentrate more mass in the disk layers(Navarro et al.1996,1997).On the other hand,as typically observed in other massive galaxies (McGaugh et al.2000;Catinella et al.2012;Richards et al.2018),the baryonic-to-total mass ratio is relatively high in our edge-on sample(~0.35±0.15),leaving space for uncertainties in the dark matter geometry.ΣMtot,r25can be viewed as an upper limit of the gravitational mass restoring the H I disk in the vertical direction.The weaker anticorrelation betweenand baryonic mass surface density ΣMbaryon,r25implies that ΣMbaryon,r25is not a perfect indicator of the restoring gravity when averaging over the radial range of the whole optical disk.The total mass is not commonly available for extra-galaxies,and thus as a result it is typically assumed that dark matter is not important and the baryonic mass is sufficient to explain most of the effects related to gravity within the optical radius of massive spiral galaxies.However,our results suggest that the effect of dark matter cannot be ignored at least for H I thickness.Typically,stars are dynamically much hotter than the neutral gas (Habets &Heintze1981),particularly so in massive galaxies (Weidner &Vink2010;Tan et al.2014;Krumholz2015).We may hence overestimate the gravitational contribution from stars,but on the other hand,we have neglected the molecular gas which may have compensated the overestimated stellar contribution.There are also other uncertainties in the relation betweenand ΣMtot,r25(ΣMbaryon,r25).For example,the Poisson equation in cylindrical coordinates indicates that the vertical gravitational acceleration not only depends on the local mass density within a given thickness,but also depends on the changing rate of the disk rotation curve (e.g.,Equation (13) of Krumholz et al.2018).However,our galaxies have highM* and massive galaxies typically have steeply rising and then flattened rotation curves (de Blok et al.2008),minimizing the effective gravitational contribution from this term.Despite all the caveats discussed above,anticorrelates with ΣMbaryon,r25and particularly strongly with ΣMtot,r25,indicating the CHANG-ES H I disks are strongly regulated by gravity.
Here we only make a preliminary discussion and hypothesis on the results with ΣSFR,due to our limited sample size.Stronger conclusions should be made through a larger data set in the future.The supernova feedback and streaming motions of gas are both important channels to produce turbulence(Elmegreen et al.2003;Schnorr Müller et al.2011;Schmidt et al.2016;Ramón-Fox&Bonnell2017)and thus raise the H I disk thickness,and both channels are expected to be associated with star formation.Yet,we do not find a significant relation betweenand SFR surface densities.A possible reason is that the intrinsic trend is weak and buried under uncertainties,as SFR can be fueled in other ways than gas streaming motions,supernova feedback comes from stars formed earlier than reflected by the current SFR and a large portion of energy from the supernova feedback may be distributed into gas of other phases.The magnetic pressure may also support the disk vertical structures (Krumholz et al.2018);although magnetic properties have been derived for several galaxies in the CHANG-ES program (Stein et al.2019,2020;Krause et al.2020),directly quantifying the magnetic pressure remains to be done.
Our results of H I scale heights appear to correspond with the study of Krause et al.(2018) (K18hereafter) about the scale heights in the radio continuum.K18found the radio scale heights correlate with the halo radius (see Figures 12,13 and 14 inK18),anticorrelate with mass surface densities (see Figures 15 and 16 inK18),and do not correlate with SFR surface densities(see Figure 19 inK18)both inC-andL-band.These consistent results reflect the similar way of organizing their vertical structures for the different constituents of the interstellar medium (ISM).In addition,we provide strong support for arguments inK18that the underlying gravitational potential plays a more important role than star formation in determining disk scale heights.Star formation may be important in determining scale heights and structures in individual locations,but globally,the potential appears to dominate.
The really strong correlation betweenandRHIraises the possibility that other dependencies ofshown in this study are artificially caused by a mutual dependence onRHI.Following the study inZ21,we thus test by showing the correlation between the normalized H I scale heightshˉHIand other galactic properties in Figure7.ThehˉHIshows no correlation with ΣMtot,r25,ΣMbaryon,r25,ΣSFRor ΣSFR/ΣMtot,r25.The same results were presented inZ21and the right column of Figure 8,where the systematic biases are not corrected.These results imply that it is indeed possible that the relation betweenand ΣMtot,r25is caused by the more intrinsic correlation betweenandRHIand are not independent or new.On the other hand,this dependence may have been blurred by other dependencies(e.g.,versus ΣSFR) which have contrary slopes.More data will be needed to test both hypotheses in the future.
In the end,we reiterate that the biggest caveat of our analysis is that,due to the lack of kinematic information,we only obtain a rough measure of H I scale heights averaged over a large radial range,and miss the typical flaring feature of galactic gas disks.The systematic uncertainty due to averaging needs to be quantified in the future,based on edge-on H I disks with properly modeled 3D distributions.
6.Summary and Conclusion
We measure H I scale height from 15 highly inclined(inclination>80°) galaxies from the CHANG-ES sample.We build mock data cubes and images for the H I,to explore the feasibility of deriving disk thickness in the photometric way.We show that when the inclinations of disks are not perfectly 90°,the directly measured disk scale heights can be systematically overestimated as a result of planar projection,beam smearing and disk flaring.We quantify the trends of these overestimating effects,which are used as correcting equations for the directly measured disk scale heights.We derive the radially averaged Gaussian scale height within the optical radius for each galaxy and apply these corrections.We find a significant anticorrelation of the corrected scale height with the total mass surface density and the baryonic mass surface density.Compared with the results inZ21,these results imply that either the systematic broadening effects are corrected well in our method,or the underlying physical driver is strong enough to show itself above the biases.
The result is consistent with predictions from the quasiequilibrium model (Poisson equation) of H I vertical distribution,where gravity is the primary force restoring the H I to the midplane of the disk (Krumholz et al.2018).
Acknowledgments
We thank L.Bai,K.Zheng,X.Feng and Y.Fu,and especially thank J.Zhu,Y.Yang,N.Yu,Z.Liang and H.Xu.J.Wang acknowledges support from the National Natural Science Foundation of China (NSFC,Grant Nos.12073002 and 11721303).Parts of this research were supported by the High-performance Computing Platform of Peking University.This research made use of Photutils,an Astropy package for detection and photometry of astronomical sources (Bradley et al.2020),as well as NOD3 (Müller et al.2017),Photutils(Bradley et al.2020) and BBarolo (Di Teodoro &Fraternali2015).
 Research in Astronomy and Astrophysics2022年8期
- Research in Astronomy and Astrophysics的其它文章
- Length Scale of Photospheric Granules in Solar Active Regions
- About 300 days Optical Quasi-periodic Oscillations in the Long-term Light Curves of the Blazar PKS2155-304
- Constraining Mass of M31 Combing Kinematics of Stars,Planetary Nebulae and Globular clusters
- The First Photometric Study of W UMa Binary System V1833 Ori
- On the Jet Structures of GRB 050820A and GRB 070125
- Solar Flare Forecast Model Based on Resampling and Fusion Method