
Qualitative and quantitative evaluation of Flos Puerariae by using chemical fingerprint in combination with chemometrics method
2022-07-22 03:53:34JingHnKeXuQunxingYnWenwenSuiHotinZhngSijieWngZnZhngZiyunWeiFeiHn
Jing Hn,Ke Xu,Qunxing Yn,Wenwen Sui,Hotin Zhng,Sijie Wng,Zn Zhng,Ziyun Wei,Fei Hn,*
aSchool of Pharmacy,Shenyang Pharmaceutical University,Shenyang,110016,China
bDepartment of Ophthalmology,the Fourth People's Hospital of Shenyang,Shenyang,110031,China
cScience and Technology Institute of Shenyang Open University,Shenyang,110003,China
dShenyang Harmony Health Medical Laboratory,Shenyang,110016,China
ABSTRACT
In order to better control the quality of Flos Puerariae(FP),qualitative and quantitative analyses were initially performed by using chemical fingerprint and chemometrics methods in this study.First,the fingerprint of FP was developed by HPLC and the chemical markers were screened out by similarity analysis(SA),hierarchical clustering analysis(HCA),principal components analysis(PCA),and orthogonal partial least squares discriminant analysis(OPLS-DA).Next,the chemical constituents in FP were profiled and identified by HPLC coupled to Fourier transform ion cyclotron resonance mass spectrometry(HPLCFT-ICR MS).Then,the characteristic constituents in FP were quantitatively analyzed by HPLC.As a result,31 common peaks were assigned in the fingerprint and 6 of them were considered as qualitative markers.A total of 35 chemical constituents were detected by HPLC-FT-ICR MS and 16 of them were unambiguously identified by comparing retention time,UV absorption wavelength,accurate mass,and MS/MS data with those of reference standards.Subsequently,the contents of glycitin,genistin,tectoridin,glycitein,genistein,and tectorigenin in 13 batches of FP were detected,ranging from 0.4438 to 11.06 mg/g,0.955 to 1.726 mg/g,9.81 to 57.22 mg/g,3.349 to 41.60 mg/g,0.3576 to 0.989 mg/g,and 2.126 to 9.99 mg/g,respectively.In conclusion,fingerprint analysis in combination with chemometrics methods could discover chemical markers for improving the quality control standard of FP.It is expected that the strategy applied in this study will be valuable for further quality control of other traditional Chinese medicines.
Received 23 March 2021
Keywords:
Flos Puerariae
Fingerprint analysis
Chemometrics
HPLC-FT-ICR MS
1.Introduction
Flos Puerariae(FP)is the flower of Pueraria lobata(WILLD.)OHWI and P.thomsonii BENTH[1].As a well-known herbal medicine,it has been extensively used in China,Japan and Korea for a long time[2,3].Originally,FP was recorded in famous Chinese Pharmaceutical Works of Mingyi Bielu during the Han dynasty.At present,it is recorded in China Pharmacopoeia and National Chinese Herbal Medicine List[4,5].Numerous studies have proved that FP has a variety of pharmacological effects to counteract adverse symptoms,such as antioxidation [1,6-9],anti-diabetes[10],estrogenic[11],anti-inflammation[12],antiobesity[13],antiallergic[14]and antimutagenic effects[15],and management of menopause[16,17].Up to now,it has been widely applied in commercial use due to its potent biological activities[11].
Owing to the characteristics of multi-components,multi-targets and multi-channels,traditional Chinese medicines(TCMs)may be advantageous over single-target medicines in the treatment of many diseases.As a common TCM,FP inevitably produces its therapeutic effects through the synergistic action of abundant chemical components.So far,many studies have shown that the main chemical components of FP are flavonoids,isoflavones,saponins,volatile oils and other kinds of compounds[18-20].Also,many scholars have carried out some studies on the quality evaluation of FP in order to better control its quality[21-24].However,the chemical components of FP have not been fully elucidated and the method of quality control for FP is incomplete till now due to its different origins,growing environment,collection time,etc.That is,the published reports are an insufficient reflection of the quality assessment of FP.Therefore,it is essential to build a reliable and comprehensive strategy to better control its quality.
As a rational approach for the quality assessment of TCMs,fingerprint is composed of chromatographic and spectral information to further recognize the multi-component chemical characteristics [25].In addition,fingerprint demonstrates the similarities and differences about batch-to-batch samples,which can obtain an integral assessment with the help of various modern analytical techniques,especially HPLC[26].However,there are still some shortcomings with fingerprint in evaluating the quality of TCMs.On the side of qualitative analysis,selection and identification of common peaks in TCM fingerprint are largely restricted by the commercially available standard substances[27,28].On the side of quantitative analysis,these components with high content in TCMs are empirically designated as index components.However,it weakens the significance of the fingerprint and always cannot provide characteristic and representative information to control the quality of TCMs[29].In recent years,the chemometric methods including similarity analysis(SA),hierarchical cluster analysis(HCA),and principal component analysis(PCA)have been integrated to HPLC-fingerprint to solve these problems.Moreover,with the development of high resolution mass spectrometry,this integration strategy has also been effectively applied for discovery and identification of qualitative markers in the fingerprint analysis[30-34].
In this study,the qualitative and quantitative analyses combining with chemometrics methods were initially carried out so as to better control the quality of FP and clarify its main chemical compositions for the first time.First,an HPLC fingerprint of 13 batches of FP from different regions was developed.After that,different chemometric methods were applied to discover the qualitative markers.Then,the chemical constituents in FP were identified by HPLC coupled to Fourier transform ion cyclotron resonance mass spectrometry(HPLC-FT-ICR MS).Meanwhile,the contents of the six chemical constituents including the qualitative markers in different samples were simultaneously determined by HPLC.This research will provide comprehensively qualitative and quantitative data for the quality assessment of FP.Also,fingerprint analysis in combination with chemometric methods can be used to discover chemical markers for improving the quality control standard of other TCMs.
2.Materials and methods
2.1.Materials and chemicals
A total of 13 batches of FP were collected from Zhejiang(S1),Guangdong(S2 and S3),Guangxi(S4,S5 and S6),Hebei(S8),Hunan(S9,S10,S11 and S12)and Sichuan(S13)provinces of China.Besides,the control herbs(S7)were purchased from the National Institutes for Food and Drug Control(Beijing,China).Reference standards(purity>98%)including rutin,daidzin,daidzein,and quercetin were obtained from the National Institutes for Food and Drug Control(Beijing,China).Glycitin,genistin,tectoridin,glycitein,genistein,tectorigenin,and biochanin A with the purities over 98% were purchased from Shanghai Yuanye Bio-Technology Co.,Ltd.(Shanghai,China).Nicotiflorin and ononin with the purities over 98% were bought from Chengdu Alfa Biotechnology Co.,Ltd.(Chengdu,China).Meanwhile,formononetin and puerarin were bought from Chengdu Must Bio-Technology Co.,Ltd.(Chengdu,China).HPLC grade acetonitrile(ACN)and methanol(MeOH)were obtained from Fisher Scientific(Fair Lawn,NJ,USA).Formic acid of HPLC grade was provided by Kermel Chemical Reagent Co.,Ltd.(Tianjin,China)and pure water was obtained from Wahaha(Hangzhou,China).All the other reagents were of analytical grade.
2.2.Preparation of sample solutions and standard solutions
Firstly,FP was ground into powder before extraction.The powder(0.5 g)was weighed and placed into a 50 mL erlenmeyer flask and sonicated with 10 mL of 70% methanol for 30 min.After cooling to room temperature,the weight loss was compensated with appropriate 70% methanol.Then,the sample solution was filtered through a 0.22μm membrane filter prior to analysis.The sample from Guangxi(S4)was prepared for methodology validation of fingerprint and the sample from Hunan(S9)was prepared for identification of chemical constituents.
Meanwhile,all reference standards were accurately weighed and dissolved in methanol to get individual stock standard solutions.The stock standard solutions were further diluted appropriately by methanol to prepare the mixed standard solution.For fingerprint analysis,a mixed standard solution of six reference standards,namely,glycitin,genistin,tectoridin,glycitein,genistein and tectorigenin,was prepared to identify the common peaks in HPLC chromatograms.On the other hand,a mixed standard solution consisting of sixteen reference standards including glycitin,genistin,tectoridin,glycitein,genistein,tectorigenin,biochanin A,rutin,daidzin,quercetin,nicotiflorin,ononin,formononetin,puerarin,luteolin,and daidzein was prepared for characterization of chemical compositions by HPLC-FT-ICR MS analysis.
For quantitative analysis,the sample solutions were prepared as follows:FP powder(0.2 g)was accurately weighed and placed into a 50 mL erlenmeyer flask and sonicated with 30 mL of 70% methanol for 30 min.After cooling to room temperature,the weight loss was compensated with appropriate 70% methanol.Then,the sample solution was filtered through a 0.22μm membrane filter prior to HPLC analysis.In addition,a mixed standard solution composed of 82.0 μg/mL glycitin,79.8 μg/mL genistin,510 μg/mL tectoridin,80.0 μg/mL glycitein,81.6 μg/mL genistein,and 99.9 μg/mL tectorigenin was prepared.Then,it was diluted by methanol to obtain the serial working standard solutions.
2.3.Chromatographic conditions for fingerprint analysis
An Agilent 1200 series HPLC system comprising an autosampler,a quaternary pump,an online degasser,a column compartment,and a diode array detector(Agilent Technologies,Waldbronn,Germany)was used for fingerprint analysis.The chromatographic separation was carried out on a ZORBAX XDB-C18column(250 mm×4.6 mm,5μm;Agilent,Santa Clara,CA,USA).The mobile phase was composed of acetonitrile(A)and 0.1% formic acid in water(B).The flow rate was kept at 1.0 mL/min and the linear gradient program was set as follows:0-10 min,5%-10%A;10-40 min,10%-16%A;40-80 min,16%-25%A;80-90 min,25%-40%A;90-100 min,40%-80%A;and 100-110 min,80%A.The column temperature was maintained at 30°C.The detection wavelength was 265 nm.The injection volume was 10μL.
2.4.Chromatographic and mass spectrometry conditions for HPLCFT-ICR MS analysis
The chemical constituents in FP were profiled and identified by using an Agilent 1260 series HPLC system(Agilent Technologies,Waldbronn,Germany)coupled to a Solarix 7.0T FT-ICR MS(Bruker,Germany).The chromatographic conditions were consistent with those described in Section 2.3.The MS parameters were set as follows:flow rate of nebulizer gas(N2)was 8.0 L/min,capillary temperature was 200°C,capillary voltages of ESI were-4500 V and 4500 V under positive-ion and negative-ion modes,respectively,end plate offset was-500V,nebulizer gas(N2)pressure was 4.0 bar,mass range was 100-1000 m/z,and the averaged scan number was set to once.Additionally,the collision energy was initially set at 10 eV and adjusted dynamically to obtain the representative fragment ions.According to the manufacturer’s instructions,a solution of NaTFA(0.05-0.1 mg/mL in 50:50 ACN:H2O)was injected to calibrate MS before analysis.
2.5.Chromatographic conditions for quantitative analysis
The Agilent 1200 series HPLC system was also used for quantification analysis.The chromatographic separation was also carried out on the ZORBAX XDB-C18column(250 mm × 4.6 mm,5μm;Agilent,Santa Clara,CA,USA).The mobile phase was composed of acetonitrile(A)and 0.1% formic acid in water(B).The mobile phase was set as follows:0-30 min,13%-17%A;30-32 min,17%-22%A;32-42 min,22%-23%A;42-45 min,23%-26%A;and 45-60 min,26%-30%A.The flow rate was 1.0 mL/min.The column temperature was maintained at 30°C.The detection wavelength was 265 nm.The injection volume was 10μL.
2.6.Data analysis
For chromatographic fingerprints, chemometrics methods including similarity analysis(Similarity Evaluation System for Chromatographic Fingerprint of Traditional Chinese Medicine,version 2012,National Committee of Pharmacopoeia,China),HCA(IBM SPSS Statistics 22.0,Armonk,NY,USA),PCA,and orthogonal partial least squares discriminant analysis(OPLS-DA;SIMCA-P 14.1,Umetrics,Umea,Sweden)were separately performed to evaluate the quality of FP,and the potential qualitative markers were screened by OPLS-DA.Moreover,the quality of the statistical model of OPLS-DA was assessed by three parameters:R2X,the proportion of the total variance of the dependent variables explained by the model;R2Y,the proportion of the total variance of the reponse variable(different brands of the samples)explained by the model;and Q2,which is similar to R2Y except that it is computed by crossvalidation.These parameters ranged between 0 and 1 and indicated the variance explained by the model for all the data analyzed(R2)and this variance in a test set by cross-validation(Q2).According to the results of OPLS-DA,variable importance of projection(VIP)was generated and the potential chemical markers were selected on the base of VIP values>1[35].Meanwhile,variables without significant differences(P>0.05)were eliminated.Variables with VIP>1 and P<0.05 were considered to be the qualitative markers responsible for the difference of FP.For characterization of the chemical constituents in FP by HPLC-FT-ICR MS,the instrument control and data acquisition were achieved by Bruker Compass Hystar(version 4.1,Bruker Daltonics,Germany)and Fourier Transform Mass Spectrometer Control(version 2.1,Bruker Daltonics,Germany).All MS data were processed on DataAnalysis software(version 4.1,Bruker Daltonics,Germany).
3.Results and discussion
3.1.Optimization of fingerprint and HPLC-FT-ICR MS conditions
To obtain satisfactory separation and high analytical efficiency,a series of preliminary experiments including selection of column type,optimization of mobile phase composition,determination of detection wavelength, and comparison of column temperature were carried out.Different columns such as ZORBAX XDB-C18(250 mm×4.6 mm,5μm),ZORBAX Extend-C18(250 mm×4.6 mm,5μm),and GL Science Inertsil ODS-3(150mm×4.6mm,3μm)were compared.As a result,a satisfactory chromatographic separation was achieved by ZORBAX XDB-C18(250 mm×4.6 mm,5μm)column.The ACN-water system showed better separation and more satisfactory peak shape than MeOH-water system.Moreover,0.1% formic acid was added to the ACN-water system to enhance the peak capacity and improve the peak shape of flavonoids.Different column temperatures and detection wavelengths were also compared.As a result,a satisfactory chromatographic separation and UV absorption for most constituents were obtained at 30°C and 265 nm.
On the other hand,for identification of the chemical constituents in FP by HPLC-FT-ICR MS,the MS parameters such as ionization mode,capillary voltage,end plate offset,acquisition size,and the averaged scan number were optimized,respectively.Under the conditions mentioned above,both positive-ion and negative-ion modes were more reliable in producing comprehensive information of quasi molecular ions for different chemical compounds in FP.Particularly,acquisition size and averaged scan number were optimized to ensure the higher mass accuracy and mass resolution of FT-ICR MS.When acquisition size was set to 1 mega byte(MB)and the scan number was set to once,the mass accuracy could be limited within 3.0 ppm and the resolution could be reached about 50,000 at m/z 400.
3.2.Establishment of fingerprint of FP
In order to establish the characteristic fingerprint of FP,13 batch samples from different origins of China were investigated by HPLC.As a result,31 independent peaks in the chromatographic fingerprints with satisfactory separation were assigned to common peaks(Figs.1A and B).The reference chromatogram(S9)was chosen and peak 16 was assigned to the reference peak owing to its moderate retention time,high enough content,and signal intensity in FP.Then,the relative retention time(RRT)and relative peak area(RPA)relative to the reference peak were obtained and calculated to assess the quality of FP.By comparing the retention time and the UV absorption spectra with the mixed standard solution,peaks 8,16,18,26,29 and 30 were identified to glycitin,genistin,tectoridin,glycitein,genistein,and tectorigenin,respectively(Fig.1C).
3.3.Chemometric analysis
3.3.1.SA
It is important that chromatographic fingerprints should be evaluated by their similarities,which are calculated from the values of correlation coefficient.Avalue of the correlation coefficient close to 1.0 indicates a perfect similarity of the different samples.On the contrary,a low correlation coefficient indicates a poor mathematical quality for identifying the relationship between different samples.Therefore,heterogeneity of the similarity suggests that the quality of the different samples depends on different manufactures and diversities.According to the recommendation of China Food and Drug Administration,the similarities of the 13 samples were calculated by the Similarity Evaluation System for Chromatographic Fingerprint of Traditional Chinese Medicine(version 2012).As summarized in Table 1,the similarities of the batches from Guangxi I(S4)and Sichuan(S13)were 0.803 and 0.806,respectively.The low similarity might be caused by the lower intensity of peaks 15 and 18 in these two samples.However,the similarities of the remaining 11 batches of FP were all higher than 0.90.Especially,the similarities of samples of Hunan origins were all higher than 0.95.It suggested that the FP samples collected from Hunan had a better and stable quality.Also,it indicated that the fingerprint analysis for FP could be used for assessment of quality and authenticity of herbal medicines.
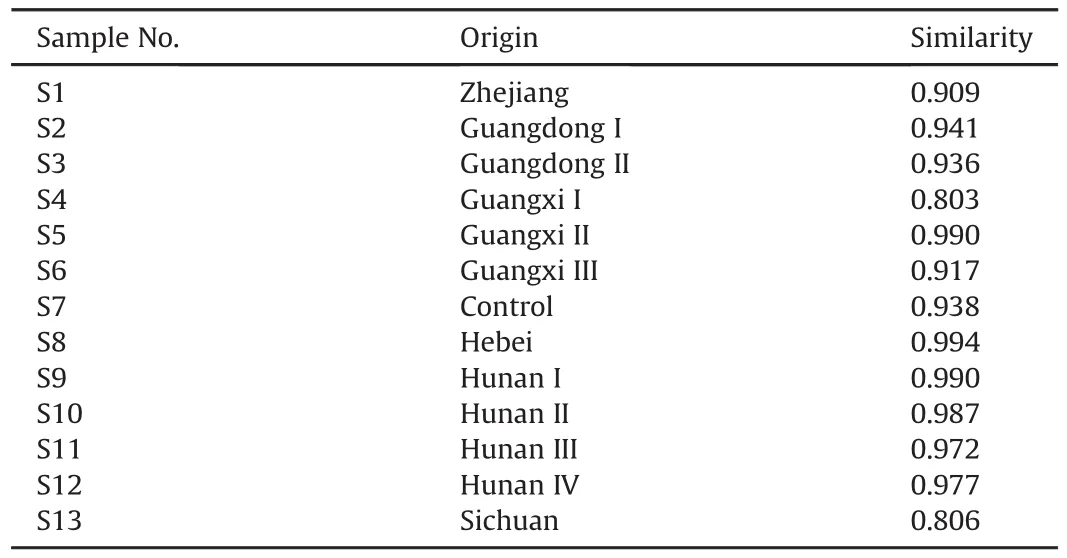
Table 1Results of similarity analysis of Flos Puerariae from different origins.
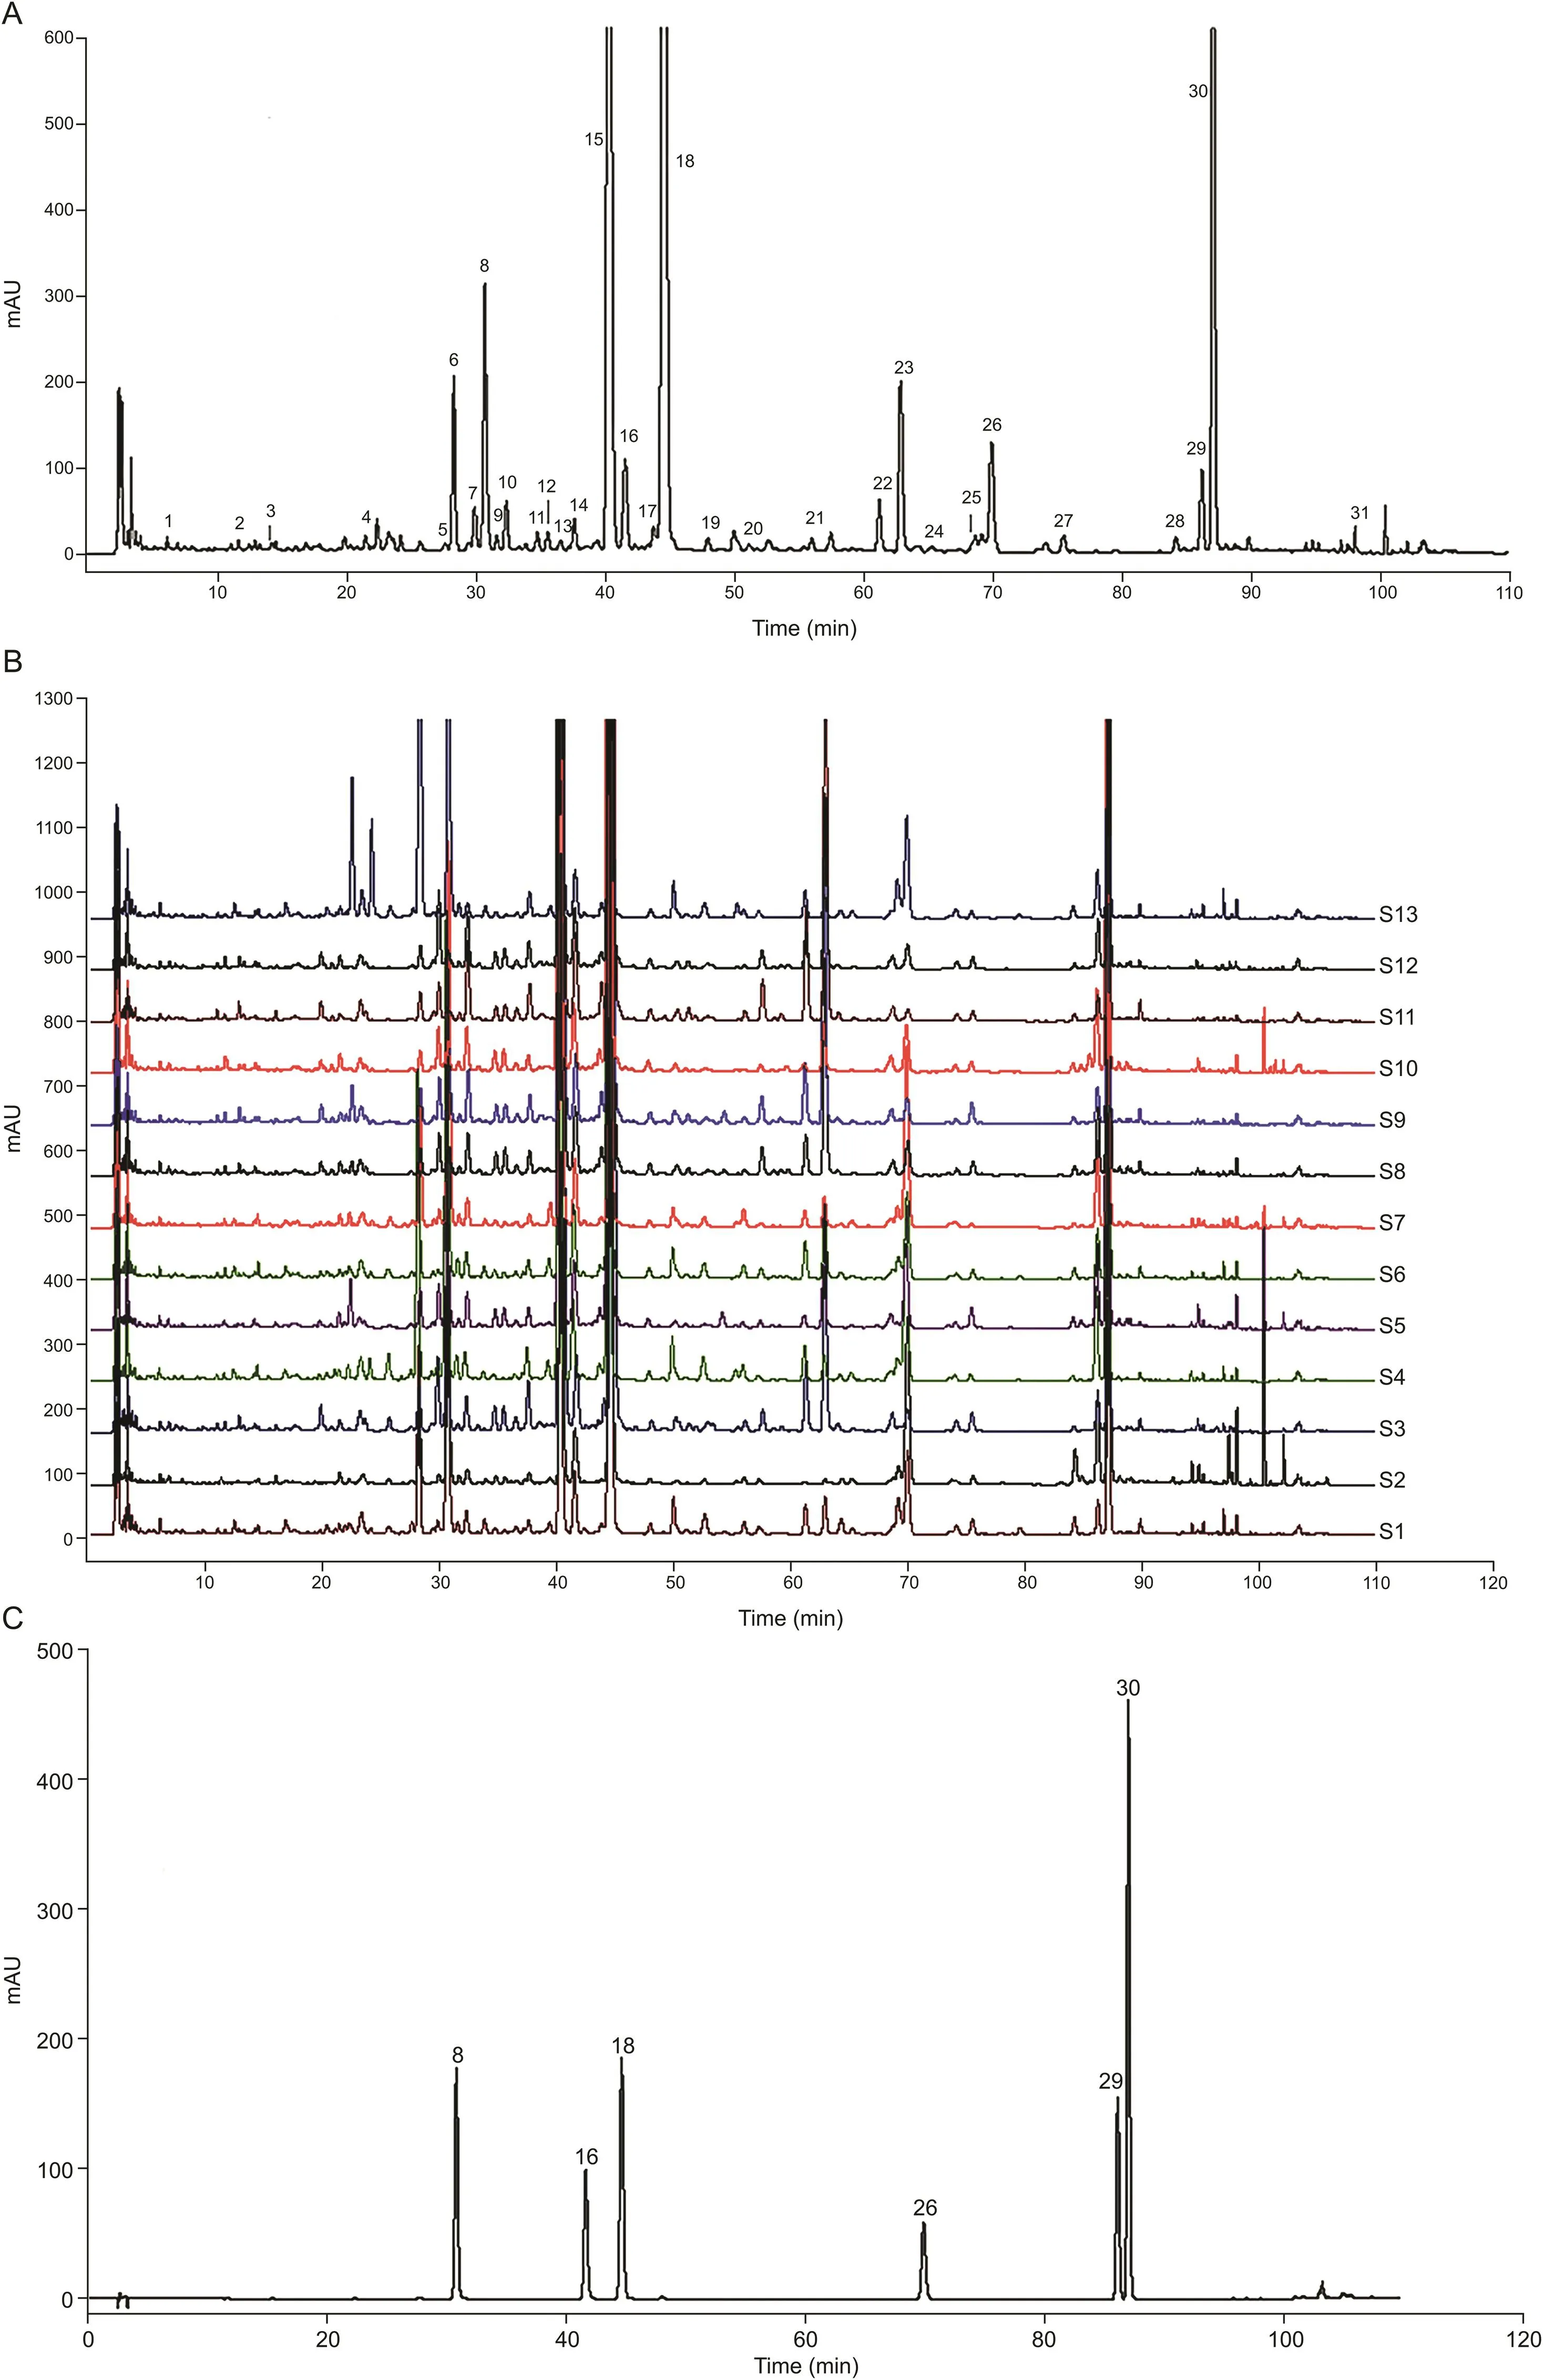
Fig.1.HPLC chromatogram of Flos Puerariae.(A)HPLC reference fingerprint of Flos Puerariae.(B)HPLC overlap of 13 batches of Flos Puerariae samples.(C)HPLC chromatogram of mixed reference standards.
3.3.2.HCA
HCA is a statistical method to organize a series of samples into unique,mutually exclusive groups by clustering some similar characteristics of data points[31].The smallest distance shows the highest degree of relationship,indicating that those objects are more likely to cluster in a group.In this study,HCA was performed on the software of IBM SPSS Statistics 22.0 to assess the quality of FP.As displayed in the dendrogram(Fig.2A),it was obvious that 13 samples of FP were divided into two main clusters.The cluster I included samples from Zhejiang(S1),Guangdong I(S2),Guangxi I(S4),Guangxi III(S6),Control(S7),Sichuan(S13).As we know,the relational grades of different samples depend upon the distance in the dendrogram,where the shortest distance shows the highest similarity.Therefore,the 6 batches of samples mentioned above were considered to have the similar attributes of one group.On the other hand,the cluster II was composed of another 7 batches of samples collected from Guangdong II(S3),Guangxi II(S5),Hebei(S8),Hunan I(S9),Hunan II(S10),Hunan III(S11),and Hunan IV(S12),respectively.By comparing the fingerprints in these two groups,it was clear that the signal intensity of peak 15 and peak 18 showed significant differences.It indicated that these two peaks could be considered as potential quality markers for quality assessment and classification of FP samples.
3.3.3.PCA
In order to further distinguish the 13 batch samples,PCA was performed to discover the characteristic peaks which show significant differences in the HPLC fingerprints.The peak areas of 31 common peaks from 13 batch samples were imported into the SIMCA-P software,and the scores and loadings of multivariate analysis were obtained.As shown in the score plot of PCA(Fig.2B),all samples were apparently separated into two groups according to the different origins.In detail,the batches of S1,S2,S4,S6,S7 and S13 were prone to be classified into one group.Meanwhile,the batches of S3,S5,S8,S9,S10,S11 and S12 were prone to be classified into the other group.The results of group assignments were consistent with HCA.
Moreover,the potential qualitative markers of FP were screened by OPLS-DA.As displayed in Fig.2C,all samples were also apparently distinguished to two groups,which was consistent with the results of PCA.The parameters R2and Q2were used to evaluate the performance of the models,which confirmed the goodness of this model for sample classification.As a result,satisfactory values for the quality parameters were obtained.The R2X was 0.795,indicating that 79.5% of the variation in the dataset could be modeled by the selected components.The Q2was 0.918,indicating a very good predictivity and the two sets were clearly separated.The R2Y was 0.964,indicating that the model was well fitted.Additionally,VIP value of each variable responsible was calculated,and then the statistical analysis was conducted by Student’s t-test to confirm the alterations of the chemical markers between different groups.As a result,common peaks with the VIP>1 and P<0.05 were selected and considered as potential quality markers to distinguish the FP samples.Six common peaks including peak 15(VIP 3.581),peak 18(VIP 3.225),peak 8(VIP 1.480),peak 6(VIP 1.137),peak 23(VIP 1.053),and peak 30(VIP 1.010)showed significant differences in these two groups(Fig.2D).The results clearly showed that these six common peaks played a crucial role in the quality discrimination of FP.Among them,peak 8,peak 18,and peak 30 were identified to be glycitin,tectoridin and tectorigenin by comparing with reference standards,respectively.In conclusion,these common peaks may be contributed to distinguishing different FP samples.Moreover,they can be used to evaluate the quality of FP in future.
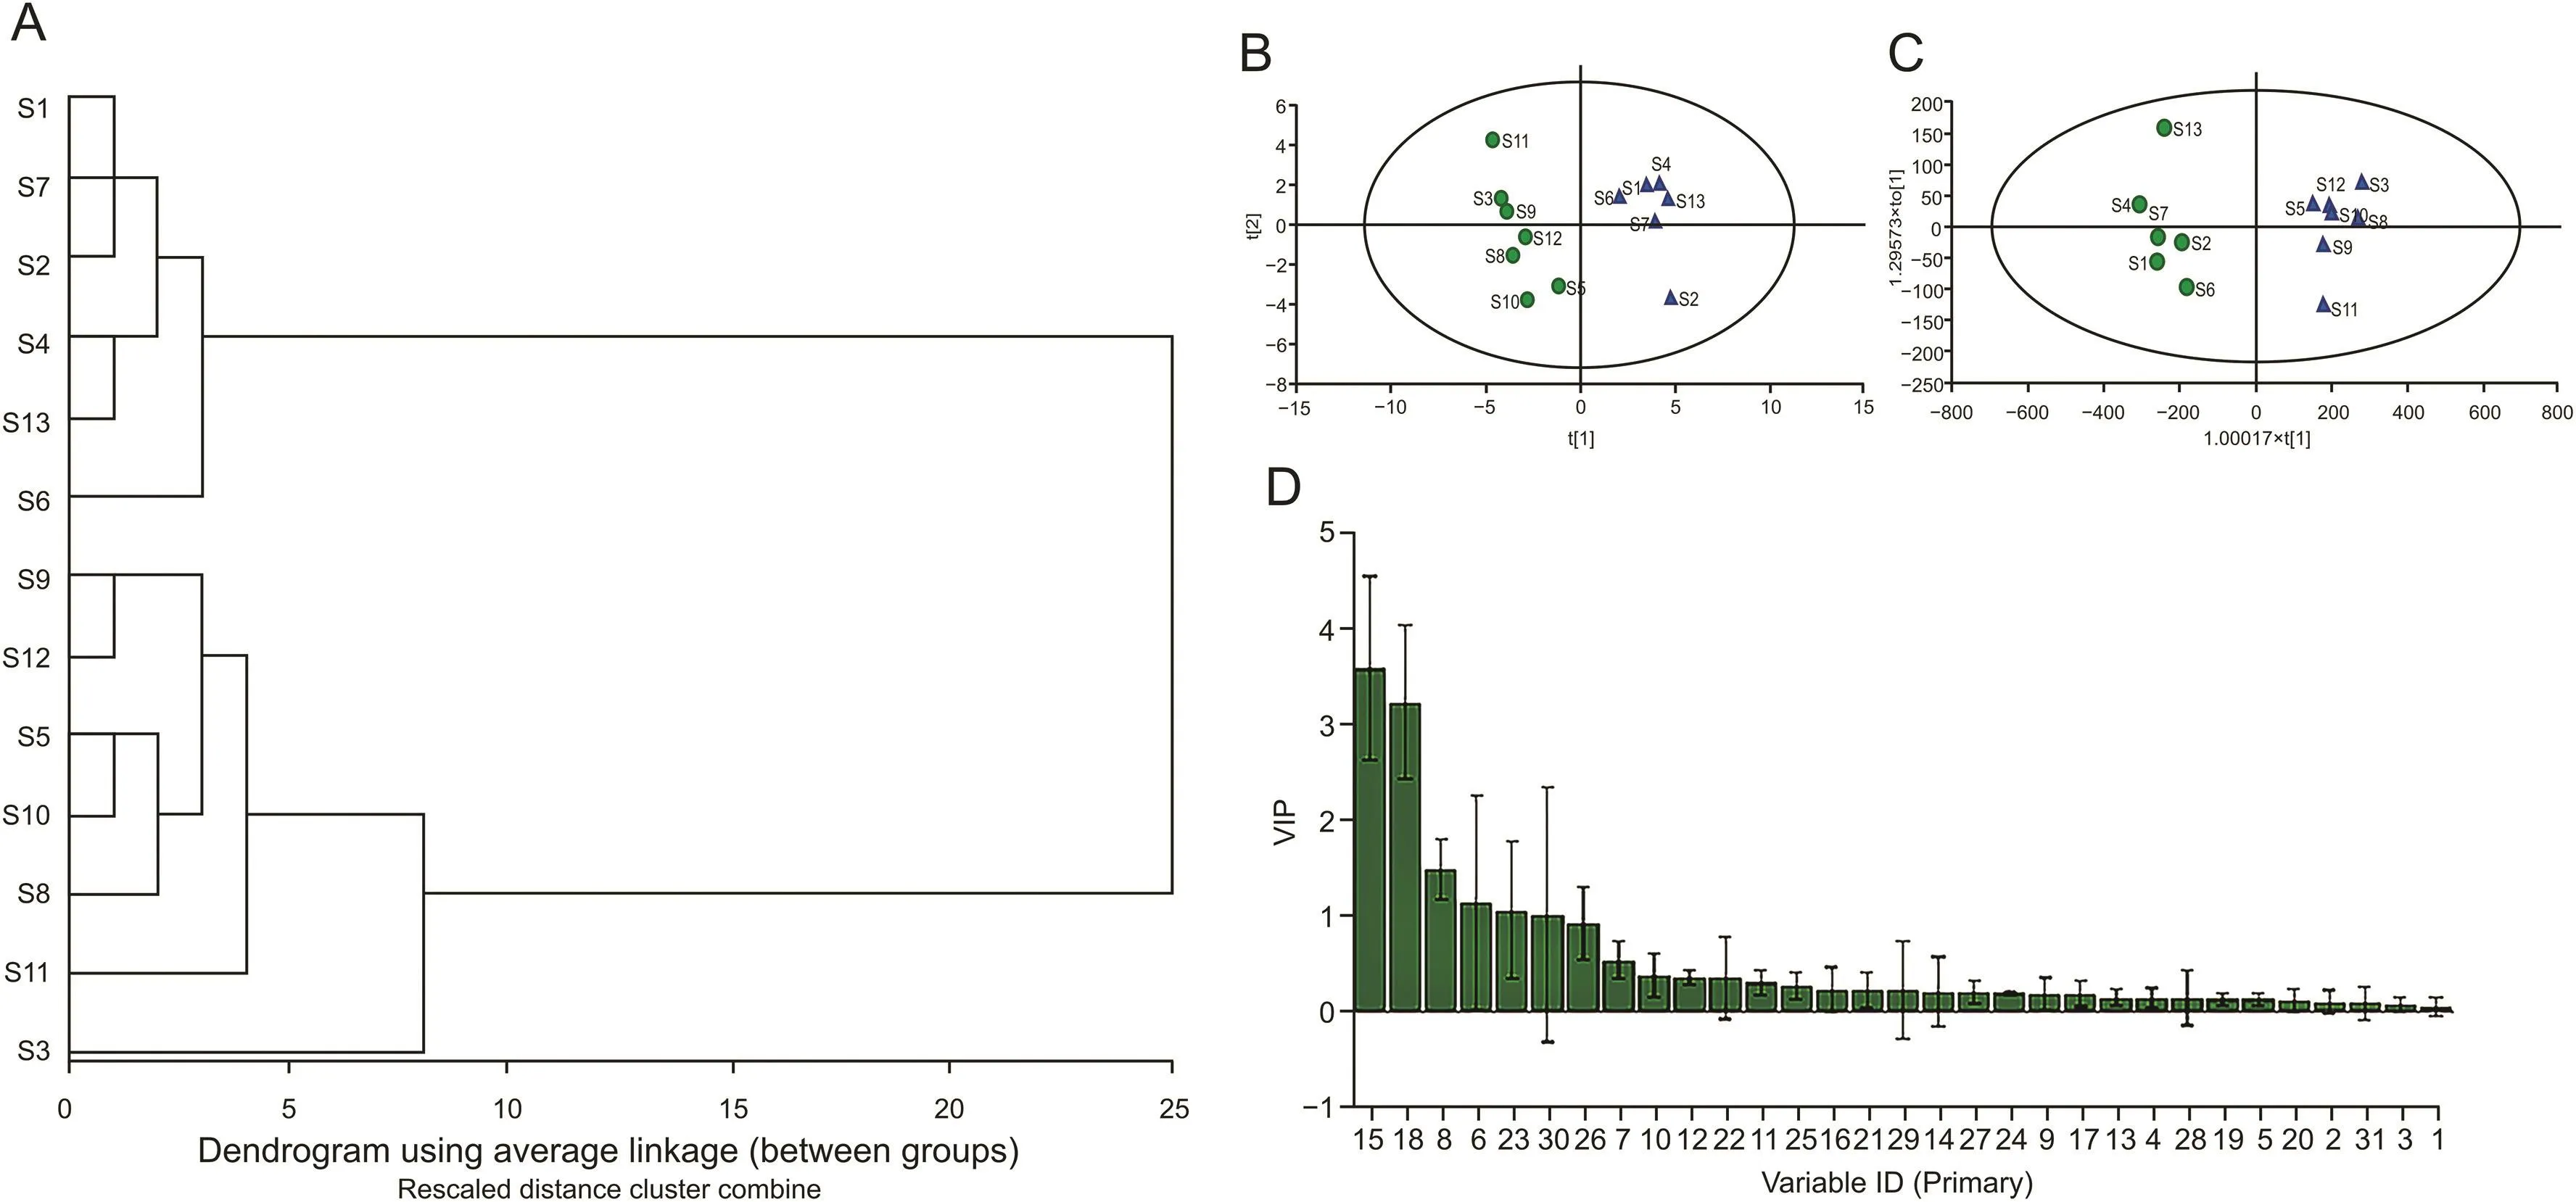
Fig.2.Multivariate statistical analysis of Flos Puerariae.(A)Hierarchical clustering analysis of 13 batch samples.(B)Score plot of PCA for 13 batch samples.(C)Score plot of OPLS-DA for 13 batch samples.(D)Variable important plot of OPLS-DA.
3.4.Characterization of chemical constituents in FP by HPLC-FT-ICR MS
In order to systematically evaluate the quality of FP,the chemical constituents were characterized by HPLC-FT-ICR MS method.As shown in Figs.3A and C,the profiling of chemical constituents in FP was provided by the extracted ion chromatograms in negative-ion and positive-ion modes,respectively.A total of 35 compounds were separated and detected by HPLC-FT-ICR MS.The information of accurate mass,retention time,and chemical formulae for these chemical compounds is summarized in Table 2.In detail,29 flavonoids,1 saponin,and 5 unknown chemical components were detected.Among them,16 peaks were unambiguously identified by comparing the retention time,UV absorption and accurate mass of adduct ions with reference standards.The extracted ion chromatograms of mixed standards in negative-ion and positive-ion modes are provided in Figs.3B and D,respectively.
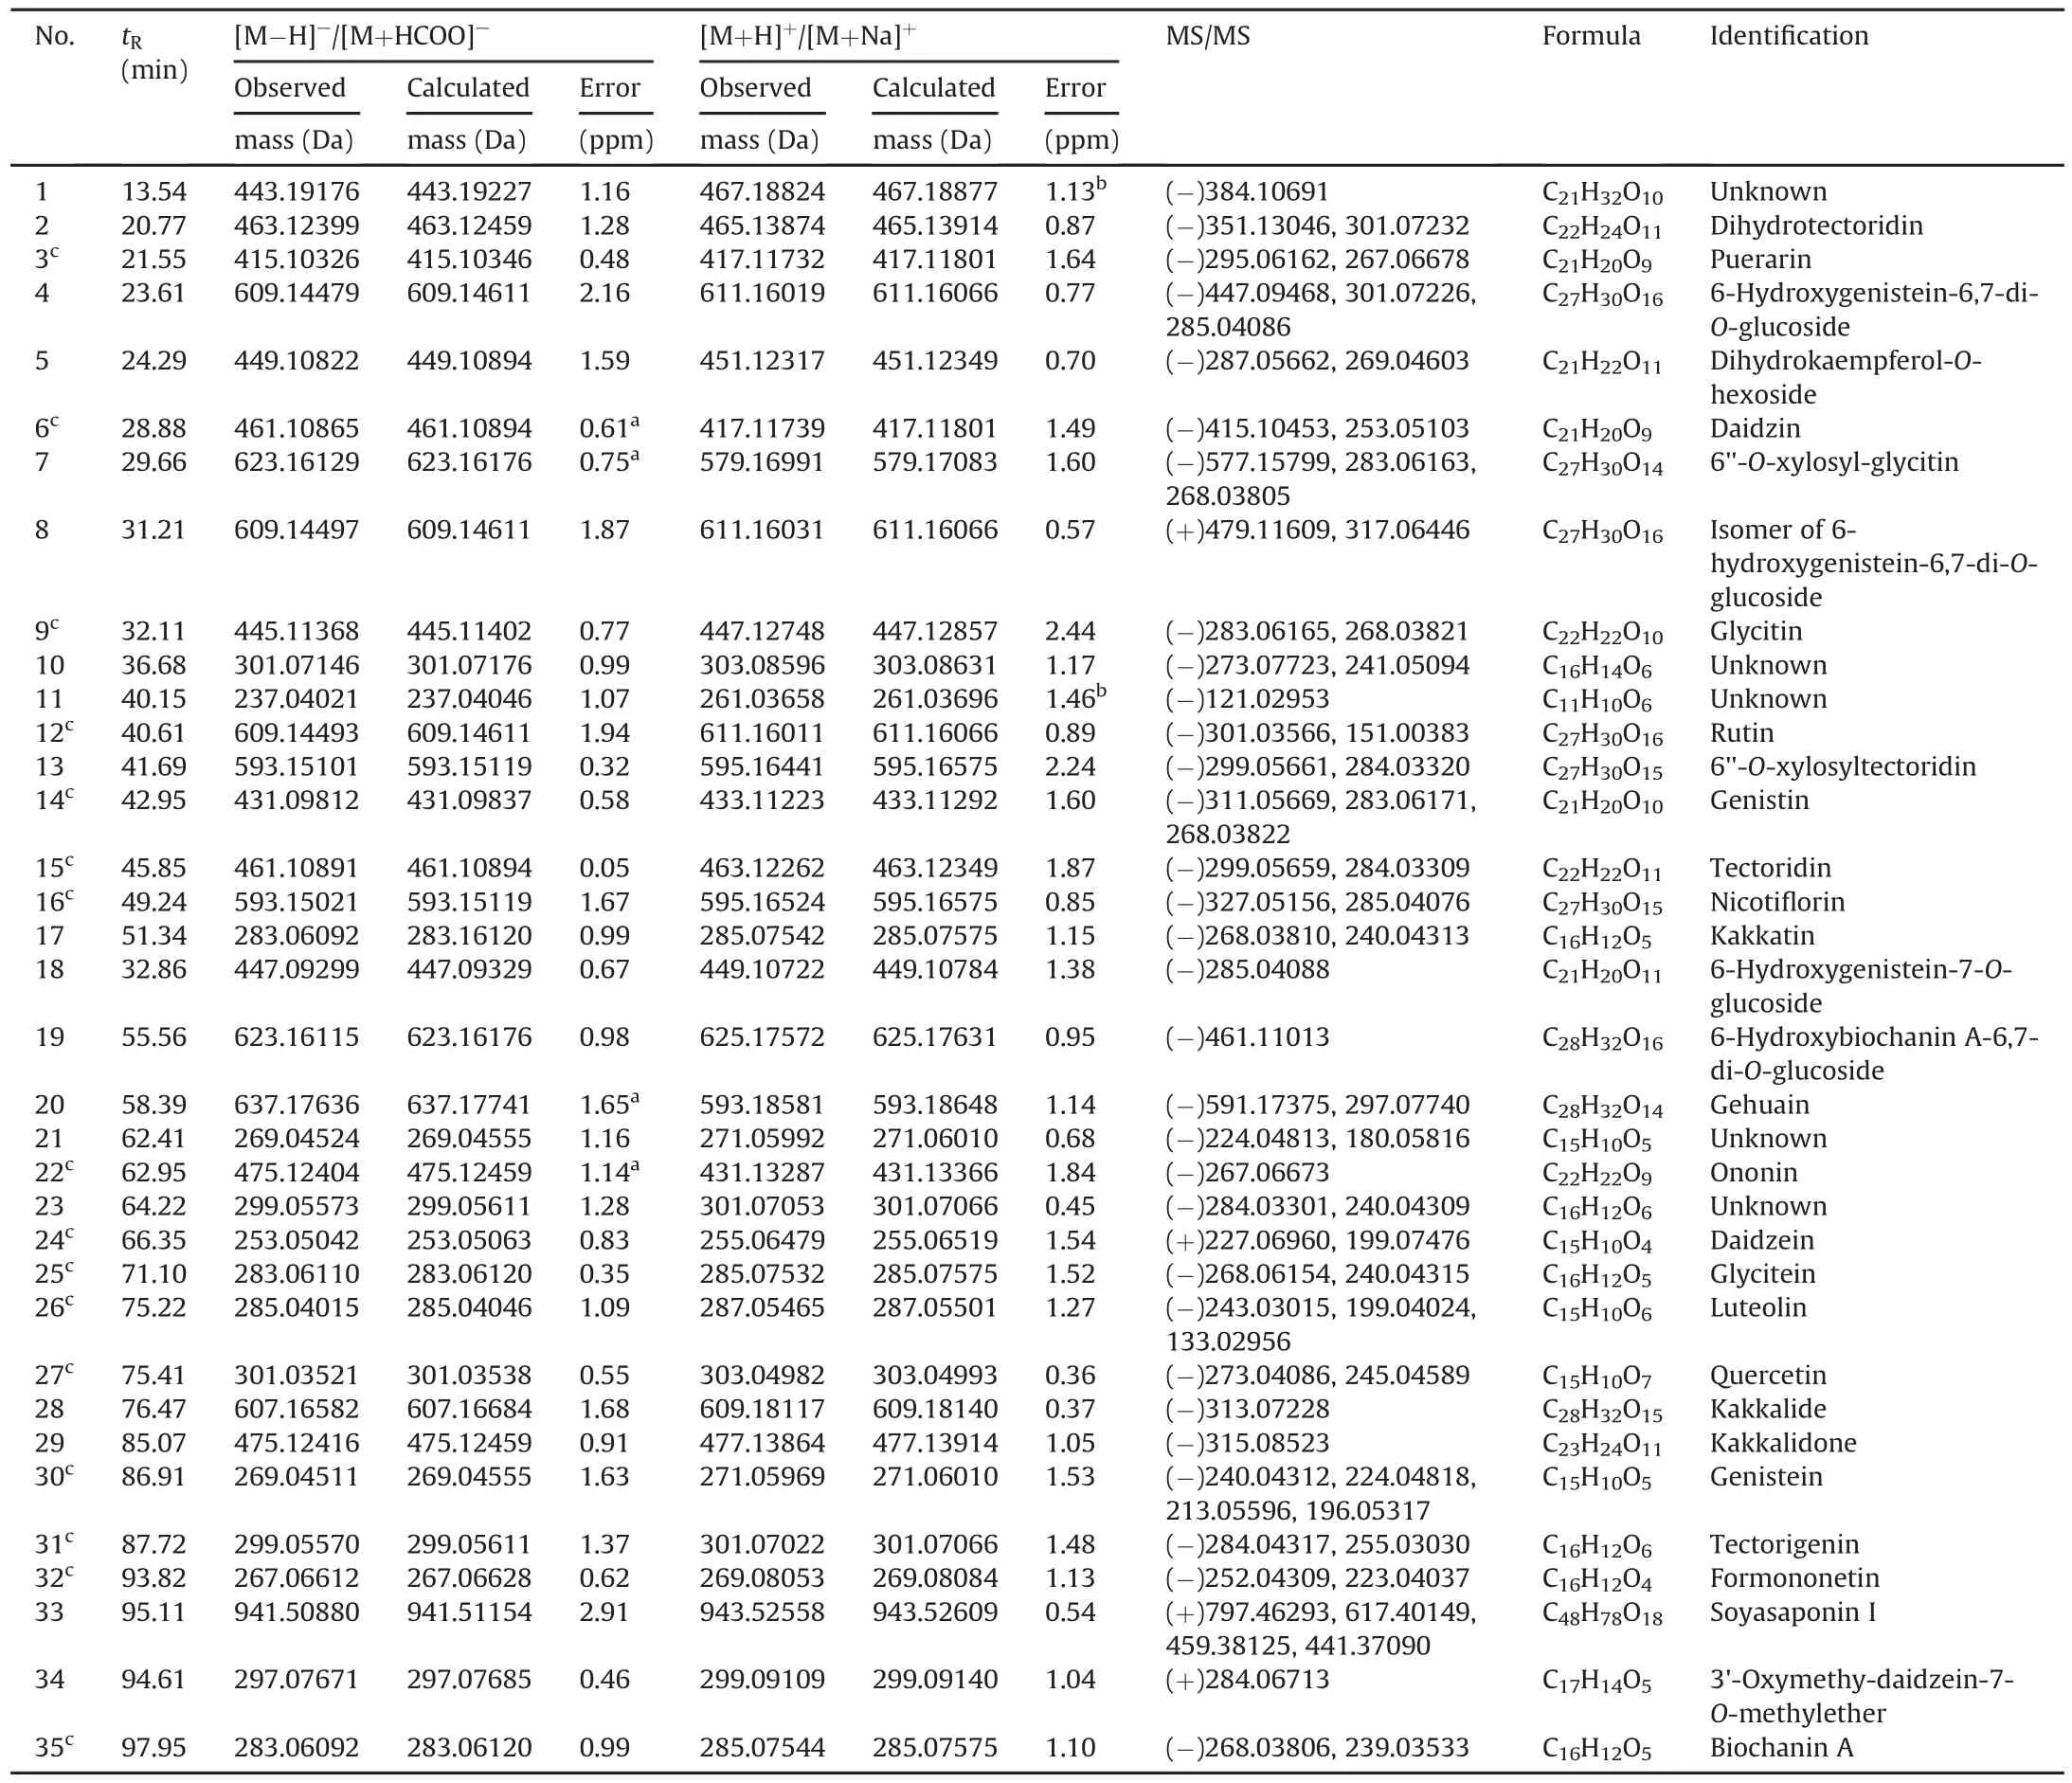
Table 2Compounds identified in Flos Puerariae by HPLC-FT-ICR MS.
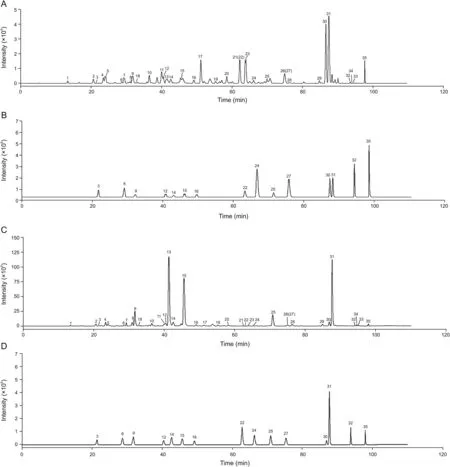
Fig.3.Extracted ion chromatograms obtained by HPLC-FT-ICR MS for Flos Puerariae and reference standards.(A)Extracted ion chromatograms of Flos Puerariae in negative-ion mode.(B)Extracted ion chromatograms of reference standards in negative-ion mode.(C)Extracted ion chromatograms of Flos Puerariae in positive-ion mode.(D)Extracted ion chromatograms of reference standards in positive-ion mode.Peaks 3,6,9,12,14,15,16,22,24,25,26,27,30,31,32 and 35 are puerarin,daidzin,glycitin,rutin,genistin,tectoridin,nicotiflorin,ononin,daidzein,glycitein,luteolin,quercetin,genistein,tectorigenin,formononetin and biochanin A,respectively.
The identification of tectoridin and daidzein was used to demonstrate the fragmentation process of flavonoids.For tectoridin(compound 15),it was detected at the retention time of 45.85 min with[M+H]+at m/z 463.12262(1.87 ppm)and[M-H]-at m/z 461.10891(0.05 ppm)in positive and negative ion modes,respectively.The calculated molecular formula was speculated to be C22H22O11based on Data Analysis software.Then,the[M-H]-ions were fragmented into the characteristic ions at m/z 299.05659 and 284.03309.Unquestionably,the important fragmentation from deprotonated ion was the cleavage of the glycosidic linkage leading to the formation of m/z 299.05659.And the fragment ion at m/z 284.03309 was the result of losing a methyl from m/z 299.05659[36](Fig.4A).After further confirmation by comparison with the reference standards,compound 15 was confirmed to be tectoridin[37].Similarly,the proposed fragmentation pathways of compound 24 is shown in Fig.4B.The protonated molecule[M+H]+at m/z 255.06479 and deprotonated molecule[M-H]-at m/z 253.05042 were eluted at 66.35 min in positive-ion and negative-ion modes,respectively.The molecular formula was assigned to C15H10O4by limiting the measurement error within 2 ppm.Furthermore,the two main fragment ions at m/z 227.06960 and 199.07476 were assigned to[M+H-CO]+and[M+H-CO-CO]+,respectively.The fragmentation process was in agreement with the reference standard and the literature[38].Therefore,the compound was chemically defined as daidzein.
Subsequently,according to the result of accurate mass,MS/MS data and literature reports,the chemical structures of another 16 compounds were speculated,which were tentatively identified to be dihydrotectoridin,kakkatin,gehuain,6-hydroxygenistein-6,7-di-O-glucoside,dihydrokaempferol-O-hexoside,kakkalide,6''-O-xylosyl-glycitin,isomer of 6-hydroxygenistein-6,7-di-O-glucoside,kakkalidone,6''-O-xylosyltectoridin,6-hydroxygenistein-7-O-glucoside,6-hydroxybiochanin A-6,7-di-O-glucoside,soyasaponin I,3'-oxymethy-daidzein-7-O-methylether,and luteolin,respectively.For example,compound7 with the retention time of 29.66 min showed a signal of[M+HCOOH-H]-ion at m/z623.16129(0.75ppm),indicating a unique molecule formula of C27H30O14.As shown in the proposed fragmentation pathways(Fig.4C),the characteristic product ion was yielded at m/z 577.15799 due to the loss of formic acid and the elimination of xylose,and glucose produced the product ion of m/z 283.06163.Moreover,the product ion at m/z268.03805 corresponded to the demethylated product of m/z 283.06163[36].Therefore,it was tentatively identified to be 6''-O-xylosyl-glycitin[37].Likewise,other compounds were putatively identified and the possible structures of 29 chemical constituents are provided in Fig.5.In addition,the chemical formulae of 5 unknown compounds,namely,compounds 1,10,11,21,and 23,were determined by using the isotopic fine structure(IFS)as described in our previous study[39,40].However,further study should be carried out to confirm their chemical structures.
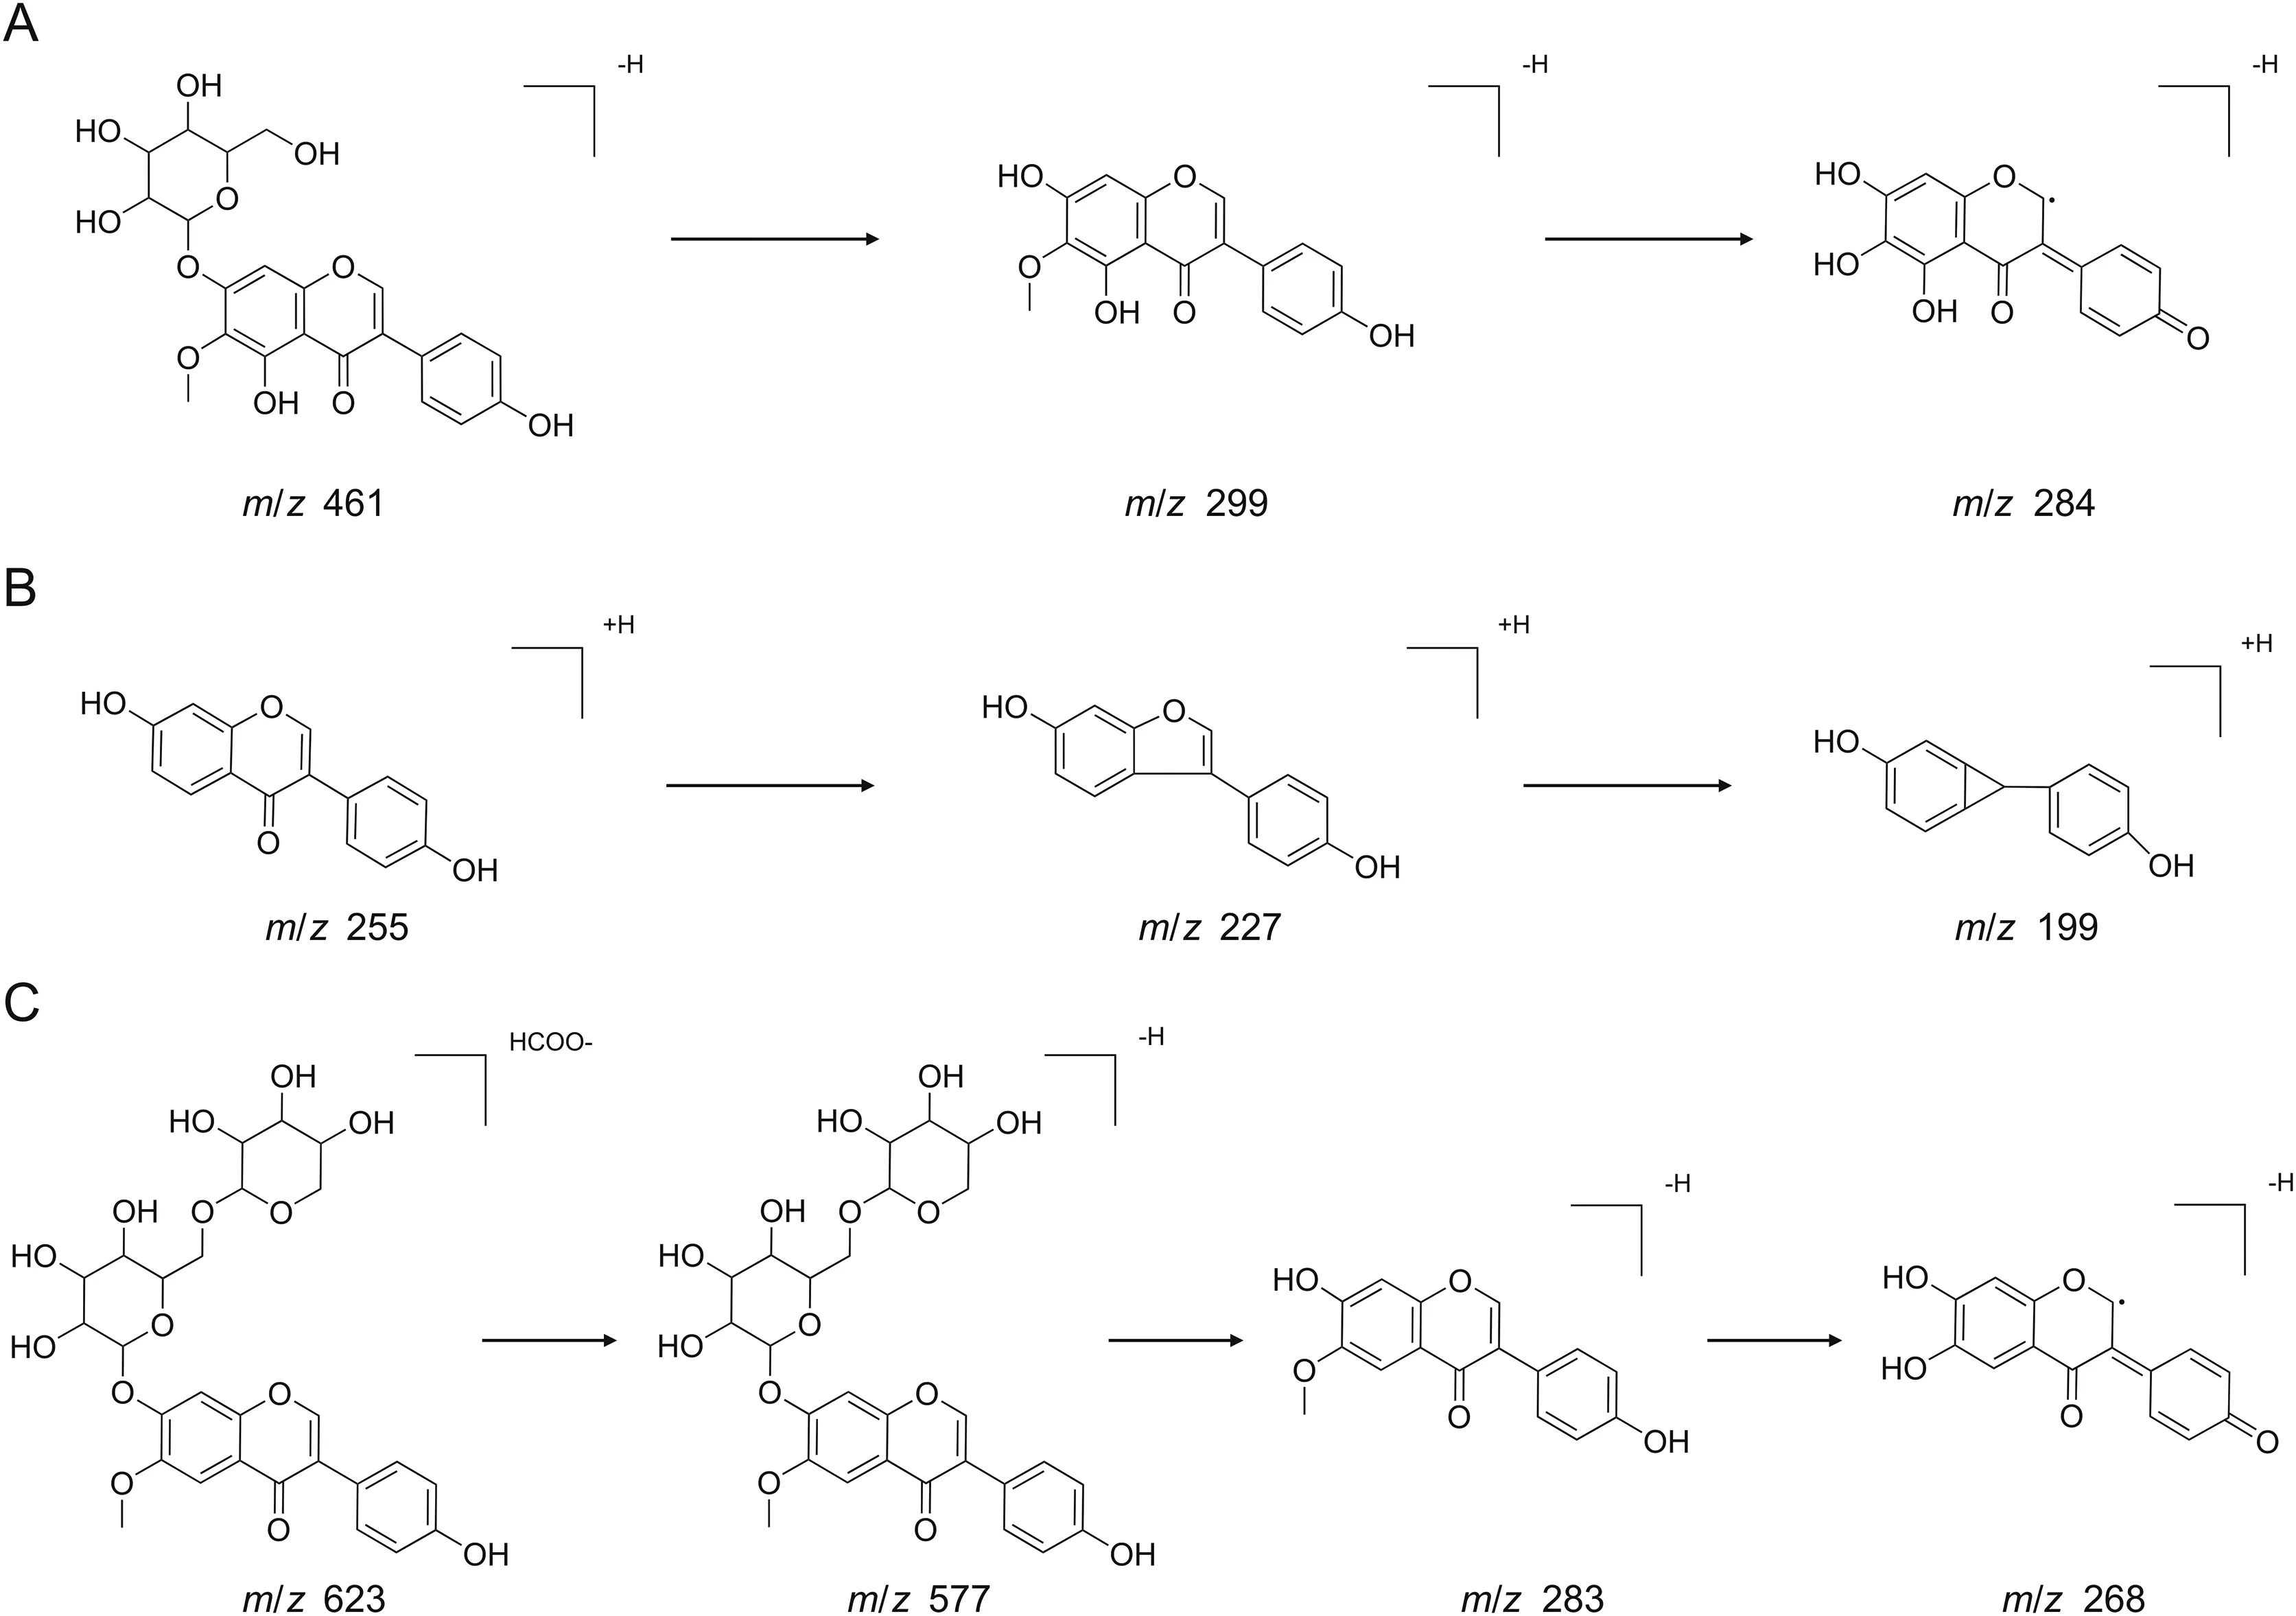
Fig.4.The proposed fragmentation pathways of characteristic compounds.(A)Tectoridin in negative-ion mode.(B)Daidzein in positive-ion mode.(C)6''-O-xylosyl-glycitin in negative ion mode.
3.5.Method validation for quantitative analysis
Prior to application to simultaneous determination of six components,full validation of this method was carried out.The results of linear regression,LOQs,and LODs for six compounds in FP are listed in Table 3,which shows a good linearity(r>0.999)over a certain concentration range for each reference standard.Instrument precision was determined by six successive injections of the same mixed standard solution within one day.The relative standard deviation(RSD)values of peak areas of the six reference standards were less than 2.0%,suggesting that the instrument was in good condition.To confirm the repeatability,six samples were prepared in parallel from the batch of Hunan I and the RSD values of contents of the six analytes were within 1.2%.It showed that the results of the developed method had good repeatability.The stability test revealed that the sample solution was stably maintained for 24 h at room temperature.Moreover,the recovery was measured by the standard addition method,the average recoveries of analytes were in the range from 98.8% to 103.7% and the RSD values were all less than 1.8%.Additionally,LOQs and LODs were also acceptable for simultaneous determination of six components(Table 3),indicating that the developed HPLC method was satisfactory for quantitative analysis.The typical HPLC chromatograms of six components and mixed standards are shown in Fig.6.
3.6.Quantitative analysis of six components in FP
Subsequently,to better assess the quality of FP from the perspective of quantitative analysis,the content of the six chemical components including glycitin,genistin,tectoridin,glycitein,genistein and tectorigenin was simultaneously determined by HPLC method.As displayed in Table 4 and Fig.S1,the contents of glycitin,genistin,tectoridin,glycitein,genistein,and tectorigenin in 13 batches of FP varied from 0.4438 to 11.06 mg/g,0.955 to 1.726 mg/g,9.81 to 57.22 mg/g,3.349 to 41.60 mg/g,0.3576 to 0.989 mg/g,and 2.126 to 9.990 mg/g,respectively.For example,the content of tectoridin in FP from Guangxi III(S6),was 9.81 mg/g,while it was 57.22 mg/g in FP from Hunan III(S11).Obviously,this variation might be caused by different conditions,such as climate,sunlight condition,cultural manner and harvest time.On the other hand,the content of tectorigenin from Hunan II(S10),Hebei(S8),Guangdong I(2),Hunan IV(S12),Hunan I(S9),and Guangxi II(S5)was higher than that of the other 6 batches.It indicated that FP from these origins had similar quality,which was consistent with the results of HCA,PCA and OPLS-DA.Undoubtedly,these results indicated that the method was satisfactory for simultaneous determination of six chemical components in FP so as to control its quality.
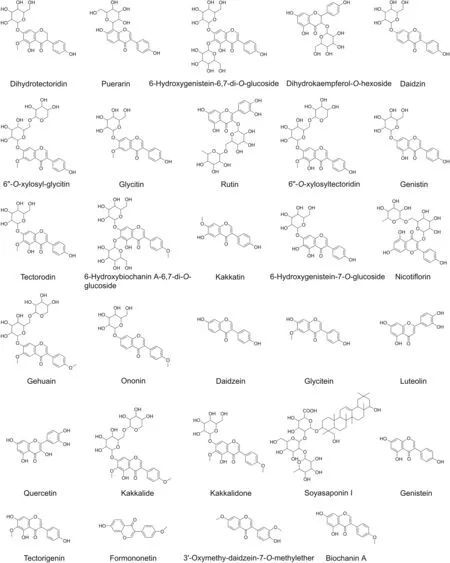
Fig.5.Chemical structures of identified compounds in Flos Puerariae.
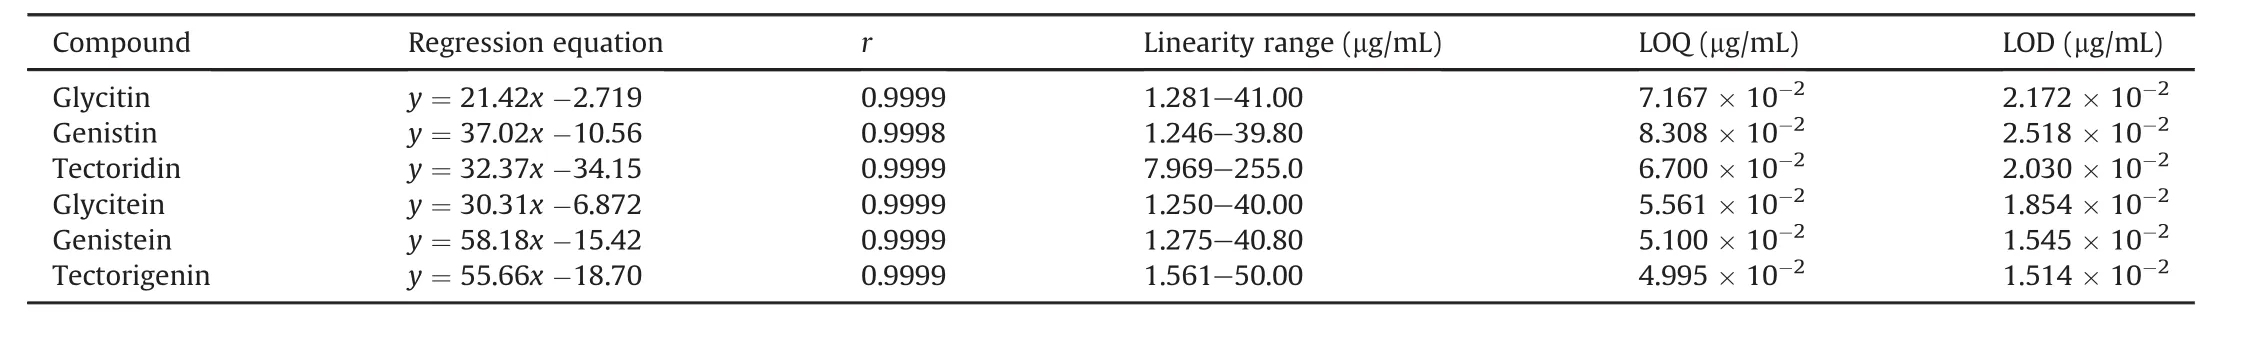
Table 3Results of linear regression,LOQs and LODs for six compounds in Flos Puerariae.
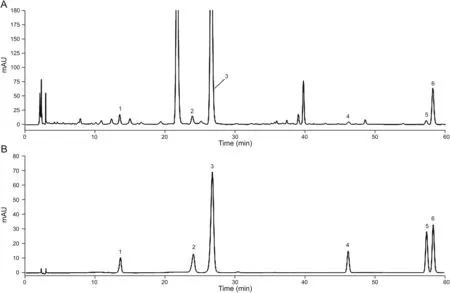
Fig.6.The typical HPLC chromatograms of content determination.(A)Six components.(B)Mixed standards.
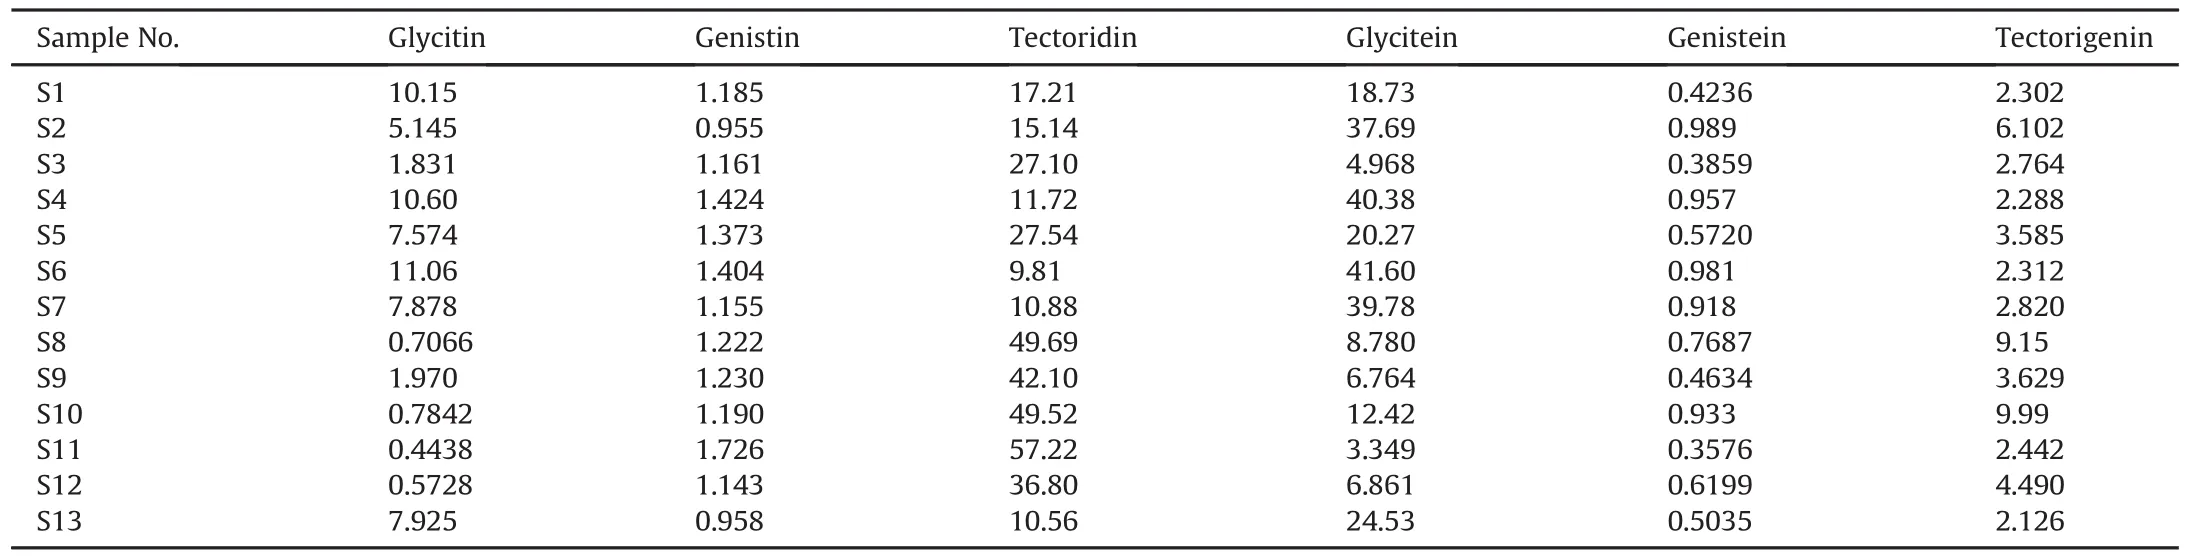
Table 4Contents(mg/g)of 6 compounds in Flos Puerariae from different origins.
4.Conclusions
In the present study,the qualitative and quantitative evaluation of FP was performed.The identification of characteristic compounds in FP,quality assessment of herbal medicines,and discovery of the qualitative markers were carried out by HPLC-fingerprint,HPLC-FT-ICR MS,and chemometric methods.Meanwhile,the content of six chemical components in FP was simultaneously determined.As a result,31 common peaks were assigned in the HPLC-fingerprint and 6 peaks of them were screened and considered as qualitative markers.Moreover,35 characteristic peaks were detected by HPLC-FT-ICR MS and 16 peaks of them were unambiguously identified.The contents of glycitin,genistin,tectoridin,glycitein,genistein and tectorigeninin 13 batch samples were simultaneously determined,which provided quantitative information for its quality control.In conclusion,the approaches established in this study are comprehensive and effective for quality evaluation of FP.It will be valuable for further investigation and quality control of other TCMs in future.
CRediT author statement
Jing Han and Ke Xu:Writing-Original draft preparation,Conceptualization;Quanxiang Yan,Wenwen Sui,and Haotian Zhang:Methodology,Validation;Sijie Wang,Zan Zhang and Ziyun Wei:Data curation;Fei Han:Supervision,Project administration.
Declaration of competing interest
The authors declare that there are no conflicts of interest.
Acknowledgments
This work was supported by Liaoning Province Natural Science Foundation(Grant No.:2021-MS-220).
Appendix A.Supplementary data
Supplementary data to this article can be found online at https://doi.org/10.1016/j.jpha.2021.09.003.
 Journal of Pharmaceutical Analysis2022年3期
- Journal of Pharmaceutical Analysis的其它文章
- Recent advances in quantum dots-based biosensors for antibiotics detection
- Multiple rapid-responsive probes for hypochlorite detection based on dioxetane luminophore derivatives
- Nitrogen-doped carbon@TiO2double-shelled hollow spheres as an electrochemical sensor for simultaneous determination of dopamine and paracetamol in human serum and saliva
- Compatibility and stability studies involving polymers used in fused deposition modeling 3D printing of medicines
- A preparation strategy for protein-oriented immobilized silica magnetic beads with Spy chemistry for ligand fishing
- Physicochemical degradation of phycocyanin and means to improve its stability:A short review