
The Predictability of Ocean Environments that Contributed to the 2020/21 Extreme Cold Events in China: 2020/21 La Ni?a and 2020 Arctic Sea Ice Loss※
2022-04-06 08:38:54FeiZHENGJiPingLIUXiangHuiFANGMiRongSONGChaoYuanYANG
Advances in Atmospheric Sciences 2022年4期
Fei ZHENG, Ji-Ping LIU, Xiang-Hui FANG, Mi-Rong SONG, Chao-Yuan YANG,
Yuan YUAN7, Ke-Xin LI1,8, Ji WANG9, and Jiang ZHU1,8
1International Center for Climate and Environment Science (ICCES), Institute of Atmospheric Physics,Chinese Academy of Sciences, Beijing 100029, China
2Collaborative Innovation Center on Forecast and Evaluation of Meteorological Disasters,Nanjing University of Information Science & Technology, Nanjing 210044, China
3Department of Atmospheric and Environmental Sciences University at Albany,State University of New York, Albany, NY 12222, USA
4Department of Atmospheric and Oceanic Sciences & Institute of Atmospheric Sciences,Fudan University, Shanghai 200438, China
5State Key Laboratory of Numerical Modeling for Atmospheric Sciences and Geophysical Fluid Dynamics (LASG),Institute of Atmospheric Physics, Chinese Academy of Sciences, Beijing 100029, China
6School of Atmospheric Sciences, Sun Yat-sen University, Zhuhai 519082, China
7National Climate Center, Beijing 100081, China
8University of Chinese Academy of Sciences, Beijing 100049, China
9Beijing Municipal Climate Center, Beijing 100089, China
ABSTRACT Several consecutive extreme cold events impacted China during the first half of winter 2020/21, breaking the lowtemperature records in many cities. How to make accurate climate predictions of extreme cold events is still an urgent issue.The synergistic effect of the warm Arctic and cold tropical Pacific has been demonstrated to intensify the intrusions of cold air from polar regions into middle-high latitudes, further influencing the cold conditions in China. However, climate models failed to predict these two ocean environments at expected lead times. Most seasonal climate forecasts only predicted the 2020/21 La Ni?a after the signal had already become apparent and significantly underestimated the observed Arctic sea ice loss in autumn 2020 with a 1-2 month advancement. In this work, the corresponding physical factors that may help improve the accuracy of seasonal climate predictions are further explored. For the 2020/21 La Ni?a prediction, through sensitivity experiments involving different atmospheric-oceanic initial conditions, the predominant southeasterly wind anomalies over the equatorial Pacific in spring of 2020 are diagnosed to play an irreplaceable role in triggering this cold event. A reasonable inclusion of atmospheric surface winds into the initialization will help the model predict La Ni?a development from the early spring of 2020. For predicting the Arctic sea ice loss in autumn 2020, an anomalously cyclonic circulation from the central Arctic Ocean predicted by the model, which swept abnormally hot air over Siberia into the Arctic Ocean, is recognized as an important contributor to successfully predicting the minimum Arctic sea ice extent.
Key words: extreme cold event, predictability, La Ni?a, Arctic sea ice loss
1. Introduction
During the first half of winter 2020/21, mainly from 1 December 2020 to 10 January 2021, China experienced three national strong cold air events, with two extreme cold events invading from the northern to the southern regions.During this period, three national strong cold air processes impacted China on 13-15 December 2020, 29 December 2020 to 1 January 2021, and 6-8 January 2021, respectively. Since 1 December 2020, the lowest temperatures in 58 cities, including Shanghai and Beijing, either broke or set records. On average, temperatures were at least one to two degrees Celsius below normal across the country, with some areas reporting temperatures as much as four degrees Celsius below the climatology. Zheng et al. (2021) illustrated that the middle-high-latitude large-scale atmospheric circulation anomalies in the Northern Hemisphere, which were forced by the negative phase of the Arctic Oscillation,strengthened the Siberian High, intensified the Ural High,and deepened the East Asian Trough, which are considered the direct reasons for the frequent extreme cold events in winter 2020/21.
Matsumura and Kosaka (2019) detected the joint impact of tropical variability and Arctic sea ice change on the Eurasian climate and indicated that recent cooling in the tropical Pacific and loss of Arctic sea ice have combined to cause frequent cold winters in Eurasia. Moreover, the synergistic effect of the warm Arctic with sea ice loss mostly induced by global warming and the cold tropical Pacific caused by the La Ni?a event, can be regarded as a necessary background for intensifying the intrusions of cold air from polar regions into middle-high latitudes (Kim et al.,2014, 2017; Matsumura and Kosaka, 2019; Sung et al.,2019; Zheng et al., 2021). At a planetary scale, the combination of warm temperature anomalies in the Arctic region and cold temperature anomalies in the tropical ocean largely reduced the Equator-Arctic temperature gradient and further provided for a favorable background state for the cold conditions observed in China (Li et al., 2019; Zheng et al.,2021). This process intensified the meridional height gradient over the middle-high latitudes in winter, leading to a stronger ridge over the Ural region, an enhanced East Asian Trough over Japan, and a more northward subtropical westerly jet over East Asia (e.g., Yang et al., 2002; Wang and Chen, 2010; Ha et al., 2012; Chen et al., 2013; Zuo et al.,2015; Li, 2016). This pattern favors a cold winter for most parts of East Asia, with snow and ice events expected during the La Ni?a mature Phase (e.g., Ding et al., 2008; Gao,2009; Wu et al., 2011; Yuan et al., 2014). However, the predictability of these two ocean environments (i.e., 2020/21 La Ni?a and 2020 Arctic Sea Ice Loss) that contributed to the 2020/21 extreme cold events in China still needs to be further validated.
For ENSO’s predictability, as shown in many previous works, a number of analyses based on numerical model predictions have indicated that decadal variations exist in ENSO predictability (e.g., Chen and Cane, 2008; Jin et al.,2008; Barnston et al., 2012; Zheng et al., 2016). By investigating the ENSO prediction skill of 20 state-of-the-art models,it was concluded that the forecasting reliability in the last two decades was comparatively lower than in the 1980s and 1990s (Barnston et al., 2012). The emergence of ENSO diversity (e.g., the two types of El Ni?o) and the so-called spring predictability barrier (SPB) also bring challenges to ENSO predictions (Webster and Yang 1992; McPhaden 2003; Zheng and Zhu 2010; Masuda et al., 2015; Zheng and Yu, 2017; Fang et al., 2019; Fang and Xie, 2020). Recent studies also indicate that there is still a debate on whether La Ni?a events are more predictable than El Ni?o events(Planton et al., 2018; Larson and Kirtman, 2019; Larson and Pegion, 2020). For the case of the 2020/21 La Ni?a event,most climate forecasts from the operational centers failed to predict this cold event before June 2020 (IRI website at http://iri.columbia.edu), indicating that the limited prediction skill for this event should be further explored in order to identify the important processes influencing the 2020/21 La Ni?a prediction.
For Arctic sea ice and related ocean environments, Jung et al. (2020) assessed the Arctic temperature forecast skill of 19 different seasonal forecast models and indicated that better predictions of Arctic conditions not only impact forecasts in the region but also improve winter climate forecasts over the midlatitudes through the improvement of capturing the Arctic-midlatitude teleconnection. On 15 September 2020, the Arctic sea ice extent reached its second lowest record of 3.74 × 10⁶km2, slightly larger than the lowest record of 3.41 × 10⁶km2in 2012 (Fetterer et al., 2017). Dramatic sea ice loss has drawn increasing attention due to its evolution and impacts on weather and climate. An early observational study argued that Arctic amplification contributes to more extreme weather in all seasons (Francis and Vavrus,2012). Liu et al. (2012) investigated the influence of diminishing Arctic autumn sea ice on the northern continents and revealed that autumn Arctic sea ice loss initiated much broader meridional meanders in the midlatitudes, resulting in increased blockings and frequent cold surges in winter.Mori et al. (2014) shared results that also support the common theory that Arctic sea ice loss in past decades has led to more blockings, which favors the invasion of cold air into Eurasia and has resulted in frequent Eurasian cold winters.Even more studies have suggested that frequent Eurasian cold extremes are associated with Arctic sea ice loss in recent years (Tang et al., 2013; Kug et al., 2015), and the timing of the sudden Arctic autumn sea ice decline that occurred in the late 1990s coincided with the onset of Eurasian winter cooling (Kim and Son, 2020). Moreover, a lack of Arctic sea ice in September is conducive to a stronger Siberian high in the following winter. Less sea ice in September means more open water and enhanced sea-air interaction, and the accumulated heat and vapor fluxes during this period will affect the Arctic atmospheric conditions in winter and thus influence the atmospheric situation over China through an intensified Siberian High in winter (Wu and Wang, 2002; Wu et al., 2011). Thus, the significantly lower Arctic sea ice extent in September 2020 also provided an important causative factor for the stronger Siberian High in winter 2020/21 (Zheng et al., 2021).
This work focuses on the predictability of ocean environments that contributed to the occurrence of the 2020/21 extreme cold events in China, 2020/21 La Ni?a, and 2020 Arctic sea ice loss, and the possible dominant factors or mechanisms influencing the predictions of these ocean environments are explored. In this paper, section 2 briefly describes the models, diagnostic methods, and datasets. Section 3 summarizes the performance of the climate models in predicting the 2020/21 La Ni?a event and examines the corresponding factors in the spring season that could improve the accuracy of prediction. Section 4 presents the utility of the 2020 Arctic September sea ice prediction by dynamic models and explores the major atmospheric circulation patterns affecting the skill of sea ice prediction. Finally, section 5 presents our discussion and conclusions.
2. Models, methods, and datasets
2.1. Models
In this study, we adopted the ensemble prediction system (EPS) developed at the Institute of Atmospheric Physics (IAP), Chinese Academy of Sciences (Zheng et al.,2006, 2007, 2009; Zheng and Zhu, 2010, 2016), and evaluated its performance in predicting the moderate 2020/21 La Ni?a event (please refer to the online supplementary file for details). The skill of this ENSO prediction system is documented in Zheng and Zhu (2016) and Zheng and Yu (2017),in which a 20-year retrospective forecast comparison shows that good forecast skill of the EPS with a prediction lead time of up to one year is possible. Moreover, according to the coupled data assimilation system developed by Zheng and Zhu (2010), a unique opportunity exists to isolate the roles of the initial atmospheric and oceanic states on the 2020/21 La Ni?a predictions by providing different initial conditions from the assimilation schemes (i.e., “Assim_Ocean”,“Assim_Atmos”, and “Assim_Couple” schemes).
As mentioned before, the Arctic sea ice extent shrank in 2020 to the second record low since the satellite record began in the late 1970s. In this study, a recently developed coupled atmosphere-sea ice-ocean modeling system (see electronic supplementary materials, ESM) configured for the pan-Arctic (Yang et al., 2020), is used to assess and understand the prediction skill of the seasonal minimum ice extent in 2020.A localized error subspace transform ensemble Kalman filter (LESTKF) is used in this modeling system to assimilate satellite-based real-time sea ice concentration and thickness to generate skillful initial model conditions (Chen et al., 2017; Yang et al., 2020). The predictive capability of this modeling system is documented in Yang et al. (2020), in which the system shows great potential for predicting Arctic sea ice conditions during the melting seasons of 2017 and 2018 with improved initial sea ice conditions.
2.2. Methods
As discovered by Fang and Zheng (2021), effectively utilizing spring information can largely enable the capture of the mature phase of ENSO. Specifically, four physically oriented variables were selected to study the relationship between the early spring (i.e., March) and winter mean Ni?o-3.4 (5°S-5°N, 170°-120°W) indices. The four variables are the equatorial mean thermocline depth (TCD) anomalies (TCDa_M; 2°S-2°N 120°E-80°W), the zonal gradient of the TCD anomalies in the equatorial Pacific (TCDa_G;the difference between the mean in the regions (2°S-2°N,160°W-80°W) and (2°S-2°N, 120°E-160°W), the mean zonal wind stress anomalies over the western Pacific(Tauxa_W; 120°E-160°W, 2°S-2°N), and the mean meridional wind stress anomalies over the eastern equatorial Pacific (Tauya_E; 2°S-2°N, 120°W-80°W). By building a quaternary linear regression equation spanning 1980-2018,it is found that the correlation coefficient between the reconstructed and observed winter mean Ni?o-3.4 indices is nearly 0.9. This not only confirms the tight relationship between the boreal spring air-sea coupled system and the following ENSO evolution but also indicates that the selected four physically oriented variables are reasonable. Thus, by utilizing March information, constructing a regressionbased statistical ENSO prediction model from April (i.e., 1 month lead) to March (i.e., 12 months lead) is a promising way to forecast ENSO from early spring in each year. Further diagnosis of the contributions of the four variables can help us to better understand the hidden mechanisms. In this study, the quaternary linear regression model is constructed to predict ENSO events from March and is defined as follows:
One day the Prince went out hunting, and going in pursuit of a wild boar he soon lost the other huntsmen, and found himself quite alone in the middle of a dark wood

where Ninop,Tis the Ni?o index at the targeted month (i.e.,from April to next March) and TCDa_Mo,Mar,Tauxa_Wo,Mar, TCDa_Go,Mar, and Tauya_Eo,Marare the TCDa_M, Tauxa_W, TCDa_G, and Tauya_E indices in March, respectively. a, b, c, d, and e are the regression coefficients. As a result, this equation can reflect both the sign and magnitude of ENSO in the predicted period.
2.3. Datasets
The datasets used for the coupled data assimilation in this study include the monthly extended global SST(ERSST v5) data reconstructed by Huang et al. (2017) with a 2° horizontal resolution, the monthly averaged altimeter data produced by Ssalto/Duacs and distributed by Aviso,with support from Cnes (http://www.aviso.oceanobs.com/duacs/), and the wind stress data from the NCEP2 reanalysis (Kanamitsu et al., 2002). The available atmospheric and oceanic data (i.e., atmospheric wind stress, SST, and altimetry data) were assimilated into the ENSO EPS once per month through coupled data assimilation (Zheng and Zhu,2010), and they were also used to validate the model predictions and initial conditions.
The satellite-derived Arctic sea ice concentration and thickness are assimilated into the coupled atmosphere-sea ice-ocean modeling system to generate an improved estimation of initial sea ice states. The daily sea ice concentration archived by the National Snow and Ice Data Center is used here. It is derived from the Special Sensor Microwave Imager/Sounder (SSMIS) using the NASA Team algorithm(Maslanik and Stroeve, 1999) with a spatial resolution of 25 km. The sea ice thickness products are obtained from two sources. One is the daily ice thickness derived from the Soil Moisture and Ocean Salinity (SMOS), and the other is the monthly ice thickness derived from the ESA’s CryoSat-2 satellite. Following Yang et al. (2020), these two types of ice thickness data are merged, and the sea ice thickness in CryoSat-2 data is replaced by SMOS data when it is less than 1 m.
To estimate the impacts of the four physically oriented variables on ENSO prediction, monthly ocean temperature data from the National Centers for Environmental Prediction Global Ocean Data Assimilation System (GODAS;Behringer and Xue, 2004) are used. The TCD along the equatorial Pacific is approximated from the potential temperature as the depth of the 20°C isotherm. The GODAS dataset is available at a horizontal resolution of 1/3o× 1/3onear the tropics and has 40 vertical levels with 10-m resolution near the surface.
3. Occurrence and prediction of the 2020/21 La Ni?a event
In this section, the development of the 2020/21 La Ni?a event is analyzed, and the performance of the climate models in predicting this moderate La Ni?a event is described in detail. The corresponding spring season factors that can be useful in improving the accuracy of the prediction of the 2020/21 La Ni?a event are also explored and examined.
3.1. Onset and development of the 2020/21 La Ni?a event
The 2020/21 La Ni?a event started in August 2020 (i.e.,the negative Ni?o-3.4 index exceeded -0.5°C), continued to gain strength in autumn (i.e., September-October-November, SON 2020), approached its peak (i.e., Ni?o-3.4 index lower than -1.0°C) in October 2020, maintained its moderate cold state during the winter of 2020/21, and decayed to a neutral state in spring 2021. The atmospheric and oceanic processes responsible for the onset and development of the 2020/21 La Ni?a event are utilized to illustrate their coherent relationships in Zheng et al. (2021). There was a burst of easterly wind coming out over the central to eastern equatorial Pacific with the associated southerly wind anomalies from January to April in 2020. The predominance of anomalous southeasterly winds over the central equatorial region essentially prevented the enhancement of the observed westerly winds over the warm pool, which played a crucial role in initiating oceanic upwelling Kelvin waves and then forced the accumulated subsurface cold water in the western Pacific warm pool to propagate eastward along the thermocline. Eventually, as triggered by the enhanced easterly trade wind over most of the equatorial Pacific, the accumulated cold water in the eastern Pacific became greater and made the SSTs colder across the eastern to central equatorial Pacific. The weak La Ni?a condition gradually developed to moderate intensity during autumn 2020 and reached its peak in October 2020. As a major, naturally occurring driver of the Earth’s climate system, the 2020/21 moderate La Ni?a event affects temperature, precipitation, and storm patterns in many parts of the world.
3.2. Performance of coupled models in predicting the 2020/21 La Ni?a event
For the 2020/21 La Ni?a event, most seasonal climate forecasts from operational centers only predicted the event after the cooling had already become apparent and basinwide (IRI website at http://iri.columbia.edu). In this study,we investigated the possible improvements in predicting this cold event that could be achieved by focusing on the role of the air-sea coupled initial states, including the atmospheric and oceanic initial conditions based on the coupled data assimilation system developed by Zheng and Zhu(2010). And the roles the initial atmospheric and oceanic states played on the 2020/21 La Ni?a predictions were examined in three sets of retrospective forecast experiments(Table 1). In the first set, only the oceanic data (i.e., SST and sea level) were assimilated to provide the initial conditions (i.e., “Assim_Ocean” scheme). In the second set, only the atmospheric data (i.e., wind stress) were assimilated to provide the updated information in the coupled model (i.e.,“Assim_Atmos” scheme). In the third set, the atmospheric and oceanic data were both assimilated into the coupled model to update all model variables (i.e., “Assim_Couple”scheme). The forecast differences in the three sets of retrospective experiments with initializations by the three separate data assimilation schemes were then examined to isolate the effects of the various initial states on predicting this cold event.
We initialized the coupled forecasts of the 2020/21 La Ni?a event on 1 March 2020, and the initial conditions of anomalous SST, wind stress, and sea level (SL) from the“Assim_Ocean”, “Assim_Atmos”, and “Assim_Couple” analysis results are compared with the observations in the top and middle rows in Fig. 1. For both the amplitude and the spatial pattern of observed oceanic states (i.e., SST and SL anomalies), the central to eastern equatorial Pacific is still mostly occupied by warm water from the surface to the subsurface in February 2020. The “Assim_Ocean” scheme has a more accurate analysis result of initial ocean states than the other two schemes but produces a false stronger westerly wind analysis over the central Pacific (as seen when compared to the observations). For the observed atmospheric field over the equatorial Pacific in February 2020, the evident anomalous southeasterly winds obviously covered the eastern basin to initiate this cold event, preventing the development of westerly winds over the warm pool. The “Assim_Atmos ”scheme has a much more similar assimilation result to the observed atmospheric states than the “Assim_Ocean ”scheme, particularly with stronger southeasterly winds to capture more reasonable initial atmospheric states. The initial surface-subsurface warm water in the central-eastern basin updated by the “Assim_Atmos” scheme is quite weak com-pared to the observations associated with cold water over the eastern equatorial Pacific from surface to subsurface layers. The observed inconsistency between the surface-subsurface warm water in the central-eastern basin and the southeasterly wind stress anomalies over the eastern equatorial Pacific also indicates that the air-sea system was not well coupled over the tropical Pacific in early 2020. Moreover,the “Assim_Couple” scheme provides an initial condition for the coupled model as a combinative result from the“Assim_Ocean” and “Assim_Atmos” schemes, with similar atmospheric and oceanic initial conditions to the observations, respectively. It should be stressed that our experiments start from March (i.e., the early spring observational information is used as the predictor), which does not help with investigation of the SPB issue (i.e., the prediction striding over the boreal spring). However, further research could investigate the causality of the four spring variables, which might be useful for studying the real SPB problem.
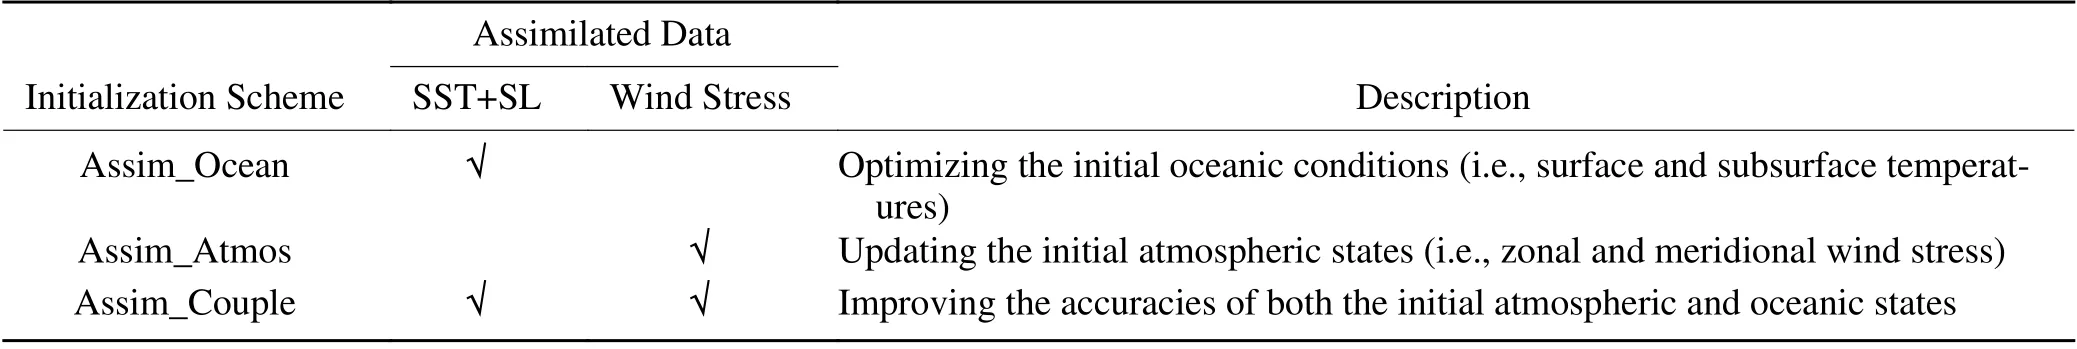
Table 1. Summary of the initialization scheme design.

Fig. 1. Initial conditions of anomalous SST (shaded) and wind stress (vector; top row), SL (shaded; middle row), and forecasted SST anomalies (bottom row) from the (a) observations, (b) “Assim_Ocean” results, (c) “Assim_Atmos” results,and (d) “Assim_Couple” results. The initial fields are from February 2020, and the 12-month forecasts started in March 2020.
After initialization, the 12-month SST hindcasts are also compared with the observations shown in Fig. 1, and the three hindcasts show quite different evolutions during the entire 12 months of the forecast. The “Assim_Atmos”hindcast exhibits a more realistic evolution during the developing stage of this La Ni?a, although the predicted cold event is weaker than the observation. The hindcast initialized from the “Assim_Ocean” analysis predicts a false development of warming during the following 12 months, with the initial air-sea condition of surface-subsurface warm water in the central-eastern basin and false westerly wind stress around the dateline. However, the model predicts a neutral event in 2020 triggered by the initial air-sea conditions from the “Assim_Couple” scheme, further indicating that the tropical ENSO system is quite unstable in early 2020,and the inconsistent atmospheric and oceanic states over the tropical Pacific are not dynamically coupled at that time. At the same time, the atmospheric initial condition might be more effective than the oceanic condition for predicting the 2020/21 La Ni?a.
As a result, the inclusion of more reasonable and accurate initial conditions provided by only assimilating the atmospheric data during the 2020/21 La Ni?a forecasting process was able to lead to better predictions. Figure 2 compares the ensemble-mean forecasts of the Ni?o-3.4 index initiated from the three assimilation schemes for the 2020/21 La Ni?a episode before a lead time of six months or longer.The ensemble-mean forecasts of the “Assim_Atmos” experiment could successfully predict the onset, development, and decay of the 2020/21 La Ni?a event at all times prior to the event, although there were still some small errors in the forecasted onset and magnitude of the 2020/21 La Ni?a event when predicting nine months ahead. The ensemble-mean forecasts of the “Assim_Ocean” experiment diverge greatly from the actual observations even six months later.However, when considering the “Assim_Couple” initialization scheme, it can push the forecasts closer to the forecasts initialized by the “Assim_Atmos” scheme from those initialized by the “Assim_Ocean” scheme. The comparison results indicate that the SPB is still a major issue that degrades the prediction skill of the 2020/21 La Ni?a event. But the forecasts initialized with coupled data assimilation after June 2020 (i.e., the forecasts started after the spring season) were able to predict the event’s trends of development and decay with some departures from the observations, when the atmosphere is well coupled with the ocean after the spring season over the tropical Pacific. The hindcasts for the most recent 2020/21 La Ni?a event performed with different initialization schemes indicate that the initial atmospheric states(i.e., the predominant southeasterly wind anomalies with an enhanced Walker circulation in the tropical Pacific) in early 2020 should be the key factors for enabling the successful prediction of the La Ni?a event. Understanding the influence of these factors is especially important given the unstable tropical ENSO system during the spring season when the ocean-atmosphere coupling is weakest over the equatorial Pacific (e.g., Webster, 1995; Fang et al., 2019).

Fig. 2. Comparisons of the hindcast results for the 2020/21 La Ni?a event. The thick black curves are the observed Ni?o-3.4 SST anomalies, and the thin curves of gray, red, and blue are the predictions initialized by the “Assim_Ocean”, “Assim_Atmos”, and “Assim_Couple” assimilation results and started from January,March, May, and July 2020, respectively.
3.3. Key factors in the spring season for improving the prediction of the 2020/21 La Ni?a event
As introduced in section 2, the reliable seasonal phase locking of ENSO and the good relationship between the March information and the winter mean Ni?o-3.4 index suggest that investigating the contributions of the four physically oriented variables to ENSO evolution is a promising way to identify the key processes for improving the prediction of the 2020/21 La Ni?a event. To validate this inference, a regression-based statistical ENSO prediction model,which uses March information as predictors, is first constructed to predict the Ni?o-3.4 indices from April to March. The training period is 1980-2018, and Fang and Zheng (2021)has provided the information regarding the relative contributions of the four predictors to the prediction skill in the training period. Then, a series of sensitivity analyses can be conducted to investigate the key factors by substituting the March information from its neighboring months. To clarify this purpose, Fig. 3a shows the normalized amplitudes of the four variables from January to May 2020. Quantitatively, TCDa_M exhibits a consistent amplifying trend with a negative signal (i.e., anomalously shallow compared with the normal state). This could provide a basic expectation of the La Ni?a event based on the recharge oscillator theory(Jin, 1997). However, the other important variable of the classic ENSO theory (i.e., Tauxa_W) shows a varying feature;it is anomalous westerlies that usually trigger El Ni?o events by stimulating downwelling oceanic Kelvin waves during January and February, which then change to anomalous easterlies that are beneficial to the following La Ni?a event.TCDa_G, which mainly reflects the persistence of the Ni?o-3.4 index, also shows a phase transformation between March and April, indicating a change from a positive to a negative SST anomaly state over the equatorial eastern Pacific.Lastly, Tauya_E, as the main attenuating factor used to depict the meridional processes in the eastern Pacific region, also shows some variation, but with a consistent anomalous southerly component, providing a favorable pattern for the following La Ni?a event.
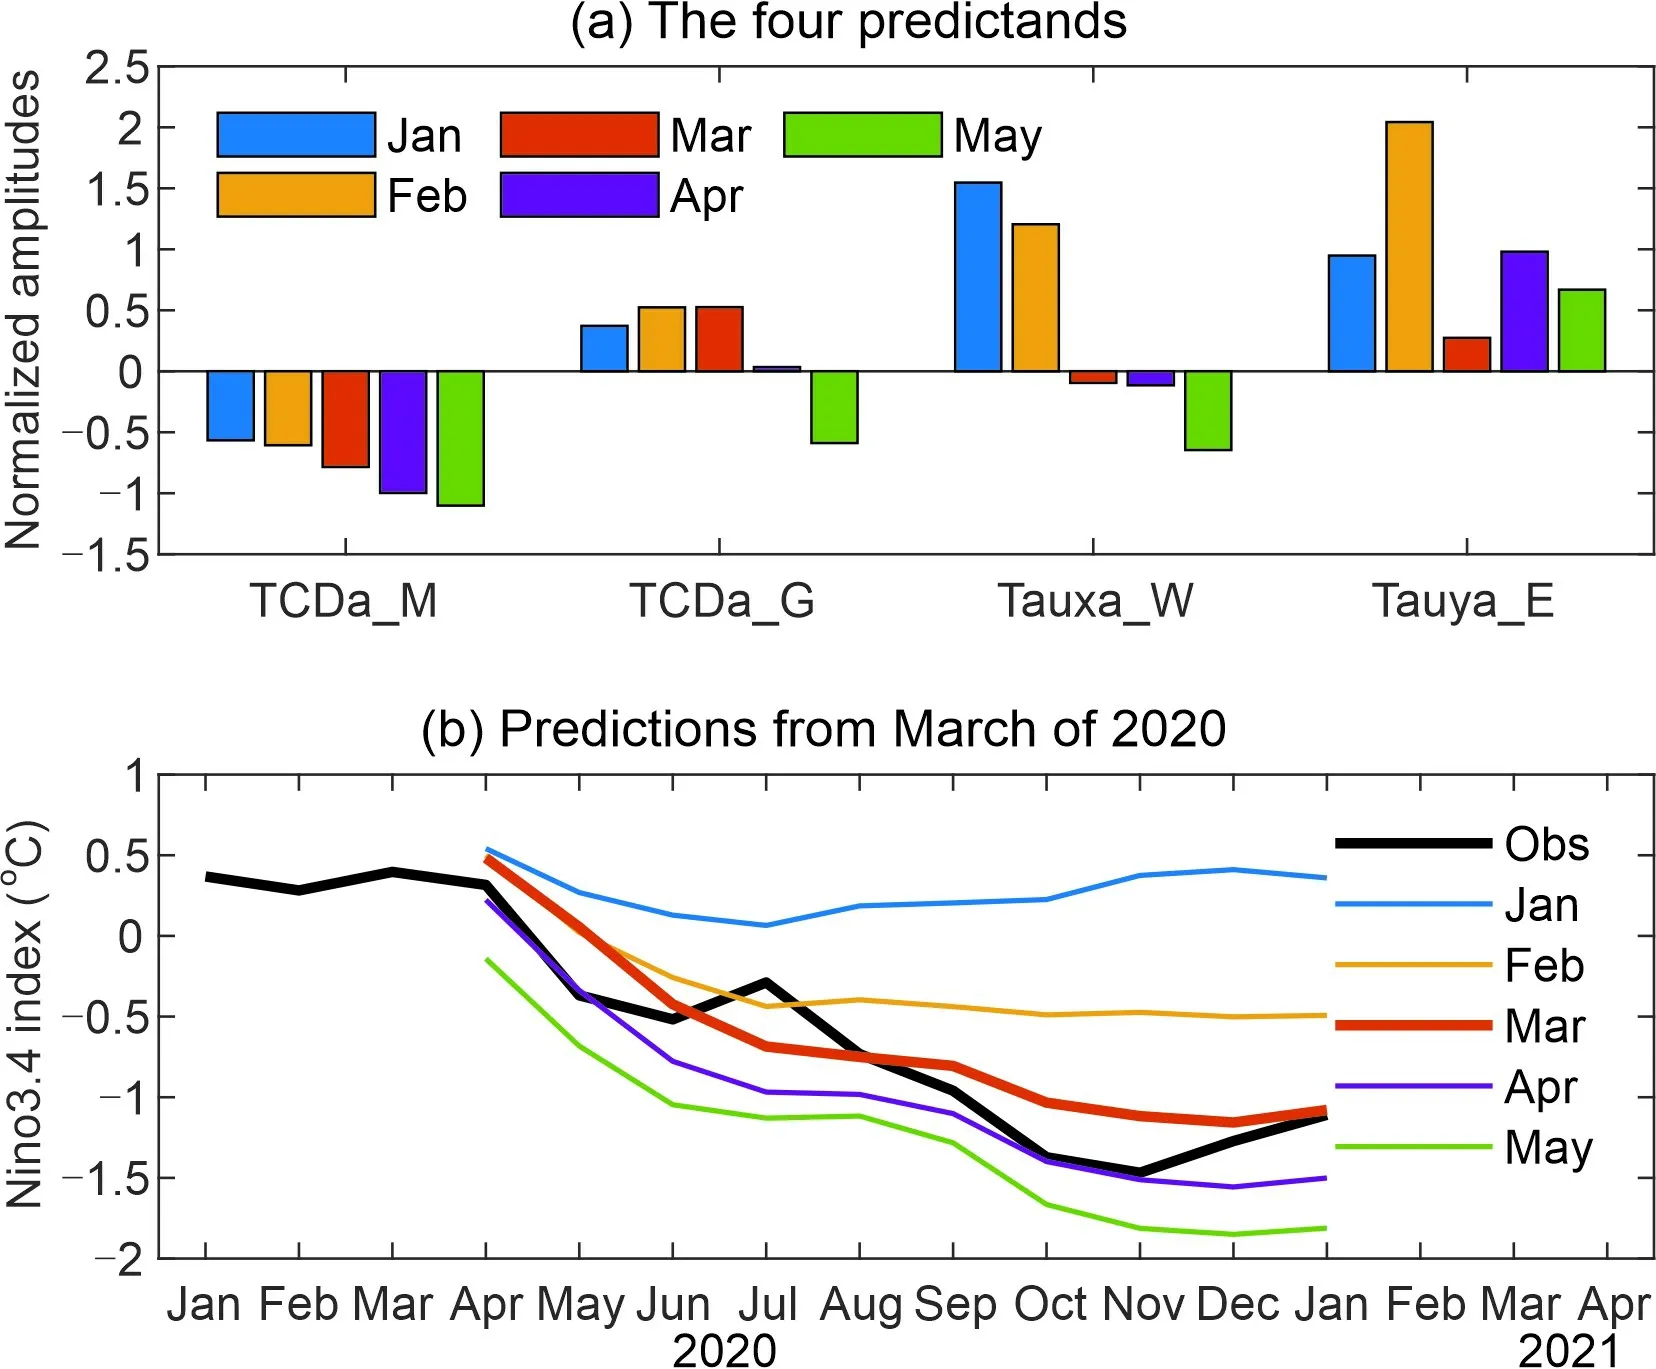
Fig. 3. (a) Normalized magnitudes of the TCDa_M, TCDa_G, Tauxa_W, and Tauya_E indices for January(blue), February (yellow), March (brown), April (purple), and May (green). (b) The predictions conducted by the variables in the months from January to May 2020 but with the March-based statistical model maintained.The colors of the predictions (panel b) are consistent with those in panel a. The observational Ni?o-3.4 indices from January 2020 to January 2021 are also illustrated by black solid lines.
To validate the above inferences, Fig. 3b shows the predictions enacted by the four variables in each month but with the March-based prediction model maintained. It can be seen that the prediction using the March and April information, i.e., the standard prediction (brown curve), grasps the development of this La Ni?a event quite well, further confirming the efficiency of the four variables. Thus, it can be regarded as a benchmark to investigate the relative importance of each variable through comparison with the other four sensitive predictions. Specifically, it can be clearly seen that the predictions remain quite close to the observations beginning in March and April when both TCDa_M and Tauxa_W are in their negative phases. That is, the consistently coupled pattern of the zonal air-sea interaction is crucial for the 2020/21 La Ni?a development from the early spring of 2020. In addition, it shows that the February information also enables successful prediction of the La Ni?a phase, but with a relatively weak amplitude. This success is mainly due to the attenuating effect related to the extremely strong meridional wind stress anomalies in the equatorial eastern Pacific. In contrast, the prediction based on January information is completely incorrect, suggesting that only relying on thermocline depth (or oceanic) information is far from sufficient.
More sensitivity analyses were also performed to further measure the relative importance of each predictor. Specifically, with the other three variables maintained using their March information, predictions using different values of the residual variable were made to measure its influence on the La Ni?a prediction. From Fig. 4, it can be clearly seen that the variations in the TCD (both TCDa_M and TCDa_G) and Tauya_E from January to May 2020 mainly influence the quantitative magnitudes of the predicted Ni?o-3.4 indices, but not their phase (i.e., they can all predict the correct La Ni?a pattern). However, the situation is quite different for the Tauxa_W experiment (Fig. 4c), in which only the predictions based on the March, April, and May information (i.e., having changed to anomalous easterlies) are successful, and the two lines based on March and April Tauxa_W information are overlapping, indicating the zonal wind information in March and April almost made a similar contribution toward triggering the La Ni?a event. This further verifies the important role played by the zonal wind stress in the western Pacific, or more specifically, the consistently coupled pattern of the zonal air-sea interaction, in successfully predicting the 2020/21 La Ni?a development from the early spring of 2020. It should be noted that compared with the oceanic condition, the atmospheric conditions (i.e., the zonal wind stress in the western-central Pacific and the meridional wind in the eastern Pacific), play a more and more important role in ENSO predictions, especially in the 21st century (Fang and Zheng, 2021).

Fig. 4. Sensitivity analyses for measuring the relative importance of the four variables on 2020/21 La Ni?a prediction from boreal spring 2020. In each panel, the only variable that changes from January to May 2020 is indicated by the title, while the other three variables are maintained by their March information. The colors of the lines are the same as those in Fig. 3b.
4. Predictability of Arctic sea ice loss in autumn 2020
Since the satellite era, Arctic September sea ice has decreased and thinned. In 2007, it first reached its low record, featuring significant ice loss over the western Arctic, which was mainly attributed to the extremely positive PNA circulation pattern (L'Heureux et al., 2008). In 2012, a major storm’s invasion into the central Arctic in August stirred up thin and fragile sea ice, resulting in dramatic ice loss in September (Parkinson and Comiso, 2013). In 2020,the air temperature north at 70°N ranked as the warmest summer since 1979 and contributed to early ice melt and the setting of the second ice minimum record. These extreme occurrences of the Arctic sea ice extent since the 2000s, which can be attributed to human influence (Kirchmeier-Young et al., 2017), also reveal an unprecedented challenge in Arctic sea ice prediction.
The Sea Ice Outlook (SIO, 2008-13) and the Sea Ice Prediction Network (SIPN, 2014-17) collected predictions of seasonal minimum Arctic sea ice extent by heuristic analysis,statistical analysis, and dynamic models from the research community and assessed their predictive capabilities. Building on the success of the efforts of SIO and SIPN, SIPN began phase 2 (SIPN2) in 2018, with the aim of improving the predictive skill of seasonal Arctic sea ice forecasts through a combination of modeling, new data, data analysis,and scientific networks (https://www.arcus.org/sipn).Figure 5a shows the boxplot of the predicted September mean sea ice extent in 2020 submitted to SIPN2 based on the July (blue) and August (red) outlooks by dynamic models (16 models in total). The boxplot reflects the distribution, central value, and variability of the given datasets. For the July outlook, the predictions show a large spread, ranging from 3.19 to 5.2 × 10⁶km2. The multi-model mean is 4.35 × 10⁶km2(close to the median of 4.33 × 10⁶km2),which significantly overestimates the observed minimum of 3.92 × 10⁶km2. The mean of the August outlook decreases to 4.16 × 10⁶km2(close to the median of 4.21 × 10⁶km2)but is still notably higher than the observation. This suggests that the predictive skill is not significantly improved as the lead time decreases. Also, the large spread in August is mainly due to an extremely low sea ice extent predicted by the GFDL/NOAA model.
Figure 5b shows the time series of the ensemble mean and the spread of the predicted Arctic sea ice extent from the July and August outlooks using the coupled predictive sea ice system introduced in section 2.1. Here, the ice extent is computed as the sum of the area of each model grid with ice concentrations larger than 15%. In general, the model initial ice extent is larger than the observation that lies within the ensemble spread, and the evolution of the ensemble mean of the predicted ice extent is in good agreement with the observations. For the July outlook, the model predicts a faster decrease in the ice extent in early to mid-July relative to the observations. This results in an underestimation of the observed ice extent from mid-July to early August. In contrast, the model predicts a slower decrease in ice extent in late August, leading to an overestimation of the observation.The predicted ice extent for the August outlook captures the observed quick decline in late August, which results in a seasonal minimum closer to the observation compared to that of the July outlook. This also suggests that the predictive skill of the seasonal minimum forecast can be improved as the lead time decreases.
Figure 6 shows the spatial distribution of the observed and predicted September sea ice concentrations. Although the predicted ice distribution is broadly consistent with the observations, the prediction overestimates sea ice in an arc around the periphery of the central Arctic Ocean extending from north of the Beaufort Sea to north of central Siberia.To understand the possible atmospheric circulation pattern that might be important for better Arctic sea ice prediction in 2020, we identify the best and the worst ensemble members in predicting the observed sea ice extent from the July and August outlooks based on the averaged root-meansquare error (dashed lines in Fig. 5b).
Previous studies (e.g., Chen et al., 2017) have suggested that the effect of initial perturbation tends to diminish after approximately 2-3 weeks of integration for the ice extent. Here, we calculated the spatial distribution of the difference in near-surface winds between the best and worst members averaged during 16 July to 30 September for both the July and August outlooks. As shown in Fig. 7, the difference in the July outlook features anomalous cyclonic circulation in the eastern Siberian Sea, the Beaufort Sea, and the central Arctic Ocean. Strong heat waves and massive wildfires in Siberia in summer were important contributors to the anomalously low ice cover in 2020. The anomalously cyclonic circulation in the Beaufort Sea and the central Arctic Ocean between the best and worse members enhances heat advection into the Arctic Ocean, which encourages sea ice melt. This is also supported by the difference in surface air temperature between the best and worst members (Fig. S1 in the ESM), which has broad warm anomalies in the Beaufort Sea and Siberian coast in July, and the Siberian coast and central Arctic Ocean in August. In addition, the difference in surface downward shortwave radiation shows increased solar radiation in the Beaufort and Chukchi Seas and Canadian Arctic, which also favors sea ice melt (Fig.S2 in the ESM). Consistently, the best ensemble member predicts less sea ice cover in the arc around the periphery of the central Arctic Ocean extending from north of the Beaufort Sea to north of central Siberia relative to that of the worst member (Fig. 8). It appears that such an anomalously cyclonic circulation remains in the difference of the August outlook. However, the reasons leading to sea ice changes vary from year to year, and the factors that dominate the sea ice decrease in different years are not the same, which is also a difficulty of accurately forecasting Arctic sea ice.

Fig. 5. (a) September sea ice extent in 2020 predicted by dynamic models from SIPN2. The blue boxplot is for the July outlook, and the red boxplot is for the August outlook. A plus sign denotes the multi-model ensemble mean,and black dots denote the observations. Upper, middle, and lower lines in the box denote first quartile, second quartile, and third quartile of the dataset.Asterisks outside the box connected by a dashed vertical line are the remaining 50% of the dataset. (b) Time series of sea ice extent for the observations (black line) and the ensemble mean and ensemble spread for the July (blue line and shaded area) and August (red line and shaded area)outlooks from the coupled predictive sea ice model described in section 2.1.
5. Conclusions and discussions

Fig. 6. September sea ice concentrations for (a) the satellite observation and (b) the July and (c) August outlooks from the coupled predictive sea ice model described in section 2.1.

Fig. 7. Difference in near-surface winds over the Arctic Ocean between the best ensemble member and the worst ensemble member for (a) the July outlook and (b) the August outlook.
It is of great social significance and economic value to predict winter cold events in advance. Previous studies have illustrated the potential influence of La Ni?a cooling in the tropical Pacific and the loss of Arctic sea ice on anomalous middle-high-latitude atmospheric circulations in winter to cause frequent cold events in Eurasia (e.g., Matsumura and Kosaka, 2019; Zheng et al., 2021). Especially for the extreme cold events that occurred in China during the first half of winter 2020/21, the performance of the routine predictions on the 2020/21 La Ni?a event and the Arctic sea ice loss in autumn 2020 by the state-of-the-art climate models still exhibits many deficiencies at the expected lead time,indicating that an exploration of the predictability of ocean environments related to the 2020/21 extreme cold events in China is necessary.
In this study, we first demonstrated that the SPB could be a major challenge in providing a reasonable La Ni?a prediction in 2020, specifically when the atmospheric and oceanic states of the tropical ENSO system were not coupled together in the spring season of 2020. We further explored the possible reasons why the climate models failed to predict the 2020/21 La Ni?a event when they started in the first half of 2020. As isolated by the coupled data assimilation approach, the initial atmospheric states (i.e., the predominant southeasterly wind anomalies over the equatorial Pacific in the spring season of 2020) could be more effective in favoring the correct development of a cold event. Further diagnostic and sensitivity analysis also confirmed the important role played by the atmospheric winds in the tropical Pacific in successfully predicting the 2020/21 La Ni?a development from the early spring of 2020.

Fig. 8. Differences in Arctic sea ice cover predictions between the best ensemble member and the worst ensemble member for the July outlook.
For the prediction of Arctic sea ice loss in 2020, insufficient observational data over the Arctic leads to a lack of accurate understanding and simulation of Arctic sea ice and its complex interactions with the ocean and atmosphere, and dramatic Arctic changes further increase the difficulty in ice prediction. According to SIPN2, the September 2020 mean sea ice extent forecasted by 16 dynamic models had a large spread, with overestimates from most models. A recently developed coupled atmosphere-sea ice-ocean modeling system provides a relatively good forecast for the September sea ice extent from the multi-ensemble mean, and the predictive skill can be improved as the lead time decreases. The best and worst ensemble members in predicting the minimum Arctic sea ice extent are identified, and anomalously cyclonic circulation over the central Arctic Ocean, which sweeps abnormal hot air over Siberia into the Arctic Ocean,in the best ensemble member is recognized as an important contributor to better sea ice prediction. This suggests that better predictions of Arctic atmospheric conditions play an important role in promoting the Arctic sea ice prediction skill, and better Arctic condition prediction will also improve winter climate forecasts over midlatitudes through the Arctic-midlatitude teleconnection (Jung et al., 2020).
However, in addition to the background information influencing the extreme cold events invading China, the atmospheric internal variability in the middle-high latitudes of the Northern Hemisphere should more directly result in frequent extreme cold events in winter. The two coupled models adopted in this work are both regional coupled models;one is concentrated over the tropical Pacific (i.e., IAP ENSO EPS), and the other covers the pan-Arctic region.Thus, these two models can only be used to discuss the potential predictability of the two oceanic conditions demonstrated in this work and cannot be directly used to explore the resulting probabilities of temperatures over China. In fact, for the monthly mean characteristics of the below-normal temperatures in most parts of China in December 2020,many advanced seasonal dynamic models showed poor forecasting abilities, including the BCC_CSM1.1 of the National Climate Center (NCC) of China, CFSv2 of the National Centers for Environmental Prediction (NCEP) in the USA, SEAS5 of the European Centre for Medium-range Weather Forecasts (ECMWF), and CPS2 of the Japan Meteorological Agency (JMA). Most of these models predicted above-normal temperatures in China in December 2020 for different initial dates. Even in the nearest month (November 2020), almost none of the models predicted below-normal temperatures across the country in the next month due to the difficult-to-predict atmospheric internal variability.The exceptions were the CFSv2 and CPS2, which predicted low temperatures in southern China (Fig. 9). The most likely fundamental reason for this is that the dynamic models showed low skill in predicting the middle-high-latitude circulations and weren’t able to predict the meridional circulation with an intensified Ural High and a deepened East Asian Trough in December 2020. Methods to improve the seasonal prediction of extreme cold events in winter are still being explored.

Fig. 9. (a) Observed monthly mean temperature anomalies in China in December 2020 and the climate prediction of the 2-m air temperature in China in December 2020 by the (b) BCC_CSM1.1 of NCC, (c) CFSv2 of NCEP, (d)SEAS5 of ECMWF, and (e) CPS2 of JMA, with the initial time in November 2020.
Acknowledgements. The authors wish to thank anonymous reviewers for their very helpful comments and suggestions. This work was supported by the Key Research Program of Frontier Sciences, CAS (Grant No. ZDBS-LY-DQC010), the National Natural Science Foundation of China (Grant Nos. 41876012 and 41861144015; 42175045), and the Strategic Priority Research Program of the Chinese Academy of Sciences (Grant No.XDB42000000).
Electronic supplementary material: Supplementary material is available in the online version of this article at https://doi.org/10.1007/s00376-021-1130-y.
Open Access This article is distributed under the terms of the Creative Commons Attribution 4.0 International License (http://creativecommons.org/licenses/by/4.0/), which permits unrestricted use, distribution, and reproduction in any medium, provided you give appropriate credit to the original author(s) and the source,provide a link to the Creative Commons license, and indicate if changes were made.
 Advances in Atmospheric Sciences2022年4期
- Advances in Atmospheric Sciences的其它文章
- Preface to the Special Issue on Extreme Cold Events from East Asia to North America in Winter 2020/21※
- Influence of the NAO on Wintertime Surface Air Temperature over East Asia: Multidecadal Variability and Decadal Prediction※
- The 2020/21 Extremely Cold Winter in China Influenced by the Synergistic Effect of La Ni?a and Warm Arctic※
- Seasonal Cumulative Effect of Ural Blocking Episodes on the Frequent Cold events in China during the Early Winter of 2020/21※
- The Nature and Predictability of the East Asian Extreme Cold Events of 2020/21※
- Extreme Cold Events from East Asia to North America in Winter 2020/21: Comparisons, Causes, and Future Implications※