Adjustment of precipitation measurements using Total Rain weighing Sensor (TRwS) gauges in the cryospheric hydrometeorology observation (CHOICE)system of the Qilian Mountains, Northwest China
ZHAO Yanni, CHEN Rensheng, HAN Chuntan, WANG Lei
1 Qilian Alpine Ecology and Hydrology Research Station, Northwest Institute of Eco-Environment and Resources, Chinese Academy of Sciences, Lanzhou 730000, China;
2 University of Chinese Academy of Sciences, Beijing 100049, China;
3 College of Urban and Environment Sciences, Northwest University, Xi'an 710127, China;
4 College of Geography and Environment, Shandong Normal University, Jinan 250014, China
Abstract: Precipitation is one of the most important indicators of climate data, but there are many errors in precipitation measurements due to the influence of climatic conditions, especially those of solid precipitation in alpine mountains and at high latitude areas. The measured amount of precipitation in those areas is frequently less than the actual amount of precipitation. To understand the impact of climatic conditions on precipitation measurements in the mountainous areas of Northwest China and the applicability of different gauges in alpine mountains, we established a cryospheric hydrometeorology observation (CHOICE) system in 2008 in the Qilian Mountains, which consists of six automated observation stations located between 2960 and 4800 m a.s.l. Total Rain weighing Sensor (TRwS) gauges tested in the World Meteorological Organization-Solid Precipitation Intercomparison Experiment(WMO-SPICE) were used at observation stations with the CHOICE system. To study the influence of climatic conditions on different types of precipitation measured by the TRwS gauges, we conducted an intercomparison experiment of precipitation at Hulu-1 station that was one of the stations in the CHOICE system. Moreover, we tested the application of transfer functions recommended by the WMO-SPICE at this station using the measurement data from a TRwS gauge from August 2016 to December 2020 and computed new coefficients for the same transfer functions that were more appropriate for the dataset from Hulu-1 station. The new coefficients were used to correct the precipitation measurements of other stations in the CHOICE system. Results showed that the new parameters fitted to the local dataset had better correction results than the original parameters. The environmental conditions of Hulu-1 station were very different from those of observation stations that provided datasets to create the transfer functions. Thus, root-mean-square error (RMSE) of solid and mixed precipitation corrected by the original parameters increased significantly by the averages of 0.135 (353%) and 0.072 mm (111%), respectively. RMSE values of liquid, solid and mixed precipitation measurements corrected by the new parameters decreased by 6%, 20% and 13%, respectively. In addition, the new parameters were suitable for correcting precipitation at other five stations in the CHOICE system. The relative precipitation (RP)increment of different types of precipitation increased with rising altitude. The average RP increment value of snowfall at six stations was the highest, reaching 7%, while that of rainfall was the lowest, covering 3%. Our results confirmed that the new parameters could be used to correct precipitation measurements of the CHOICE system.*Corresponding author: CHEN Rensheng (E-mail: crs2008@lzb.ac.cn)
Keywords: automatic weather stations; Total Rain weighing Sensors; precipitation correction; transfer function;Qilian Mountains
1 Introduction
Precipitation is one of the essential data for climatology, ecology, hydrology, weather forecasting and cryosphere research (Barnett et al., 2005; Christensen et al., 2008; Buisán et al., 2020;Kochendorfer et al., 2021). Accurate precipitation data are necessary for the estimations of water balance, the studies of glacier changes and hydrological processes, and the protection of ecology in mountainous areas (Sheffield et al., 2004; Rasmussen et al., 2012; Nitu et al., 2018; Ding et al.,2020). However, there are significant errors in the observed data of precipitation (Goodison,1978). Previous studies have proved that systematic errors in the measurements of precipitation are mainly caused by wind-induced loss, wetting loss and evaporation loss (Goodison et al., 1981;Sevruk and Klemm, 1989). Factors leading to the undercatch of precipitation include wind speed,different types of gauges, wind shields and the crystal types of precipitation, in which wind is one of the primary reasons for snow undercatch (Sevruk et al., 1991; Sevruk and Nespor, 1994; Yang et al., 1995; Theriault et al., 2012). Moreover, precipitation in high-altitude mountains and boreal regions with long winter seasons is significantly undercatched (Yang et al., 1991; Nalder and Wein, 1998; Chen et al., 2015). To solve the precipitation undercatch issue in the manual measurements and derive standard methods for solid precipitation measurement, World Meteorological Organization (WMO) carried out the intercomparison of solid precipitation measurement from 1985 to 1993. During this experiment, International Organizing Committee(IOC) designated the double fence intercomparison reference (DFIR) as a reference standard for measuring solid precipitation, which includes a manual Tretyakov gauge surrounded by an octagonal vertical double fence. In addition, researchers created transfer functions (adjustments)to correct the measurements of different types of precipitation, which are mainly expressed as a function of wind speed for different types of precipitation (Goodison, 1978; Goodison et al., 1998;Yang et al., 1998, 1999).
After the first study of WMO solid precipitation measurement intercomparison, various automatic systems measuring snowfall have been designed and used. Weighing gauges are one of the primary types of automated precipitation gauges available (Kochendorfer et al., 2018). The results of WMO's Commission for Instruments and Methods of Observation (CIMO) survey in 2008 showed that there were five types of automatic weighing gauges operated at that time: OTT Pluvio2, T-200B Geonor, TRwS MPS system, VRG101 Vaisala and MRW500 Meteoservis (Nitu and Wong, 2010). Although automatic instruments have many advantages in measuring precipitation, such as real-time and accurate monitoring, the measurement errors of snowfall are often ignored and frequently range from 20% to 50% in windy conditions (Rasmussen et al.,2012). To assess the performance of automated systems in measuring solid precipitation and snow depth in different climate regimes and recommend appropriate automated field reference systems for unattended stations, CIMO initiated and guided the Solid Precipitation Intercomparison Experiment (SPICE) in 2010 (Nitu et al., 2018; Kochendorfer et al., 2021). Compared with previous study of WMO's solid precipitation intercomparison, more experimental fields with various climate regimes and automatic observation instruments were used in the SPICE. In the SPICE, a single-Alter shielded automatic gauge surrounded by an octagonal double fence was named as double fence automatic reference (DFAR) standard for an automatic system (Nitu et al.,2012). In addition, transfer functions for automated measurements have been developed as a function of wind speed and air temperature (Wolff et al., 2015; Kochendorfer et al., 2017a, b). A continuous adjustment function was created by Wolff et al. (2015) to correct the winter precipitation measurement of the Norwegian site of the SPICE. Kochendorfer et al. (2017b)developed and tested the ''universal'' transfer functions using datasets of eight separate sites of the SPICE during winter periods from 2013-2014 to 2014-2015 to minimize errors in the precipitation measurements of single-Alter shielded and unshielded weighing gauges. Moreover,the methods for data quality control and selection of precipitation events were described in detail in Reverdin et al. (2016). Kochendorfer et al. (2018) tested and recommended transfer functions for all WMO-SPICE weighing gauges and shield configurations, which have not been evaluated before. They indicated that previously developed transfer functions could be widely used. The WMO-SPICE transfer functions were evaluated by Smith et al. (2020) using additional data of winter seasons from 2015-2016 to 2016-2017, which were not used to develop transfer functions.The results showed that the performance of these functions varied with sites and shield configurations.
In China, a precipitation intercomparison experiment between the Chinese standard precipitation gauge (CSPG) and the Hellmann gauge was first carried out at the Tianshan Mountains during the WMO solid precipitation measurement intercomparison from 1985 to 1993(Yang, 1988). During this experiment, Yang et al. (1991) developed the transfer functions of CSPG using the wind speed at the height of 10 m at the Daxigou meteorological station. The achievements of this international precipitation intercomparison experiment laid a foundation for later correction work of observed errors in the precipitation measurements in China. Ren and Li(2007) determined the range of various errors in precipitation measurements by carrying out a precipitation intercomparison experiment at 30 reference stations in China and created a correction method, especially for wind-induced errors. Ye et al. (2007) corrected the measurement errors of CSPG using the long-term daily data during 1951-2004 at 726 meteorological stations in China. In 2008, Chen et al. (2014) established a precipitation intercomparison field (Hulu-1 station) in the Hulu Watershed of the Qilian Mountains to study the influence of complex and variable climatic and environmental conditions on different types of precipitation measurements.At Hulu-1 station, Chen et al. (2015) compared the measurements of rain, snow and mixed precipitation of CSPG with various shields and established adjusted functions for unshielded and single-Alter shielded CSPG using a DFIR shield (CSPGDF) as a reference standard. In 2014, a Total Rain weighing Sensor 204 (TRwS204) equipped with a single-Alter shield (TRwSSA) was installed at Hulu-1 station. After that, Zheng et al. (2018) tested the application of transfer functions of Kochendorfer et al. (2017a) at Hulu-1 station using a TRwSSAgauge, and the reference standard was CSPGDF. However, the performance of functions was difficult to evaluate because of different types of gauges and random errors. The study by Zheng et al. (2018) on the correction of observed errors for TRwS204 was limited by the observation frequency of CSPGDF.Thus, only daily precipitation data can be corrected. In addition, different gauges may produce errors in precipitation measurements, which may increase the uncertainty of correction results.Therefore, an automatic reference standard was necessary to increase the accuracy of correction results for TRwSSAgauges.
After a reference standard of TRwS204 gauges is constructed in 2016, the hourly measurement of precipitation of TRwSSAgauges can be corrected, and the errors caused by different gauges can be eliminated. To increase the measurement accuracy of TRwS204 gauges and understand the influence of climatic conditions on TRwS204 precipitation measurements, we carried out a precipitation observation intercomparison experiment of TRwS204 gauges at Hulu-1 station in the Hulu Watershed. This experiment was important to correct the measurements of automatic weighing gauges in the Qilian Mountains and to understand observation errors in high mountainous areas. Since previous study only tested the transfer functions of wind speed and air temperature variables, the applicability of all ''universal'' transfer functions recommended by the WMO was tested at this station. This study aimed to understand the impact of climatic conditions on the measurements of TRwS204 gauges of all precipitation types, including rain, snow and the mixture of them. In addition, the application of the ''universal'' transfer functions from Kochendorfer et al. (2017b) was tested using the dataset from TRwSSAgauges. Moreover, we computed new coefficients of the same transfer functions that were more suitable for TRwSSAgauges at the study site. These new parameters could correct the precipitation measurements of other TRwS204 and TRwS504 gauges in the CHOICE system in the Hulu Watershed of the Qilian Mountains, China.
2 Data and methods
2.1 CHOICE system
CHOICE system was established in 2008 in the Hulu Watershed of the Qilian Mountains. The CHOICE system can provide long-term and dense meteorological datasets at altitudes of 2960-4800 m a.s.l., including the datasets of glacier, snow and permafrost hydrology (Han et al.,2018). TRwS gauges including three TRwS204 gauges and four TRwS504 gauges were commonly used to measure precipitation. Each station of this system has a meteorological tower(Fig. 1). These six observation stations, named as Hulu-1-Hulu-6, are shown in Table 1. All seven TRwS gauges were not heated because the batteries would be quickly consumed when gauge inlets were heated, and they could not be replaced in time due to the dangerous road conditions in winter. Antifreeze is necessary for all weighing gauges to ensure that the water collected in the bucket remains in a liquid form and will not damage the instrument (bucket) or induce incorrect data. Machine oil is also needed to reduce evaporation. One of seven TRwS gauges was surrounded by a DFIR shield, and the others were equipped with single-Alter shields. The capacity of TRwS504 was 250 mm, and that of TRwS204 was 750 mm. The orifice areas for TRwS504 and TRwS204 were 500 and 200 cm2, respectively. The wind speed (1405-PK-052, Gill Instruments Limited, UK), air temperature and relative humidity (HMP155A, Vaisala, Inc.,Finland) at 1.5 and 2.5 m heights were measured by automatic instruments at each station.
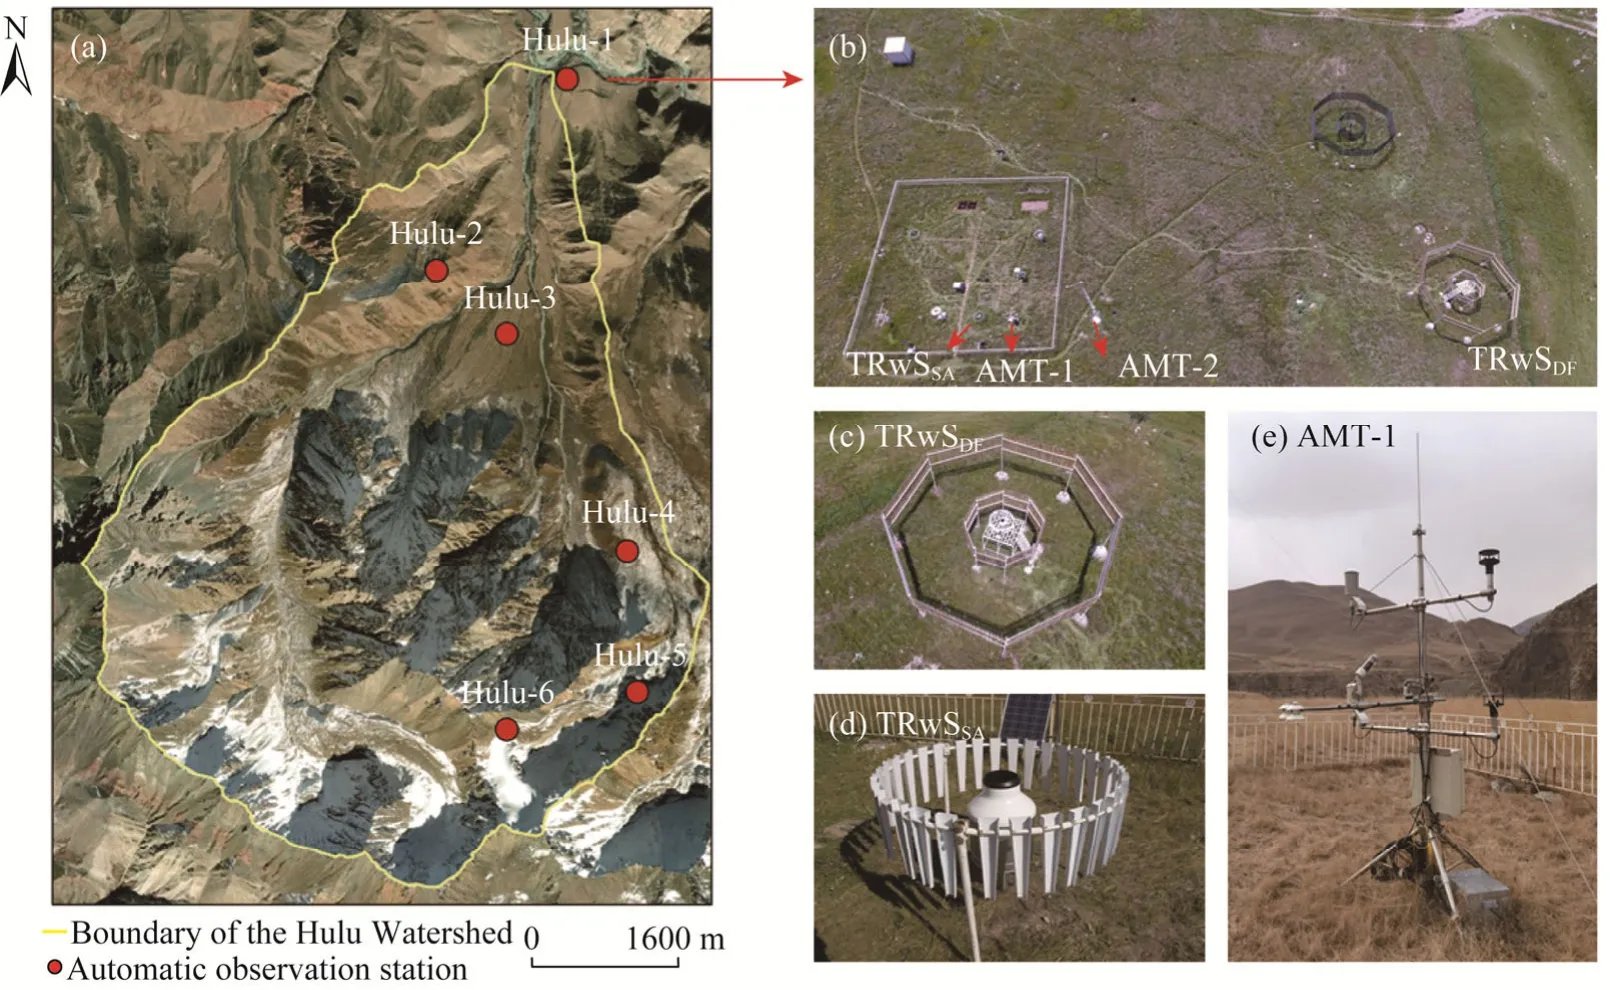
Fig. 1 (a), distribution of the six automatic observation stations in the CHOICE system; (b), the layout of the CHOICE system; (c), a single-Alter shielded Total Rain weighing Gauge 204 (TRwSSA); (d), a single-Alter shielded Total Rain weighing Gauge 204 with an octagonal double fence (TRwSDF); (e), an automated meteorological tower (AMT) measuring wind speed, air temperature and relative humidity at 1.5 and 2.5 m heights.
2.2 Hulu-1 station
Hulu-1 station (38°16′N, 99°52′E; 2980 m a.s.l.) of the CHOICE system, is located in the flat grassland in the valley and close to the Qilian Alpine Ecology and Hydrology Research Station,Northwest Institute of Eco-Environment and Resources (NIEER) of the Chinese Academy of Sciences, making it convenient for manual precipitation observations. Therefore, we chose this station to carry out the intercomparison experiment of precipitation measurements between manual and automatic gauges and different types of automatic weighing gauges. The altitude difference around this station can reach approximately 1860 m. The average wind speed is low at the station(Table 1), and the average snow depth from August 2016 to December 2020 was about 2 cm.Blowing or drifting snow is rarely observed at the station (Chen et al., 2015). In the present work,we carried out an intercomparison experiment of precipitation measurements using TRwS204 at the station (Chen et al., 2014; Han et al., 2018; Fig. 1a).
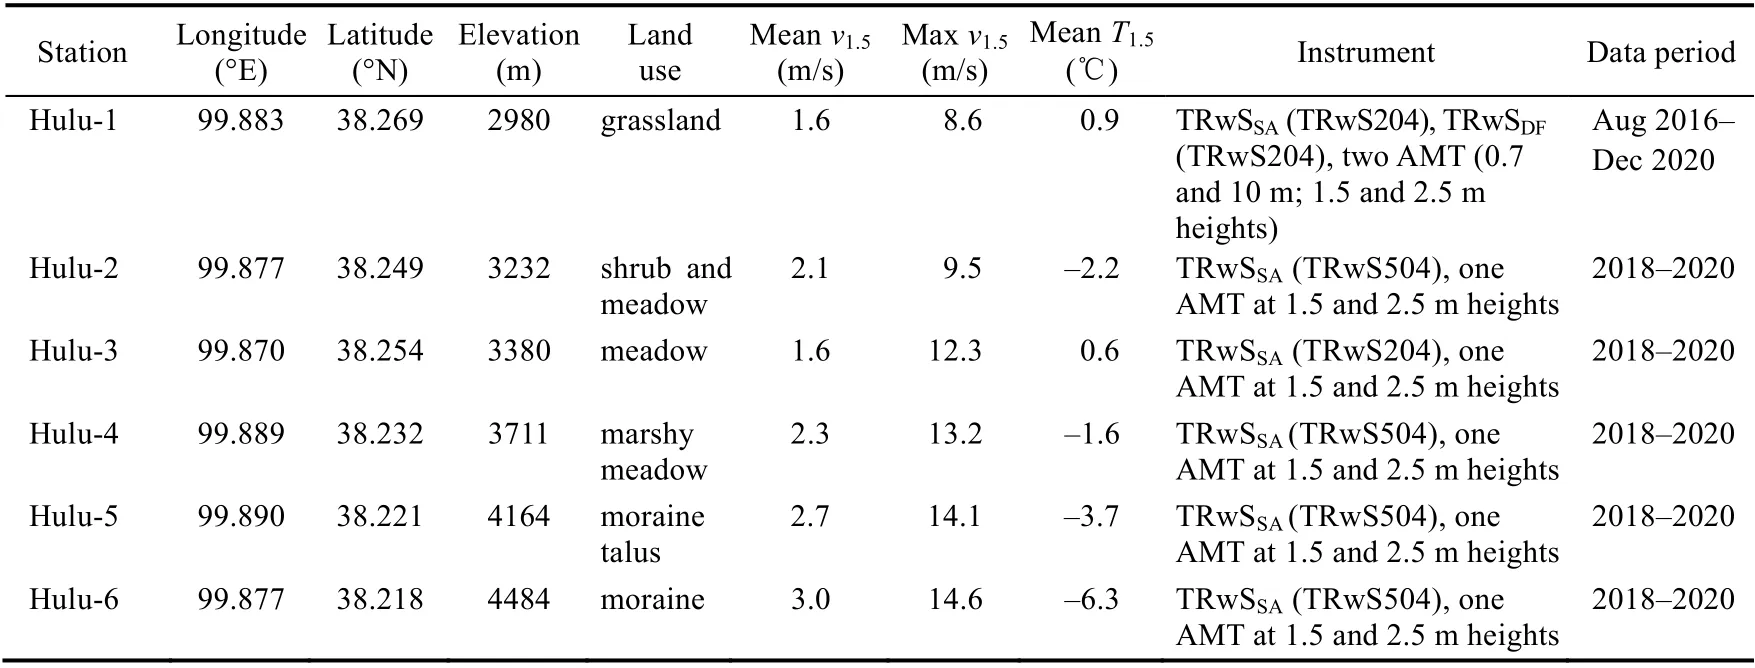
Table 1 Description of each station of the CHOICE system
The instruments at Hulu-1 station (Fig. 1b) included three CSPGs equipped with different shields,two CSPGs in pits, a single-Alter shielded TRwS204 (TRwSSA; Fig. 1c), a single-Alter shielded TRwS204 surrounded by a DFIR shield (TRwSDF; Fig. 1d) as a reference standard, a Tretyakov shielded Geonor T-200B weighing gauge and two automatic weather stations (Fig. 1b). The height of TRwSSAwas about 0.7 m. The installation height of TRwSDFwas 3 m. The wind speed, air temperature and relative humidity (at 1.5 and 2.5 m heights were measured by automatic sensors in a meteorological tower (AMT-1 in Figure 1e)). Another meteorological tower was used to collect wind speed, air temperature and relative humidity at 0.7 and 10.0 m heights (AMT-2 in Figure 1b).The installation heights of TRwS gauges (about 0.7 m) at other five stations differed from the measurement heights of auxiliary meteorological data (1.5 and 2.5 m in heights), according to the China Meteorological Administration (CMA) standard (CMA, 2007). To correct the measurements of all TRwS gauges in the CHOICE system, all stations used the auxiliary meteorological data at the height of 1.5 m.
From 2017 to 2020, the average annual precipitation was 497.7 mm, mainly in the warm season(from May to September). At 1.5 m height, the annual mean temperature was 0.9°C, the mean annual relative humidity was 56.2% and the mean annual maximum wind speed was 7.8 m/s.
2.3 Data analysis
The manual quality control for all data was performed as follows: (1) data with repeated timestamps were deleted and missing values were filled with ''null'' values; (2) values that exceeding the specified output range of instruments were deleted; (3) 30-min precipitation data recorded by weighing gauges were removed when relative humidity was less than 50%; and (4) 30-min precipitation data less than 0.01 mm were screened out to reduce the effect of other weather types like fog and precipitation in previous hour. In addition, according to the datasets recorded by an observer, we checked whether any data were deleted by mistake. For example, precipitation occasionally occurred when the relative humidity was less than 50%.
We determined precipitation types manually according to CMA standard (CMA, 2007), and observations were conducted twice a day at 08:00 and 20:00 (LST) at Hulu-1 station of the CHOICE system. However, precipitation and other meteorological data were at half-hourly time scales. The manually observed precipitation types could not meet the needs of this paper. Moreover,because the measurements of precipitation types were not performed in other observation stations,we used 30-min average air temperature (Tair) to determine the precipitation types. This paper evaluated solid precipitation (Tair< -2℃), mixed precipitation (-2℃≤Tair≤2℃) and liquid precipitation (Tair>2℃) (Wolff et al., 2015; Kochendorfer et al., 2017a).
Because catch efficiency (CE) is the ratio of precipitation measured by TRwSSAto that by TRwSDF, a minimum threshold is needed to constrain errors in TRwSDFmeasurements (Kochendorfer et al., 2017a). This result can reduce the impact of measurement noise while maintaining a large sample size of precipitation events. In the study of Kochendorfer et al. (2017a), precipitation threshold of DFIR iteratively increased from zero in 0.01 mm increase, and the simple linear transfer function was calculated to test each threshold. As shown in Figure 2, for each 0.01 mm increase in the threshold, the number of 30-min rainfall events (n) and standard deviation (σ) of CE function were estimated, and the minimum standard error (SE=σ/n) was found at 0.50 mm.Therefore, the minimum threshold of 30-min rainfall events was 0.50 mm. The minimum TRwSDFthresholds of snowfall and mixed precipitation were also examined using the same method.Using 30-min periods of snow and mixed precipitation recorded by TRwSDFat Hulu-1 station of the CHOICE system, the minimum 30-min thresholds of snow and mixed precipitation were 0.13 and 0.17 mm, respectively. After the above steps, the rain, snow and mixed precipitation events were determined.
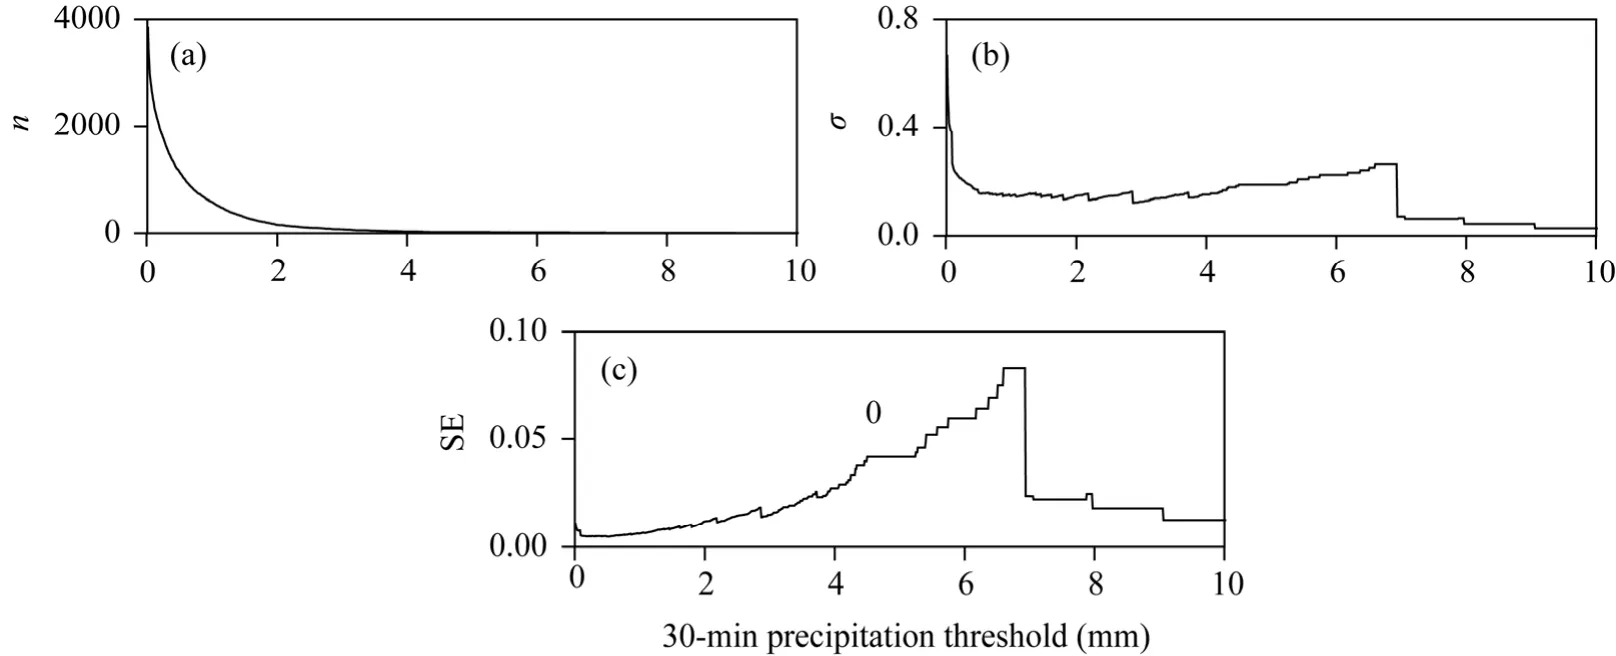
Fig. 2 Impacts of minimum 30-min precipitation threshold on developing transfer functions at Hulu-1 station of the CHOICE system. (a), number of 30-min precipitation events (n) above the threshold; (b), standard deviation(σ) of the linear transfer function error; (c) standard error (SE) of transfer functions. Only rainfall results are shown here.
By determining the range of CE values, precipitation events were filtered and representative precipitation measurements were selected. Precipitation events with CE values less than 1.30 and greater than 0.50 were selected to test the transfer functions, which could prevent large errors in the correction of results.
From August 2016 to December 2020, a total of 1551 precipitation events were collected to test and evaluate the transfer functions at Hulu-1 station of the CHOICE system (Table 2). The proportions of rainfall, snowfall and mixed precipitation were 71%, 7% and 22%, respectively.
2.4 Transfer functions
The ''universal'' transfer functions were developed with datasets from single-Alter shielded and unshielded Geonor T-200B3 and OTT Pluvio2gauges at eight test stations. Equation 1 is a function of air temperature and wind speed and a simple transformation of sigmoidal transfer function tested by Wolff et al. (2015). The function was introduced by Kochendorfer et al.(2017b):

wherevis the average wind speed (m/s) andTairis the average air temperature (℃), both measured at the same height. a, b and c are the coefficients fitted to the data. The precipitation types were not needed to discriminate rain, snow and mixed precipitation because the air temperature was used as a parameter in Equation 1. The coefficients a=0.0348, b=1.366 and c=0.779 from Kochendorfer et al. (2017b) were used.The exponential function was developed with wind speed for solid and mixed precipitation.The form of Equation 2 was described as follows (Kochendorfer et al., 2017b):

Table 2 Comparison of 30-min precipitation accumulations between single-Alter shielded TRwS204 gauge(TRwSSA) and TRwS204 gauge with a DFIR shield (TRwSDF) from August 2016 to December 2020 at Hulu-1 station of the CHOICE system

where a, b and c are the coefficients fitted to the data. Some observation stations did not include the measurements of precipitation types, and thus30-min averageTairwas used to determine the precipitation types (rain, snow and mixed precipitation) for Equation 2: snowfall appeared atTair<-2°C,rainfall occurred atTair>2°C and mixed precipitation happened at -2°C≤Tair≤2°C(Kochendorfer et al., 2017b).We applied coefficients of mixed-phase (a=0.668, b=0.132 and c=0.339) and snow (a=0.728, b=0.230 and c=0.336) according to Kochendorfer et al. (2017b).
In addition, the threshold of average wind speed of the two functions was also considered. The threshold of mean wind speed at a gauge height was 7.2 m/s, which can replace the measurements of 30-min mean wind speed exceeding the threshold (Kochendorfer et al., 2017b).
2.5 Testing for transfer functions
This paper used different statistics to evaluate the performance of the ''universal'' transfer functions depending on whether the observation station was equipped with the reference standard(TRwSDF).
Four statistics were used to estimate the errors of corrected measurements at Hulu-1 station:root-mean-square error (RMSE), mean bias (bias), Pearson's coefficient (r) and the percentage of precipitation event with error less than 0.1 mm (PE0.1mm). RMSE could estimate the uncertainty of 30-min observed, corrected TRwSSAmeasurements relative to TRwSDFand evaluated the relative performance of transfer functions. Bias was the difference between average precipitation measurements using test gauge and those using DFAR gauge. Pearson's coefficient was used to evaluate the linear correlation between 30-min TRwSSAmeasurements and TRwSDFreference measurements before and after correction. PE0.1mmwas defined as the percentage of total event counts within threshold of 0.1 mm to the total number of events (Kochendorfer et al., 2017b).This statistic can show how adjustments affect bias and uncertainty in the assessment from event-based perspectives. Kochendorfer et al. (2018) used a 10-fold cross validation when gauges were only tested at one station. This method was used at Hulu-1 station of the CHOICE system and carried out in ten independent iterations. Each iteration used 90% of the data to produce function parameters and the remaining 10% of the data to test transfer functions.The error statistics were taken as the average of all ten iterations.
Because other five observation stations did not install DFIR standards, the RP increment was used as an indicator to evaluate the correction results from other stations. The equation was described as follows (Zhao et al., 2021):

where RPsiteis the relative precipitation increment of different stations;Pcoris the corrected precipitation (mm); andPmeais the measured precipitation (mm).
3 Results
3.1 Relationship between CE and wind speed
Relationships between CE and wind speed for rain, snow and mixed precipitation are shown in Figure 3. For liquid precipitation, CE values remained basically unchanged at first and then decreased with increasing 30-min average wind speed (Fig. 3a). When average wind speed was greater than 3 m/s, CE values decreased with the increase in wind speed. When mean wind speeds were between 4 and 6 m/s, the median value of CE was 0.87, a higher value under the high wind speeds. Moreover, many outliers were found in Figure 3a, especially at low wind speeds, under which CE values were significantly scattered. At this observation station, snowfall could occur at air temperatures higher than 0℃, leading to an increased scatter in the dataset. In addition, the lack of rainfall events under the high wind speeds resulted in a decreasing scatter of data with increasing wind speeds.

Fig. 3 Catch efficiency under different wind speeds for liquid precipitation (a), solid precipitation (b) and mixed precipitation (c). The dataset was observed from August 2016 to December 2020 at Hulu-1 station of the CHOICE system. n, the number of precipitation events. IQR, inter-quartile range.
For solid precipitation, CE values decreased slowly with increasing 30-min average wind speed,and the scattered points were mainly concentrated in the wind speeds of 1-3 m/s (Fig. 3b). Under high wind speeds (4-6 m/s), the median value of CE was 0.88, which was higher than that of rainfall. Rainfall might also occur when air temperature was below -2℃, which partially explains the scatter of CE values for snowfall. Additionally, similar to the lack of rainfall events under the high wind speeds, there were few snowfall events under the high wind speeds, resulting in decreased scatter of data with increasing wind speed.
For mixed precipitation, the lessening of CE values was obvious with increasing 30-min average wind speed, but median values of CE were also high when the mean wind speed exceeded 4 m/s (Fig. 3c). When wind speeds were between 5 and 8 m/s, the median CE value of mixed precipitation was 0.85. In addition, data for CE values were also scattered. Rainfall and snowfall could also occur under the range of 30-min average air temperature of mixed precipitation occurrences. Therefore, data scattering depended on the precipitation types.
3.2 Correlation between TRwSSA and TRwSDF
As shown in Figure 4, a strong correlation existed between measurements of TRwSSAand TRwSDF, andR2values for all precipitation types were close to 1. Although the scatter points of rainfall plotted close to 1:1 diagonal slope, RMSE value was 0.134, higher than those of solid and mixed precipitation (Fig. 4b, c and d). Moreover, the points of mixed precipitation were more scattered than those of rainfall and snowfall. In general, significant correlations occurred between TRwSSAand TRwSDFirrespective the precipitation types.
3.3 Testing results
The dataset from Hulu-1 station was used to fit the new parameters, which is more suitable for TRwSSAgauges. Significant differences were found between adjusted results of the ''universal''transfer functions and those of the new parameters (Fig. 5).
For liquid precipitation, only Equation 1 could be used to correct measurements (Fig. 5a). The values of RMSE corrected by the original and new parameters both decreased, with the values of 0.130 and 0.126 mm, respectively; the values of adjusted bias using the original and new parameters were both near to 0.000 mm. These results showed that the data of precipitation corrected with the original and new parameters were improved significantly. Although corrected values ofrand PE0.1mmremained unchanged, total liquid precipitation increased, and the difference of adjusted rainfall from reference rainfall was 7.83 mm.
For mixed precipitation, the accuracy of the results corrected by original parameters decreased,while those adjusted by the new parameters were improved (Fig. 5b). Using the original parameters, the corrected RMSE of Equations 1 and 2 significantly exceeded 0.1 mm, reaching 0.116 and 0.156 mm, respectively, and adjusted values of bias also significantly increased. In addition, PE0.1mmvalues corrected by Equations 1 and 2 decreased to 0.709 and 0.630,respectively. The great differences in environmental conditions at different stations made the''universal'' transfer functions unsuitable for correcting the measurements at Hulu-1 station.However, the transfer functions with the new parameters presented a better performance. The adjusted RMSEs of Equations 1 and 2 were reduced by 11% and 16%, respectively, and the corrected values of bias were both near to 0.000 mm.
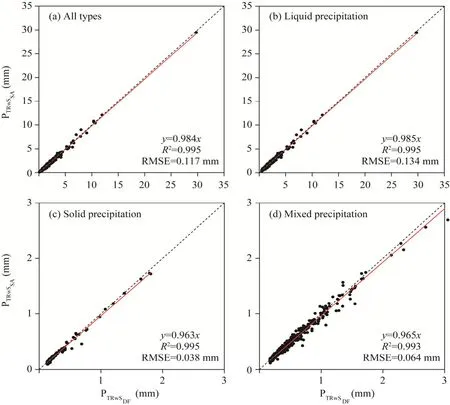
Fig. 4 Correlation between single-Alter shielded TRwS204 gauge (TRwSSA) and TRwS204 gauge with a DFIR shield (TRwSDF) for (a) all precipitation types, (b) liquid, (c) solid and (d) mixed precipitation
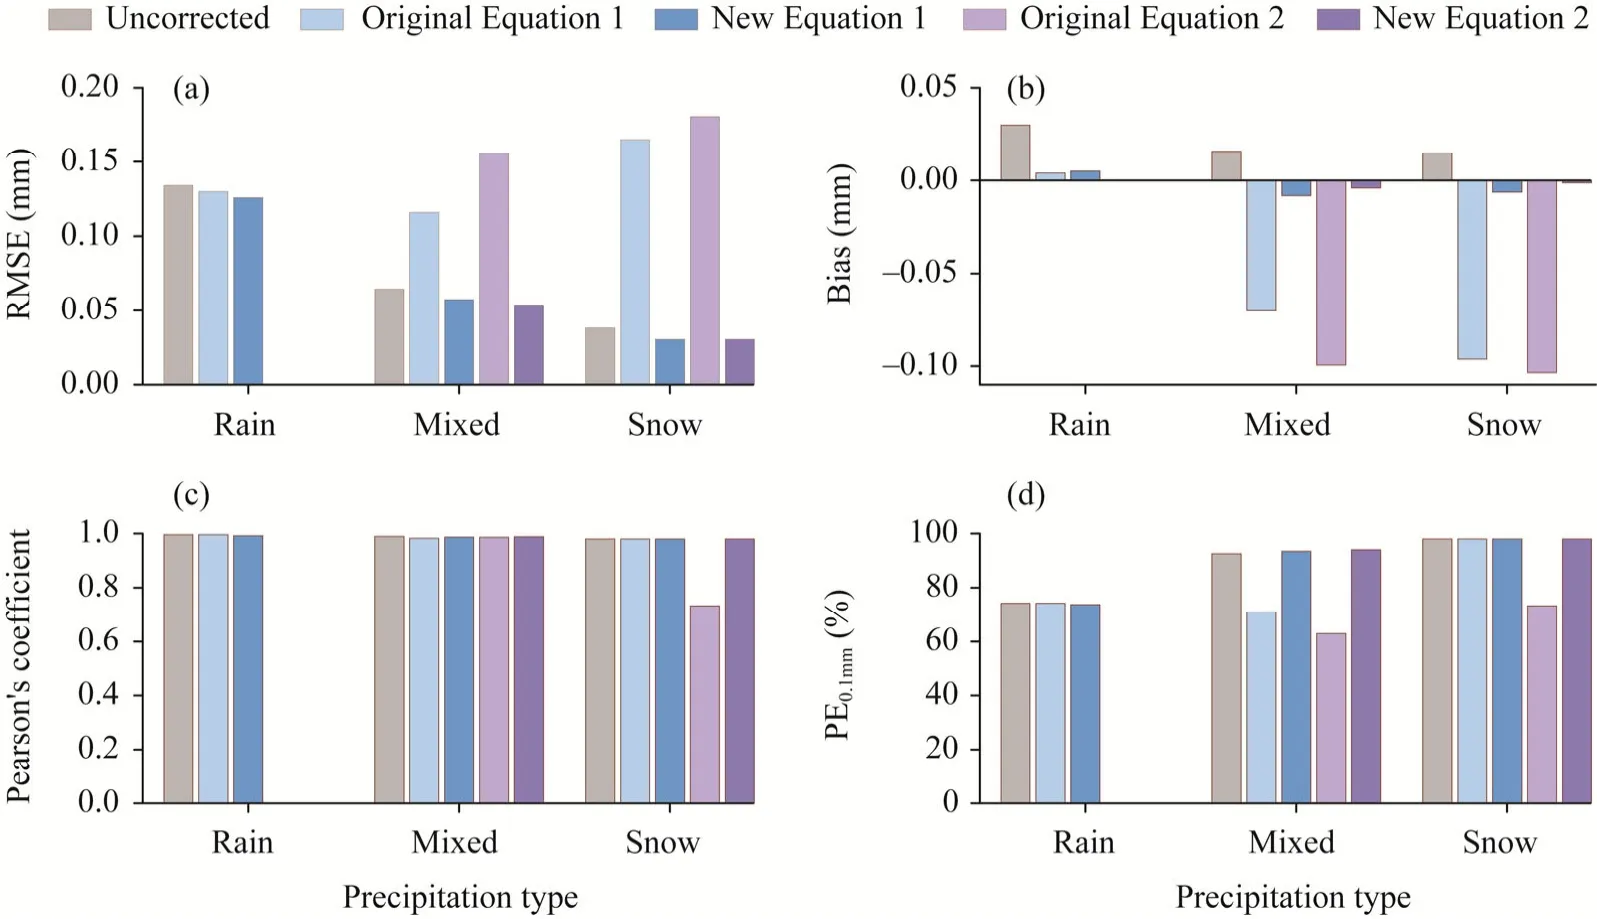
Fig. 5 Root-mean-square error (RMSE), mean bias (Bias), Pearson's coefficient (r) and percentage of precipitation events within the threshold of 0.1 mm (PE0.1mm) of liquid, mixed and solid precipitations for single-Alter shielded TRwS204 gauge (TRwSSA)
For solid precipitation, the accuracy of the results corrected by the ''universal'' transfer functions decreased, while those by the new parameters were improved (Fig. 5c). After using the original parameters, the adjusted RMSE was greater than 0.160 mm, and the corrected bias absolute values were greater than 0.100 mm. The adjusted PE0.1mmusing Equation 2 reduced by 25% (Fig. 5d). These results indicated that the ''universal'' transfer functions were unsuitable for correcting solid precipitation at Hulu-1 station. The new parameters fitted by local dataset were more suitable for adjusting snowfall. The RMSEs corrected by the new parameters were both lessened by 20%, and the adjusted bias values were both close to 0.000 mm.
In general, the new parameters fitted to the precipitation measurements at Hulu-1 station showed a better performance, which was calculated by using solid, liquid and mixed precipitation measured by TRwS204 at the station of the CHOICE system. The new coefficients in Equation 1 were a=0.017, b=0.280 and c=0.714, and the range of 30-min average wind speed at 1.5 m height was 0≤v≤6 m/s. The new coefficients in Equation 2 for snowfall were a=0.010, b=0.888 and c=0.966, and those for mixed precipitation were a= -0.010, b= -0.459 and c=1.012. For snowfall,the range of 30-min average wind speed at 1.5 m height was 0≤v≤5 m/s, and for mixed precipitation, the range was 0≤v≤6 m/s. These new coefficients were applied to the CHOICE system to correct rain, snow and mixed precipitation.
3.4 Application of the new parameters to the CHOICE system
We first applied the new parameters to TRwS204 and TRwS504 gauges under similar environmental conditions to evaluate the performance of new transfer functions because TRwS504 gauges were mainly installed above 3500 m a.s.l., while the new parameters were obtained from TRwS204 gauges. Whether the new parameters would be applied to TRwS504 gauges at higher altitudes depended on the corrected results. Because the measurements of all precipitation types in the station of the CHOICE system needed to be corrected, tests were carried out with Equation 1. The results of assessment are as follows. The three observation stations,Hulu-1, Hulu-2 and Hulu-3, were similar in elevation and had a predominantly grassland landscape type (Table 1). In addition, the precipitation type at each station was dominated by liquid precipitation, accounting for more than 70% of the total precipitation. During precipitation,these stations had low wind speed and high air temperature (Tables 2 and 3). The correcting results of measurements of TRwS204 and TRwS504 gauges using the new parameters under similar environmental conditions are shown in Figure 6. As can be seen, the three stations had the highest RP values for snowfall and the lowest RP values for rainfall (Fig. 6). The RP values of solid and mixed precipitation at Hulu-3 station were similar to those of solid and mixed precipitation at Hulu-1 station. However, the RP values of liquid precipitation at both stations were much different. The RP values for all precipitation types at Hulu-2 station were higher than those of other stations, especially the RP values for snowfall.
The new parameters performed better at higher-altitude stations (Hulu-4, Hulu-5 and Hulu-6)(Fig. 6). The RP value of solid precipitation was the highest, while that of liquid precipitation was the lowest. The RP values of different precipitation types increased with increasing altitudes.Taken together, although different environmental conditions could be found among different stations, the new parameters could improve the measurements of rain, snow and mixed precipitation, indicating their applicability to correct the observation of the whole CHOICE system.

Table 3 Average wind speed and air temperature, maximum wind speed and different types of precipitation at other five stations during precipitation
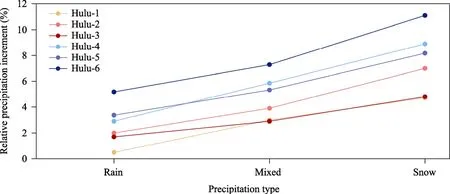
Fig. 6 Relative precipitation (RP) increments for six observation stations (Hulu-1, Hulu-2, Hulu-3, Hulu-4,Hulu-5 and Hulu-6) after the correction of the new parameters fitted to the dataset from Hulu-1 station
4 Discussion
4.1 Factors impacting precipitation measurements at Hulu-1 station of the CHOICE system
Hulu-1 station of the CHOICE system has the lowest elevation in the Hulu Watershed. And it is surrounded by high mountains and has a large altitude span, resulting in a low average wind speed.The low elevation and high air temperature lead to a high percentage of liquid precipitation at Hulu-1 station of the CHOICE system. During precipitation, most wind speeds measured at the orifice of TRwSSAwere lower than that measured at 1.5 m height, resulting in the high CE values for liquid, solid and mixed precipitation. In addition, because the average wind speeds during precipitation were mainly concentrated on 0-3 m/s, the scattering of CE values of different types of precipitation decreased with increasing wind speed. A reason for the scattering at low wind speeds may be the influence of wind on the size distributions of different types of particles. Cai et al. (2019) conducted a numerical simulation of wind turbulence for a CSPG (70 cm in height)equipped with Alter and Tretyakov wind shields. The results showed that the vortex core area at the top of the gauge with a Tretyakov shield was smaller than that with an Alter shield at low wind speeds, which was more beneficial to precipitation collection. At Hulu-1 station of the CHOICE system, more turbulent wind fields may exist above the height of TRwSSAunder low wind speeds, affecting the collection efficiency of TRwSSA. In addition, a light precipitation event is defined as the accumulative precipitation below 0.70 mm within a 30-min period (Wang et al.,2017). The light precipitation events accounted for a high proportion when the average wind speed was between 0 and 3 m/s. Among these light precipitation events, light snow and light mixed precipitation events accounted for 96% and 72% of the total precipitation events,respectively, while light rain events accounted for 43% (Fig. 3a). These results showed that light precipitation events, holding a large proportion, might increase data scatter under the influence of wind field above the height of TRwSSA. Moreover, the relationship between particle size and wind around the gauge had a significant impact on the undercatch (Duchon and Essenberg, 2001;Theriault et al., 2012). However, because we had no instruments to study the influence of particle size and the change of wind field, the resultant errors of precipitation measurement could not be quantified. Another reason could be the classification of precipitation types using average air temperature at Hulu-1 station of the CHOICE system. Since Hulu-1 station was located in a mountainous area with a changeable climate, snowfall might be observed at 30-min average air temperature of above 0℃, and rainfall might also be observed at 30-min average air temperature of below 0°C. Therefore, defining 30-min average air temperature range from -2°C to 2°C as mixed precipitation would produce a high number of mixed precipitation events, increasing data scattering. A study has shown that average air temperature of 30-min solid precipitation and 30-min liquid precipitation in the Hulu Watershed are 0°C and 3°C, respectively (Chen et al.,2014). Liu and Chen (2016) used the results of digital photogrammetry to check and correct the threshold of half-hourly air temperature for separating precipitation into rain, snow and mixed precipitation. After two-year (2012-2013) observations of precipitation types at the basin scale,they concluded that air temperature threshold between rain and snow in the Hulu Watershed was usually 0°C, while air temperature threshold between liquid and mixed precipitation was not significant. This suggested that the range of average temperatures used by Kochendorfer et al.(2017b) to classify precipitation types resulted in some uncertainties to the correction and assessment, and increased the scatter of CE values for observed liquid, solid and mixed precipitation. As a result of the above factors, the accuracy of adjustment results of the ''universal''transfer functions from Kochendorfer et al. (2017b) was reduced, while the new parameters suitable for the local dataset had a better performance.
4.2 Effects of environmental conditions and gauge types on precipitation measurements
Compared with Hulu-1 station, Hulu-2 and Hulu-3 stations of the CHOICE system had similar environmental conditions but different automatic weighing gauges: TRwS504 at Hulu-2 station,but TRwS204 at Hulu-1 and Hulu-3 stations. The differences between TRwS204 and TRwS504 gauges are orifice areas and capacities. The orifice area of these common-type gauges had little effect on the increase in wind speed (Sevruk and Nespor, 1994) and thus could be ignored in the CHOICE system. However, the instrument sensitivity might be related to the capacity differences of these weighing gauges (Kochendorfer et al., 2018). Kochendorfer et al. (2017a) found higher values of RMSE and lower values of PE0.1mmfor a 1500-mm single-Alter Geonor T-200B gauge than those for a 600-mm single-Alter Geonor T-200B gauge at the same station. The uncertainty arising from the effect of different capacities on gauges was also likely to present during observation and correction. Since it was not clear what caused this uncertainty, we failed to distinguish it from the influences caused by other factors, such as wind and air temperature.However, the new transfer functions could significantly improve the liquid, solid and mixed precipitation measurements at Hulu-2 station. Therefore, TRwS204 and TRwS504 measurements could be adjusted by the new transfer functions. In addition, because the ''universal'' transfer functions from Kochendorfer et al. (2017b) were mainly used to correct solid precipitation, the RP values of snowfall for the three stations (Hulu-1, Hulu-2 and Hulu-3) were the highest. The main reason for the lowest RP values at Hulu-1 station might be the higher rainfall and lower wind speed during precipitation, causing the high CE values of precipitation measurements at this station. Despite the significantly different environmental conditions between those stations and Hulu-1 station, the higher altitude stations (Hulu-4, Hulu-5 and Hulu-6) presented the better performance of new transfer functions. The main factor affecting CE values of TRwS gauges was wind speed at these six stations. Low wind speed during precipitation might constitute the leading factor that allowed the new parameters to be used to correct the measurements at Hulu-4, Hulu-5 and Hulu-6 stations.
5 Conclusions
This paper studied the influence of climatic conditions on the measurements of different types of precipitation by a TRwS204 gauge and tested the applicability of the ''universal'' transfer functions from Kochendorfer et al. (2017b) at Hulu-1 station. Moreover, we calculated the new parameters in transfer function better suited to the local dataset and applied them to the entire CHOICE system for performance evaluation.
At Hulu-1 station, the measured wind speed was not the actual wind speed that affected the precipitation measurements, resulting in the high CE values for the measurements of different types of precipitation at high wind speeds. In addition, the scatter of data decreased with increasing wind speed due to the lack of precipitation events under high wind speeds. The significant scattering of CE under low wind speeds can be attributed to the wind field above the gauge exerted an influence on the distribution of different types of precipitation; furthermore, air temperature ranging from -2°C to 2°C was used for the classification of precipitation types.Therefore, the new parameters were more suitable for correcting the precipitation measurements at Hulu-1 station. The data correction for other stations in the CHOICE system with the new parameters indicated improved measurements of liquid, solid and mixed precipitation. The new parameters can be used to correct the measurements of precipitation for the entire CHOICE system.
Acknowledgements
This study was funded by the National Natural Sciences Foundation of China (42171145, 41690141, 41971041,42101120) and the Joint Research Project of Three-River Headwaters National Park, Chinese Academy of Sciences and Qinghai Province, China (LHZX-2020-11). The authors would also thank all the colleagues participating in the field experiments.
- Journal of Arid Land的其它文章
- Erratum to: Dieback intensity but not functional and taxonomic diversity indices predict forest productivity in different management conditions: Evidence from a semi-arid oak forest ecosystem
- Erratum to: Predicting of dust storm source by combining remote sensing, statistic-based predictive models and game theory in the Sistan watershed,southwestern Asia
- Effects of vegetation near-soil-surface factors on runoff and sediment reduction in typical grasslands on the Loess Plateau, China
- Effects of climate change and land use/cover change on the volume of the Qinghai Lake in China
- Variation of soil physical-chemical characteristics in salt-affected soil in the Qarhan Salt Lake, Qaidam Basin
- Identifying water vapor sources of precipitation in forest and grassland in the north slope of the Tianshan Mountains, Central Asia

