
Spatial and temporal patterns of solar radiation in China from 1957 to 2016
2022-03-22 10:50:00PeiDuLiXiaoQingGaoJunXiaJiangLiWeiYangYuJieLi
PeiDu Li,XiaoQing Gao,JunXia Jiang,LiWei Yang,YuJie Li
1.Key Laboratory of Land Surface Process and Climate Change in Cold and Arid Regions, Northwest Institute of Eco-Environment and Resources,Chinese Academy of Sciences,Lanzhou,Gansu 730000,China
2.University of Chinese Academy of Sciences,Beijing 100049,China
ABSTRACT Solar energy is clean and renewable energy that plays an important role in mitigating impacts of environmental problems and climate change.Solar radiation received on the earth's surface determines the efficiency of power generation and the location and layout of photovoltaic arrays.In this paper, the average daily solar radiation of 77 stations in China from 1957 to 2016 was analyzed in terms of spatial and temporal characteristics.The results indicate that Xinjiang, the Qinghai-Tibet Plateau,North,Central and East China show a decreasing trend with an average of 2.54×10⁻³ MJ/(m2·10a),while Northwest and Northeast China are basically stabilized,and Southwest China shows a clear increasing trend with an average increase of 1.79×10⁻³ MJ/(m2·10a).The average daily solar radiation in summer and winter in China from 1957 to 2016 was 18.74 MJ/m2 and 9.09 MJ/m2, respectively.Except for spring in Northwest, East and South China, and summer in northeast China, the average daily solar radiation in all other regions show a downward trend.A critical point for the change is 1983 in the average daily solar radiation.Meanwhile, large-scale (25-30 years) oscillation changes are more obvious, while small-scale (5-10 years) changes are stable and have a global scope.The average daily solar radiation shows an increasing-decreasing gradient from west to east,which can be divided into three areas west of 80°E,80°E-100°E and east of 100°E.The average daily solar radiation was 2.07 MJ/m2 in the 1980s,and that in 1990s lower than that in the 1960s and the 1970s.The average daily solar radiation has rebounded in the 21st century, but overall it is still lower than the average daily solar radiation from 1957 to 2016(13.87 MJ/m2).
Keywords:average daily solar radiation;temporal variability;spatial distribution characteristics;China
1 Introduction
Solar radiation is the main energy source of the earth, and plays an essential role in the formation of surface radiation balance,energy exchange,hydrological cycle, vegetation photosynthesis, and the formation of atmospheric climate (Pinkeret al., 2005; Wildet al., 2005; Xiaoet al., 2020; Yuet al., 2020).The only heat source for atmospheric movement is solar radiation, which is the basic energy to control the climate (Blalet al., 2020).The spatial and temporal distribution of solar radiation on the earth determines the operation and is an important parameter in the process of climate formation and evolution (Rycroftet al.,2000).Since the 1960s,solar radiation has declined to varying degrees in most parts of the world, including Africa,Asia,Europe,and North America(Gilgenet al.,1998).This phenomenon is called "global dimming"(Stanhill and Cohen, 2001).After 1980, the "darkness"trend has slowed down, and global solar radiation began to rise in 1990, with a "global brightening" trend(Wildet al., 2005).The change in solar radiation received at a certain point at the top of the atmosphere is also very small due to the small change in the distance between the sun and the earth (Brock, 1981),but the change in solar radiation reaching the earth's surface is relatively large, mainly due to cloudiness(Armstrong and Hurley, 2010), atmospheric composition(Qianet al.,2006;Qianet al.,2007),water vapor content (Tarasova and Fomin, 2000; Lopezet al.,2018) and atmosphere suspended matter which absorbs,scatters and reflects solar radiation(Furlanet al.,2012; Zhaoet al., 2019) to varying degrees.Therefore,the study of temporal and spatial changes of solar radiation can not only infer atmospheric composition and changes, analyze atmospheric pollution, but also help to understand regional climate change.In addition,traditional energy sources are becoming increasingly depleted and environmental problems are caused during consumption (Obama, 2017; Mostafaeipouret al.,2019; Wanget al., 2019; Fenget al., 2020).Solar energy, as a clean renewable energy source (Kaplan and Kaplan,2020),is gradually becoming an important alternative energy source (Wilberforceet al., 2019),which is of great strategic significance for the sustainable development of the world's economy.
Apart from that, with the rapid development of economy and population, the energy demand will increase two-fold (Lewis and Nocera, 2007).However,traditional energy resources in the world are running out (Shafiee and Topal, 2009).Meanwhile, the burning of fossil fuel can lead to problems of environmental pollution and climate change (Perera, 2017), faced with a severe challenge of energy consumption and global ecological deterioration (Valipour, 2012; Obama,2017; Zou, et al., 2017).Solar energy is an important,alternative,renewable energy for fossil fuels,and mitigating impacts of environmental problems and climate change (Hernandezet al., 2014).Various studies indicate that solar photovoltaic power generation by 2100 will meet 20%-29% of global electricity demand (32,700-133,000 GW) (Breyeret al., 2017,Choiet al., 2020).At the same time, the widespread use of solar energy is one of the ways for China to achieve its carbon neutral goal (Pollitt, 2020).Therefore, it is important to understand the changing laws,periodic and spatial distribution characteristics of solar radiation for the deployment of solar photovoltaic panels and the utilization of solar resources.
China has been reliant on solar radiation since the 1950s.Some studies have shown that solar radiation has declined in China and other regions since 1960(Zhanget al.,2004,Liang and Xia,2005).Due to limitations of observational data, most of the data on solar radiation research started around 2000.There have been few studies on the phenomenon of "brightening"after the 1990s(Liang and Xia,2005),and many studies have focused on the study of single-point observed radiation (Zhanget al., 2003; Zhanget al., 2004; Linet al., 2019;Wanget al., 2019), and research on characteristics of spatiotemporal changes of solar radiation in a large area is relatively weak.In this paper,we selected solar radiation data for the past 60 years,from 1957 to 2016, with 77 site points.We analyze the characteristics of spatiotemporal changes of solar radiation to provide data support for climate research and sustainable use of solar energy resources in China.
2 Data and methods
2.1 Data
In this study, the daily solar radiation dataset is composed of 77 stations,managed by the China Meteorological Data Network (https://www.nmic.cn/).The data time span is from 1957 to 2016,involving a complex natural environment and diverse climate types of China.Thus, China is divided into the following nine regions: (I) Xinjiang, (II) the main body of the Qinghai-Tibet Plateau (Tibet, Qinghai), (III) Northwest China (Shaanxi, Gansu, Ningxia), (IV) North China(Beijing, Tianjin, Hebei, Shanxi, Inner Mongolia),(V) Southwest China (Chongqing, Sichuan, Guizhou,Yunnan), (VI) East China (Shanghai, Jiangsu, Zhejiang, Anhui, Shandong), (VII) South China (Guangdong, Guangxi, Hainan, Fujian), (VIII) Central China(Jiangxi, Henan, Hubei, Hunan), and (IX) Northeast China (Liaoning, Jilin, Heilongjiang) (Qiet al., 2014).The surface solar radiation tendency characteristics were analyzed in nine regions.
2.2 Methods
The characteristics of interannual variations of the average daily solar radiation was analyzed by drawing a trend line in each region,and fitting a linear formula which is presented in Equation(1).
The trend change of average daily solar radiation was judged by the slope rateaof the formula (Guet al.,2020).
The seasonal variation on average daily solar radiation during the year was analyzed by the Mann-Kendall trend test.This test does not make strict assumptions of the distribution of variables, and does not target specific parameters, but vaguely tests the center position or distribution state of the variable distribution.Because this test does not make strict assumptions of the overall distribution, it is highly applicable(Mann, 1945; Kendall, 1948; Lopez-Morenoet al.,2020).Therefore, the non-parametric Mann-Kendall test (Fenget al., 2020) was used to test the significance of the surface solar radiation time series in China over the past 60 years, quantitatively reflecting the significance of the changing trend.
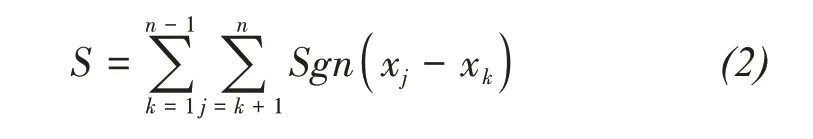
For the original data series such asxi(i=1, 2, …,n),Fi(x) is the distribution function of the data seriesxi.The original hypothesisH0is the original data sequence ofx1, … ,xn, which is an independent and identically distributed sample of random variables,that is, the sequence has trend characteristics.The alternative hypothesisH1is a bilateral test, and the distributions ofxkandxjare different from allk,j≤n,andk≠j.The formula for constructing the test statistics is presented as(2):
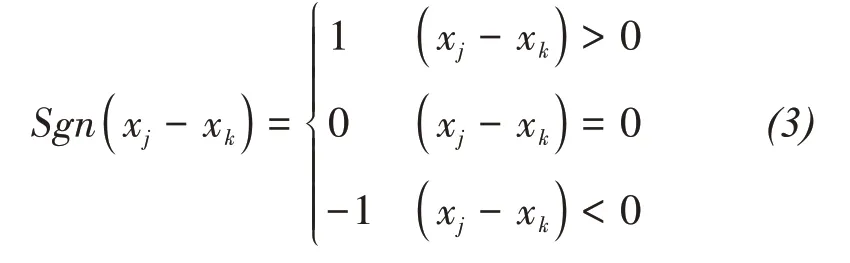
TheSgn(x)function is as follows:
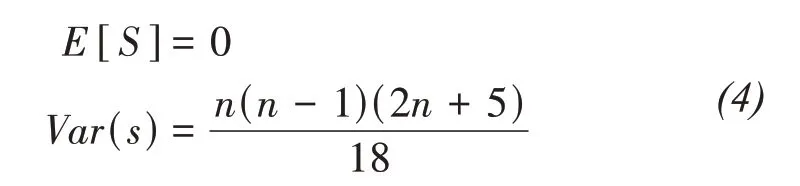
In the formula, the statisticSis approximately normal distribution, and its expectation and variance are presented in Formula(4):
When the number of samplesn≥10, the standardizationSis presented in Equation(5):
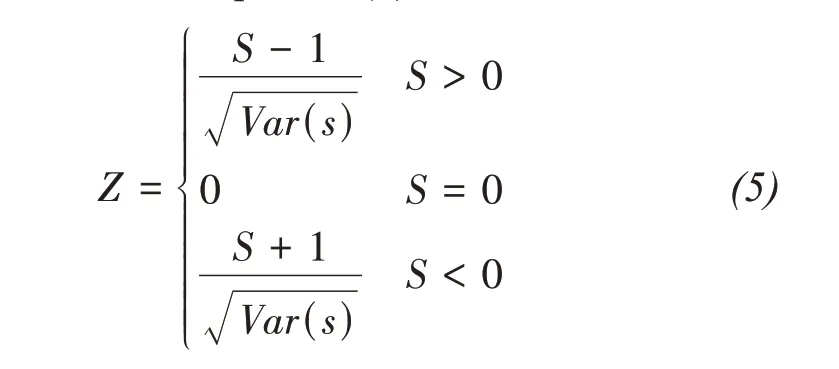
In the bilateral test, given a significance levelα,when -Z1-α/2≤Z≤Z1-α/2, accept the null hypothesis; whenZ<-Z1-α/2, indicates that the solar radiation sequence has a significant downward trend; whenZ>Z1-α/2, indicates that the solar radiation sequence has a significant increase trend.When the values are greater than or equal to 1.28, 1.64, and 2.32, respectively, it indicates that the significance tests with confidence level of 90%,95%,and 99%are passed in sequence.
The characteristics of the average daily solar radiation period from 1957 to 2016 were analyzed by the Morlet wavelet.It is a commonly used wavelet function in the form of complex numbers.Its expression is

The continuous wavelet transform of the discrete time seriesxn(n=0, …,N-1) can be defined as the convolution of the functionψ0(η) andXncontaining the scale parametersand the translation parametern
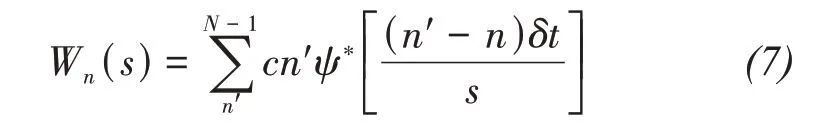
In the formulaW(s), the wavelet transform coefficient;*,complex conjugate relationship.
Integrate the square value of the wavelet coefficients in thendomain to obtain the wavelet variance,that is
The variation process of wavelet variance with scaleSis called wavelet variance map.It can be seen from Equation(8)that it can reflect the energy distribution of signal fluctuation with scaleS.Therefore,the wavelet variance map will determine the relative intensity of the disturbances of different scales in the signal and the main time scale,namely,the main period.
3 Results
3.1 Temporal variability in daily solar radiation
3.1.1 Characteristics of interannual variation of average daily solar radiation
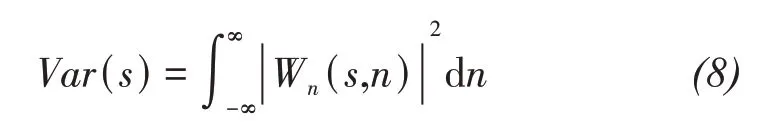
The average daily solar radiation changes in China from 1957 to 2016 are presented in Figure 1.Overall, the average daily solar radiation in Xinjiang, Qinghai-Tibet Plateau, North, Central and East China shows a decreasing trend; the average daily solar radiation in northwest, northeast and South China tends to be stable; the average total daily solar radiation shows an increasing trend in Southwest China.The average daily solar radiation in Xinjiang from 1957 to 1978 was 16 MJ/m2, which was higher than the average daily solar radiation from 1957 to 2016,15.14 MJ/m2; the average daily solar radiation from 1979 to 2010, 14.85 MJ/m2is lower than 15.14 MJ/m2;the average daily solar radiation after 2011 is 15.83 MJ/m2,which is above the average level.Overall, the total daily solar radiation in Xinjiang showed a decreasing trend, with a rate of -1.92×10⁻³MJ/(m2·10a).The growth rate of the total daily solar radiation on the Qinghai-Tibet Plateau is -2.72×10⁻³MJ/(m2·10a).The average total daily solar radiation from 1957 to 1981 is 18.64 MJ/m2, which is higher than the average value of 17.48 MJ/m2.The average daily solar radiation during 1982-1992 was lower than the average, which was 16.04 MJ/m2; the average daily solar radiation from 1993 to 2016 was above the average level,which was 17.81 MJ/m2.The average daily solar radiation in North China from 1957 to 1975 and 2013 to 2016 is above the multi-year average level, which is 15.83 MJ/m2and 15.79 MJ/m2,respectively.The amount is lower than the multi-year average of 14.98 MJ/m2,and the average daily solar radiation growth rate is-2.12×10⁻³MJ/(m2·10a).The average daily solar radiation growth rates for Central and East China were-4.05×10⁻³MJ/(m2·10a) and -1.90×10⁻³MJ/(m2·10a),respectively, and the average daily solar radiation in Central China from 1957 to 1979 was 13.40 MJ/m2,which is higher than the average value of 12.39 MJ/m2for many years (1927-2016), and the average daily solar radiation after 1979 is below the average level of 11.77 MJ/m2.The average daily solar radiation in east China from 1957 to 1974 and after 2010 was 13.49 MJ/m2and 12.95 MJ/m2, respectively, which was higher than the multi-year average value of 12.64 MJ/m2.The average total daily solar radiation during 1975-2010 is lower than the multi-year average of 12.16 MJ/m2.
Figure 1 Average daily solar radiation changes(a,Xinjiang;b,Qinghai-Tibet Plateau;c,Northwest China;d,Southwest China;e,Northeast China;f,North China;g,Central China;h,East China;i,South China)in China during 1957-2016
The average daily radiation in Northwest,Northeast and South China did not show a sharp fluctuation trend around the mean line.The average daily solar radiation growth rates were-0.5×10⁻²MJ/(m2·10a),0.3×10-2MJ/(m2·10a) and -4.8×10⁻²MJ/(m2·10a),respectively.The average daily radiation in the three regions fluctuated more during the period from 1957 to 1960 and after 2010 than in other research periods.The multi-year average daily radiation was 15.80 MJ/m2, 13.05 MJ/m2, and 12.93 MJ/m2,respectively.
The average annual total daily radiation in Southwest China is 12.65 MJ/m2, and the average daily total radiation from 1957 to 2000 has basically stabilized.The average daily radiation is 12.60 MJ/m2.After 2000, the amount increased significantly, with an average total daily radiation of 13.93 MJ/m2, which generally showed an increasing trend.
The cumulative anomaly curve of the average daily radiation amount is plotted (Figure 2) in order to present the phase characteristics of the change in the average daily solar radiation amount.Overall, the average daily solar radiation from 1957 to 2016 has experienced an increasing-decreasing-increasing change process, and before 2000 the characteristic displayed an inverted v-shaped pattern.
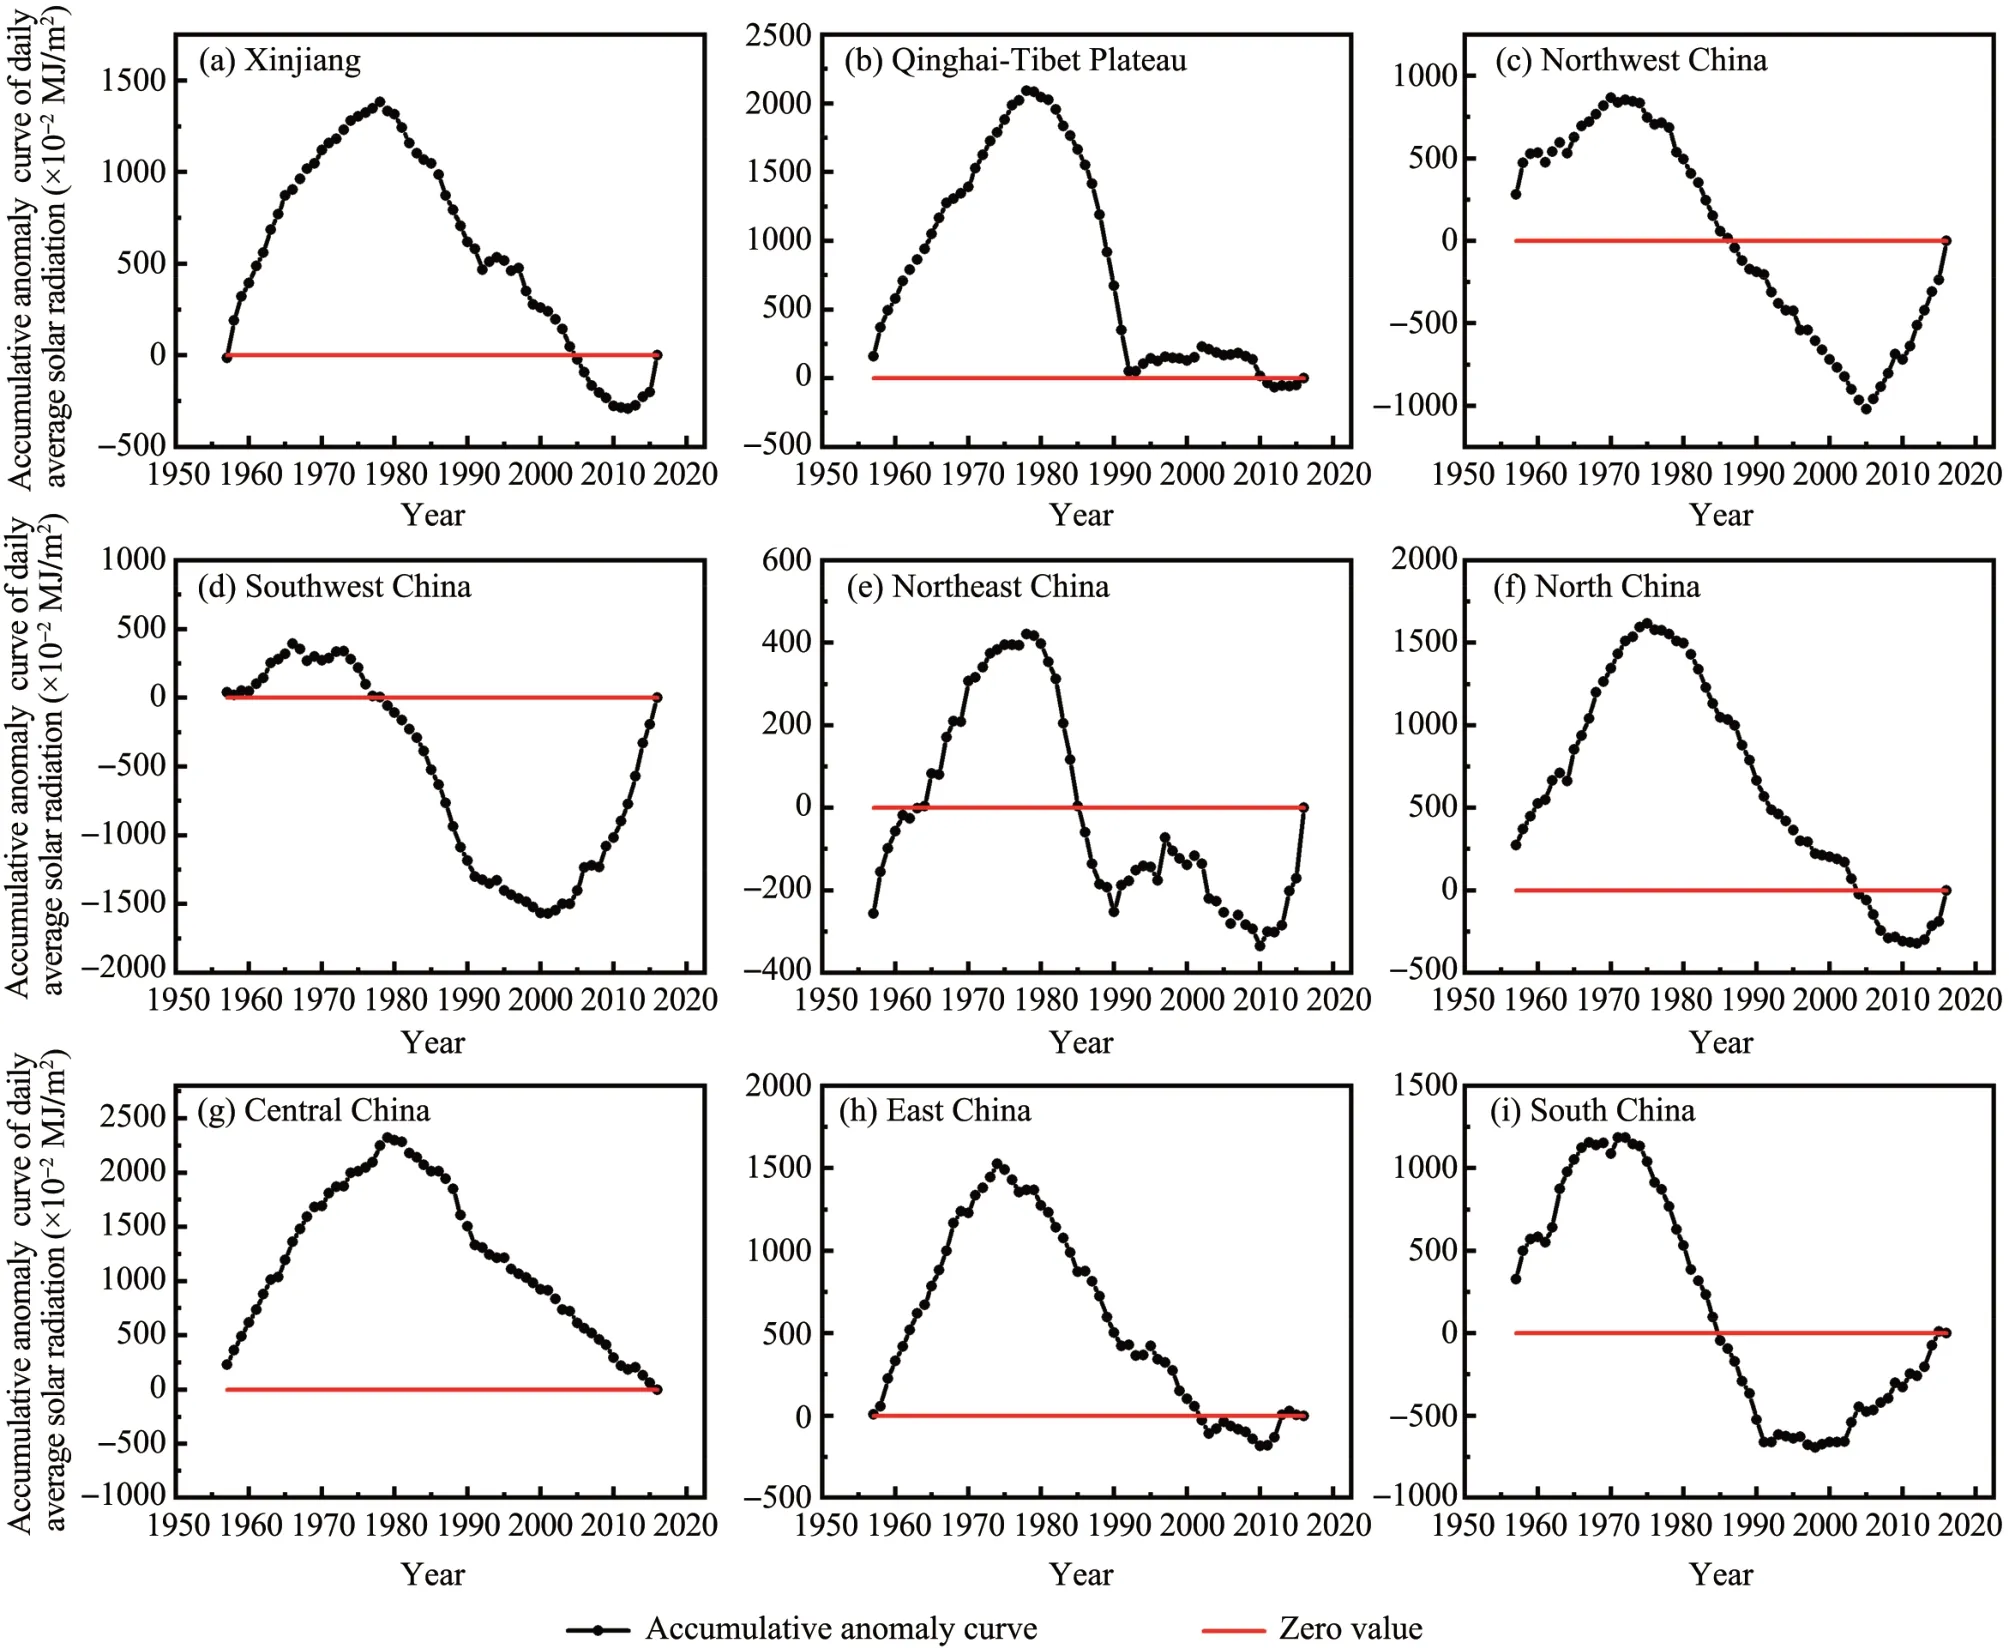
Figure 2 Accumulative anomaly curve of daily average solar radiation(a,Xinjiang;b,Qinghai-Tibet Plateau;c,Northwest China;d,Southwest China;e,Northeast China;f,North China;g,Central China;h,East China;i,South China)in China during 1957-2016
The average daily solar radiation change in Xinjiang can be divided into three stages: 1957-1978,2012-2016 increasing stage and 1979-2011 decreasing stage.The Qinghai-Tibet Plateau has also gone through three stages, from 1957 to 1992 with 1978 as the limit,divided into two processes of increase and decrease,and the changes have been basically stable after 1992.The average daily radiation in Northwest China increased from 1957 to 1972, decreased significantly from 1973 to 2005, and then increased significantly.An obvious increasing trend occurred from 1957 to 1966 and 2001 to 2016, showing a decreasing trend from 1967 to 2000 in Southwest China.The trend of average daily solar radiation can be divided into two stages before 1990 in Northeast China.An upward trend is obvious from 1957 to 1978,and it has a significant downward trend from 1979 to 1990.The average daily radiation after 1990 is at a negative anomaly level,but it fluctuates greatly.A clear downward trend occurred from 1997 to 2010.The average daily radiation in North China is in an obvious rising phase from 1957 to 1975 and 2012 to 2016, and the average daily radiation is in a declining phase in 1976 to 2011.The average daily total radiation in Central China from 1957 to 2016 can be divided into two stages, the rising stage from 1957 to 1979, and the declining stage from 1980 to 2016.The average total daily radiation in East China was in an obvious rising stage from 1957 to 1974, and a declining stage from 1975 to 2003.After 2003, fluctuations were basically small and stable.The average daily radiation in South China can also be divided into three stages, the rising stage from 1957 to 1972 and 1992 to 2016 and the falling stage from 1973 to 1991.
3.1.2 Characteristics of annual variation of mean daily solar radiation
Obvious, seasonal variation characteristics of the average daily solar radiation from 1957 to 2016 are presented in Table 1.The average daily solar radiation in nine regions of China is the largest in summer compared to other seasons, while the lowest in winter.Among them, the average daily radiation in summer in Xinjiang is the largest in nine regions, at 24.35 MJ/m2;the average daily radiation in winter in Central China is the smallest, at 5.06 MJ/m2.The maximum average daily solar radiation in summer decreases in the order of Xinjiang, Qinghai-Tibet Plateau, Northwest China,North China, Northeast China, East China, Central China, South China, and Southwest China.Although the average daily solar radiation in the southwestern region is the smallest in summer, according to the Mann-Kendall trend test results,the average daily radiation test valuesZin the southwestern four seasons are 1.83, 0.85, 1.41, and 2.03, and the test values are positive, its changes show an increasing trend.Except for spring in Northwest, East and South China,and summer in Northeast China,the average daily radiation in all regions show a downward trend in all seasons.
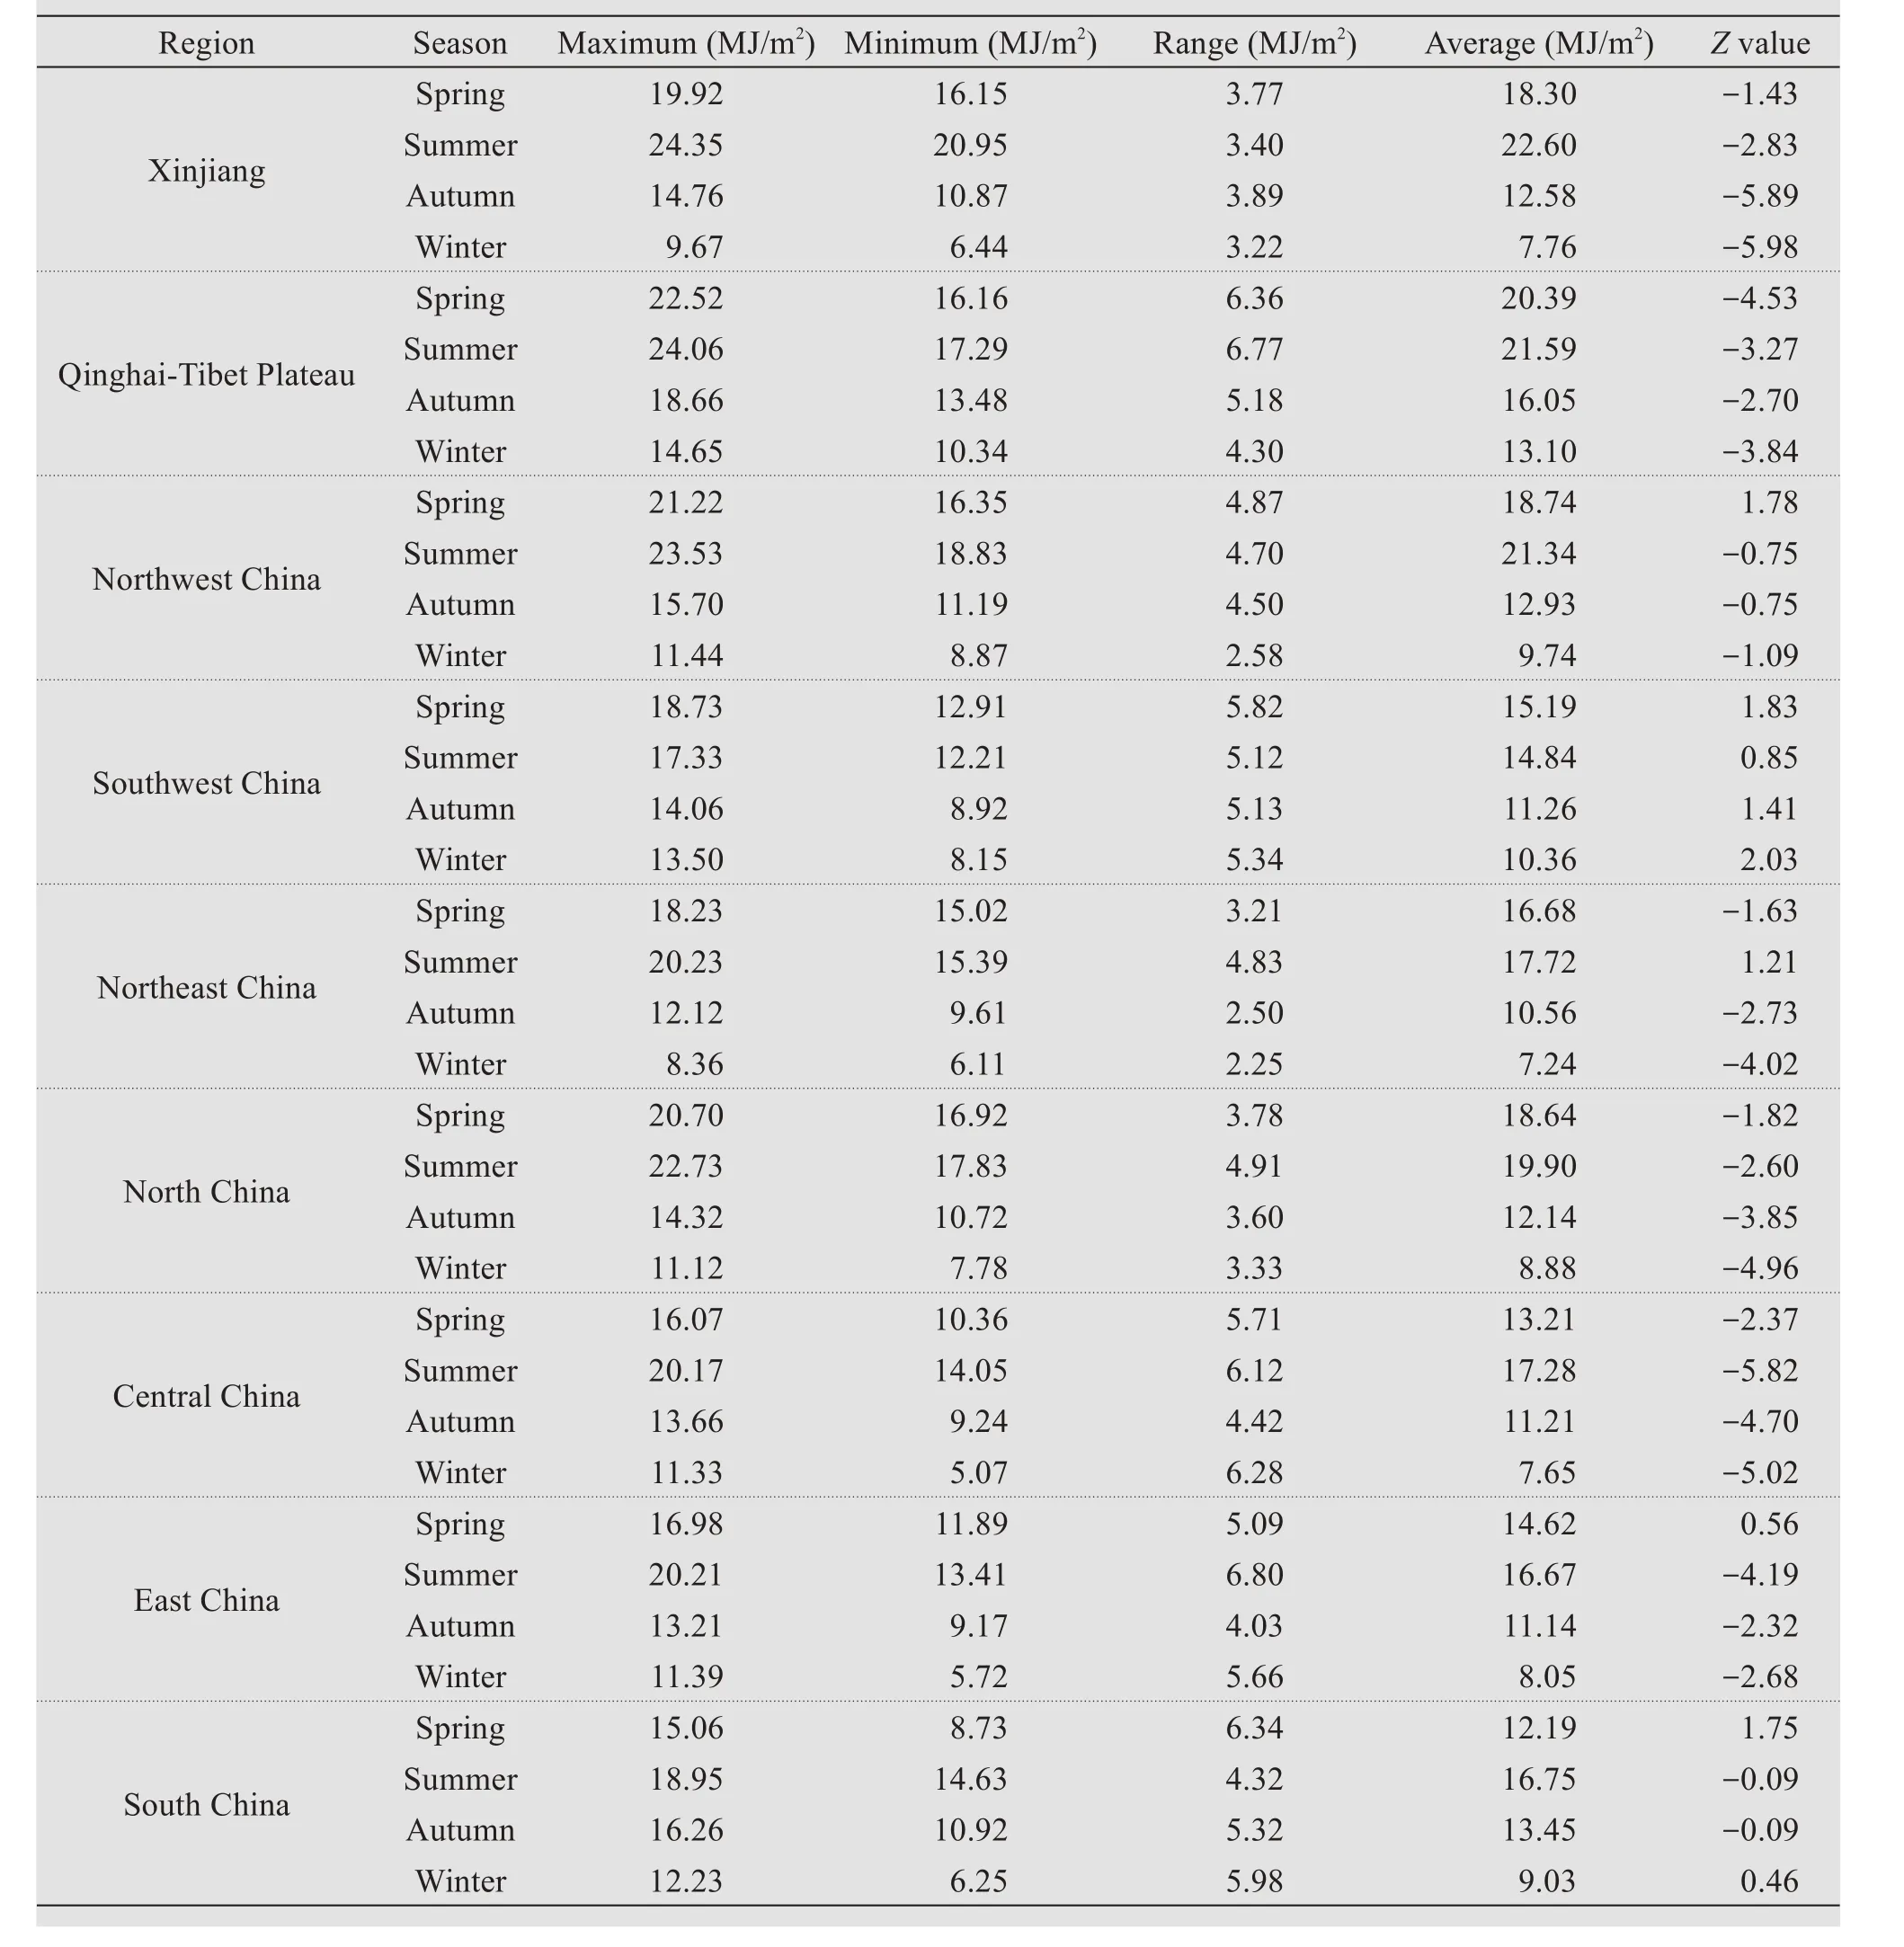
Table 1 Statistics on seasonal characteristic value of average daily radiation in China during 1957-2016
3.2 Variation characteristics of the periodic law of average daily solar radiation
It can be seen from Figure 3 that characteristics of the time scale change from 25 to 30 years are obvious, and there are 3.5 cycles of abundance changes in the study time range.The change of the scale of 25 to 30 years appeared repeatedly and alternately seven times, showing the characteristics of abundance-withdrawal from 1957 to 1980.Around 1986,the 26-year scale appeared dry in all nine regions,which was also a demarcation point in the study time domain.From 1996 to 2016, the 26-year time scale once again presented characteristics of abundancewithdrawal.This change is more consistent in nine regions of China.
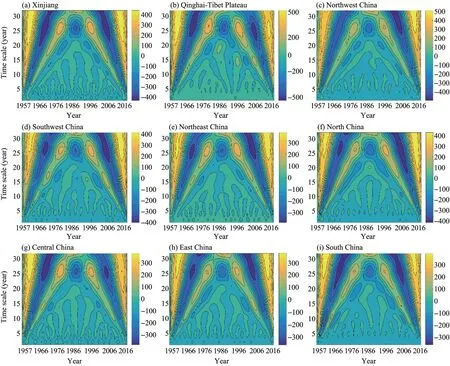
Figure 3 Daily average solar radiation of the real part of the wavelet contour map(a,Xinjiang;b,Qinghai-Tibet Plateau;c,Northwest China;d,Southwest China;e,Northeast China;f,North China;g,Central China;h,East China;i,South China)in China
In Xinjiang, the 5-10 years' scale alternately appeared throughout the study period, showing a relatively stable change characteristic.Changes in the 5-10 years' scale in other areas are more consistent with those in Xinjiang.The variation characteristics of the nine regions on the 10-20 years' scale are not the same.Among them, Xinjiang, Qinghai-Tibet Plateau,North,Central,East,and South China have obvious features on the 10-20 years' time scale in 1986.The performance was obvious in 1976.During the study period, the large-scale characteristic oscillation changes are more obvious, and the small-scale change characteristics are stable and have a global scope.
It can also be seen from Figure 4 that there is a clear peak at the nine regions, corresponding to the 26-year scale feature, which further shows that the 26-year scale featured are the boundary pointed within the research time range.Namely, a watershed in total solar radiation is the year of 1983 for the average day from 1957 to 2016.
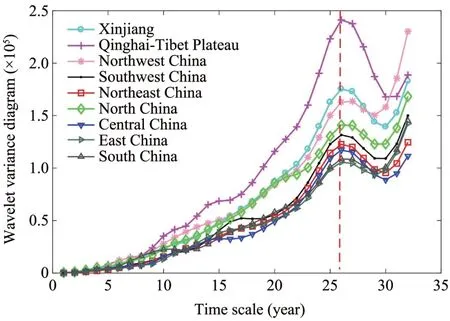
Figure 4 Wavelet variance diagram of daily average solar radiation in China
3.3 Spatial distribution characteristics of average daily solar radiation
It can be seen that spatial distribution characteristics of the average daily solar radiation are more consistent in the 1960s to the 2000s and 1957 to 2016(Figure 5).To the east, there is an increasing-decreasing gradient.From a numerical point of view, the average daily solar radiation in the 1960s and the 1970s is stronger than that in the 1980s and the 1990s,which is 2.07 MJ/m2higher, and the average daily solar radiation in the 2000s is higher than that in the 1980s and the 1990s.But overall it is still lower than the average daily solar radiation value of 13.87 MJ/m2from 1957 to 2016.
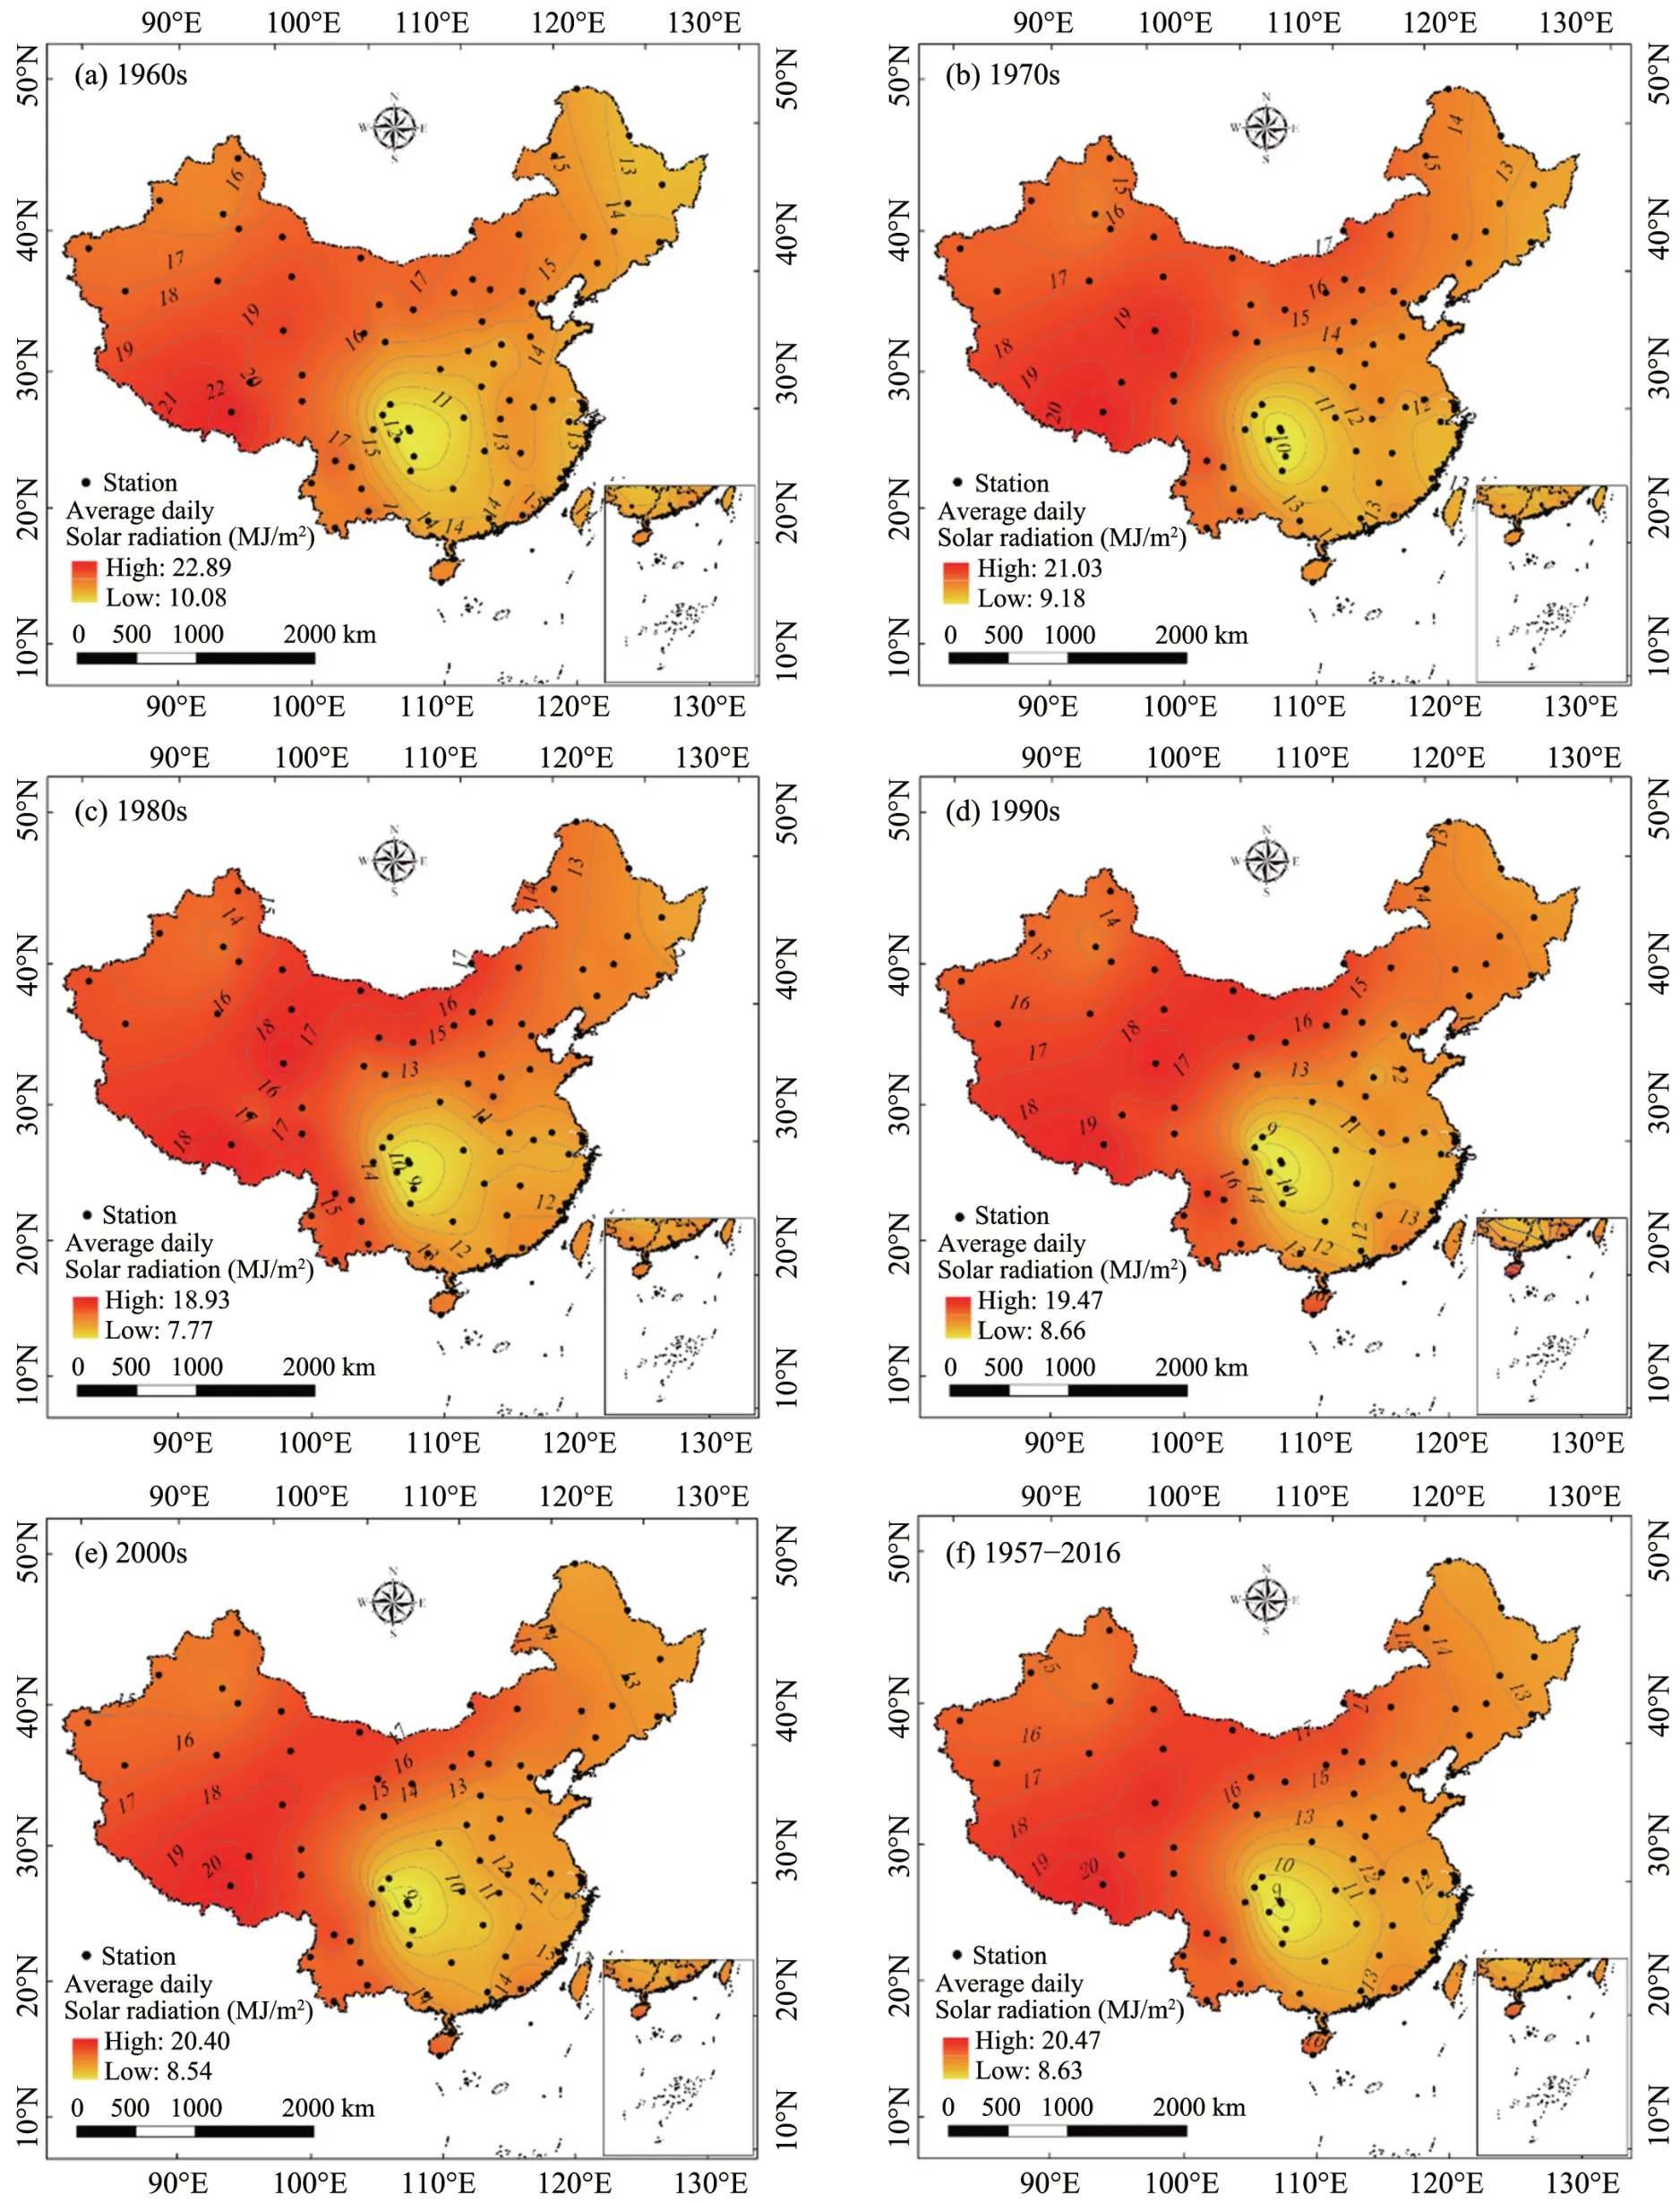
Figure 5 The spatial distribution characteristics of daily average solar radiation in China from 1957 to 2016[GS(2019)1822](a,1960s;b,1970s;c,1980s;d,1990s;e,2000s;f,1957-2016)
In general, the average daily solar radiation in each era can be divided into three gradients: west of 80°E,80°E-100°E,and east of 100°E.
The average daily solar radiation west of 80°E is 15.96 MJ/m2from 1957 to 2016, 16.67 MJ/m2from 80°E to 100°E,and 13.31 MJ/m2east of 100°E.
The average daily solar radiation in the 1960s and 1970s west of 80°E is 16.71 MJ/m2and 16.37 MJ/m2,respectively, with an average of 80°E-100°E it is 17.52 MJ/m2and 17.04 MJ/m2, respectively.The average daily solar radiation to the east of 100°E is 14.12 MJ/m2and 13.32 MJ/m2in the 1960s and 1970s.
The average daily solar radiation in the 1980s and the 1990s west of 80°E was 15.23 MJ/m2and 16.18 MJ/m2, respectively.80°E-100°E was 15.72 MJ/m2and 16.15 MJ/m2, respectively.The average daily solar radiation to the east of 100°E is 12.47 MJ/m2and 12.91 MJ/m2, respectively.It can be clearly seen that the average daily solar radiation from the 1980s to the 1990s show a downward trend in the overall spatial distribution.
The average daily solar radiation in the 2000s west of 80°E is 15.37 MJ/m2, 80°E-100°E is 16.57 MJ/m2,and east of 100°E is 13.19 MJ/m2.The average daily solar radiation in the 2000s has increased compared with the previous generation.
From the perspective of a single site, the maximum averages daily solar radiation occurrence sites are consistent with the minimum in the study period.The average daily solar radiation at Lhasa Station is the largest at 20.47 MJ/m2, and at Shapingba Station is the smallest at 8.63 MJ/m2.
4 Conclusions and discussions
From 1957 to 2016, interannual variation characteristics of average daily solar radiation are obvious in China.The negative trend for average daily solar radiation appears in Xinjiang, the Qinghai-Tibet Plateau, North, Central and East China, with an average decrease of 2.54×10⁻³MJ/(m2·10a).These results are consistent with the studies of Cheet al.(2005),Lianget al.(2005), Tanget al.(2011), Wuet al.(2011), Fenget al.(2019), Yanget al.(2019) and Fanget al.(2021).The aforementioned study results were influenced by the solar zenith angle (Frohlich,1987), volcanic eruption such as the Pinatubo eruption in 1991 which affected atmospheric conditions(Nagelet al., 1998), cloud cover (Zhang and Ma,2020)and altitude.In general,the progress of solar radiation to the earth is complicated and is affected by numerous factors.Average daily solar radiation in northwest and Northeast China was basically stable,and the positive trend appears in Southwest China,with an average increase of 1.79×10⁻³MJ/(m2·10a).Northwest China is the region with the most abundant solar energy resources in China,and this trend may be related to terrain and altitude.The changing trend in Northeast China may be related to the duration of sunlight, but specific reasons need to be further studied.Solar radiation is affected by various factors such as terrain, water vapor, and aerosols (Droma, 2007).Yuet al.(2020) studied solar radiation changes during a clear day in arid and semi-arid areas of China from 2001 to 2005.Their results show that changes in sunny day solar radiation is consistent with aerosol effects.Lianget al.(2005) noted that aerosols have an impact on solar radiation by scattering and absorption effect.
Judging from the cumulative anomaly of average daily radiation, average daily solar radiation from 1957 to 2016 experienced an increase-decrease-increasing change process, presenting the characteristic inverted v-shape before 2000.This change may be related to cloud cover and air quality (Zhang and Li,2015;Langet al.,2017;Liuet al.,2020).
In further analysis, the seasonal variation of the average daily solar radiation from 1957 to 2016 is obvious.Total summer solar radiation is the largest with an average of 18.74 MJ/m2in China;it is the lowest in winter, with an average of 9.09 MJ/m2.Except for spring in Northwest, East and South China, and summer in Northeast China, the average daily solar radiation in all other regions shows a downward trend in all seasons.
In the analysis of average daily solar radiation from 1957 to 2016, a critical point in the change was in 1983; this change is governed by aerosol loading(Cheet al., 2005).At the same time, large-scale(25-30 years)oscillation changes were more obvious,and the small-scale(5-10 years)variation characteristics are stable and global.
In the space-time analysis of the average solar radiation from 1957 to 2016, average daily solar radiation shows an increasing-decreasing gradient from west to east, which can be divided into three areas:80°E to the west, 80°E to 100°E and east of 100°E.The distribution of average daily radiation solar is consistent with the three major trends of China's topography.Solar radiation in the Qinghai-Tibet Plateau is greater than in other region due to high latitude,sparse cloud cover, low water vapor content, high atmospheric transparency and thin air, which is consistent with the result of Yuet al.(2020).
The average daily solar radiation in the 1980s and 1990s was 2.07 MJ/m2lower than in the 1960s and the 1970s.The average daily solar radiation in the 21st century rebounded, but overall it is still lower than the average daily solar radiation from 1957 to 2016 (13.87 MJ/m2).From the perspective of a single site, the average daily solar radiation at Lhasa Station is the largest at 20.47 MJ/m2, while the smallest of 8.63 MJ/m2was at Shapingba Station.
Acknowledgments:
The authors appreciate the financial support provided by the National Key R&D Program of China(2018YFB1502800).
 Sciences in Cold and Arid Regions2022年1期
- Sciences in Cold and Arid Regions的其它文章
- Editor-in-Chief Yuanming Lai
- Guidelines to Authors
- Geographic range size patterns across plants and animals of Xinjiang,China
- Simulating the effect of wind erosion on aeolian desertification process of Horqin sandy land and its significance on material cycle:a wind tunnel study
- Desertification status mapping in Muttuma Watershed by using Random Forest Model
- Numerical simulation of vibrational response characteristics of railway subgrades with insulation boards