
Global Rainstorm Disaster Risk Monitoring Based on Satellite Remote Sensing
2022-03-12 07:52:18SulingRENXiuzhenHANJunYANGShihaoTANGYangZHANGTianchanSHANandChengLIU
Suling REN, Xiuzhen HAN, Jun YANG, Shihao TANG, Yang ZHANG, Tianchan SHAN, and Cheng LIU
1 National Satellite Meteorological Center, China Meteorological Administration, Beijing 100081
2 Heavy Rain and Drought–Flood Disasters in Plateau and Basin Key Laboratory of Sichuan Province, Chengdu 610072
ABSTRACT
Key words: satellite-retrieved precipitation, flood, rainstorm disaster risk monitoring, rainstorm disaster risk index
1. Introduction
Rainstorms and brief torrential rain can cause flooding, landslides, debris flow, urban waterlogging, and other natural disasters, causing serious casualties and economic losses. Flash floods caused by excessive rainfall are one of the most severe natural hazards in the world, presenting the most significant potential threat to the natural environment, human life, public health, and property (Kundzewicz et al., 2013). Since 1950, all very large and extreme floods in the Yangtze River basin (including the Huaihe River basin), such as in 1954, 1969, 1975, 1991,1998, 2003, 2007, 2010, and 2020, were caused by rainstorms, which caused huge losses to the country (Wang et al., 2003). Studies on rainstorm disasters include many aspects such as rainstorm flood disaster prediction, risk assessment of rainstorm disaster, zoning of flood disaster risk, and climatic characteristics of rainstorm disaster distribution.
Because the type of disaster caused by rainstorms is generally regional flooding, flood forecasting technology is an interdisciplinary field. Generally, hydrological models are used in flood forecasting, including empirical models, lumped conceptual hydrologic models, and distributed hydrological models (Freeze and Harlan, 1969).A distributed hydrological model, considering the spatial heterogeneity of precipitation and land surface with digital elevation model (DEM) elevation data, can simulate the impact of human activities and underlying surface factors on the hydrological cycle. With the development of meteorological science and technology and the advancement of observation techniques, radar precipitation and model forecast precipitation have been gradually applied to hydrological models to improve the accuracy (Ren et al.,2003; Bao et al., 2011).
Operational services for rainstorm disaster monitoring and prediction are in place in many countries. In rainstorm-caused flood monitoring, a hydrologic model is generally used. For example, the Australia Bureau of Meteorology flood forecasting and warning service uses rainfall and streamflow observations, numerical weather predictions, and hydrologic models to forecast possible flood events across Australia (http://www.bom.gov.au/australia/flood/). In India, during the flood season, the Flood Meteorological Offices (FMOs) provide valuable meteorological support to the Central Water Commission for issuing flood warnings in respect to many rivers.The real-time monitoring and statistical analysis of district-wide daily rainfall is one of the important functions of the Hydromet Division of India Meteorological department (IMD; https://mausam.imd.gov.in/). At the University of Maryland, USA, a Global Flood Monitoring System (GFMS) was developed using real-time satellite precipitation, hydrological runoff, and a routing model to create flood detection/intensity estimates, the latest maps of instantaneous precipitation and totals from the past day, three days, and seven days are also displayed (Wu et al., 2012, 2014). According to the above national operational flood monitoring systems, precipitation is a key factor in this kind of disaster.
Due to the need for disaster prevention and mitigation,risk classification and evaluation of rainstorm and flood disaster losses have been a focus of academic study in recent years (Chou et al., 2013). Since the early 1990s,Chinese scholars have begun to research the risk evaluation of natural disaster losses and proposed evaluation standard, indicators, and methods for quantifying natural disaster losses (Liu, 1994; Wang et. al., 2007; Fu et al.,2016). According to the information on 263 rainstorms and flood disasters from 1989 to 1993, Li and Xu (1995)analyzed the economic losses in different disaster areas and the occurrence times of various grades of rainstorm and flood disaster. Hao et al. (2012) discovered a risk analysis method based on information diffusion theory.Jin et al. (2012) discussed a connection number of risk evaluation of China’s natural disaster systems based on triangular fuzzy numbers and stochastic simulation. Yao et al. (2012) analyzed the temporal and spatial distribution characteristics of rainstorms and flood disasters in Heilongjiang Province since 1990. Zhao et al. (2014) introduced the gray correlation method of risk evaluation in meteorological disaster losses based on historical disaster data from the Chinese mainland, and applied the improved gray relational analysis model (the triangular gray relational model) to the risk evaluation of rainstorm and flood disaster losses. At present, geographic information system (GIS) technology is widely used in the study of rainstorm disaster risk zoning based on rainstorm disaster assessment. The assessment of disasters includes not only precipitation, but also topography and other land surface conditions, as well as the population and economics. According to the operational requirements, a number of national and local standards for rainstorm disasters have been established.
With global warming, research has shown that the global mean surface temperature has increased by 0.66°C from 1961–1990 to 2000–2019 (Valipour et al., 2021).The research on changes in temperature and precipitation over South Asia during the 21st century shows that there is still a continuous increase in the annual mean temperature and a robust increase in summer precipitation over most of the South Asian region (Almazroui et al., 2020). The continuous increase in temperature and precipitation will increase the frequency and intensity of rainstorm disasters in the future.
Most of the rainstorm disaster assessment models and rain-caused flooding models are regionally applicable,which means that they need to be optimized separately for different regions and basins, and it is difficult to obtain the monitoring data needed in some models, such as hydrological data and ground observation rainfall. With the increasing demand for global rainstorm disaster monitoring services, it is necessary to build rainstorm disaster risk monitoring (RDRM) model based on regionwide coverage, high temporal resolution, and easily obtained datasets. With the development of satellite remote sensing technology, global real-time rainstorm observation can be realized by satellite retrieval rainfall, which provides the necessary conditions for real-time monitoring of global rainstorm disasters. Using rainfall data retrieved by multiple meteorological satellites, this paper focuses on the near-real-time monitoring of global severe rainstorm disaster risk with reference to rainstorm and flood disaster prediction and disaster assessment methods. In this paper, a worldwide dynamic rainstorm threshold map will be established according to historical data on severe rainstorm-caused flood disasters from the past 20 years. The paper will also establish the calculation method of rainstorm intensity index with multiple precipitation parameters. The factors of hazard-formative environments and hazard-affected bodies will also be considered. Finally, an RDRM model is established, and a rainstorm risk index (RRI) can be obtained in near real time. At the same time, the applicability of the RDRM in rainstorm disaster monitoring in different areas in 2020 is analyzed.
2. Data and methods
2.1 GSMaP_Gauge rainfall
The Japanese Global Satellite Mapping of Precipitation (GSMaP) datasets are provided by the Japan Aerospace Exploration Agency (JAXA). They include a multisatellite global precipitation map under the Global Precipitation Measurement (GPM) Mission, using Dualfrequency Precipitation Radar (DPR) onboard GPM core satellites, other GPM constellation satellites, and geostationary satellites (Hou et al., 2014; Skofronick-Jackson et al., 2017; Deng et al., 2019; Gao et al., 2019). Three different remote sensing precipitation products are produced, GSMaP_NRT, GSMaP_MVK, and GSMaP_Gauge. In this study, the 24-h accumulated and hourly precipitation GSMaP_Gauge data, which include the correction of global surface rainfall station data, are used from 2000 to 2020. The variable is rainfall rate (mm h?1),the domain is global (60°N–60°S, 0–360°), and the grid resolution is 0.1° latitude/longitude.
2.2 DFO flood disaster
The global flood disaster dataset is from the Dartmouth Flood Observation (DFO) Center, Boulder, CO,USA (Kundzewicz et al., 2013). A sample of the data is given in Table 1, including the location, area, time, influence, main cause, and severity of the flood. There are 10 main causes of flooding disasters, 5 of them related to precipitation: heavy rain, tropical cyclones (TC), monsoonal rain, brief torrential rain, and extratropical cyclones. In this study, we mainly focus on the rain-induced kinds of disasters. The time range of the data used in this study is 2000 to 2020.
The flood severity is defined in three classes, 1.0, 1.5,and 2.0, i.e., Class 1.0: large flood events, significant damage to structures or agriculture, fatalities, and/or a 1–2-decade interval since the last similar event; Class 1.5: very large events, with a greater than 20-yr but less than 100-yr recurrence interval, and/or a local recurrence interval of 10–20 yr; and Class 2.0: extreme events, with an estimated recurrence interval greater than 100 yr.
2.3 ETOPO1 terrain height and river network
ETOPO1 is a 1 arc-minute global relief model of Earth’s surface that integrates land topography and ocean bathymetry from the NOAA, Silver Spring, MD, USA(Hastings and Dunbar, 1999). Global river network data used in this study were provided by the National Geomatics Center of China, including the river information from level 1 to level 5.
2.4 Gross domestic product and population
The estimate of gross domestic product (GDP) is derived from nighttime lights satellite imagery and the LandScan population grid in 2010, which provide an alternative means for measuring economic activity (Ghosh et al., 2010), spatially distributed to generate a spatially disaggregated 1-km2map of total economic activity.
The global population dataset in 2020 gives the estimated total number of people per grid-cell at a resolution of 1 km from WordPop (www.worldpop.org, https://dx.doi.org/10.5258/SOTON/WP00647; Stevens et al., 2015).
2.5 Data normalization method
The input datasets of the rainstorm disaster risk monitoring model built in this study include not only rainfall,but also terrain height, river network, economy (GDP),and population. They have different dimensions and units. In order to eliminate the influence of dimensions among influence factors in the model, data standardization is needed to solve the comparability between datasets. Two common normalization methods are Min–Max and Z-score (Carrino, 2017), Min–Max normalization is also known as deviation standardization, it is a linear transformation of the original data, so the result is mapped to 0–1, which in essence changes a number into a decimal between 0 and 1. The transfer function is (X?Min)/(Max ? Min), whereXis the data value to be normalized and Max and Min are the maximum and minimumvalues, respectively. After the normalization of the original or intermediate data, each influence factor is on the same order of magnitude and can be comprehensively analyzed in the model.
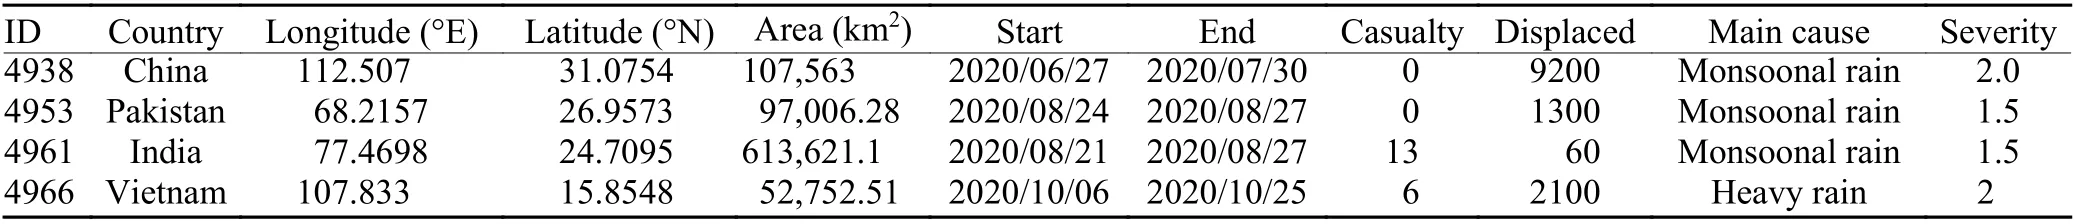
Table 1. A sample of the flood disaster dataset
2.6 Establishment of the rainstorm disaster risk monitoring model
The RDRM model built in this study is an empirical model according to the current operational rainstorm disaster-related standards, including national standards(Chen et al., 2017), meteorological industry standards(Bao et al., 2018), and some provincial standards (Chen et al., 2017) in China. It also references many research results of rainstorm-caused flood disaster assessment and operational flood monitoring methods from many other countries (Wu et al., 2012, 2014).
The prototype of the model is from the Zhejiang Provincial standard in China (Chen et al., 2017). The rainstorm process risk index is defined as follows:
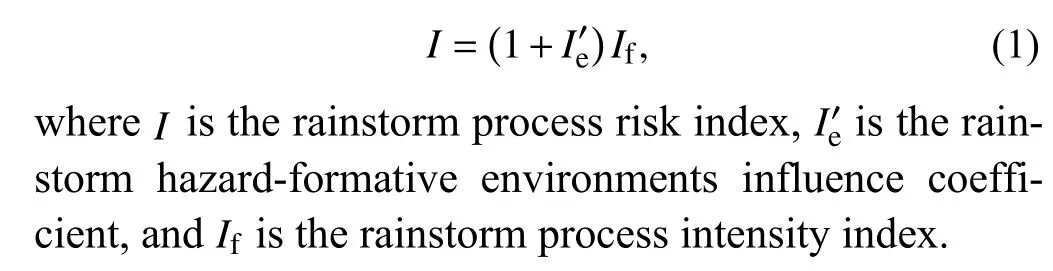
In this study, based on the rainstorm process risk assessment model, a rainstorm disaster risk real-time monitoring model will be built with multiple parameters referring to the original model and will be a great improvement in many aspects. Improvements include: (1) a dynamic global rainstorm disaster threshold map is established by using global climate data on rainstorm-induced floods and the precipitation retrieved from satellites in the last 20 years; (2) 7-day accumulated rainfall and the number of days when the daily rainfall exceeds the rainstorm disaster threshold in the first seven days are introduced to the new model; (3) gross domestic product(GDP) and population are considered as the rainstorm hazard-affected bodies influence coefficient; (4) using Min–Max data normalization to get more reasonable parameters.
3. Results
3.1 Distribution of rain-induced flood disasters
According to the global flood disaster dataset of DFO from 2000 to 2020, there were about 3427 floods in the world during this period. Heavy rain caused 2111 floods,accounting for 61.6% of the total, which is the largest proportion. The numbers of brief torrential rain-induced,monsoonal rain-induced, and tropical cyclone/storm raininduced floods were 571, 323, and 312, respectively. The above four types of flooding disasters are most common,and are all related to precipitation, including extratropical cyclones, so the total number of flooding disasters related to precipitation is about 3319 from 2000 to 2020.The main causes of flooding disasters are shown in Fig. 1.
According to the central location and areas of flooding disasters caused by precipitation (that is, 3319 cases),the distribution of flooding disasters is shown in Fig. 2.It can be seen that the regions of a high frequency of rain-induced flooding disasters in the world include Japan, North Korea, Central and Eastern China, Philippines, South and Southeast Asia, Central and East Africa,East Australia, Central and South Europe, southeastern North America, northwestern and southeastern South America, etc. Most of them belong to monsoon regions or tropical cyclone landing areas, or are areas affected by convective cloud systems in the intertropical convergence zone (ITCZ); and some of them are related to the major river basins in the world. For example, the high frequency of rain-induced flood disasters in South Asia is correlated with the summer monsoonal rainfall, tropical cyclones landing in the Arabian Sea and Bay of Bengal,and the Indus Basin and Ganges Basin.
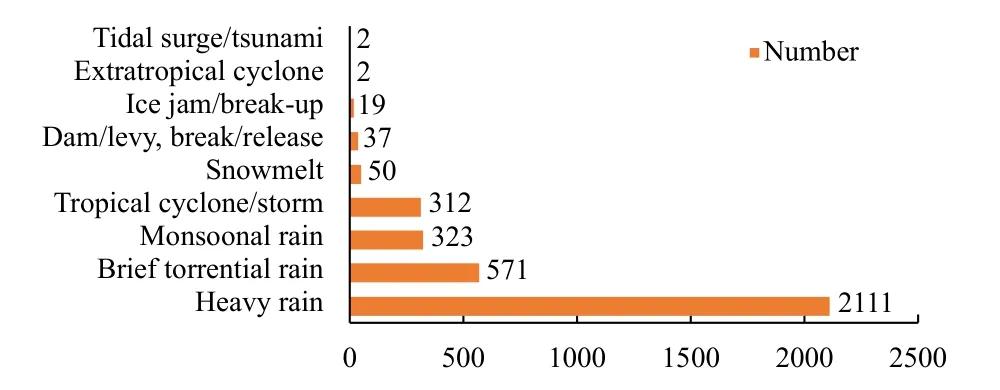
Fig. 1. Main causes of flooding disasters from 2000 to 2020.
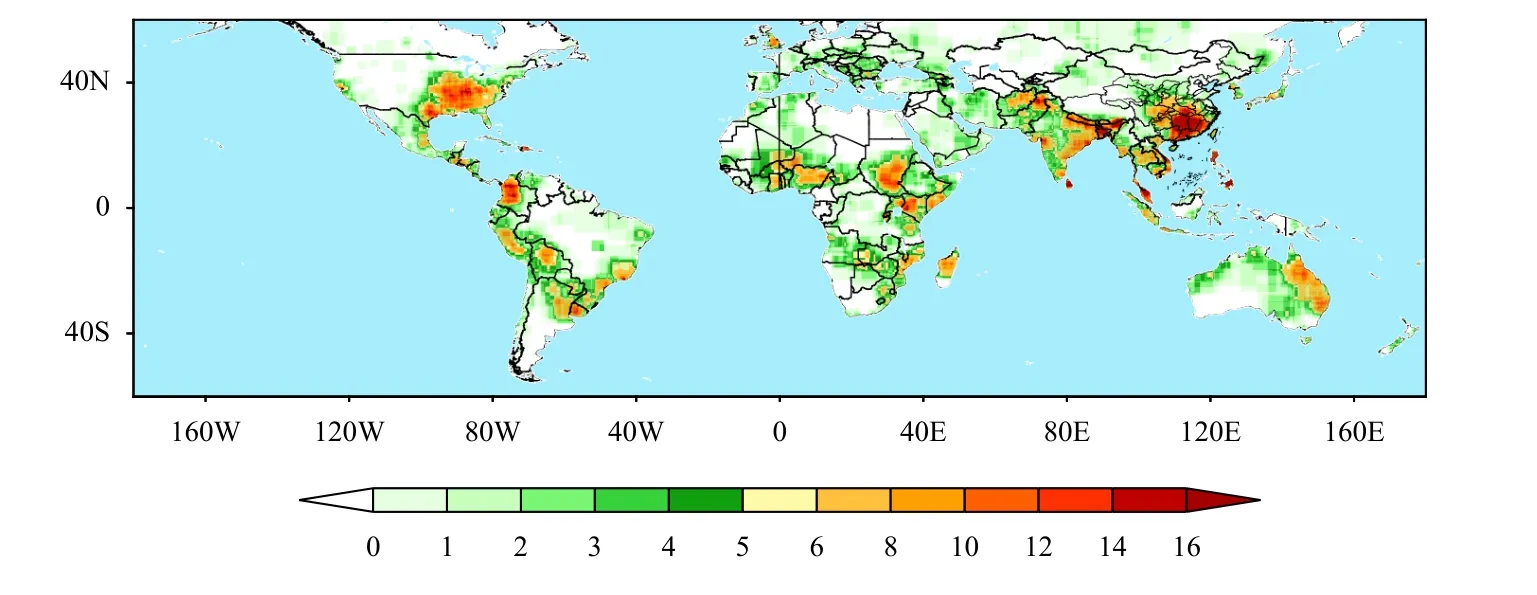
Fig. 2. Distribution of the frequency of global rain-induced flooding disasters from 2000 to 2020.
3.2 Threshold for rainstorm disasters
In the prototype of the model (Chen et al., 2017), the rainstorm threshold is a constant, that is, 50, which is the rainstorm standard for 24-h rainfall in eastern China.However, rainstorm disasters are affected by many factors, such as geographical location, topography,rivers, and climate events, resulting in obvious regional differences in the rainfall threshold of rainstorm disasters. Zhai et al. (2018) and Yuan et al. (2019) performed a comprehensive assessment and rechecking of the rainfall threshold for floods based on the disaster information, offering a valuable reference for the analysis,and calculation of early warning indicators of a flash flood. In this section, the distribution characteristics of rainfall threshold in different areas according to the flood disasters in 2000–2020 will be analyzed. This will provide a dynamic parameter of precipitation for the establishment of a rainstorm disaster monitoring model.
The corrected distribution of global rainstorm threshold is shown in Fig. 3. It can be seen that the areas with a high rainfall threshold appear in the Korean Peninsula,Japan, Philippines, Malaysia, India, Madagascar, western and eastern Australia, the west coast of the United States, Northwest Mexico, and so on. When the flood disasters caused by TC rainfall are in the majority in a region, it is more common for there to be a large rainstorm threshold because the TC landing is characterized by strong rainfall. In the southwest of India, western Australia, western USA, and North Madagascar, the large rainstorm threshold is related to tropical storms. If continuous frontal precipitation-caused floods make up the majority, there is more likely to be a relatively small rainstorm threshold such as in Pakistan, Afghanistan,central Africa, and eastern Australia.
3.3 Satellite data-based RDRM model
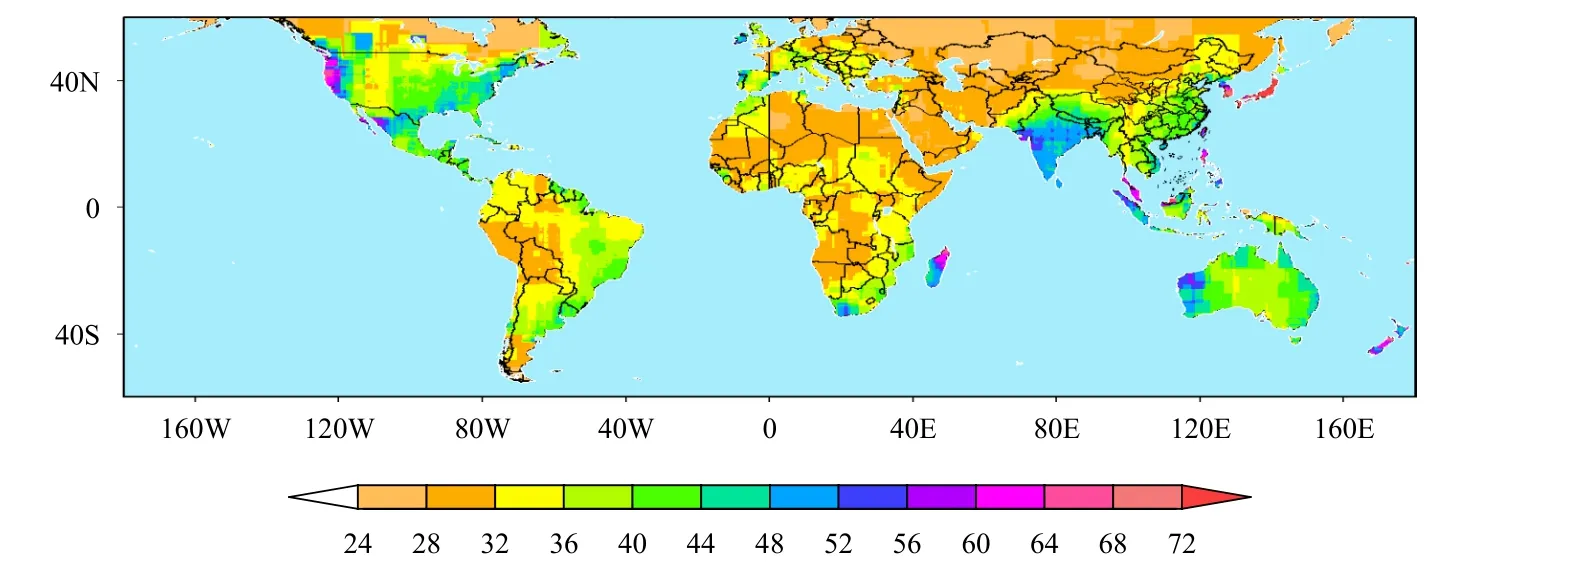
Fig. 3. Distribution of the rainfall threshold for rainstorm disasters based on the flooding disasters during 2000–2020.
Similar weather events may have very different impacts in different places. Thus, in the establishment of a rainstorm disaster monitoring model, not only the hazard-formative factors (that is, strong precipitation) but also hazard-formative environments and hazard-affected bodies are analyzed. Based on relevant national and industry standards of rainstorm disaster in China and monitoring methods of rainstorm and flood disasters (Chen H. Y. et al., 2017; Chen X. Y. et al., 2017; Bao et al.,2018), in this study, the rainstorm disaster risk index, including these three factors, is defined as follows:threshold is shown in Fig. 3. The rainstorm intensity index obtained by Eq. (3) is shown in Fig. 4d.
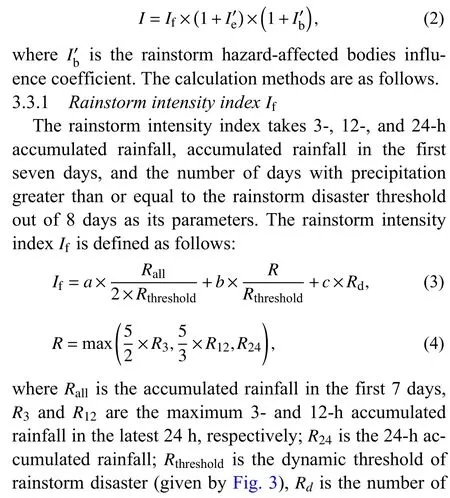
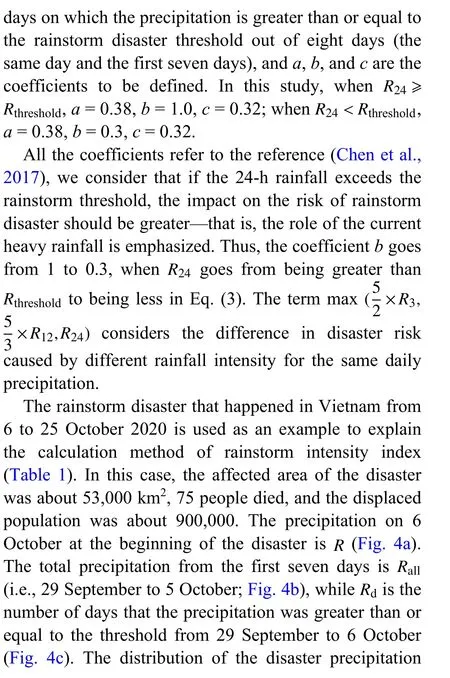
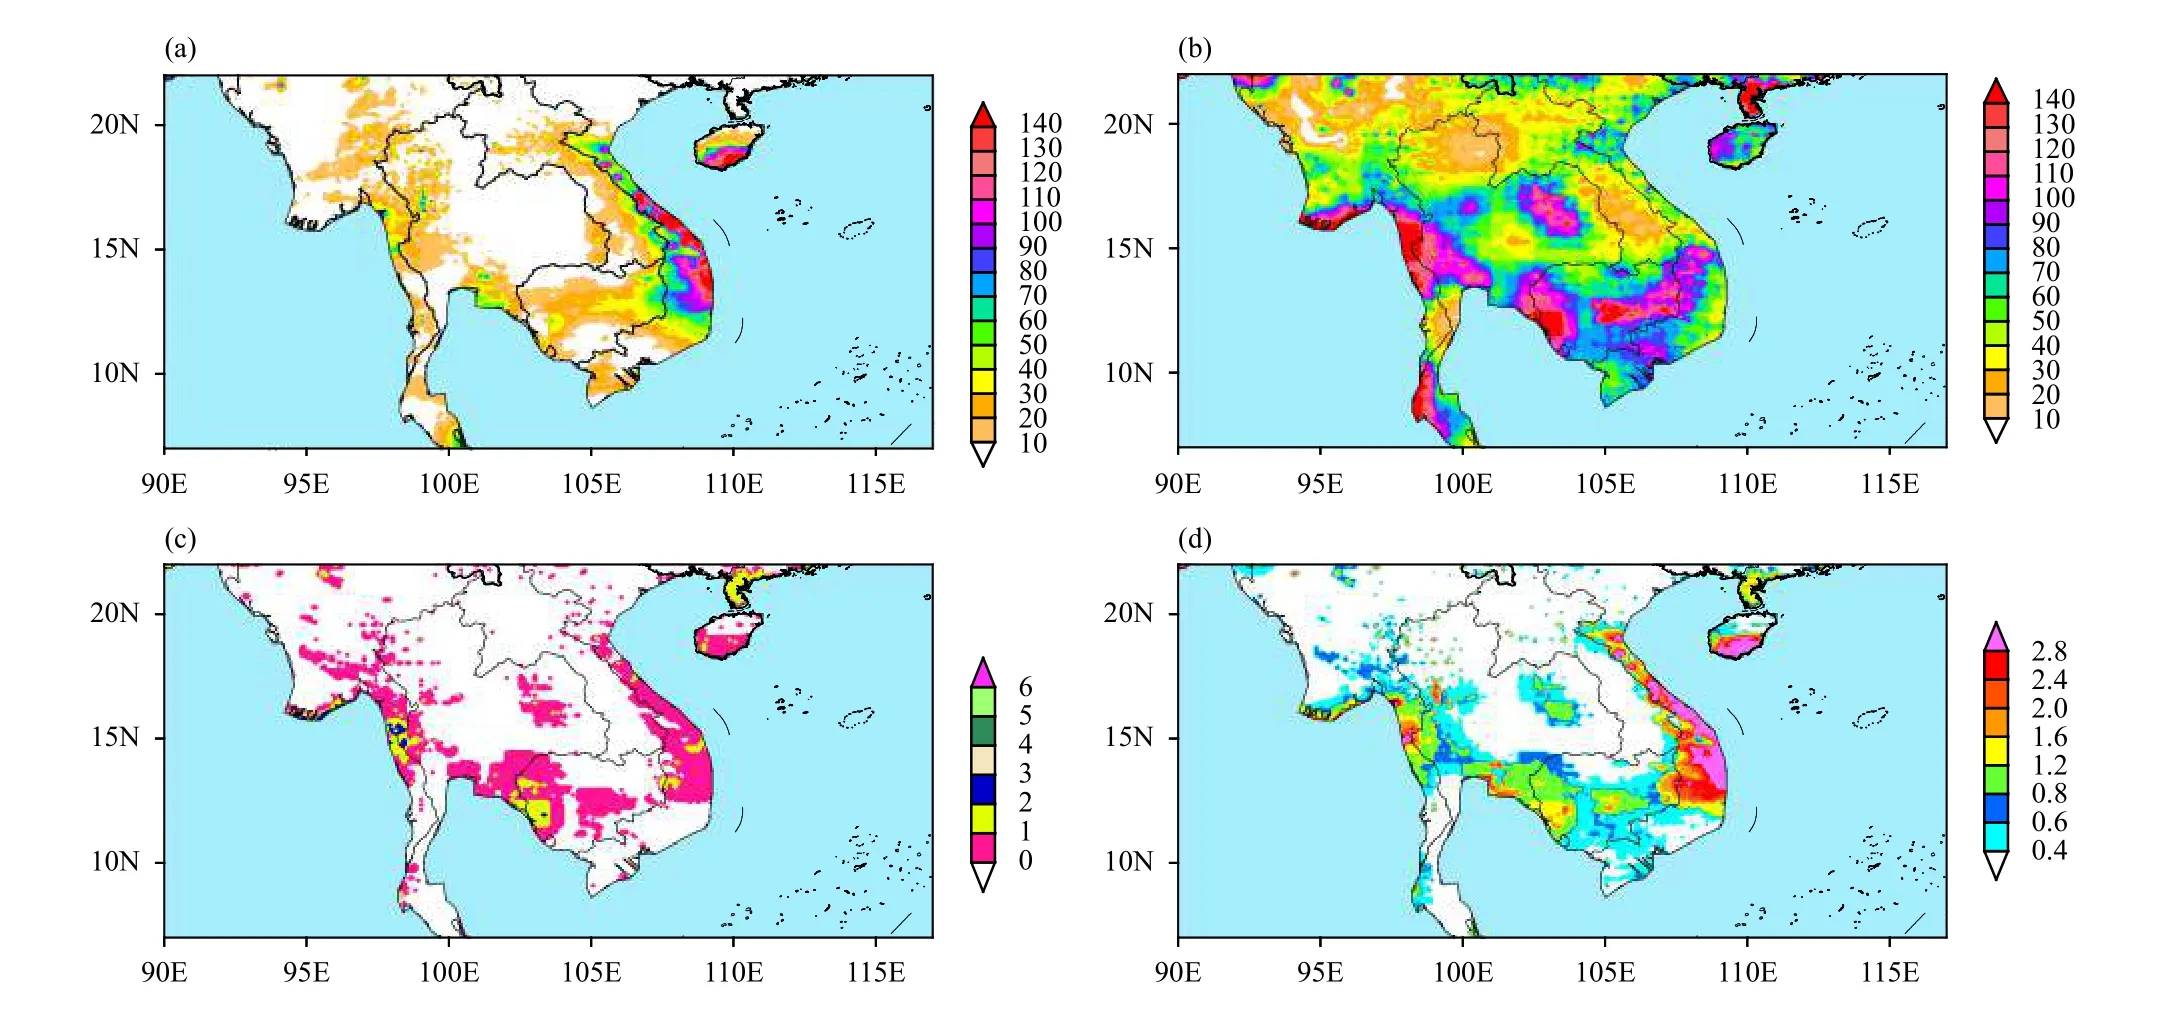
Fig. 4. Distributions of precipitation parameters during the rainstorm disaster in Vietnam in October 2020: (a) precipitation ( R) on 6 October,(b) accumulated precipitation ( Rall) from 29 September to 5 October, (c) the number of days when daily precipitation ( Rd) exceeded the threshold from 29 September to 6 October, and (d) rainstorm intensity index ( If) on 6 October.
The daily precipitation causing the rainstorm and flooding disaster occurred in central Vietnam, and was more than 50 mm in most areas. The accumulated precipitation in the first seven days in central and western Vietnam was more than 100 mm. The number of days when the precipitation exceeded the threshold was 1–2. The rainstorm intensity index in central Vietnam was greater than 1.2 when the rainstorm disaster occurred. In addition, the rainstorm intensity index on 6 October also showed that there was a high index greater than 1.2 in south central Cambodia, southern Thailand, and southern Myanmar. Disaster information was also reported on the internet (http://floodlist.com). It is said that the first of the recent spate of flooding began in early October 2020, when days of heavy rainfall in South East Asia caused flooding in Vietnam, Cambodia, Laos, and Thailand.
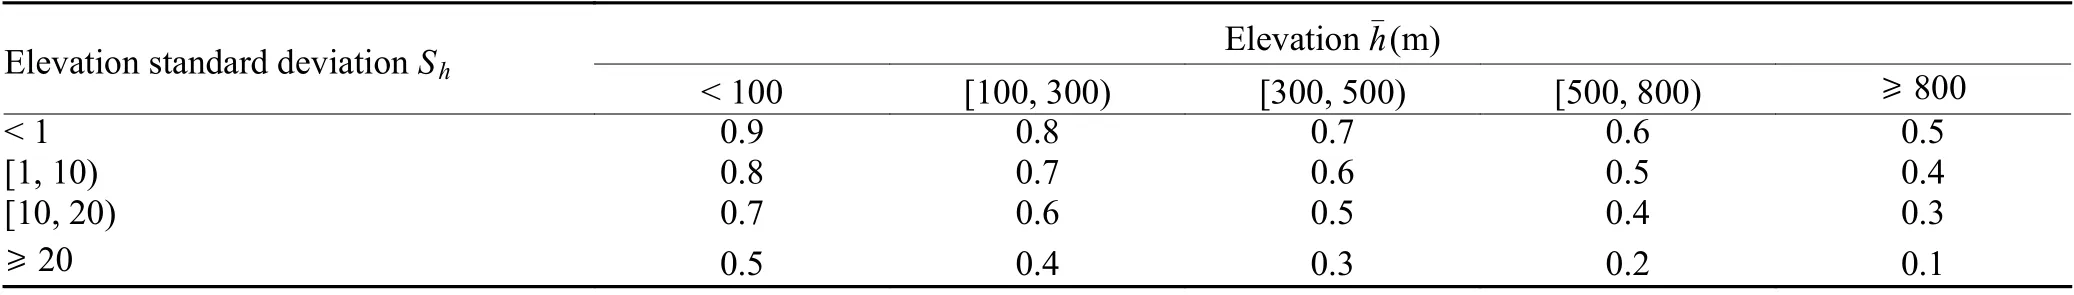
Table 2. Values of the terrain influence factor ph drived based on the elevation h and its standard deviationSh
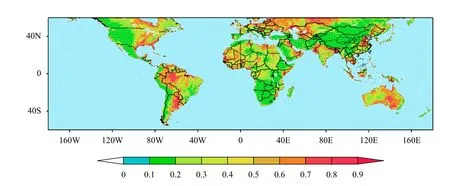
Fig. 5. Distribution of terrain influence factor ph.
whereSrmaxandSrminare the maximum and minimum ofSr, respectively. Thus, the value ofpris 0–1. The distribution of the global river network influence factor is shown in Fig. 6. It can be seen that the river influence coefficients in eastern and northeastern China, South Asia, Southeast Asia, and northern North America are high. The corresponding main rivers are the Yangtze River, Yellow River, Songhua River, Indus River,Ganges River, Mekong River, and Mississippi River.Compared with Fig. 2, the flood disaster frequency is also high in areas with a high value of the river influence factor.
3.3.3Hazard-affected bodies influence coefficientIb′
Severe rainstorm disaster will cause casualties or population transfer and economic losses. Therefore, two factors, population and GDP, are considered in the monitoring model of rainstorm disasters. If the impact of disaster prevention and reduction on disaster losses is not considered, it is generally believed that the more densely populated and economically developed areas are, the greater the losses caused by the same rainstorm. Based on this, the influence coefficient of rainstorm hazard-affected bodies is calculated as follows:

whereppandwpare the population influence factor and its coefficient;pgandwgare the GDP influence factor and its coefficient. According to Chen et al. (2017), the sum of the coefficients of these two factors should be set to 1. If we consider which factor accounts for a larger proportion, then the coefficient will have a higher response. The distribution of the GDP influence factor and population influence factor are consistent with each other in most areas (see Sections 3.4.1 and 3.4.2). In this paper,wp= 0.5 andwg= 0.5 are selected.
a. Population influence factorpp
According to the global population density data, the global population distribution is extremely inhomogeneous, the maximum population density is 122,208 km–2in very few areas, while in low-population-density areas the number of people is less than 1 km–2. Therefore,when calculating the population influence factor through the Min–Max normalization method to deal with values between 0 and 1, the maximum value needs to be given a reasonable number in order to inform a more reasonable population influence coefficient. By analyzing the population distribution map and many experiments, finally,the maximum value (Max) in (X– Min)/(Max – Min) is selected as 800, that is, Max = 800 and Min = 0. The calculation method of population influence factor is as follows:

wherepdis the population density. According to this relationship, the distribution of population influence coefficient can be calculated and is shown in Fig. 7. It can be seen that a population influence coefficient greater than 0.6 is mainly seen in east, southeast, and south Asia,western Europe, eastern and southern North America,central and eastern Africa, etc. In particular, northern India, Bangladesh, and eastern Pakistan in South Asia are the most densely populated areas with a population influence coefficient greater than 0.8. Rainstorm disasters occur frequently in these areas, which can be seen from the climate distribution of rainstorms and flooding disasters(Fig. 2).
b. GDP influence factorpg
There is a close relationship between economic development and population density. Studies on the relationship between economy and the population show that population density is one of the necessary conditions for economic activities and economic development. The demand pressure generated by population growth contributes to the generation of innovative behavior, thus promoting economic development and technological pro-
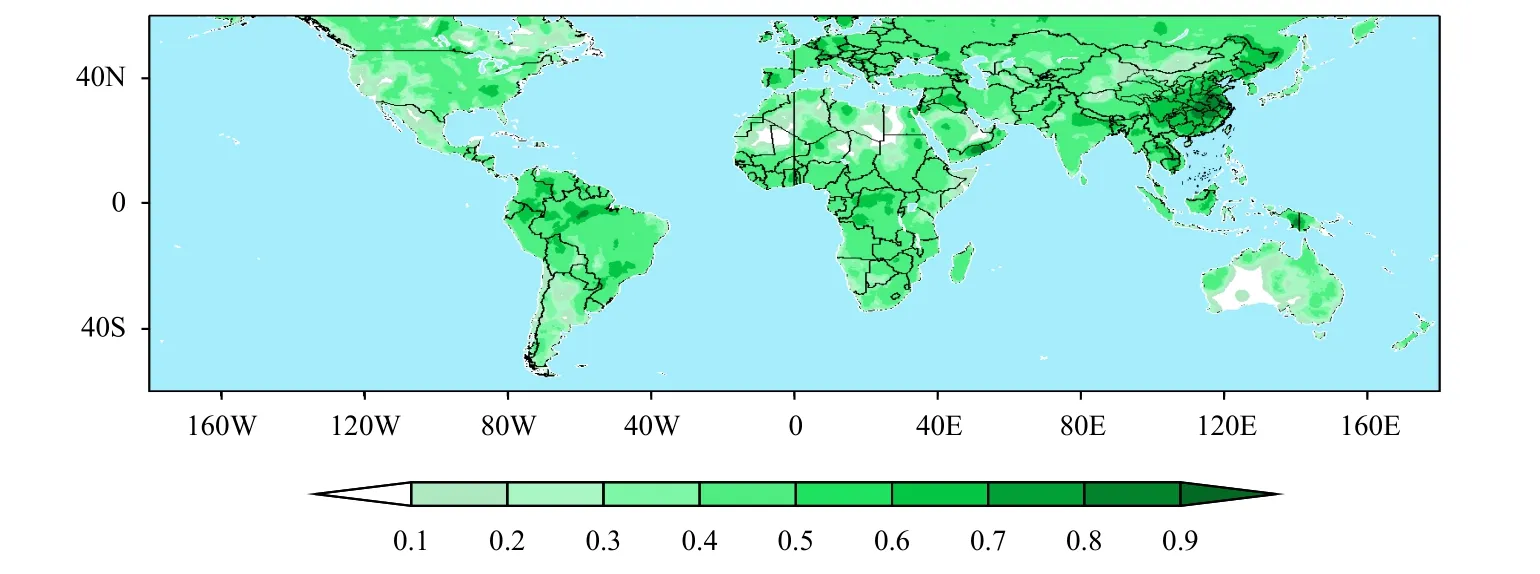
Fig. 6. Distribution of the river network influence factor pr.
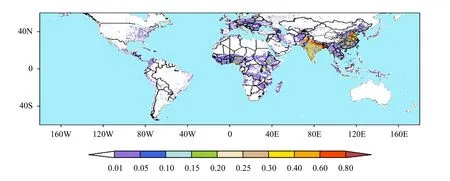
Fig. 7. Distribution of population influence factor .
pd gress. Generally speaking, the economy of densely populated areas will be more developed. However, the economic development is also affected by other factors. In the analysis of the GDP influence coefficient, the method is similar to that for the population impact coefficient.The maximum value of GDP in (X– Min)/(Max – Min)is selected as 50 (the maximum GDP is 723 in the dataset), that is, Max = 50 and Min = 0. The calculation method of the GDP influence factor is as follows:

3.4 Evaluation and application in 2020
The most important input data to the rainstorm disaster risk monitoring model concern rainfall; the main output of the model is the RRI, with which we hope to provide monitoring and early warning information for severe rainstorm disasters worldwide based on real-time satellite-retrieved rainfall. In order to analyze its reliability, the floods caused by rainstorms in 2020 were examined. We used flood information to study the RRI in corresponding areas and the active periods.
3.4.1Evaluation
In 2020, there were 172 floods worldwide in the DFO dataset, 146 of which were caused by rainfall (Fig. 9;Kundzewicz et al., 2013). The flood severity was classified into three categories in the DFO flood list (Table 1),that is, 1.0, 1.5, and 2.0, which are represented by green,blue, and red, respectively (Fig. 9). There were 39, 85,and 22 floods with a severity of 1.0, 1.5, and 2.0, respectively. The dots in Fig. 9 are the central locations of the 146 floods in 2020.
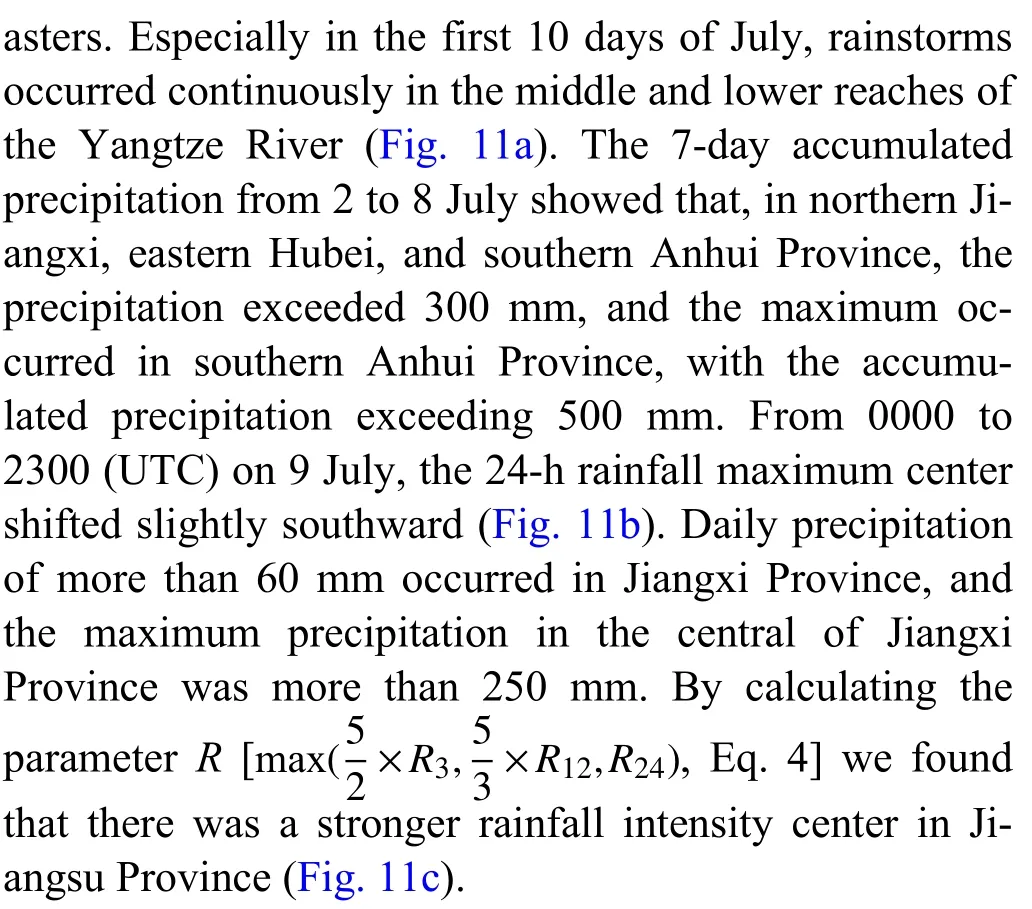
Using the RDRM model established in this study, a daily RRI map was created for 2020. By examining the 146 floods and the corresponding RRI near the central location of each flood one by one in different flood severity classes, we obtained the results shown in Fig.10. The average maximum RRI for the 39 floods with severity 1.0 is about 1.68, which was the smallest among the three classes, and in most cases the RRI was between 1 and 2. There were five cases in which the maximum RRI were greater than 3, and one flood was caused by TC rainfall. The average maximum RRI were 2.16 and 3.63 for floods with severity 1.5 and 2.0, respectively.
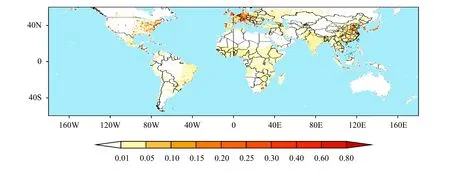
Fig. 8. Distribution of GDP influence factor pg.
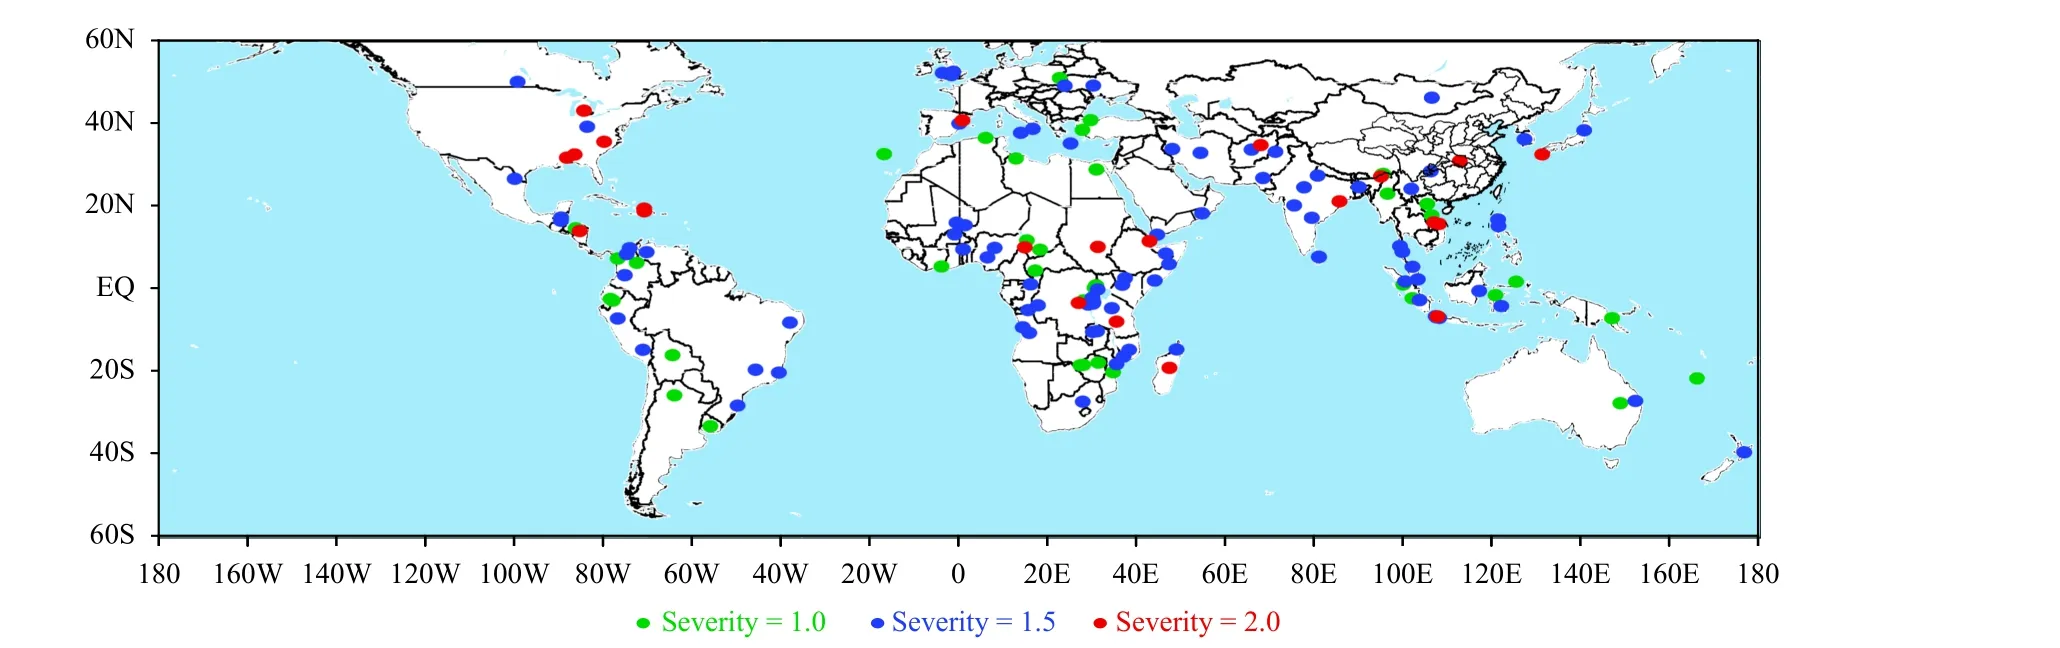
Fig. 9. Distribution of flood disaster central locations caused by rainstorms in 2020.
It can be seen that, on average, the rainstorm risk index is consistent with the flood disaster severity for 2020(Fig. 10). However, there were some cases that do not match exactly. For example, in case No. 8 the flood severity was 2.0 but the maximum RRI was about 2.0,which is much smaller than the average of 3.63 (Fig.10c). The flood occurred in the United States in May; the main causes were a dam break and heavy rain. It may be that the dam break aggravated the influence of precipitation, leading a relatively small RRI to be associated with a stronger flood disaster. Another similar example is case No. 14 for flood severity 2.0 (Fig. 10c); the flood occurred in Chad, Africa, from August 11 to 28. Although the daily precipitation intensity was relatively small (the maximum RRI is about 2.0), long-lasting rainfall can still bring about an extreme flood event.
The formation of a flood disaster is the result of a complex multifactor synthesis, although in the RDRM model, the effect of precipitation intensity on the disaster under the same daily precipitation is considered to some extent. There is still a lot of work to do in terms of detailed classification according to the disaster information to build a better RDRM model. However, this model reflects the disaster level of rainstorms to a certain extent.
3.4.2Application in 2020
It can be seen from the above analysis that RDRM model includes precipitation, topography and rivers, population, and economy, which can quantitatively represent the potential hazards caused by rainstorms. In order to analyze the reasonableness of the RRI in operational rainstorm service, two rainstorm-caused floods in 2020 were selected as examples.
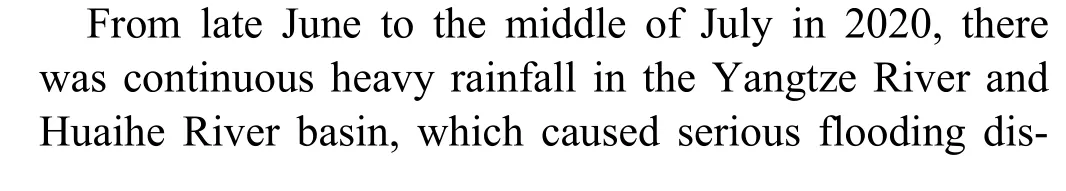
The water level of the Yangtze River and Poyang lake reservoirs increased, and the water area increased due to the heavy rainfall. According to the daily accumulated precipitation, since 29 June, the northern part of Jiangxi Province has been hit by continuous rainstorms, resulting in serious floods. During this period, the rainstorm from 7 to 8 July in Jiangxi Province, which is the most severe since complete meteorological records were made available in 1961, has had a wide range of influence.Based on satellite remote sensing and meteorological observation data, monitoring and evaluation of the changes in the main body and nearby water area of Poyang Lake in Jiangxi Province were carried out (Fig. 12). The result shows that the area of Poyang Lake is the largest it has been in the last 10 years (figure omitted).
Fig. 10. The maximum RRI during each of the 146 floods caused by rainfall near the central location of the floods in 2020 for (a) the 39 floods with severity of 1.0, (b) the 85 floods with severity of 2.0, and (c) the 22 floods with severity of 2.0 based on the DFO flood disaster dataset.
Using the RDRM model in this study, the RRI distribution was obtained as shown in Fig. 13. It can be seen that, affected by the continuous heavy rainfall, the regions with a RRI greater than 1.0 on 9 July were distributed in eastern Hubei, eastern Hunan, southern Anhui,and north–central Jiangxi provinces. The maximum center of the RRI, which was greater than 4.5, was located in the north–central part of Jiangxi Province. Compared with the precipitation (Fig. 11), the high risk index in southern Anhui and northern Jiangxi provinces had a close relationship with the strong 7-day accumulated precipitation, while the high RRI in central Jiangxi Province was related to the 24-h heavy rainfall. Figure 13 also shows that the value of the RRI in western Japan is 1–3 during to the eastward extension of the Meiyu front cloud belt. At the same time, affected by heavy rainfall, the rainstorm disaster risk index in Northeast India is also higher.
The rainstorm disaster monitoring model is based on the historical data of rainstorm disasters, and a global dynamic threshold of rainstorm disaster is established;therefore, the rainstorm disaster risk index can be applied worldwide. The applicability of the index to other regions is illustrated by an example of monsoonal rainfall disaster in South Asia from late August 2020.
In late August 2020, Pakistan and India suffered severe rainstorms due to the strong summer monsoonal rainfall. The rainstorm and flood disaster dataset (Table 1)shows that the rainstorm disaster in Pakistan occurred from 24 to 27 August, with the center located near 26.9573°N, 68.2157°E—that is, Southeast Pakistan, with an affected area of about 97,000 km2. The rainstorm disaster process in India occurred from 21 to 27 August, and the center is located near 24.7095°N, 77.4698°E, which is in the north central part of India, with an area of about 61,000 km2.
The rainstorm disaster risk index (Fig. 14) shows that there were two high-risk centers, one in Sindh Province in the south of Pakistan and the other in Orissa state in the northeast of India, with rainstorm risk greater than 2.0. The maximum value in Southeast Pakistan was more than 4.5, while the maximum value of the RRI in Northeast India was 3–4.
Form the comparison of water body monitoring before (5 August) and after (6 September) the floods in southern Pakistan byFY-3Dsatellite, it can be seen in Fig. 15 that, on 6 September, affected by the rainstorm,the Indus River, which flows through Punjab and Sindh,widened significantly, the water body area of Manchar Lake increased, and some areas such as Hyderabad, Mirpur Khas, and Umerkot in southern Sindh were affected by the rainstorm and floods.
The rainstorm disaster risk index on 25 August was consistent with that of the rainstorm flood disaster dataset, and the surface water body monitoring by meteorological satellite also provided further evidence of the flooding disaster caused by the rainstorm. Therefore, the rainstorm disaster monitoring model established in this paper effectively monitored this rainstorm-induced disaster in South Asia.
4. Conclusions and discussion
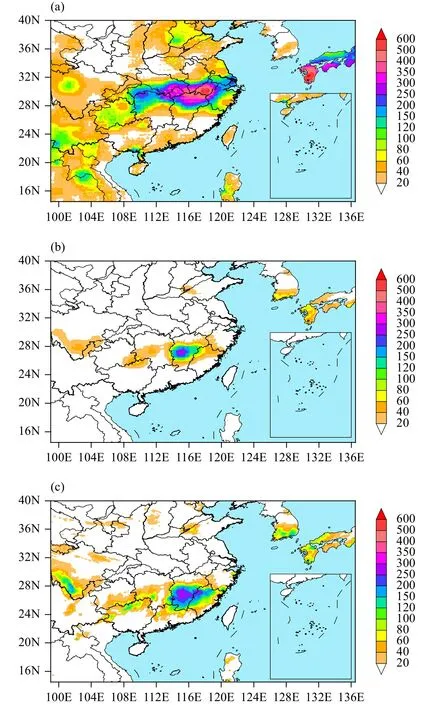
Fig. 11. Distributions of precipitation during the rainstorm disasters in China in July 2020: (a) 7-day (2–8 July) accumulated precipitation,(b) 24-h precipitation on 9 July, and (c) R = max(×R3,×R12, R24)precipitation on 9 July 2020.
In this study, an RDRM empirical model is built based on the remote sensing rainfall dataset, which can be used worldwide. Based on global rainstorm and flood information from the past 20 years, the dynamic threshold of rainstorm is established. Therefore, the difference in the precipitation intensity that can cause flooding disasters in different regions of the world is considered. Moreover,rainstorm disaster-causing factors include many parameters, and the hazard-formative environment factor and hazard-affected body factor of rainstorm disaster are built on terrain and river datasets, and population and economic datasets, respectively. The combination of the above factors makes the rainstorm disaster monitoring results have regional differences under similar precipitation conditions. The application of the rainstorm disaster monitoring model in 2020 in China, India, and Pakistan also shows the applicability of the model in different regions.The main contributions of this study are summarized as follows:
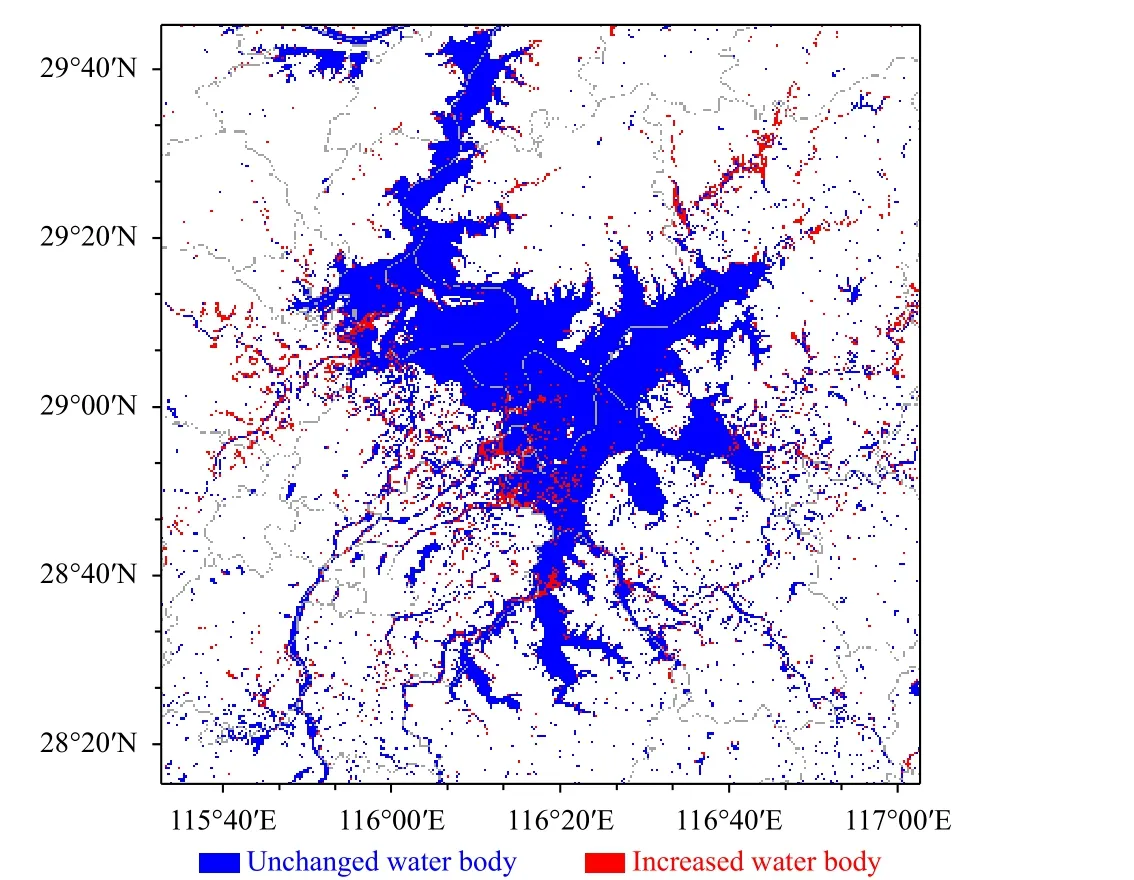
Fig. 12. Map of the water body change (difference between 8 and 2 July) in and around Poyang Lake monitored by Fengyun satellites.
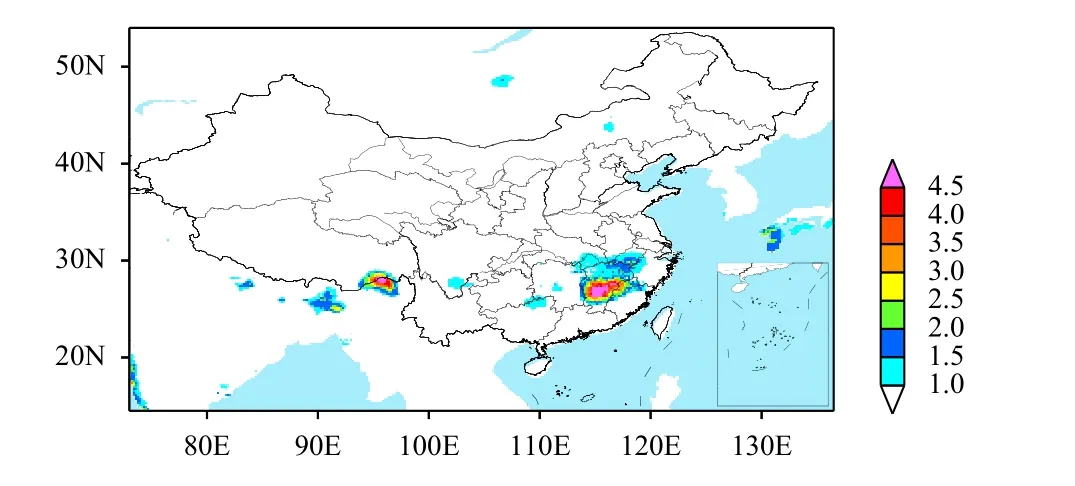
Fig. 13. Distribution of the rainstorm disaster risk index over China on 9 July 2020.
According to the global flooding disaster data from the past 20 years, the top four flood disaster causes (accounting for 96.8% in total) related to precipitation are heavy rain (accounting for 61.6%), brief torrential rain (16.7%),monsoonal rain (9.4%), and tropical cyclone/storm rain(9.1%). The distribution of flooding disasters is inhomogeneous; high-frequency areas are distributed in Japan,North Korea, central and eastern China, Philippines,South and Southeast Asia, Central and East Africa, East Australia, Central and South Europe, southeastern North America, northwestern and southeastern South America,etc.
Based on data on the historical flood disasters caused by rainstorms and daily precipitation in the past 20 years,the worldwide dynamic threshold of precipitation during the floods is established, and the distribution of the precipitation threshold also shows regional non-uniformity.In the calculation of the rainstorm intensity index, a dynamic threshold is introduced, and the cumulative precipitation of the previous seven days, the daily precipitation,and the number of days when the precipitation exceeds the rainstorm disaster threshold are used as the hazardformative factors.
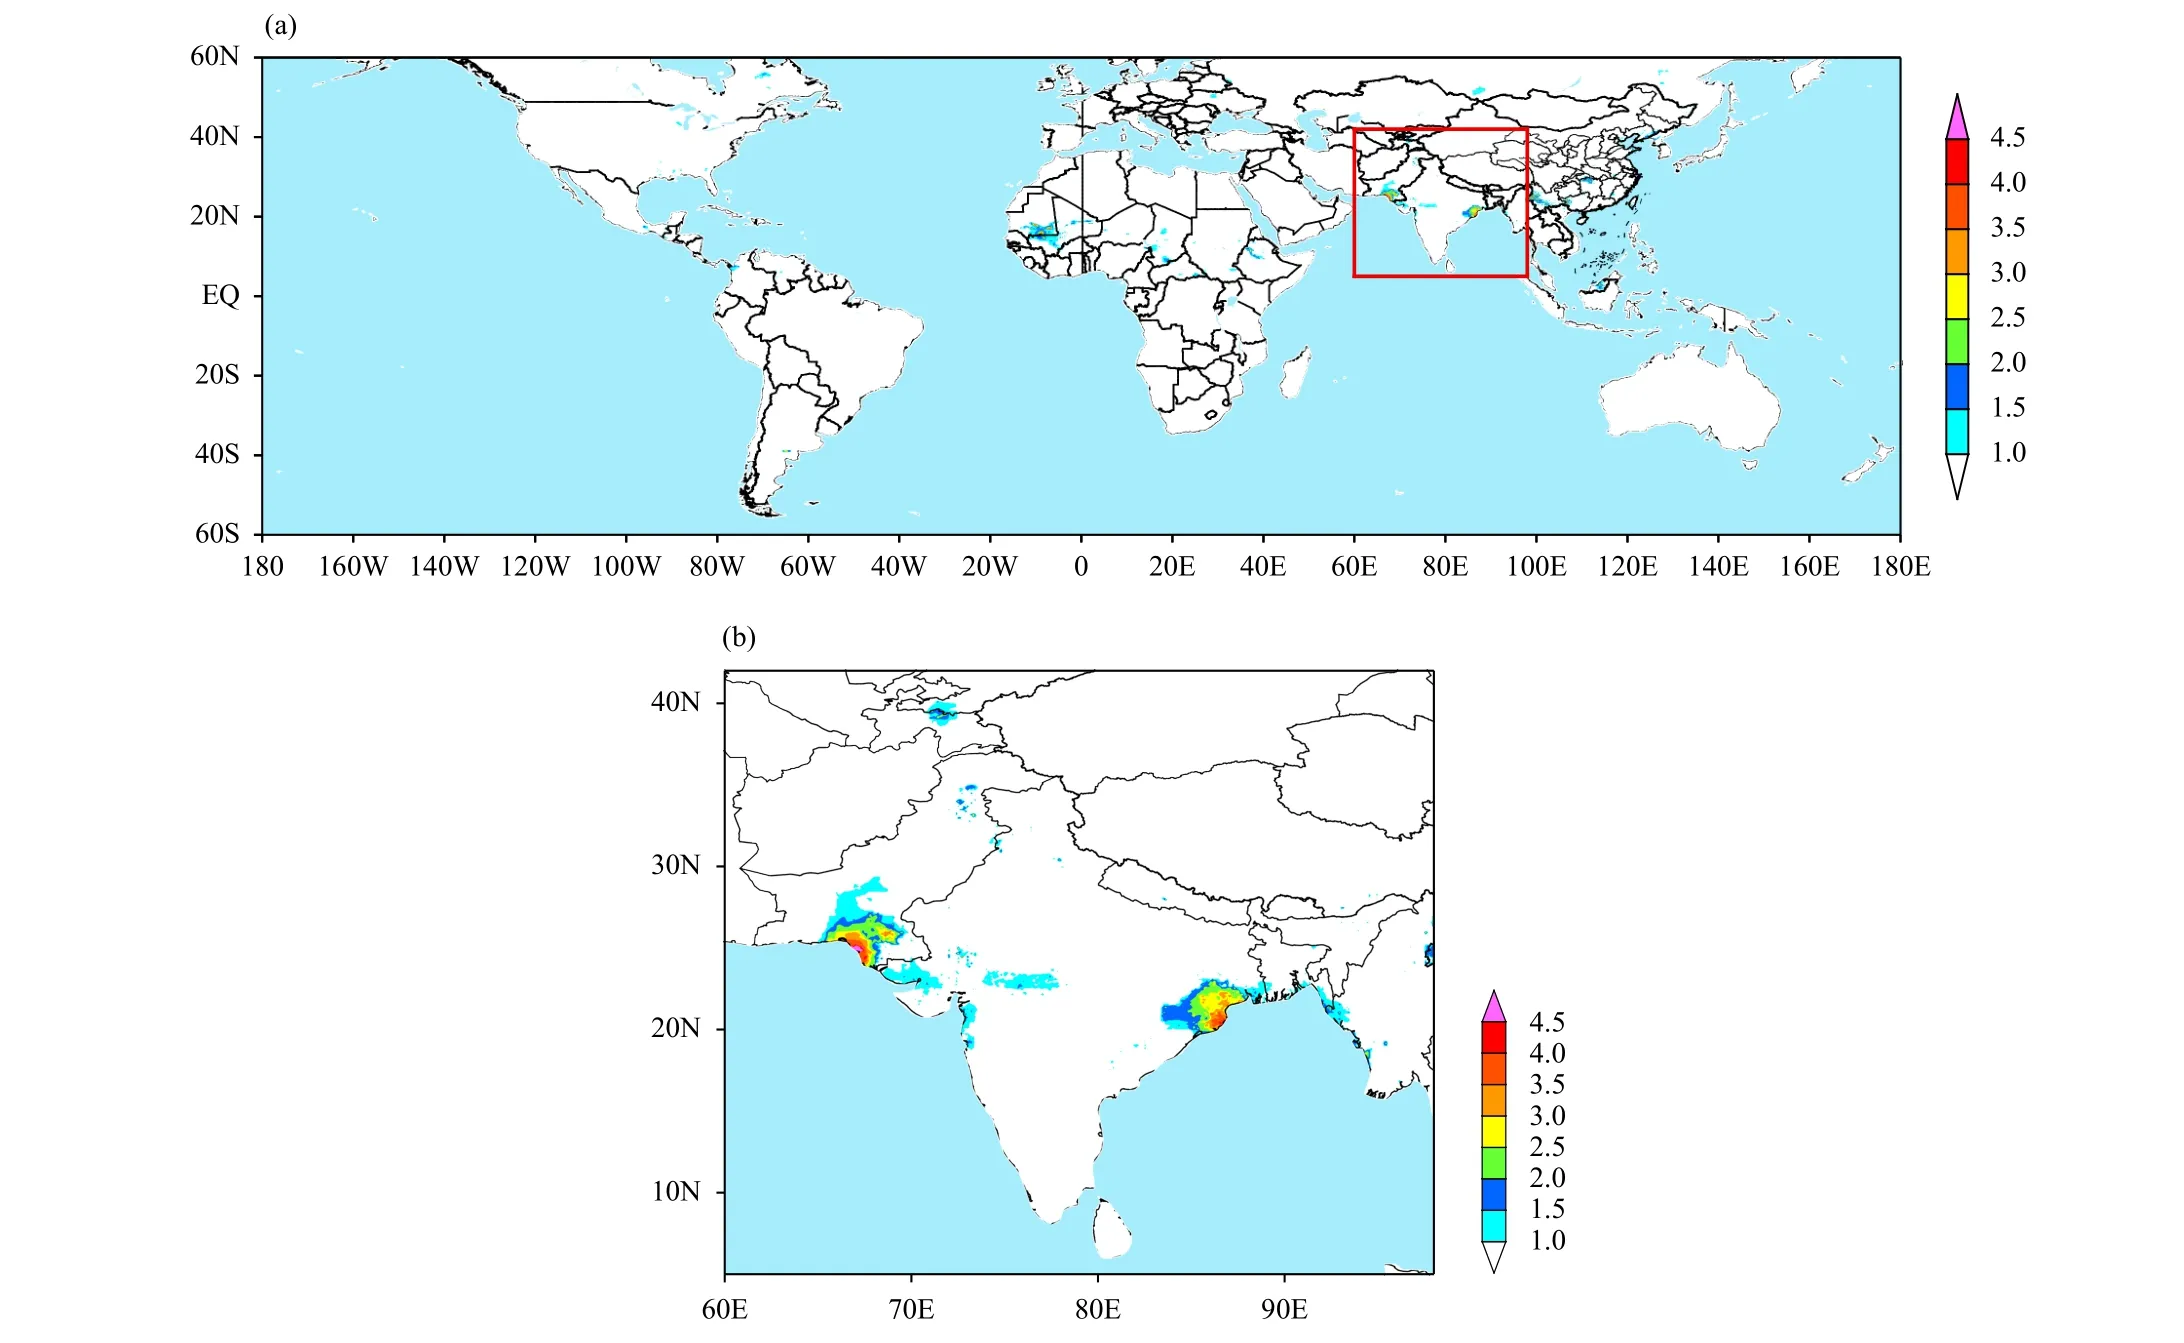
Fig. 14. Distributions of the rainstorm disaster risk index on 25 August 2020: (a) global view and (b) regional view.
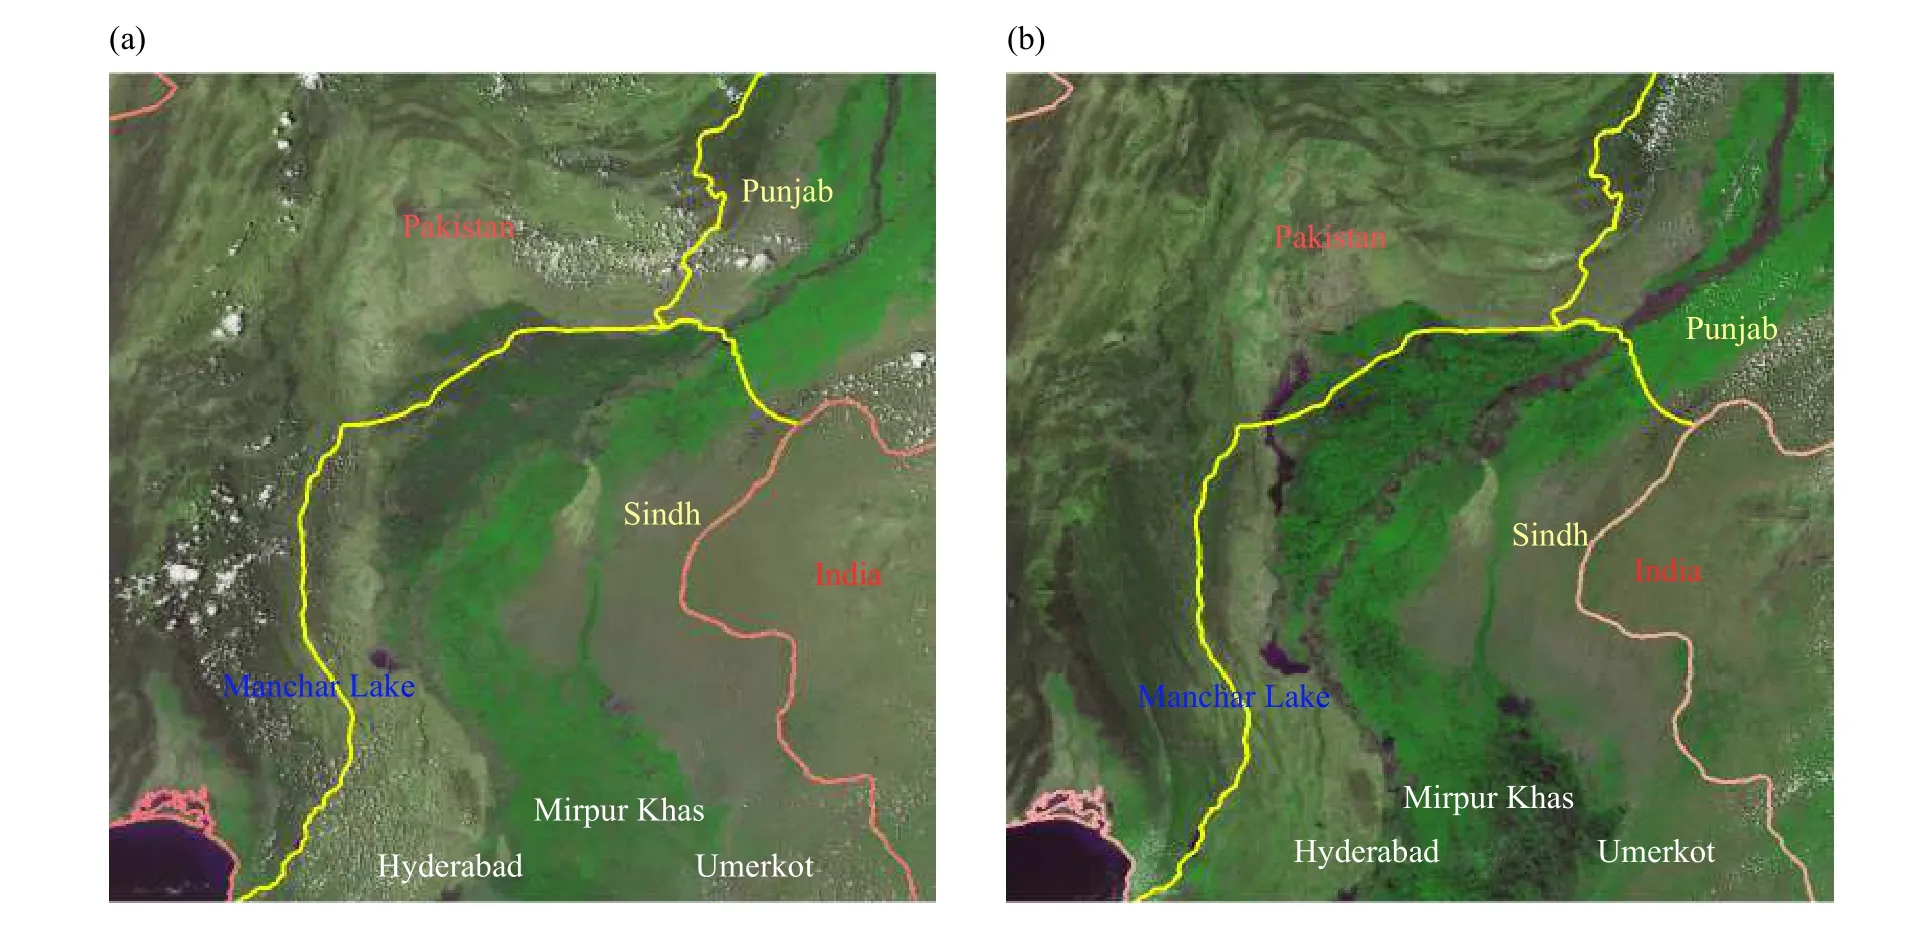
Fig. 15. Water body change of the Indus River in Sindh, Pakistan monitored by FY-3D: (a) normal water level before the rainstorm on 5 August 2020 and (b) river widening due to the rainstorms on 6 September 2020.
Two variables are selected for the hazard-formative environments (i.e., terrain and river networks) and two for the hazard-affected bodies (i.e., population distribution and GDP). By adding the influence factor into the rainstorm disaster monitoring model, the rainstorm intensity index can be modified to obtain a more reasonable RRI.
By using the rainstorm disaster monitoring model established in this study, the long-lasting regional flood process in Southeast China and the monsoonal rain flood process in South Asia in 2020 are monitored. The rainstorm risk index monitors these two disaster processes well.
The goal of this study was to establish a real-time rainstorm-caused flood monitoring model that can be used in daily operational services. Thus, the model was established according to the current operational rainstorm disaster-related standards, including national standards, meteorological industry standards, and some provincial standards of China. The design of the model also referenced many research results of rainstorm-caused flood disaster assessment and operational flood monitoring methods in other countries such as Australia, India,Pakistan, the USA, and so on. In the operational service of rainstorm disaster monitoring and forecasting, many parameters in the standard are set based on operational experience. Therefore, the parameters of the global rainstorm and flood disaster empirical model built in this study can be adjusted according to the specific needs.Because the rainstorm threshold in the model established in this study is based on information from the past 20 years on rainstorm-caused flooding disasters around the world, the model has a certain applicability worldwide.
The GSMaP_Gauge daily rainfall data used in this study from the website have a three-day delay at present.In order to realize the real-time monitoring of global rainstorm disasters based on the meteorological satellite,there are higher requirements for the effectiveness of satellite precipitation retrieval products. Therefore, a precision assessment of satellite precipitation estimation products such as FY-2/3/4 satellites will be carried out later, determining the relationship between the precipitation estimation products of FY-2/3/4 and the GSMaP_Gauge, and the FY satellite precipitation data will be corrected in its scanning areas (Singh et al., 2018). According to the rainstorm disaster monitoring model established in this study, the RRI monitoring products of global key regions (such as in the Belt and Road regions) will be established based on the FY satellites, which can be applied to the monitoring and early warning services of heavy rain disasters in the key regions of the world.
 Journal of Meteorological Research2022年1期
- Journal of Meteorological Research的其它文章
- Feature Construction and Identification of Convective Wind from Doppler Radar Data
- Understanding Differences in Event Attribution Results Arising from Modeling Strategy
- Detection and Attribution of Changes in Summer Compound Hot and Dry Events over Northeastern China with CMIP6 Models
- Spatial and Temporal Validation of In-Situ and Satellite Weather Data for the South West Agricultural Region of Australia
- Uncertainty in TC Maximum Intensity with Fixed Ratio of Surface Exchange Coefficients for Enthalpy and Momentum
- QpefBD: A Benchmark Dataset Applied to Machine Learning for Minute-Scale Quantitative Precipitation Estimation and Forecasting