
Probabilistic Methods for Reliability Assessment of Floating Structures Based on Extreme Wave Simulation
2022-02-24 08:30:36ZHAOYuliangCHUXinjieandDONGSheng
ZHAO Yuliang, CHU Xinjie, and DONG Sheng, *
Probabilistic Methods for Reliability Assessment of Floating Structures Based on Extreme Wave Simulation
ZHAO Yuliang1), CHU Xinjie2), and DONG Sheng1), *
College of EngineeringOcean University of ChinaQingdaoChinaDrilling Technology Research Institute of Shengli Petroleum Engineering Corporation LimitedSINOPECDongyingChina
With the increasing application of floating platforms in deep waters and harsh environments, a proper assessment of the reliability of floating structures is important to ensure that these structures can operate safely during their design lives. This study outlines a practical methodology for reliability analysis of a semi-submersible platform based estimating the probability distribution of the extreme response in rough sea conditions (survival conditions). The Constrained NewWave (CNW) theory combined with Monte Carlo simulations was first applied to simulate the random wave surface elevation process in the time domain. A Gumbel distribution was the best fitting to describe the dynamically sensitive extreme response statistics under extreme waves (drift and mooring tension). The derived probability distribution of the extreme response was subsequently used in estimation of the associated limit state function, and a reliability analysis of the floating structure was conducted using the Monte Carlo method. A semi-submersible platform in a water depth of 1500m subjected to extreme wave loads was used to demonstrate the efficiency of the proposed methodology. The probability of failure of the semi-submersible when considering mooring lines tension is greater than considering drift.
reliability assessment; floating structure; Constrained NewWave theory; Monte Carlo simulation; extreme response
1 Introduction
As the exploitation of oil and gas resources moves from shallow to deep and ultra-deep water, the application of different kinds of floating structures, such as semi-submersible platforms, is becoming more extensive. The resource production in deep-sea areas encounters serious survival and operational challenges because of the cold environment, complex external loads, and other variables. Harsh environmental conditions negatively influence operations and maintenance activities of floating structures. Additionally, failure of deep-sea operations can result in marine environmental pollution, economic losses, casualties, and other catastrophic consequences. Therefore, it is necessary to evaluate the performance of these structures under harsh conditions to ensure operational safety and structural integrity. For deep-sea platforms, research on reliability assessment techniques for offshore operations and maintenance procedures in harsh environments has attracted attention in recent years (Islam, 2017; Abaei and Abbassi, 2018; Bucelli, 2018; Liu, 2019).
The reliability assessment of floating structures is complex as it involves the interplay between structural dynam-ics and mooring lines response, along with irregular environmental loads. Different types of failures may occur during a platform’s lifetime because of the stochastic characteristics of the marine environment. There are usually three main factors that should be considered in the reliability evaluation of floating structures: a comprehensive approach to simulate storm or other extreme sea conditions, nonlinear hydrodynamic analysis to assess the safety performance of the structure (Wan, 2018), and an appropriate method to calculate the failure probability based on computation of the structural response.
It is generally acknowledged that failure will occur when the response of the structural system exceeds the allowable limit, which is determined by operation or maintenance requirements and mechanical properties of the materials. Therefore, to conduct a failure analysis of a floating structural system, a proper description of the structural extreme response and the limit state of the structure is required. Mooring lines are a critical component of the floating structure system; failure of which during extreme environmental loads may lead to serious consequences. Thus, proper probabilistic reliability assessment of the structural response, including body motions and mooring lines tensions, is a key issue to assure the safety and integrity of the floating structure over its service life.
In the past few years, there has been an increasing focus on the simulation of extreme stochastic environmental loads and their effects on floating structures (Clauss and Klein, 2013; Kim and Lee, 2015; Bai, 2018; Li, 2018; Xu, 2018). The focus in such studies has been on how to define extreme environmental conditions impacting the structures and how to describe the resulting dynamic response. Wave modeling is critical in the design of fixed and floating marine structures, in which the water particle kinematics need to be first defined to determine dynamic loads acting on the structures (Walker, 2004; Bateman, 2012). Linear random wave theory is widely used to generate the sea surface elevation process by the superposition of waves of different wavelength, amplitude, and period traveling at varying speeds and directions (Cassidy, 1999). Linear waves that assume that the wave energy is constrained in one frequency component imprecisely describe wave irregularity in rough sea conditions. To achieve more representative simulations of random wave loads that show strong nonlinearity and especially to simulate extreme sea surface elevation in storm conditions, the NewWave (NW) theory (Tromans, 1991) and the CNW theory (Taylor, 1997) have been widely use in the calculation of wave loads on both fixed and floating marine structures (Cassidy, 1999; Cassidy, 2001, 2002; Mirzadeh, 2015). An Endurance Wave Analysis (EWA) method based on these wave theories was used for the assessment of marine structures under extreme waves (Zeinoddini, 2012; Abaei, 2018a). There have also been other wave generation technologies proposed to simulate extreme or abnormal ocean waves based on the NW and CNW theories (Bennett, 2012, 2013).
Mooring systems, consisting of mooring lines and anchors, have been widely used and are important units in the maintenance of floating structures. The failure of a mooring system under extreme environmental conditions can lead to collapse of the entire floating system. Therefore, some studies have regarded the reliability assessment of mooring lines as a key issue to assure safety and integrity during the service life of floating structures (Vazquez-Her-nandez, 2006; Hallowell, 2018; Liu, 2019). A reliability method based on fatigue damage criteria was proposed to calibrate the safety factor of mooring lines (Mathisen and H?rte, 2005). Montes-Iturrizaga(2012) presented a formulation for the nested reliability analysis of mooring lines that considered the uncertainty of the maximum dynamic tension affected by extreme sea states variables. Rendón-Conde and Heredia-Zavoni (2015) proposed a first-order analytical formulation that considered uncertainty parameters in statistical models of the maximum dynamic tension and the breaking resistance to represent the limit state function for ultimate tension failure of a line. Bayesian Network (BN) models have been widely applied in reliability and risk assessments (Trucco, 2008; Khakzad, 2011; Musharraf, 2014; Lei- meister and Kolios, 2018). Abaei and Abbassi (2018) estimated the mooring failure probability using a limit state function in a BN and assessed the overall safety of the offshore structures by integrating hydrodynamic and reliability analysis with BN. Abaei(2018b) conducted a dynamic reliability assessment of a ship grounding using Bayesian Inference. Abaei(2018a) also developed a risk assessment methodology for safety analysis of marine structures under extreme conditions using a BN that utilized stochastic variables from hydrodynamic analysis of floating structures. Fonseca. (2010) performed a numerical and experimental analysis of extreme wave induced vertical bending moments on a floating, production, storage and offloading unit (FPSO). Wang and GuedesSoares (2016) conducted experimental and numerical studies of the slamming load of irregular waves on the bow of a chemical tanker. Only a few studies have been conducted to evaluate the failure probability of a semi-submersible platform considering structural motions and the mooring system, although traditional methods, such as the first-order reliability method (FORM) and second-order reliability method, as well as Monte Carlo simulations are mature engineering reliability analyses (Jensen and Capul, 2006; Kim and Lee, 2015; Kang, 2016; Hallowell, 2018; Keshtegar and Chakraborty, 2018; Wang and Fang, 2018).
Compared with conventional procedures that perform safety assessment under designed sea conditions, the present study addresses the need for the evaluation of the extreme response of floating structures for reliability analysis in a harsh environment considering random characteristics and extreme statistics. An appropriate approach is required to generate the data that represents the random behavior of the survival sea states. To achieve this, harsh wave conditions are simulated using the CNW theory. Since the dynamic behavior of the floating structure is important for safety assessment, a global maximum method is adopted and the stochastic nature of the extreme response is estimated by numerical simulations with a given wave crest height. Statistical parameters for the extreme response distribution under arbitrary sea conditions can then be identified using an empirical fitting method. The computation of the probability distribution of the structural extreme response corresponding to an extreme sea state at a specific site can be achieved with Monte Carlo simulations. An associated reliability index for the floating structure can then be derived. The hydrodynamic model is developed to simulate real conditions of the floating structure with a determined survival sea state, and a semi-submersible platform was considered to demonstrate the effectiveness of the methodology.
The paper is structured as follows: A detailed introduction to the framework of the proposed methodology is provided in Section 2. A brief description of the NW and CNW theories adopted as wave modeling methods is provided in Section 3. An application of this methodology to a sample semi-submersible platform is presented in Section 4. Conclusions of the reliability analysis are presented in Section 5.
2 Probabilistic Model for Reliability Evaluation of Floating Structures
The structural reliability of any system can be expressed by defining a limit state equation that describes the functional relationship between the system’s resistance () and load effects (). Considering a floating structure subjected to the effect of extreme environmental loads, such as from waves, the limit state equation describing survival conditions can be written as (Mirzadeh, 2015; Rendón-Conde and Heredia-Zavoni, 2015; Nava-Viveros and Heredia-Zavoni, 2018):
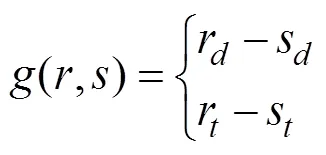
whererandrdenote the limit offset response and mooring line resistance considering the breaking strength, respectively;sandsare the actual maximum dynamic drift of the floating structure and the extreme dynamic tension of the most loaded mooring line, respectively that are caused by environmental loads such as wind, waves, and currents. In this work, the extreme wave conditions are assumed to control the overall loading and the other environmental influences are ignored.
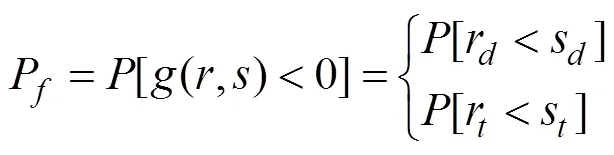
Accordingly, the reliability assessment of a floating structure can be conducted based on structural reliability theory in which the failure probability of a structural system can be defined as (Mirzadeh, 2015):
where(,) is the limit state function for the structural system. Once the structural ultimate capacity,, and actual structural extreme response,, are computed accurately, the reliability of the structural system can be assessed using existing approaches such as the FORM, the response surface method, and the Monte Carlo method (Kim and Lee, 2015).
The methodology involves: i) definition of extreme sea states at the specified site, ii) simulation of random waves using the CNW method, iii) estimation of the extreme response distribution using multiple hydrodynamic analyses, and iv) assessment of the floating structure’s reliability defined in terms of motions and mooring line tensions. Fig.1 shows a flowchart of the methodology detailing the specific steps involved in the assessment of the failure probability of a floating structure.
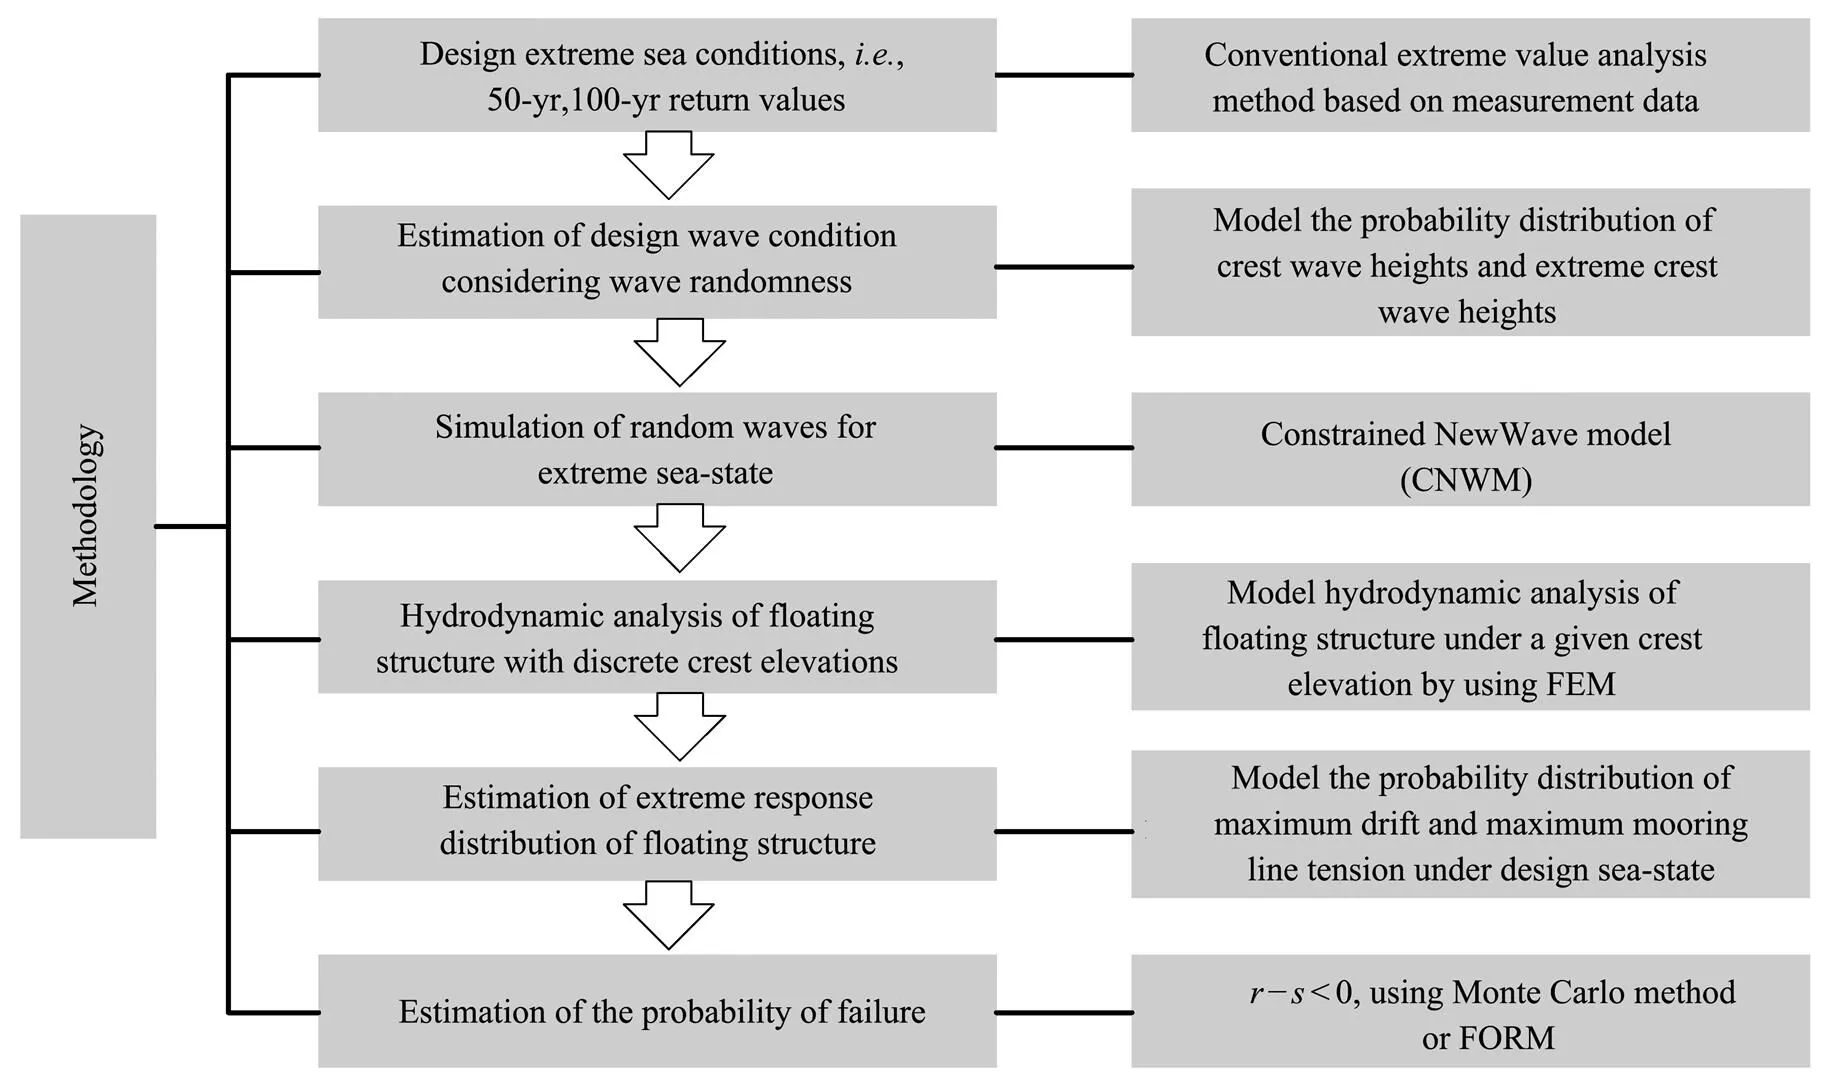
Fig.1 Flowchart of the proposed method to assess the failure probability of a floating structure.
2.1 Estimation of the Sea State Distribution
The sea surface elevation in a specified sea state can be regarded as a stationary random process. The probability distribution of this surface elevation is generally assumed to be Gaussian (Longuet-Higgins, 1963) with Rayleigh dis- tribution, amplitudes,, as:
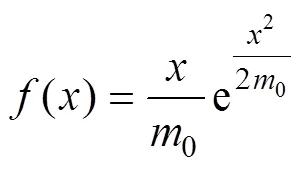
where0is the zeroth order spectral moment (variance) of the wave power spectral density function.

whereF() is the CDF of the sea surface elevation amplitude,, andpeakis the number of amplitudes that occur during storm conditions, which can be estimated asstorm/zero, wherezerois the zero-up crossing period of the sea state. The statistical characteristics of the random waves are thus established and the next step is to simulate the wave surface elevation based on appropriate wave modeling theories.
2.2 Simulation of Random Waves
An accurate simulation framework is needed to study the interaction between a floating structure and the marine environment. The design environmental parameters are defined using extreme statistics, and real ocean waves are generally regarded as irregular and composed of harmonic wave components with different heights, frequencies, phases, and directions. A series of irregular wave surface time series can be generated easily if the characteristic wave parameters, such as significant wave heightHand peak periodT, are selected.
The maximum wave surface elevation in rough sea conditions may be different from that produced by a deterministic or stochastic approach using a wave spectrum. To generate a random wave process that can provide a specified wave height, wave modeling approaches, including the NW and CNW methods, have been proposed that constrain a sequence of events within a random sequence that is statistically indistinguishable from the original random sequence, but with a specified target extreme wave height, as discussed in Section 2.1 (Mirzadeh, 2015). This wave modeling approach is briefly summarized in Section 3.
2.3 Hydrodynamic Analysis of the Floating Structure
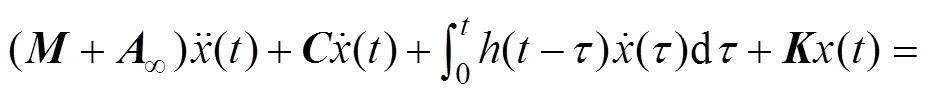
Waves generated using the CNW approach are applied to the floating structure and a hydrodynamic analysis is conducted using the ANSYS/AQWA. The simulated extreme wave series are used as input in ANSYS/AQWA and the hydrodynamic numerical software loads are calculated based on potential theory. The floating body motion equation can be expressed as:

The time series of the motion and mooring line tension are generated and their extreme values for the floating structure are considered in subsequent analyses; a global maximum method is utilized to model the stochastic nature of the extreme response. The global maxima method and peak-over-threshold (POT) method are widely used approaches to obtain the distribution of the peak response. However, there is no uniform algorithm for determining the most appropriate threshold value in the POT method; thus, the maximum values are determined as extreme values from numerous numerical simulations and the global maxima method is adopted to obtain the extreme distribution considering the randomness of extreme waves.
Notably, the reliability of a selected floating structure is related to its own layout such as its geometric dimensions and the design of the mooring system. The direction of the wave loading also influences the response of the structure. The dynamic response of the floating structure can be assessed after the structural model and mooring setup are fully defined. In the present study, the incident waves are assumed to be uni-directional,, long-crested.
2.4 Distribution of the Extreme Response
The objective of this step in the overall reliability analysis is to predict the distribution of the extreme response of the structure for any specified sea condition that has wave statistical characteristics as defined in Section 2.1. There are three steps:
i) The extreme response distribution,(), must be evaluated for a given extreme wave height,H.
The structural response under random waves, all with same underlying statistical characteristics, must be defined from a large number of hydrodynamic analyses (global maximum method). The extreme response distribution can then be evaluated based on these results, using methods to fit distribution parameters (such as the method of maximum likelihood or the method of moments).
ii) Evaluation of the extreme response statistics,F(), for any extreme wave height,H. Thus,accounting for un- certainty in the randomness of the extreme wave height in a harsh sea state.
The relationship between a selected set of wave heights can be defined using empirical fitting of the corresponding distribution parameters. Therefore, the distribution of the extreme response of the floating structure for any wave height can be directly established.
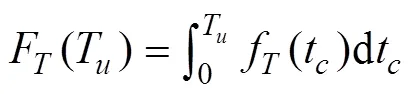
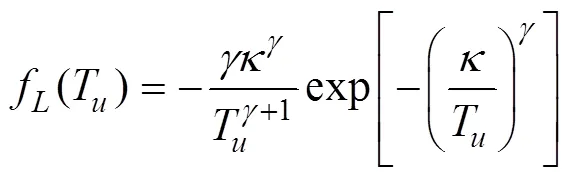
iii) The extreme response distribution,F(), can be eval- uated for the survival sea state with the CDF of the extreme sea surface elevation amplitude,.
The probability distribution of the extreme response can be estimated using samples of the computed structural response corresponding to the generated wave heights combined with the Monte Carlo simulations used to generate extreme wave height samples with distributions specified in Section 2.1.
2.5 Estimation of the Failure Probability
There are different failure modes floating systems, drift beyond operating limit or mooring lines failure. In this work, limit sates associated with the platform motion and mooring line tension were evaluated. Considering a floating structure subjected to environmental loads, the failure probability was estimated based on the associated limit state equation or performance function by evaluating multi-dimensional integrals as (Hosni Elhewy, 2006; Kang, 2015; Keshtegar and Chakraborty, 2018):
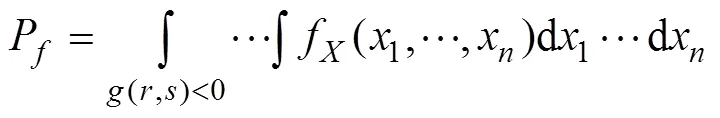
wheref(1, ···,x) is the joint probability density function in terms of the underlying random variables,(,) is the limit state function, and(,)<0 (Eq. (2)) denotes the failure region for the structural system.
Resistance quantities including the motion offset limits and breaking strengths of mooring lines were used for the floating system reliability assessment in this study. Theoffset limit ensures safe operation of risers and other equip- ment. Alternatively, mooring lines are at risk of breaking when the extreme tension reaches its ultimate limit state.
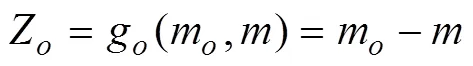
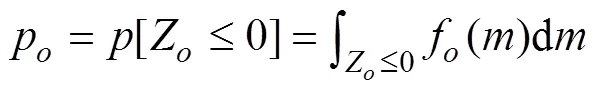
Ifmis used to represent the offset limit and the extreme offset of the floating structure in a specific sea site is described as, the (offset) limit state function considering motions can be expressed as:
wheremcould be selected as the largest permissible value, depending on the water depth. For example, the probability density function for the extreme draft,f(), can be evaluated using simulations and statistical analysis techniques. In this work, the structural system resistance and extreme response were assumed to be independent of each other. The failure probability of the floating system associated with excessive offset can be defined as:
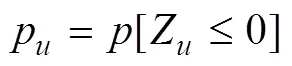
A different failure mode can be used to assess the breaking strength of the mooring system. If the ultimate breaking strength of a mooring line is taken asTand the extreme tension of the most loaded mooring line is represented byT, then the (ultimate) limit state function for the floating system associated with mooring line failure can be expressed as:
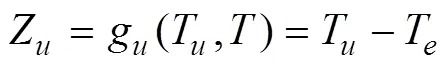
The failure probability associated with extreme tension loads can be written as:
Other studies have investigated the characteristic resistance of mooring lines in the reliability analysis of floating structures (Vazquez-Hernandez., 2006; Montes-Iturrizaga., 2007). Only a brief description of the derivation for mooring line characteristic resistance is presented here. In general, a mooring line is assumed to consist of a large number of mooring chain links; thus, the ultimate breaking strength of a mooring line depends on its weakest link. Assuming that the resistance of a single chain link,t, follows a log-normal distributionf(t) (Vazquez-Hernandez., 2006):
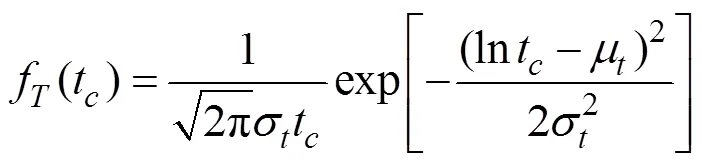
where the distribution parameters,σandμ, can be computed from data on the breaking strength of individual chain links,

whereMis the expected value of the chain link breaking tension, usually approximately 1.2 times the minimum breaking tension.Dis the standard deviation of the chain link breaking strength and is 10% of the mean breaking tension (Montes-Iturrizaga., 2007).
The CDF of the resistance of an individual chain link can be written as:
A mooring line comprised of a number of chain links can be regarded as a series system. The CDF of the mooring line can be defined in terms of the breaking strength of the individual chain links as:
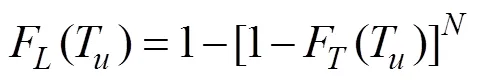
whereis the total number of chain links in the mooring line. Whenis very large, Eq. (14) can be simplified as:
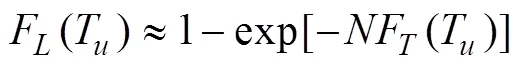
Based on Eqs. (11), (13), and (15), the ultimate breaking strength of a mooring line can be computed as (Montes-Iturrizaga., 2007):
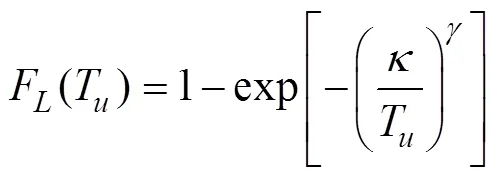
where
The probability density function of the breaking strength of a mooring line can be easily obtained from the CDF as:
Once the distributions of the resistance and the extreme response of the floating structure have been defined, Monte Carlo methods can be used to estimate the failure probability for each limit state. The Monte Carlo method applied in this study for failure probability analysis can be expressed as:
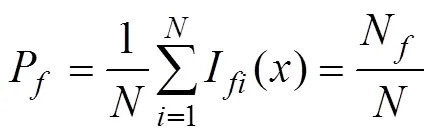
whereI() is the indicator function of the invalid domain. If?()<0,I()=1; otherwise,I()=0, whereis the total number of samples.
3 Wave Modeling
For floating structures, the dynamic response depends on the form and properties of the structure as well as the external environmental loading. To describe the extreme response of floating structures, such as semi-submersible plat-forms, it is important to accurately simulate the dynamic properties of the wave loads (Cassidy, 1999). Accordingly, some studies have simulated the random ocean surface andits corresponding kinematics in the time domain (Tromans, 1991; Taylor, 1997). Appropriate wave modeling approaches have been applied for the dynamic analysis of marine structures such as jack-up platforms and floating platforms (Cassidy, 1999; Mirzadeh, 2015, 2016a, 2016b; Abaei, 2018a).
3.1 NewWave Theory
Tromans(1991) introduced the NW theory, which can be used to define a full random time domain wave surface elevation simulation that accounts for the spectral composition of the sea. Both linear random wave theory and NW theory assume that the wave surface elevation at a site of interest is a stationary Gaussian random process. For waves described by linear random wave theory without considering the direction of propagation, the wave surface elevation,(), above the mean sea level, can be expressed as
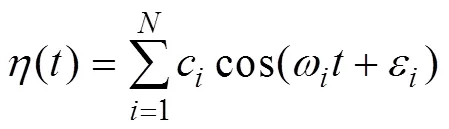
whereωandεare the frequency and random phase, respectively, of a single wave component.cis the amplitude of each single wave component wave, which can be described based on the spectral decomposition of the sea state as
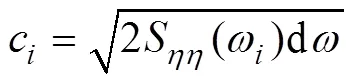
whereS(ω) is theth component of the wave power spectrum (such as the JONSWAP spectrum) and dis the selected frequency interval that defines the wave component discretization. Once the wave parameters, significant wave height (H), and wave peak period (T) for any extreme sea state of interest are defined, the JONSWAP spectrum is used, to describe the wave energy density.
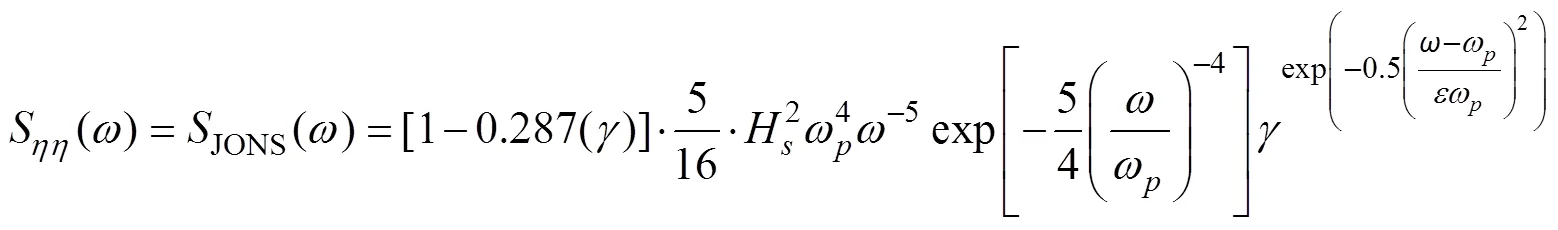
whereis spectral peak frequency,=2π/T, (if≤,=0.07; otherwise,=0.09);is the spectral peak shape parameter, 3.3. Fig.7, discussed in greater detail later, depicts the JONSWAP spectrum (red line).
The extreme wave surface with an expected elevation can be modeled using the NW theory, which uses the auto- correlation function of the underlying Gaussian process(Tromans, 1991; Cassidy,1999; Mirzadeh, 2015). The uni-directional wave surface elevation,(,), can be discretized into a finite number () of wave harmonic components, based on the autocorrelation function. Because of the dispersion relationship between wave number and frequency, the wave elevation can be described in discrete form, considering spatial dependency, as:
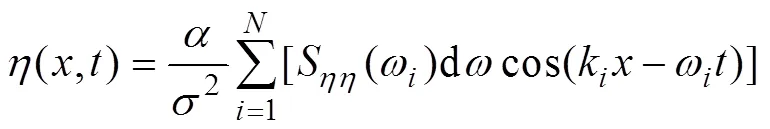
whererepresents the crest elevation defined such thatmax, whereis the normalized dimensionless maximum wave height in the sea state. When the JONSWAP spectrum is adopted, the value ofcan be determined as 0.58 (Abaei, 2018a). Note thatmaxis the maximum wave height in the sea state and, whereHis considered to be the extreme wave surface elevation of the given sea state in this work (see Fig.5, to be also discussed later), whileNis the number of wave cycles during the extreme wave conditions. Additionally,is the standard deviation of the wave elevation. The expected crest elevation,, at a user-defined position,0, and time,0, can be obtained by replacingwith–0andwith–0. An entire time series of random wave surface elevation can be introduced as input to the selected floating structural system. Then, statistical characteristics of the extreme response can be investigated based on repeated dynamic nonlinear analyses. The actual position,0, and time,0, have no consequence to this study and their influence is not considered. Three hour time domain simulations were performed for floating structures in a severe sea state. Eq. (22) helps to generate the random wave surface elevation in the time domain for a specified expected crest height.
3.2 Constrained NewWave Theory
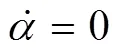
Taylor(1997) devised a method for the calculation of extreme statistics by constraining a wave train with a predetermined crest height in an arbitrary random time series. The constrained wave sequence is statistically indistinguishable from the original random sequence. Based on this approach, the constrained surface elevationη() can be derived as (Cassidy, 1999)
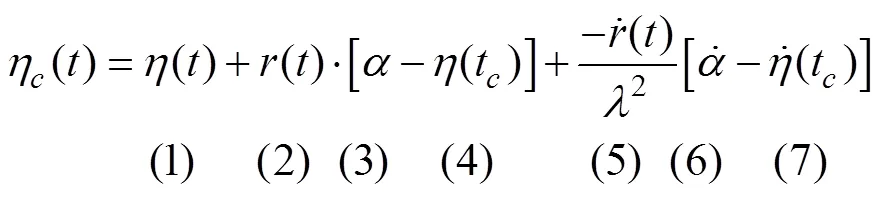
where the terms are further explained as:
Term (1)–the original random surface elevation defined based on Eqs. (19)–(21). The term represents the extreme sea state (, givenH,T) at a specific site, which can be described using only the wave energy density spectrum().
Term (2)–the autocorrelation function of the random surface elevation;
Term (3)–the predefined constrained wave crest height;
Term (4)–the original random surface elevation at=t=0;
Term (7)–the slope of the random wave surface elevation at a predefined time (=t=0 in this study).
The details of the procedure employed to achieve simulation of the random wave surface elevation based on the NW and CNW approaches can be found in studies by Tro- mas(1991), Taylor(1997), Cassidy(1999), Mirzadeh(2015). The NW theory can be adopted to simulate random time series of wave surface elevation, while the CNW allows for easy and efficient evaluation of extreme response statistics that avoid simulating many hours of real time random seas, most of which is of no interest (Cassidy, 1999). The flowchart for computing the probability of failure for a floating structure using the CNW theory in a design extreme sea state, is presented in Fig.2.
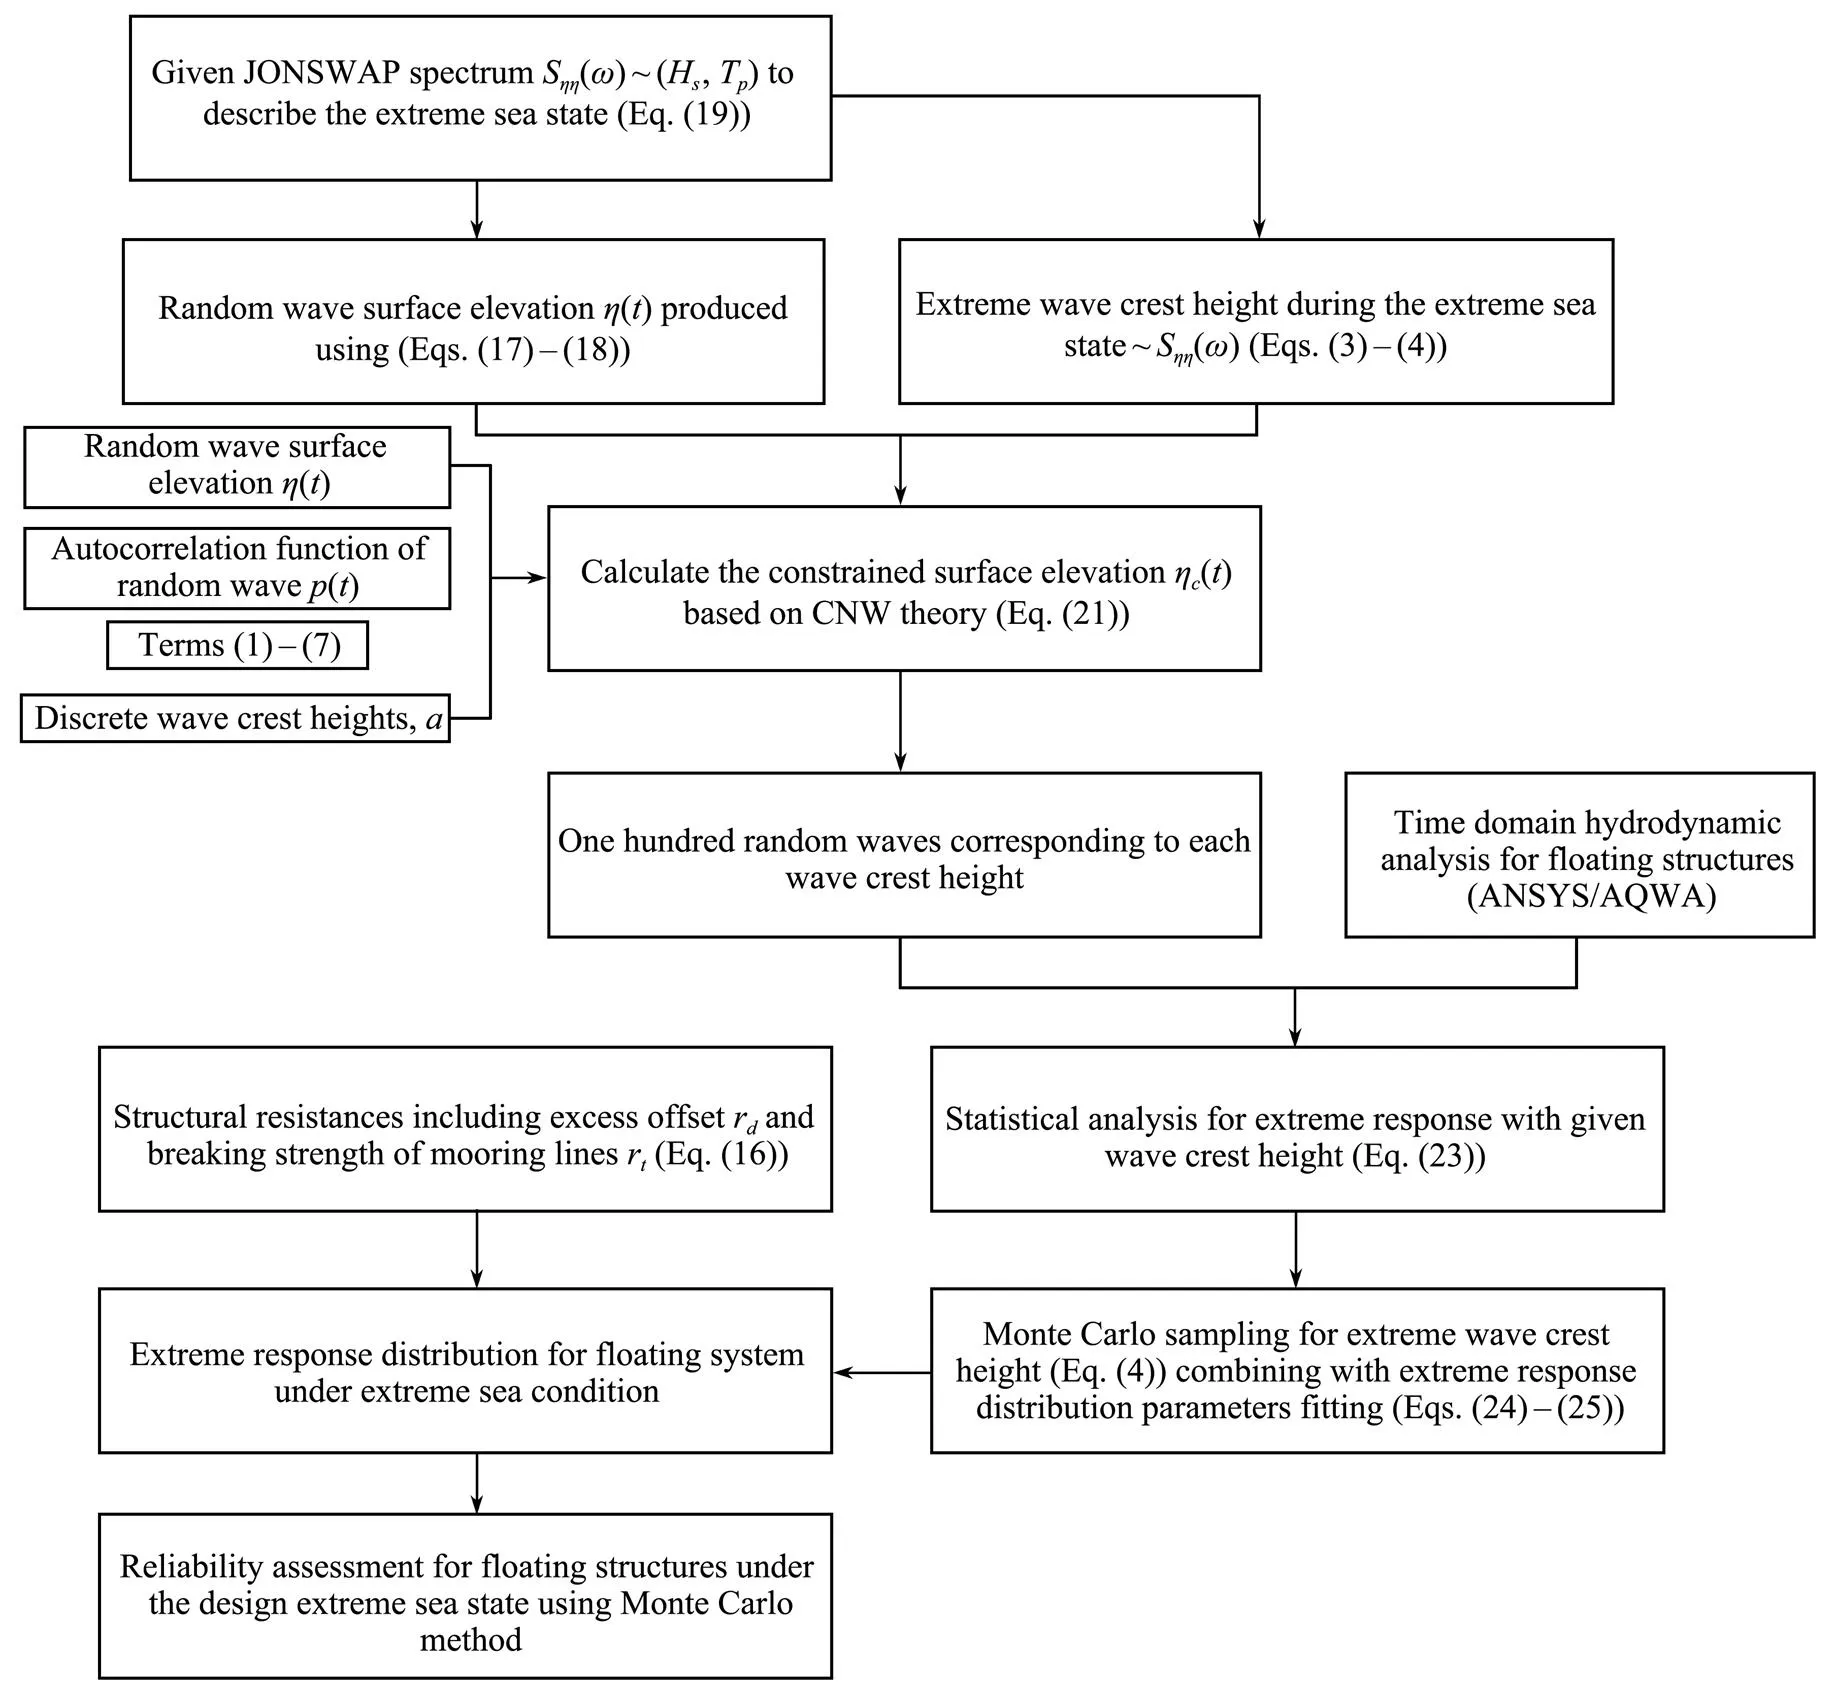
Fig.2 Flowchart of the reliability calculation using the Monte Carlo method.
4 Numerical Example
A semi-submersible platform operating at a water depth of 1500m is used as an example to demonstrate the application of this methodology. In this case, the mooring lines tensions and body motions are used as the evaluation objects of reliability of the semi-submersible, respectively, because they are important to evaluating whether the floating structure can operate safely or survive in the extreme environment. The failure of the semi-submersible platform exposed to an extreme sea state is evaluated by calculating the response statistics of the maximum drift and tension.
4.1 Semi-Submersible Platform Model
This semi-submersible is a multi-functional platform com- prised of two pontoons, four columns, and four braces. The geometry of the platform hull is shown in Figs.3 and 4. Some of the dimensions of the floating platform are presented in Table 1. The wet surface and braces of floating platform are modeled using SHELL and PIPE elements,respectively, for a total of 4592 elements after meshing the platform. There are 12 mooring lines in four groups, the head, tail, left, and right, symmetrically arranged. The longitudinal angles between each group of three mooring linesand the platform are 37?, 40?, and 45?, as depicted in Fig.4. The mooring lines are made up of chains and polyester ropes. The properties of the mooring lines are shown in Table 2.

Fig.3 Geometry of the semi-submersible.
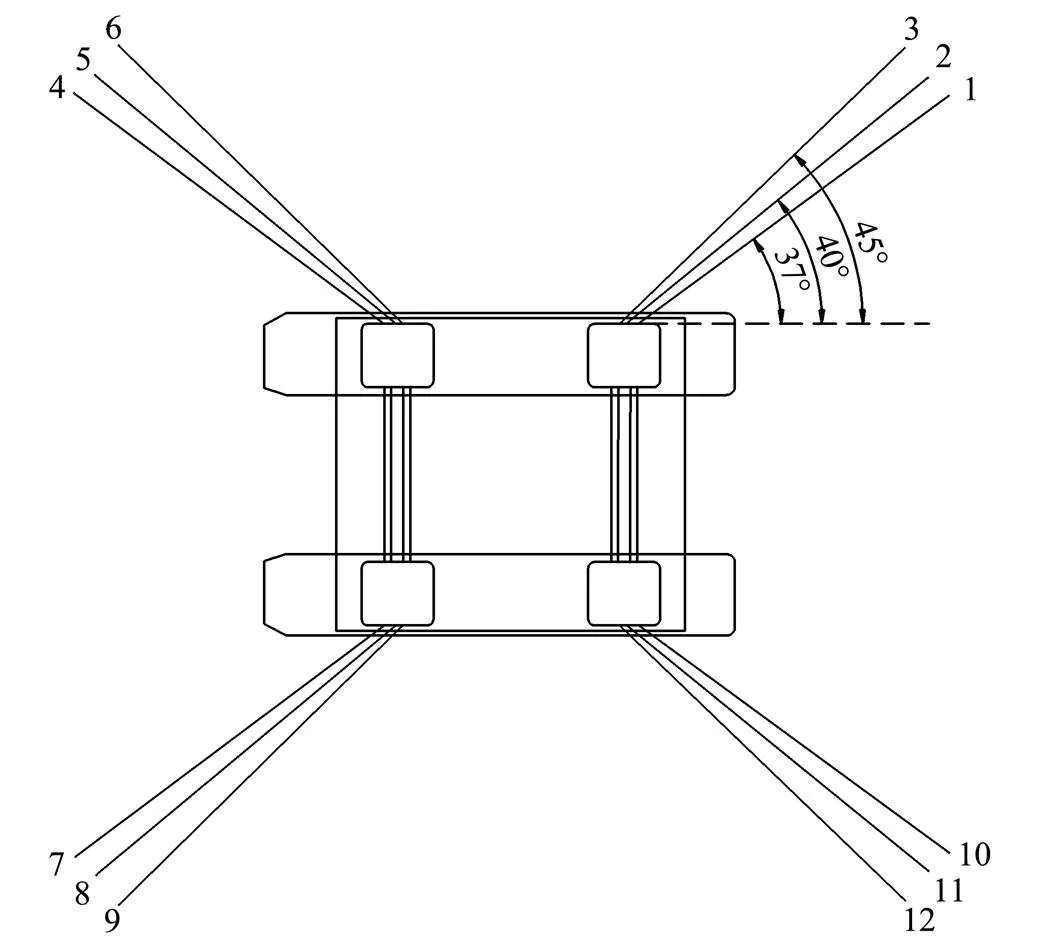
Fig.4 Illustration of the semi-submersible with 12 mooring lines.
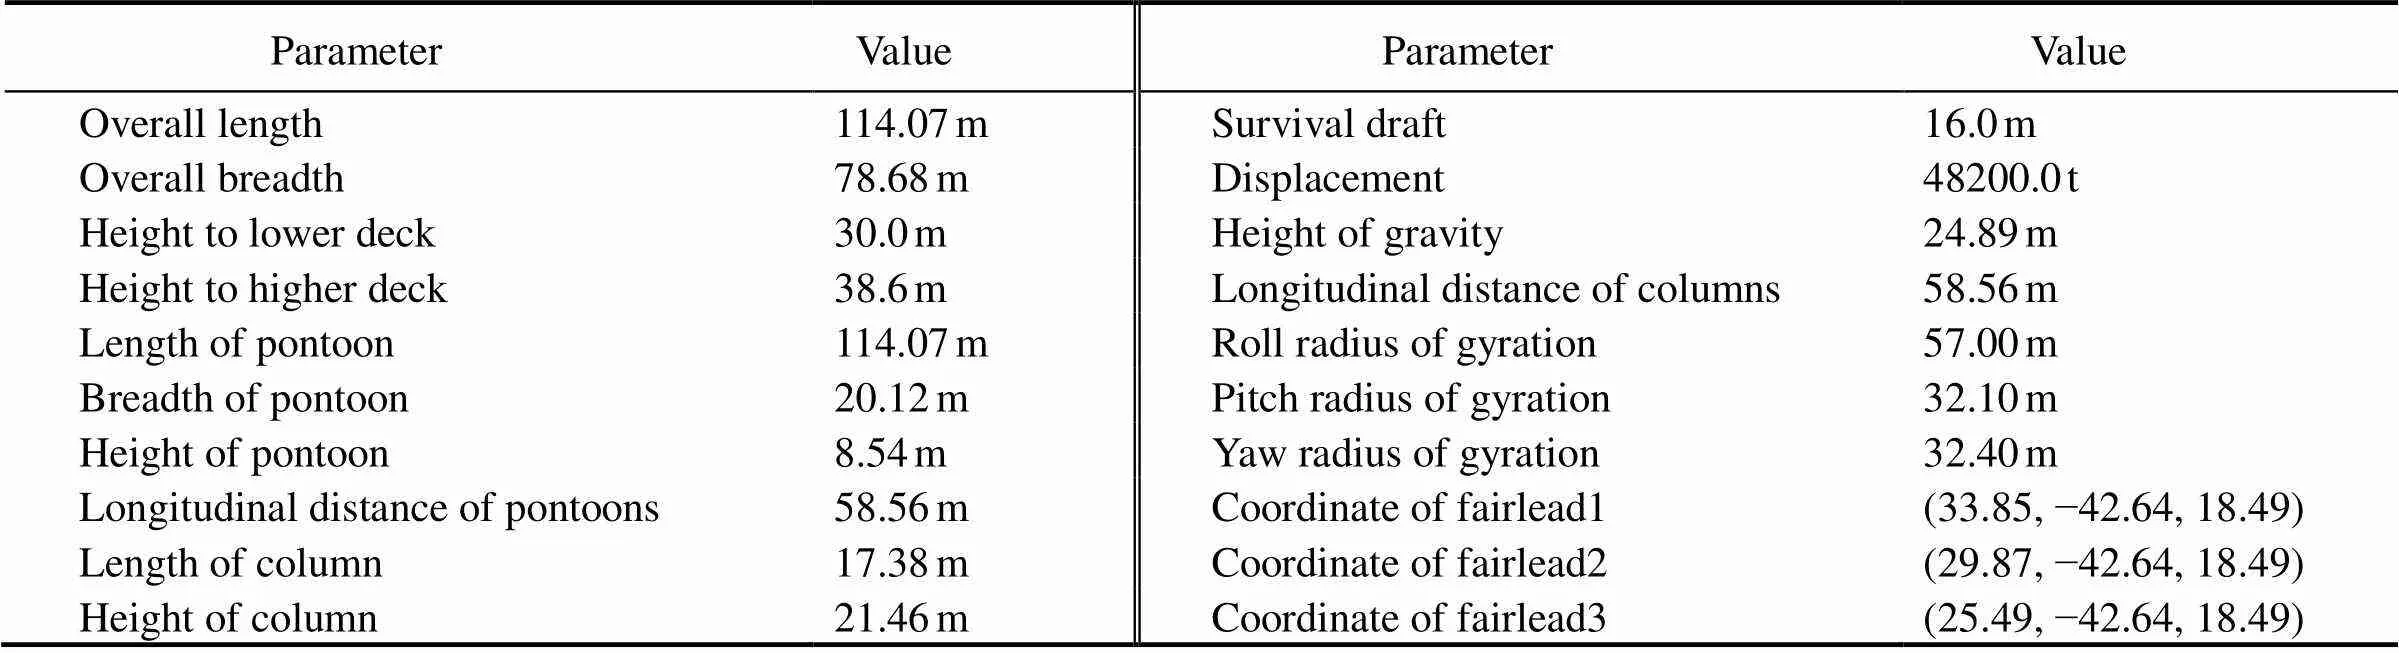
Table 1 Main characteristics of semi-submersible
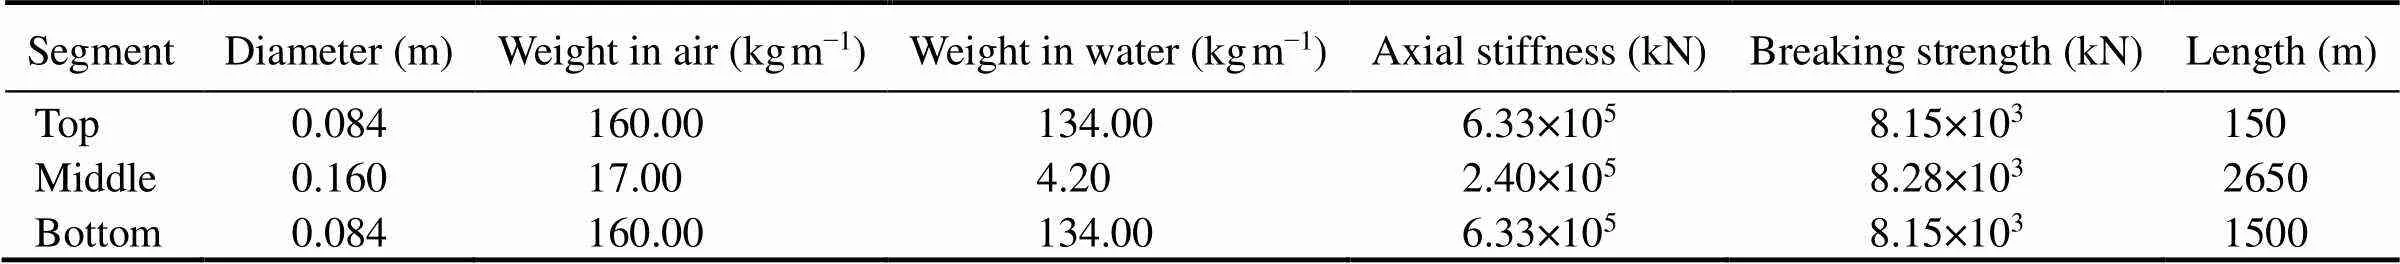
Table 2 Main parameters of the catenary mooring line
4.2 Extreme Environmental Conditions
A hindcast study of wave conditions from a storm whose return period was 50 years in this sea area are represented by the JONSWAP model with a significant wave heightH=12.45m and a peak periodT=13.46s. The reliability analysis for the semi-submersible at the predefined extreme sea state was performed. In this study, a code was developed to simulate random waves by generating water surface elevation with specified crest heights based on CNW theory (Mirzadeh, 2015), and then the wave data was implemented in ANSYS/AQWA software.
The statistical characteristics were determined as described in Section 2.1 and the extreme environmental loads were simulated to conduct dynamic analysis. The number of amplitudes during a storm condition ispeak≈790 (Mirzadeh, 2015), the crest wave height and extreme height distribution during the sea condition are estimated and shown in Fig.5.
The crest heights were dispersed into seven heights from 10m to 16m at 1.0m intervals to determine the statistical parameters of extreme response of the semi-submersible based on the distribution of extreme crest height shown in Fig.5. The extreme crest heights were selected to represent the extreme wave conditions that may occur in a storm or other harsh environment with the spectrum parameters (H,T)=(12.45m, 13.46s). The wave surface elevation can then be simulated based on NW and CNW theories illustrated in Section 3.1 and Section 3.2. The number of wave cycles during in an extreme environmental periodN≈212 (Abaei, 2018a) and the wave surface elevation developed with different theories are shown in Fig.6. The peak value can be generated at an arbitrary specified time. Fig.7 shows the amplitude spectra of wave surface elevations. The spectrum reflects the peak amplitude at the peak period and the wave surface elevation developed from CNW theories is greater than developed from other theories.
The maximum values are chosen from the response time series as the extreme response of the structural system. The optimized quantity of maximum values to describe the extreme response distribution is undefined. One hundred sim- ulated waves based on CNW theory were generated for each discrete extreme crest wave height (Mirzadeh, 2015).The data were implanted in ANSYS/AQWA and hydrodynamic analysis was conducted to determine the extreme response distribution of the semi-submersible platform.
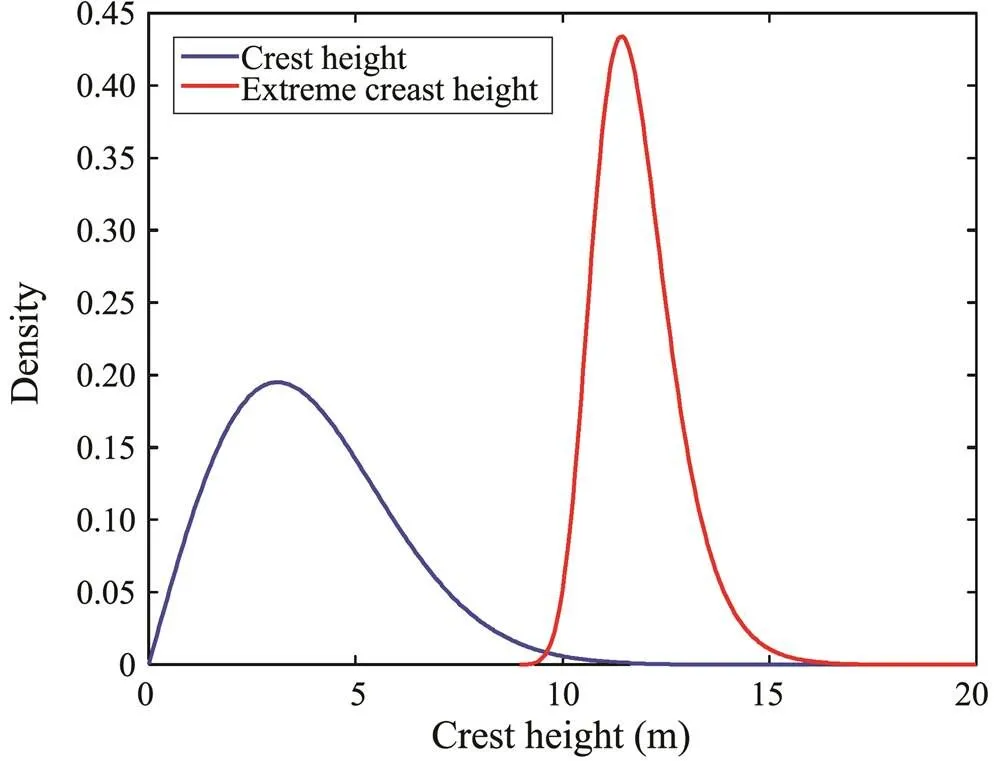
Fig.5 Crest height and extreme crest height distribution.
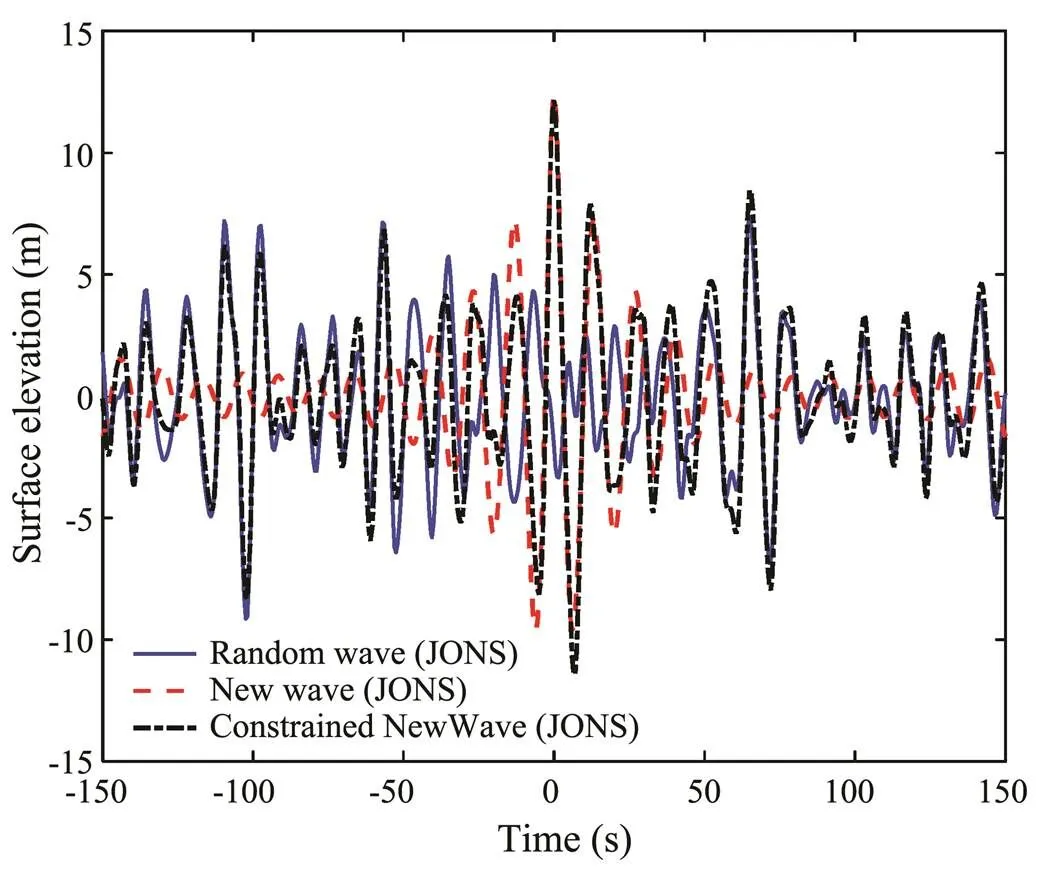
Fig.6 Wave surface elevation with extreme crest height at 12.45m developed from different theories.
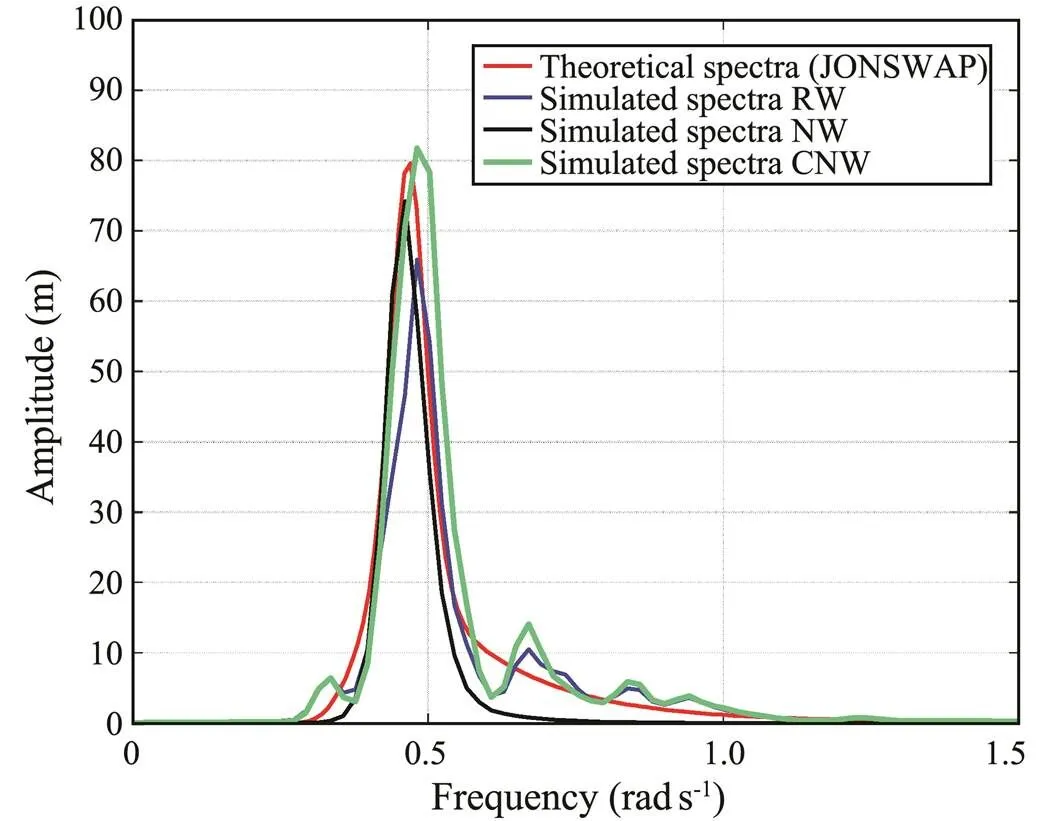
Fig.7 Wave amplitude spectra of surface elevations with an extreme crest height of 12.45m.
4.3 Dynamic Analysis and Evaluation of the Extreme Response Distribution
The dynamic analysis was conducted using ANSYS/AQWA (Ghafari and Dardel, 2018), a commercial software commonly used for analysis of floating structures. The hydrodynamic response of the semi-submersible platform was determined based on three-dimensional radiation/diffraction theories and Morison’s equation in ANSYS/AQWA software. To verify the feasibility of this methodology, only wave loads were applied on the floating structure, the effects of wind and current were ignored. Coupling dynamic analysis are performed with the wave heading angles parallel to the symmetry axis of the structure (-direction, 0?) such that the maximum drift was chosen from surge motions and the extreme tension was determined as the maximum value of all mooring lines tensions in the time domains.
4.3.1 Distribution of the maximum mooring line tension

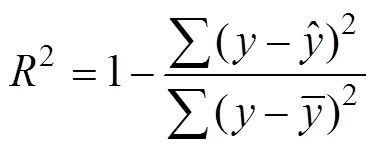
where y and are empirical and theoretical cumulative probability of the sample data, respectively; is the mean value of the empirical cumulative probability of the data. A large R2 implies good fitting results.
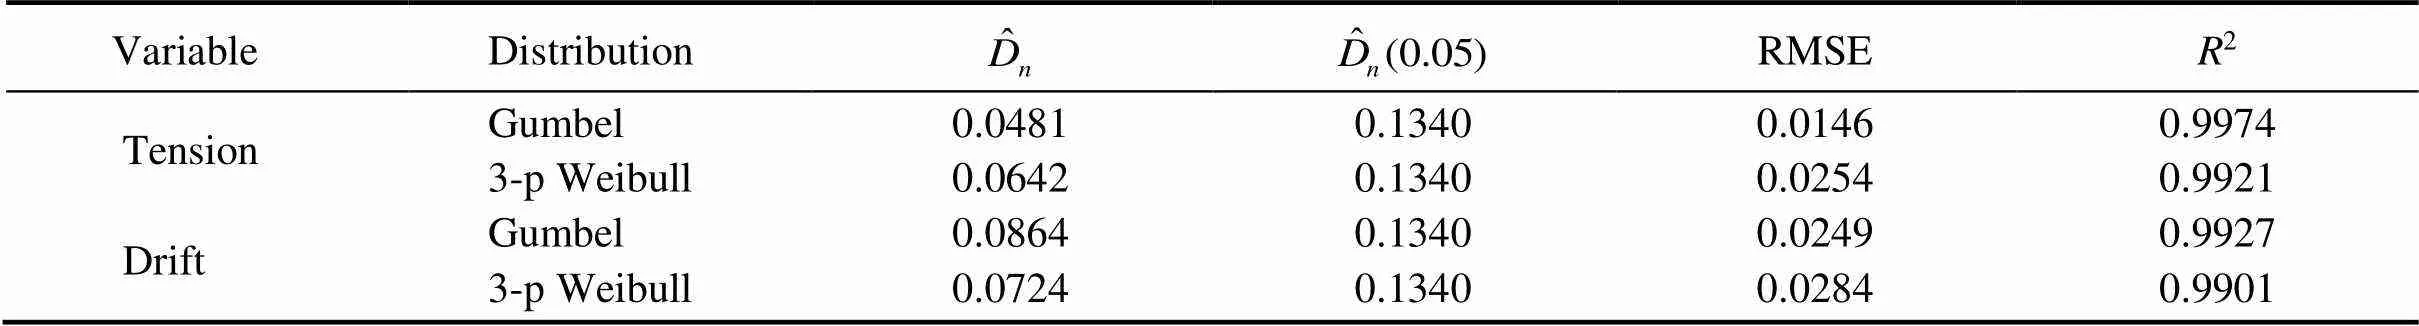
Table 3 Goodness-of-fit test results for different distributions of extreme response at a 10m crest height
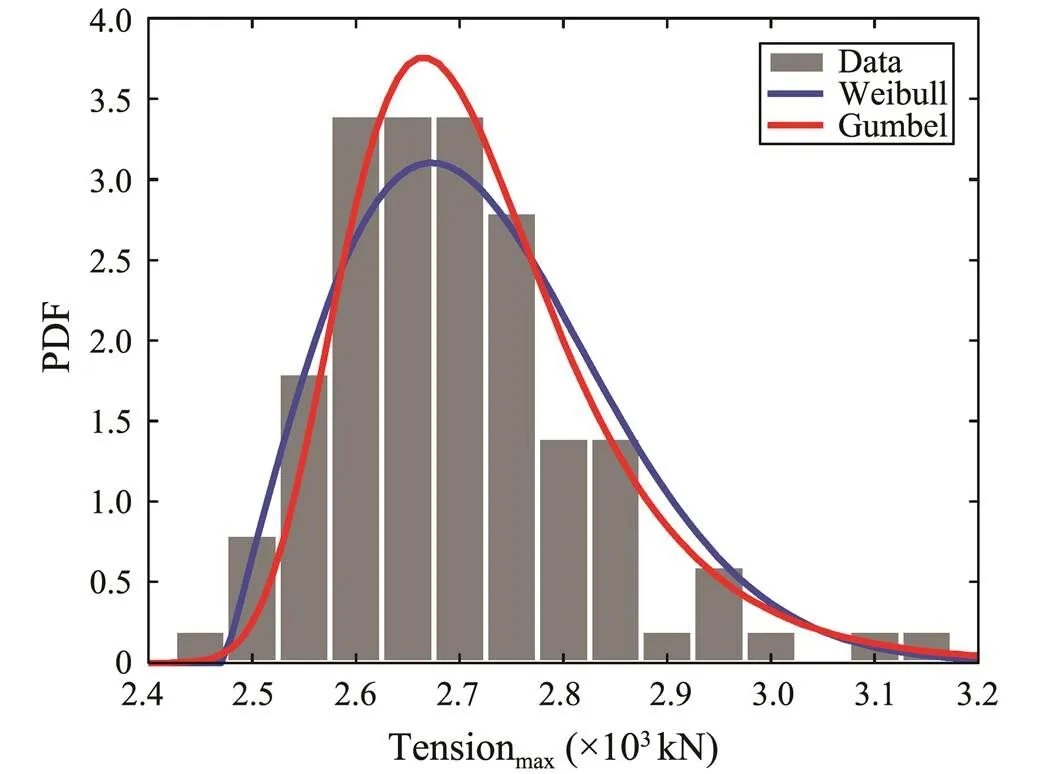
Fig.9 Extreme tension distribution fitting at a 10m crest height.
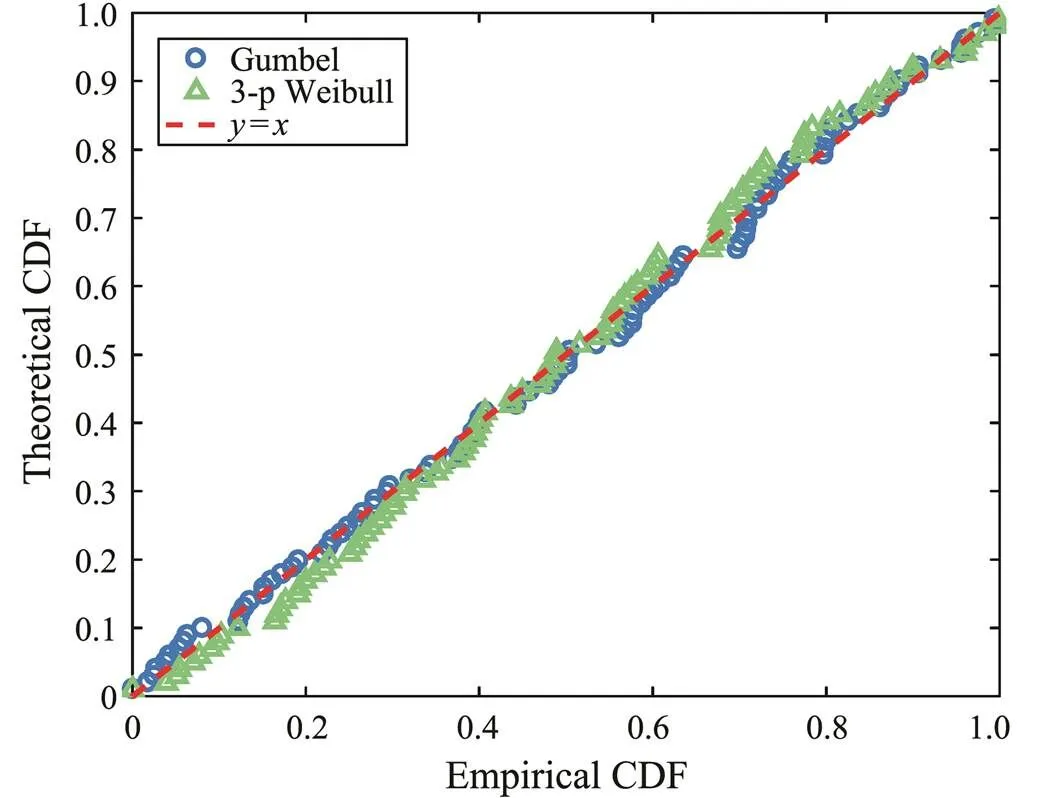
Fig.10 Q-Q plot of the extreme tensions at a 10m crest height.
The RSME and2values of Gumbel distribution are smaller than the 3-parameter Weibull distribution. Therefore, a two-parameter Gumbel distribution characterized the extreme tension of mooring lines reasonably well.
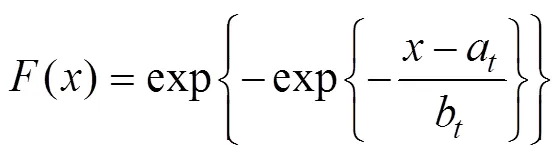
where() represents the cumulative Gumbel distribution function, andandare the location and scale parameters, respectively, which can be evaluated using the moments method. An extreme sea state can be simulated using the extreme wave crest elevation while the peak period is unchangeable (see Fig.5). Thus, the extreme response distribution parameters are investigated and can be expressed as=(H),=(H).
More sample data enables closer statistical law to the true distribution of the extreme response, while also creating more simulation time. In this work, a given extreme crest height produced one hundred random waves, corresponding to one hundred extreme values of response. A preliminary investigation to determine the quantity of extreme values required to describe extreme response distribution was performed. The entire data sample was divided into two groups (fifty data points in each group) and the statistical results are compared with the parameters obtained using the whole dataset. The empirical and theoretical distributions of extreme tension (maximum values) are depicted in Figs.11–12, respectively. The blackspot and black dotted lines are determined using the fifty random data samples, while the blue spot and red dotted lines are obtained from the entire data sample.

where α is the proper choice of percentile level for design loads. Based on the results (see Figs.11–12), the design parameters obtained by fewer maximum values have large uncertainties, sometimes large and sometimes small. Therefore, this paper chooses one hundred random simulations to determine the maximum values for statistical analysis. More accurate conclusions at the cost of more calculation time.
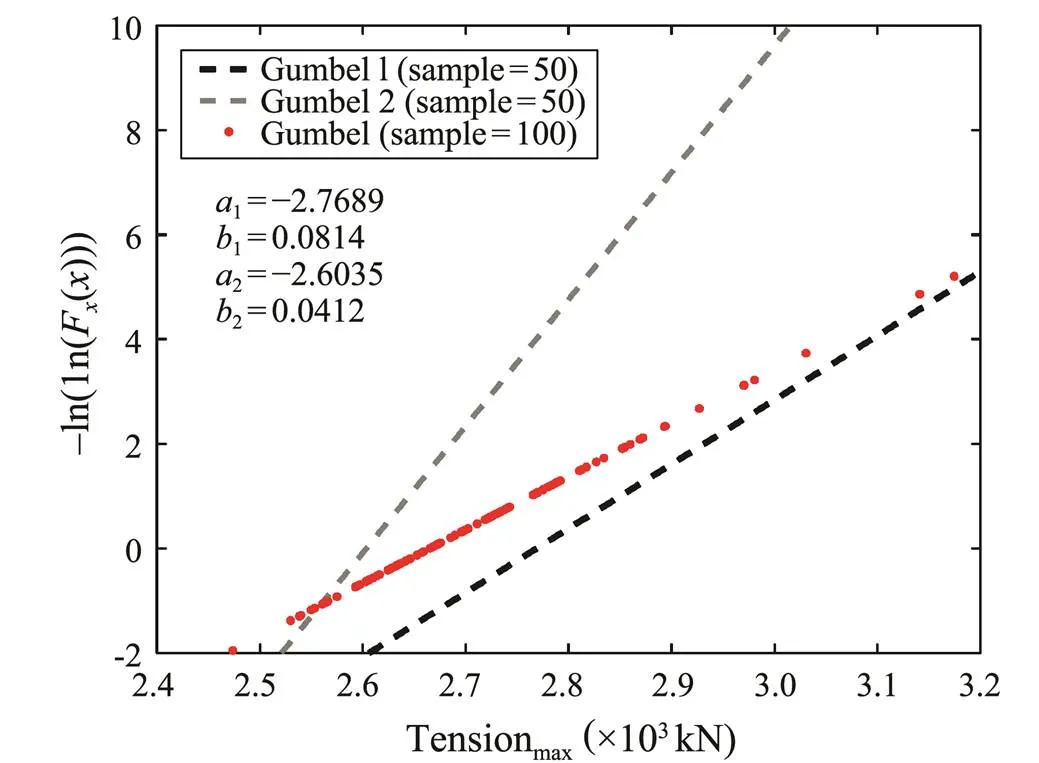
Fig.12 Gumbel distributions for extreme tension at a 10m crest height.
The distribution parameters of the extreme mooring line tension at discrete extreme wave crest heights were evaluated by fitting a Gumbel distribution. The statistical parameters, such as location parameter (a) and scale parameter (b) of the distribution corresponding to seven discrete extreme wave crest heights, are presented in Table 4. Based on these discrete points, the law of the variation of the distribution parameters with extreme crest heights can be concluded.
Based on the results at seven discrete crest heights, the evaluation of the maximum tension distribution parameters for any extreme crest height can be estimated by linear or nonlinear fitting from Table 4. Fig.13 shows the best fitting functions for the location parameter (a) and scale parameter (b).
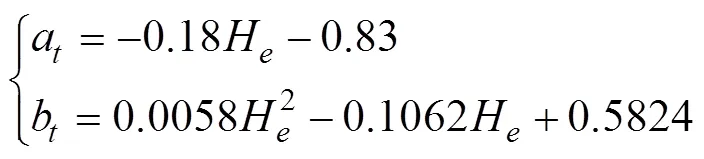
The maximum tension distribution of floating structure at arbitrary extreme wave crest heights and save a lot of simulation time can be predicted with Eq. (27).
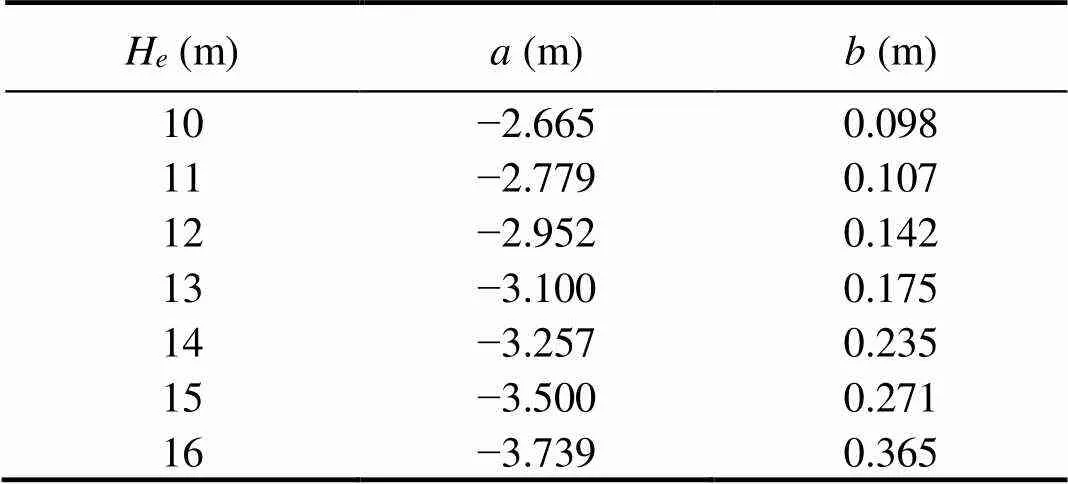
Table 4 Statistical parameters of the Gumbel probability distribution function of extreme tension
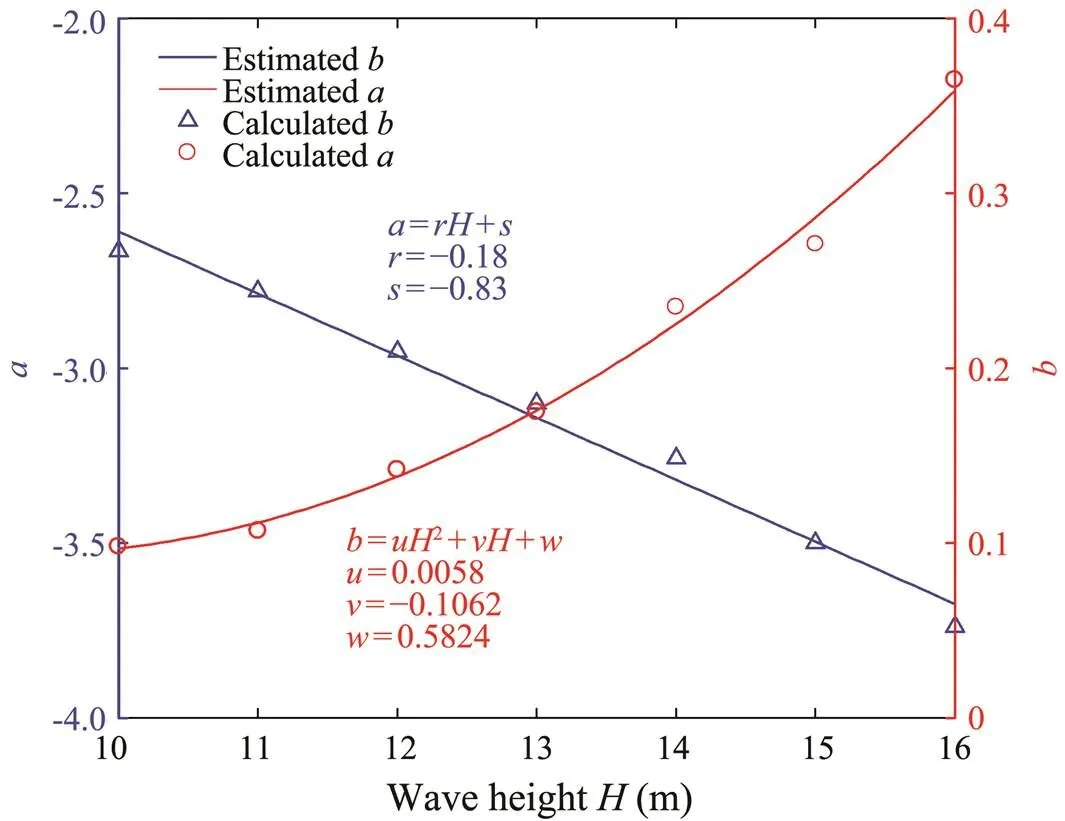
Fig.13 Distribution parameters fitting of maximum tension for any extreme crest height.
4.3.2 Distribution of maximum drift
The probability distribution of semi-submersible platform’s maximum drift was calculated based on the method presented in Section 4.3.1. The only difference is that the fitting object becomes the maximum body motion. The drift response at a 10m crest height is depicted in Fig.14.Similarly, a Gumbel distribution was the best fit for the maximum drift of a semi-submersible at an extreme wave height, the goodness-of-fit test results are listed in Table 3. The extreme value samples of drift and fitting curves and–plot of the data at a 10m extreme crest elevation are depicted in Figs.15–16. Table 5 shows the statistical parameters of distribution and corresponding discrete extreme crest heights. Fig.17 shows the best fitting functions for the location parameter (a) and scale parameter (b).
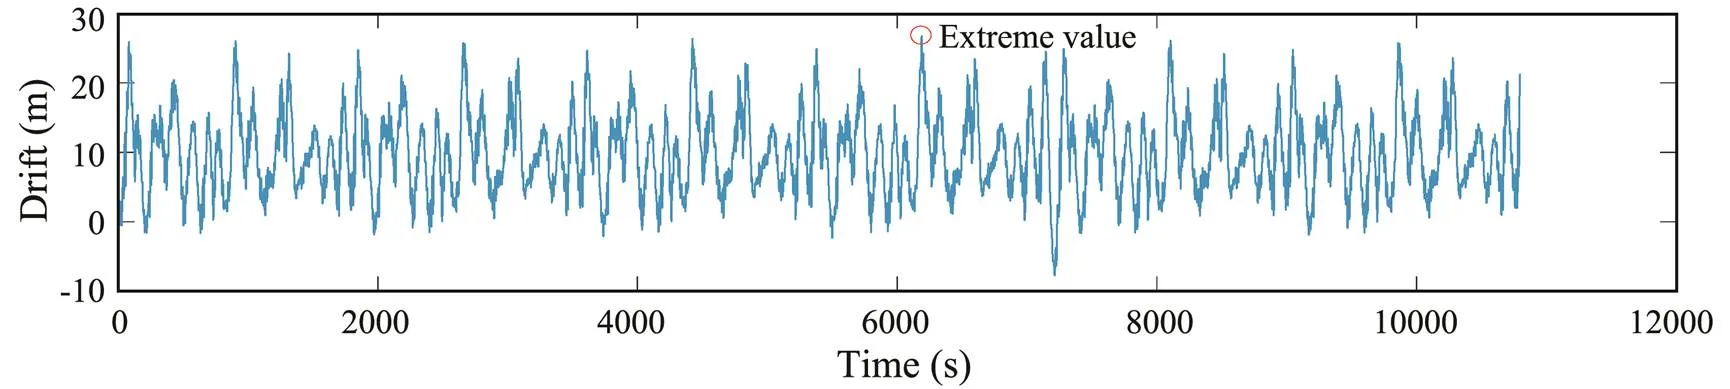
Fig.14 Drift response at a 10m crest height.
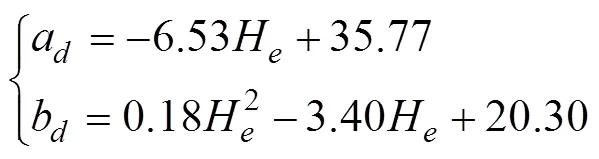
Table 5 Statistical parameters of the Gumbel probability distribution function of maximum drift
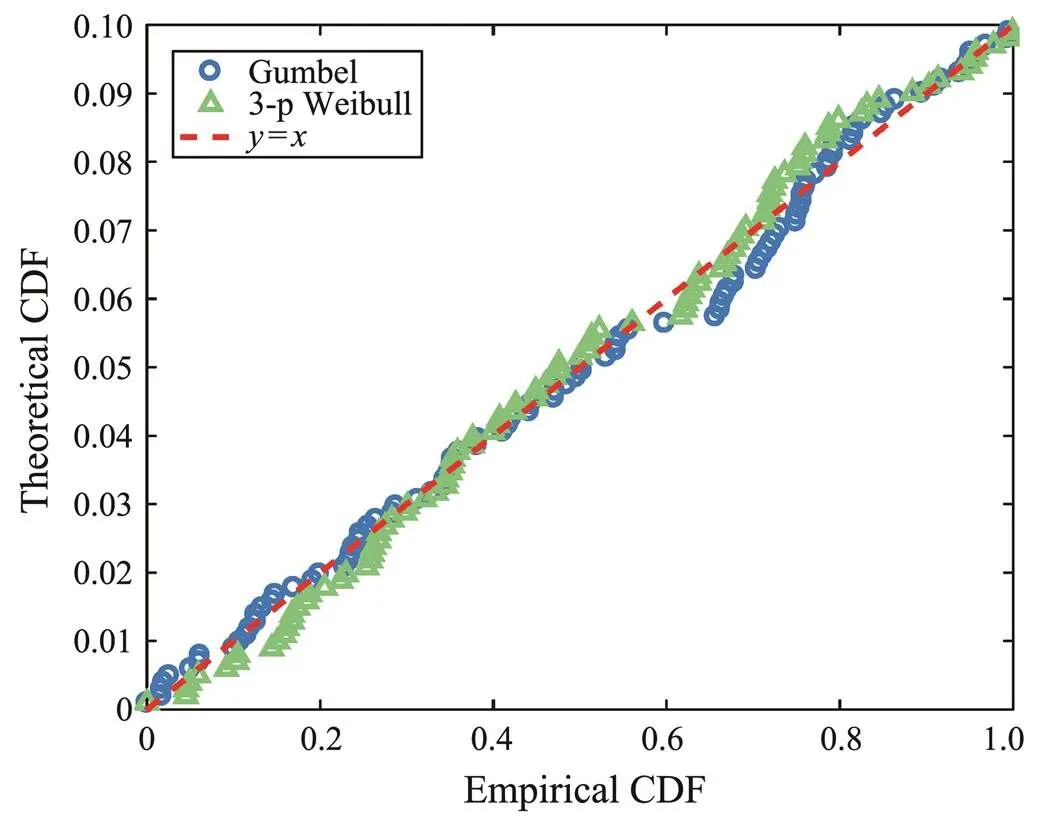
Fig.16 Q-Q plot of the extreme drift at a 10m crest height.
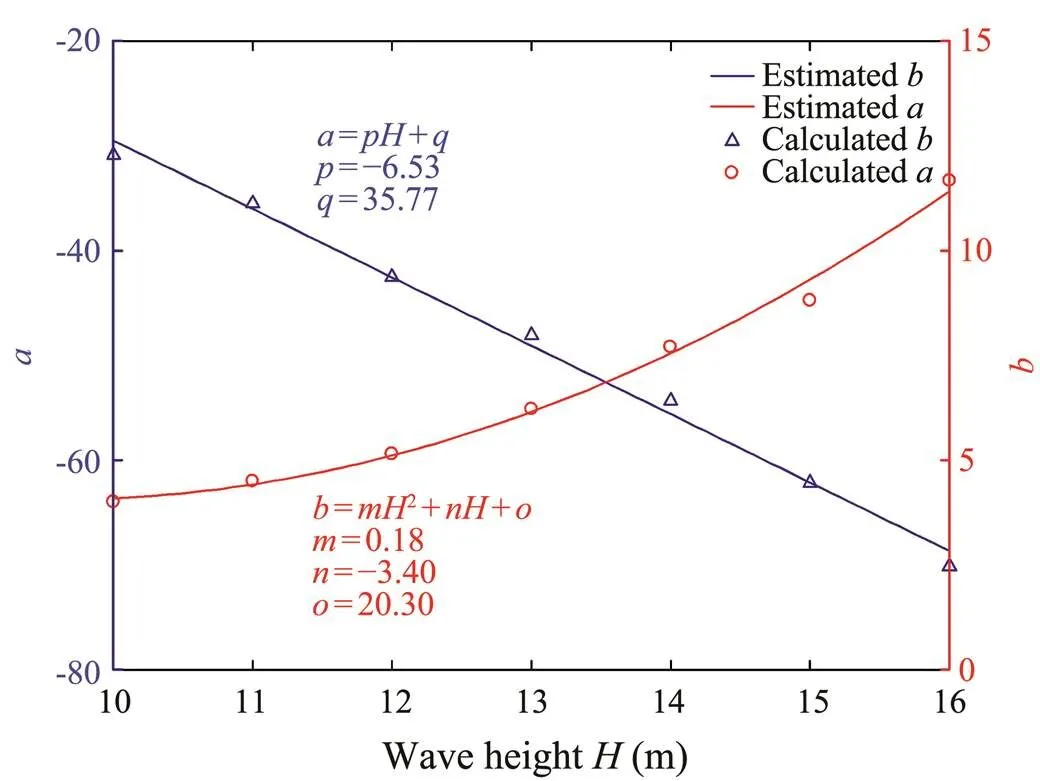
Fig.17 Distribution parameters fitting of maximum drift for any extreme crest height.
4.4 Reliability Assessment Results
4.4.1 Probability distribution function of the extreme response for a harsh environment
Based on the wave statistical characteristics presented in Section 4.2, numerous extreme crest heights were produced using Monte Carlo sampling method to simulate the extreme sea condition. Fig.18 shows the extreme crest height samples and the corresponding theoretical distribution.

Fig.18 Extreme crest height samples and corresponding theoretical distribution.
The extreme response distribution parameters at any crest height are shown in Fig.13 and Fig.17; therefore, the distribution of the extreme response for each extreme crest height sample can be determined. One hundred samples were used for each distribution and then the probability distribution function of the extreme response for the givensea state was evaluated, as shown in Figs.19 and 20. Overall, the Gumbel distribution was the best fitting of the extreme response of the floating structure under a given sea state. Figs.21 and 22 show the CDF of the extreme response in which the distribution parameters are (?3.00, 0.24) and (?44.04, 8.70).
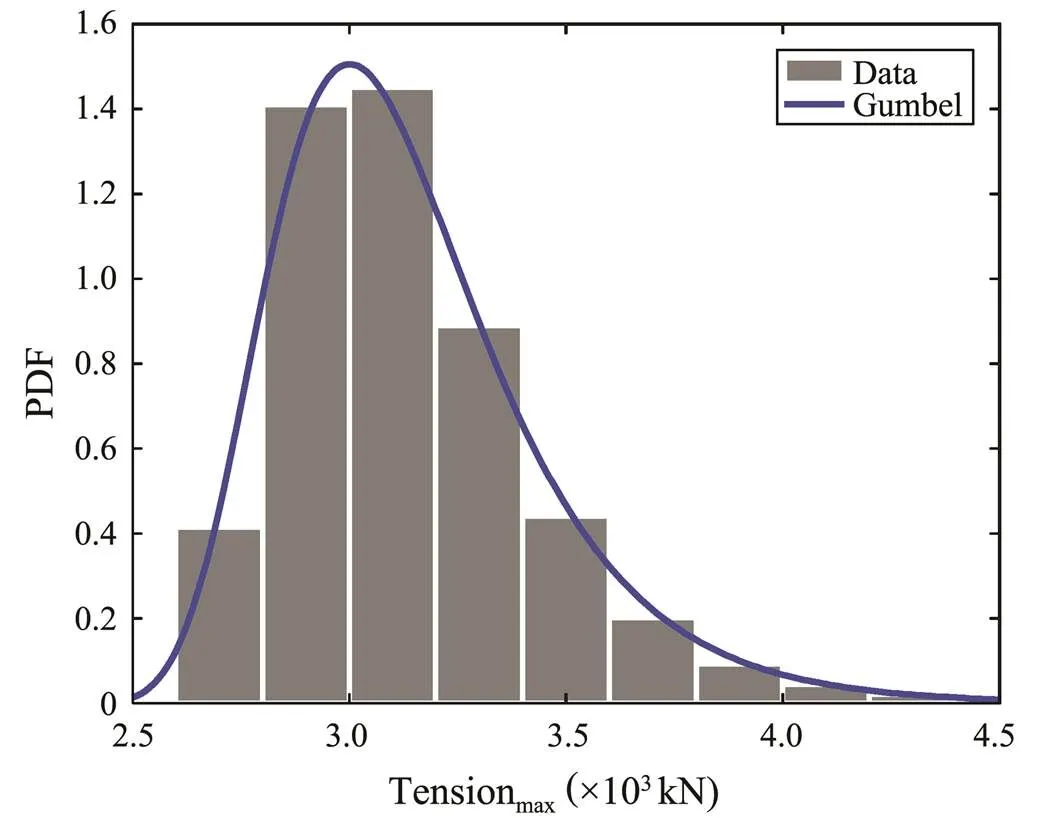
Fig.19 Maximum tension distribution fitting for a given sea state.
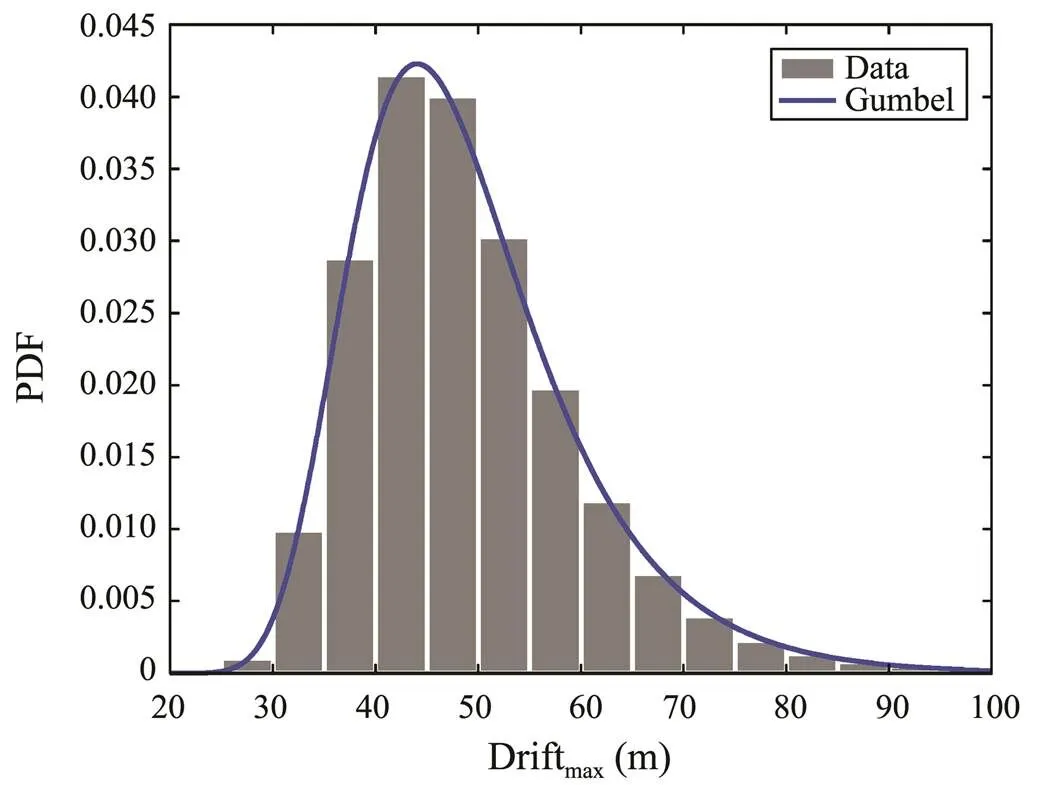
Fig.20 Maximum drift distribution fitting for a given sea state.
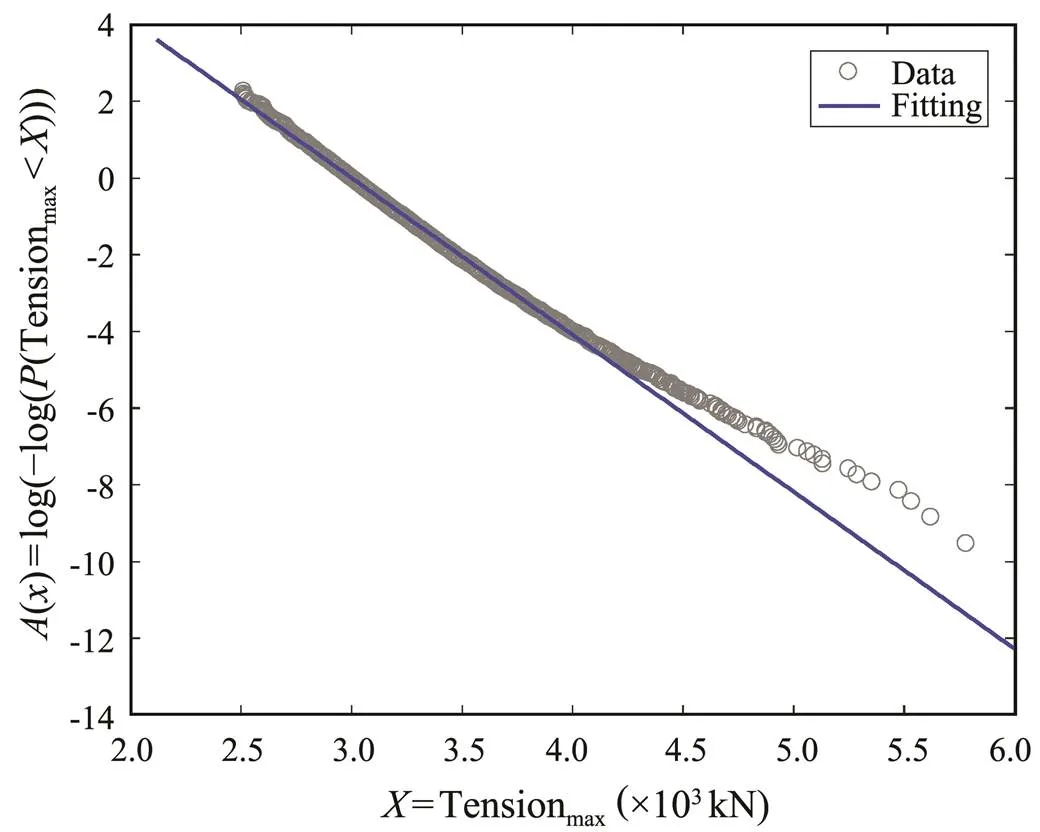
Fig.21 Fitting of the maximum tension for a given sea state.
4.4.2 Failure probability of floating structure
For the sample semi-submersible platform, the limit state function can be expressed as Eq. (1) and the failure probability of the floating structure can be evaluatedbased on(,)<0. The probability distribution functionsof extreme response, such as maximum tensionsand maxi- mum drifts, are shown in Fig.19 and Fig.20, respectively. In this case, the ultimate limit structural response followed guideline references. The allowable drift of the floating structure is no more than 8% of the water depth. The resistance considering breaking strength of mooring lines is defined using Eq. (17). Failures are assumed to occur when the extreme motions or mooring lines tensions exceed the allowable values. The probability of failure of the semi-submersible when considering mooring lines tension and drift at a given sea state were calculated by Monte Carlo method and were 1.68×10?4and 2.93×10?5, respectively.
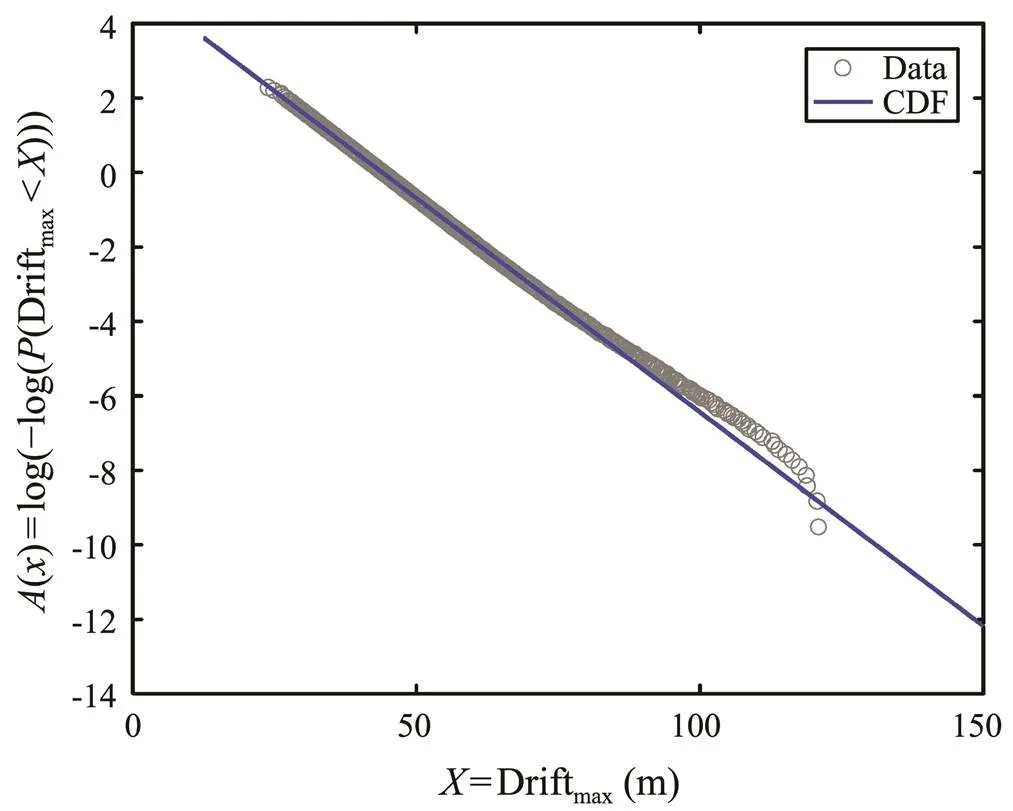
Fig.22 Fitting of the maximum drift for a given sea state.
5 Conclusions
A methodology for estimating the probability of failure of a floating structure subjected to extreme wave conditions was proposed. The proposed method simulated random wave surface elevation based on CNW theory and defined the limit state function of a semi-submersible platform considering mooring lines tensions and body motions.The Monte Carlo method was used for the reliability analysis after the probability distribution of extreme response and ultimate limit response were determined. Several conclusions can be drawn from numerous dynamic analyses of the semi-submersible platform based on this methodology:
1) A Gumbel distribution is the best fitting for the extreme response of the semi-submersible platform at an extreme wave crest height, and the statistical parameters of distribution at any crest height can be evaluated. The extreme response of the floating structure under a given extreme sea state follows the Gumbel distribution.
2) The hydrodynamic model was developed to simulate random behavior in both survival sea conditions and extreme response of floating structures. This proposed methodcan efficiently and conveniently estimate the failure probability of the semi-submersible platform. The method also provides a framework for reliability analysis of other floating structures.
3) For the example semi-submersible platform, the probability of failure evaluated by maximum drift was greater than that by mooring lines tension. Therefore, the ability to resist harsh conditions can be enhanced by strengthening the mooring systems.
4) However, the wind and current conditions and the effects of directionality of the incoming environmental conditions were ignored in this case. Further studies based on comprehensive environmental loads and other floating marine structures, such as TLP and offshore wind turbines, should be considered.
Acknowledgements
The study was supported by the National Key Research and Development Program of China (No. 2016YFC0303401), the National Natural Science Foundation of China (No. 51779236), and the National Natural Science Foundation of China–Shandong Joint Fund (No. U1706226).
Abaei, M. M., and Abbassi, R., 2018. Reliability assessment of marine floating structures using Bayesian network., 76: 51-60.
Abaei, M. M., Arzaghi, E., Abbassi, R., Garaniya, V., Chai, S. H., and Khan, F., 2018a. A robust risk assessment methodology for safety analysis of marine structures under storm conditions., 156: 167-178.
Abaei, M. M., Arzaghi, E., Abbassi, R., Garaniya, V., Javanmardi, M., and Chai, S. H., 2018b. Dynamic reliability assessment of ship grounding using Bayesian Inference., 159: 47-55.
Bai, X. D., Zhao, Y. P., Dong, G. H., and Bi, C. W., 2018. Probabilistic analysis and fatigue life assessment of floating collar of fish cage due to random wave loads., 81: 93-105.
Bateman, W. J. D., Katsardi, V., and Swan, C., 2012. Extreme ocean waves. Part I. The practical application of fully nonlinear wave modelling., 34: 209-224.
Bennett, S. S., Hudson, D. A., and Temarel, P., 2012. A comparison of abnormal wave generation techniques for experimental modelling of abnormal wave-vessel interactions.,51: 34-48.
Bennett, S. S., Hudson, D. A., and Temarel, P., 2013. The influence of forward speed on ship motions in abnormal waves: Experimental measurements and numerical predictions., 39: 154-172.
Bucelli, M., Landucci, G., Haugen, S., Paltrinieri, N., and Cozzani, V., 2018. Assessment of safety barriers for the prevention of cascading events in oil and gas offshore installations operating in harsh environment., 158: 171-185.
Cassidy, M. J., 1999. Non-linear analysis of jack-up structures subjected to random waves. PhD thesis. University of Oxford.
Cassidy, M. J., Eatock Taylor, R., and Houlsby, G. T., 2001.Analysis of jack-up units using a Constrained NewWave methodology., 23 (4): 221-234.
Cassidy, M. J., Taylor, P. H., Eatock Taylor, R., and Houlsby, G. T., 2002. Evaluation of long-term extreme response statistics of jack-up platforms., 29 (13): 1603-1631.
Clauss, G. F., and Klein, M., 2013. How safe is ‘safe’? Ship dynamics in critical sea states., 72: 87-97.
Fonseca, N., Pascoal, R., Guedes Soares, C., Clauss, G., and Schmittner, C., 2010. Numerical and experimental analysis of extreme wave induced vertical bending moments on a FPSO., 32: 374-390.
Ghafari, H., and Dardel, M., 2018. Parametric study of catenary mooring system on the dynamic response of the semi-submersible platform., 153: 319-332.
Hallowell, S. T., Arwade, S. R., Fontana, C. M., DeGroot, D. J., Aubeny, C. P., Diaz, B. D.,, 2018. System reliability of floating offshore wind farms with multiline anchors., 160: 94-104.
Hosni Elhewy, A., Mesbahi, E., and Pu, Y., 2006. Reliability analysis of structures using neural network method., 21: 44-53.
Islam, R., Abbassi, R., Garaniya, V., and Khan, F., 2017. Development of a human reliability assessment technique for the maintenance procedures of marine and offshore operations., 50: 416-428.
Jensen, J. J., and Capul, J., 2006. Extreme response predictions for jack-up units in second order stochastic waves by FORM., 21: 330-337.
Kang, B. J., Kim, J. H., and Kim, Y., 2016. Engineering criticality analysis on an offshore structure using the first- and second-order reliability method., 8: 577-588.
Kang, F., Han, S. X., Salgado, R., and Li, J. J., 2015. System probabilistic stability analysis of soil slopes using Gaussian process regression with Latin hypercube sampling., 63: 13-25.
Keshtegar, B., and Chakraborty, S., 2018. A hybrid self-adaptive conjugate first order reliability method for robust structural reliability analysis., 53: 319-332.
Khakzad, N., Khan, F., and Amyotte, P., 2011. Safety analysis in process facilities: Comparison of fault tree and Bayesian network approaches., 96: 925-932.
Kim, D. H., and Lee, S. G., 2015. Reliability analysis of offshore wind turbine support structures under extreme ocean environmental loads., 79: 161-166.
Leimeister, M., and Kolios, A., 2018. A review of reliability-based methods for risk analysis and their application in the offshore wind industry., 91: 1065-1076.
Li, F., Zhou, J., and Liu, C., 2018. Statistical modelling of extreme storms using copulas: A comparison study., 142: 52-61.
Liu, L. Q., Bian, H. D., Du, Z. F., Xiao, C. S., Guo, Y., and Jin, W. C., 2019. Reliability analysis of blade of the offshore wind turbine supported by the floating foundation.,211: 287-300.
Longuet-Higgins, B. M. S., 1963. The effect of non-linearities on statistical distributions in the theory of sea waves., 17: 459-480.
Mathisen, J., and H?rte, T., 2005. Calibration of a fatigue limit state for mooring lines.. Barcelona, 1-17.
Mirzadeh, J., Kimiaei, M., and Cassidy, M. J., 2015. A framework to efficiently calculate the probability of failure of dynamically sensitive structures in a random sea., 110: 215-226.
Mirzadeh, J., Kimiaei, M., and Cassidy, M. J., 2016a. Effects of irregular nonlinear ocean waves on the dynamic performance of an example jack-up structure during an extreme event., 49: 148-162.
Mirzadeh, J., Kimiaei, M., and Cassidy, M. J., 2016b. Performance of an example jack-up platform under directional random ocean waves., 54: 87-100.
Montes-Iturrizaga, R., Heredia-Zavoni, E., and Silva-González, F., 2007. On the estimation of mooring line characteristic resistance for reliability analysis., 29 (4): 239-241.
Montes-Iturrizaga, R., Heredia-zavoni, E., Silva-gonzález, F., and Straub, D., 2012. Nested reliability analysis of mooring lines for floating systems., 34: 107-115.
Musharraf, M., Bradbury-Squires, D., Khan, F., Veitch, B., Ma- ckinnon, S., and Imtiaz, S., 2014. A virtual experimental technique for data collection for a Bayesian network approach to human reliability analysis., 132: 1-8.
Nava-Viveros, I., and Heredia-Zavoni, E., 2018. Assessment of statistical parameter uncertainty in the reliability analysis of jacket platforms., 166: 370-379.
Ochi, M. K., 1998.. Cambridge University Press, Cambridge, 149-164.
Rendón-Conde, C., and Heredia-Zavoni, E., 2015. Reliability assessment of mooring lines for floating structures considering statistical parameter uncertainties., 52: 295-308.
Taylor, P. H., Jonathan, P., and Harland, L. A., 1997. Time domain simulation of jack-up dynamics with extremes of a Gaussian process., 119 (4): 624-628.
Tromans, P. S., Anaturk, A. R., and Hagemeijer, P., 1991. A new model for the kinematics of large ocean waves–application as a design wave.. Edinburgh, UK, 64-71.
Trucco, P., Cagno, E., Ruggeri, F., and Grande, O., 2008. A Bayesian Belief Network modelling of organizational factors in risk analysis: A case study in maritime transportation., 93: 823-834.
Vazquez-Hernandez, A. O., Ellwanger, G. B., and Sagrilo, L. V. S., 2006. Reliability-based comparative study for mooring lines design criteria., 28 (6): 398-406.
Walker, D. A. G., Taylor, P. H., and Taylor, R. E., 2004. The shape of large surface waves on the open sea and the Draupner New Year wave., 26 (3-4): 73-83.
Wan, L., Zhang, C., Magee, A. R., Jin, J. Z., Han, M. M., Ang, K. K.,, 2018. An innovative mooring system for floating storage tanks and stochastic dynamic response analysis., 170: 361-373.
Wang, Q., and Fang, H. B., 2018. Reliability analysis of tunnels using an adaptive RBF and a first-order reliability method., 98: 144-152.
Wang, S., and Guedes Soares, C., 2016. Experimental and numerical study of the slamming load on the bow of a chemical tanker in irregular waves., 111: 369-383.
Xu, Y., ?iseth, O., Moan, T., and Naess, A., 2018. Prediction of long-term extreme load effects due to wave and wind actions for cable-supported bridges with floating pylons., 172: 321-333.
Zeinoddini, M., Nikoo, H. M., and Estekanchi, H., 2012. Endurance Wave Analysis (EWA) and its application for assessment of offshore structures under extreme waves., 37: 98-110.
October 26, 2020;
December 8, 2020;
December 29, 2020
? Ocean University of China, Science Press and Springer-Verlag GmbH Germany 2022
. Tel: 0086-532-66781125
E-mail: dongsh@ouc.edu.cn
(Edited by Xie Jun)
 Journal of Ocean University of China2022年2期
- Journal of Ocean University of China的其它文章
- Structure of the Potential Vorticity of an Explosive Cyclone over the Eastern Asian Region in Late November 2013
- Enzyme-Induced Carbonate Precipitation for the Protection of Earthen Dikes and Embankments Under Surface Runoff: Laboratory Investigations
- Isolation, Identification, and Quantitative Determination of Saponin in Apostichopus japonicus by HPLC-DAD
- Transcriptome Analysis of Pacific White Shrimp (Litopenaeus vannamei) Under Prolonged High-Salinity Stress
- Evaluation of the Bioavailability of Metals in Sediment from the Southern Coastal Wetland of the Qiantang Estuary by Using Diffusive Gradients in Thin Films Technique
- The Combined Effect of Plastic Particles Size and Concentration on Rotifers’ (Brachionus plicatilis) Performance