
META-R:A software to analyze data from multi-environment plant breeding trials
2020-10-22 08:57:14GregorioAlvroFrnciscoRorguezAngelPchecoJunBurgueJosCrossMteoVrgsPulinorezRorguezMrcoLopezCruz
The Crop Journal 2020年5期
Gregorio Alvro,Frncisco M.Roríguez,b,Angel Pcheco,,Jun Burgue?o,JoséCross,,Mteo Vrgs,c,Pulino Pérez-Roríguez,Mrco A.Lopez-Cruz*
aBiometrics and Statistics Unit,International Maize and Wheat Improvement Center(CIMMYT),Mexico,DF 6-641,06600,Mexico
bCentro de Investigación en Matemáticas(CIMAT)A.C.,Jalisco S/N,Col.Valenciana,Guanajuato,Gto 402,36023,Mexico
cUniversidad Autónoma Chapingo,Carretera Federal México-Texcoco km 38.5,Texcoco,México 63,56230,Mexico
dColegio de Postgraduados,Carretera México-Texcoco Km.36.5,Montecillo,Texcoco 63,56231,Mexico
eDepartment of Plant,Soil and Microbial Sciences,Michigan State University,1066 Bogue St,East Lansing,MI 48824,USA
ABSTRACT
1.Introduction
Appropriate use of statistical methods for selecting individuals(genotypes)with good performance under different environmental conditions is essential for breeding programs.Those individuals can be assessed in trials in single or multiple environments(locations,years,etc.)under different management conditions such as water stress and low nitrogen,or normal conditions.These trials,known as multienvironment trials(METs),can detect and explain whether there are repeatability or interaction mechanisms between genotypes and environments.They also indicate what kind of genotype is repeatable by estimating broad-sense heritability[1].
The experimental design is a core component of METs because it controls plot-to-plot variability and reflects the true genetic potential of each set of genotypes[2].Two experimental designs are widely used to lay out METs:randomized complete block designs(RCBD)and incomplete block designs(e.g.,lattice and alpha-lattice designs).The type of design that is used depends on the number of individuals to be evaluated,as well as field conditions,soil homogeneity and,sometimes,weather conditions.For example,when a small number of individuals(<10)are evaluated under homogeneous soil and optimal field conditions,a randomized complete block design is a good option.However,if the number of individuals to be evaluated is higher(>10),and field conditions include biotic and/or abiotic stress factors such as nutrient deficiencies(low nitrogen,phosphorus,potassium,etc.)and/or water availability(drought,optimal conditions),small sub-blocks should be used to try to homogenize field conditions and significantly reduce the within-environment variation.As a result,the differences between individuals can be detected accurately.In this case,a lattice or alpha-lattice design is a good choice[3].
Multi-environment trials generate a great deal of data and can give breeders valuable insight into the behavior of their genotypes and testing programs,especially if there is a simple and efficient way of analyzing them.However,unbalance is an inherent problem in data from RCBD and lattice designs,that can compromise precision when evaluating individuals,for instance,due to adverse field conditions,seed shortages or other errors.Linear mixed models containing a mixture of fixed and random effects,have been commonly used to analyze data derived from METs[4].Incomplete blocks,replicates and sites are considered random effects[3].In breeding programs,the goal is to estimate the variance components and make inferences about fixed effects(such as the effects of genotype,environment or management)and/or random effects(such as the effect of a genotype's breeding value).Inferences about fixed effects have come to be called estimates,whereas inferences about random effects are known as predictions.Procedures for obtaining estimators and predictors,such as ordinary least squares(OLS)or the likelihood theory,have been developed.The most widely used procedures are the best linear unbiased estimator(BLUE)and the best linear unbiased predictor(BLUP)[5–7].
Sometimes it is suspected that a trait,identified as the main response variable(MRV),is affected by another trait or set of traits called a covariate(s).Statistically speaking,this implies the existence of a high correlation or association between the MRV and the covariate(s).The importance of a covariate in METs is that it can improve the estimation of individuals'performance and reduce the experimental error.For example,in the case of yield,when crops are damaged by unusual meteorological events or external agents such as birds,rodents,worms,etc.,this means that some plants are missing from the experiment;hence,to obtain a good yield estimate,we need to include the number of plants as a covariate.For more effective selection of genotypes under stress conditions(drought stress or low nitrogen),it is very common to adjust yield(t ha-1)by anthesis date(days)and/or number of plants.In addition to significance,the sign of the covariate must be considered.For instance,if the covariate anthesis date is significant and positive,this implies that yield will increase with more days to anthesis;if the covariate is significant and negative,this implies that yield will decrease with more days to anthesis.The sign(positive or negative)of the covariate depends on the type of environment;if the target and selection environments do not match perfectly,selection will be ineffective unless yield is adjusted[8,9].
Very often breeders are interested in determining the genetic or environmental effect on the studied trait but rarely they consider how these effects act simultaneously on several traits or environments.The genetic correlation is an estimate of the additive genetic effect that is shared between a pair of traits or environments.Many important traits are positively or negatively correlated because they are controlled by the same genes.METs are a core component of breeding programs because they allow:(i)selecting individuals in one environment;(ii)selecting individuals based on analyses acrossenvironments;(iii)selecting individuals based on a set of multiple management conditions;(iv)determining the genetic correlations among traits;and(v)determining the genetic correlations among environments.
With the purpose of helping breeders to select the top performing individuals,a free suite of scripts called META-R was developed and linked to a graphical user interface(GUI)created in JAVA language.META-R analyzes METs by considering two experimental designs:RCBD and lattice experimental designs,which also perform covariance analyses(one or more covariates simultaneously),compute BLUEs and BLUPs,variance components for each model term,least significant difference(LSD at 5% of significance),coefficient of variation(CV)in percentage,and broad-sense heritability(H2).Most or all of these analyses can be obtained from ANOVA performed in other software,for instance,metan[10]is an R-package that offers a great variety of analyses for METs.META[3],QTL IciMapping[11],GenStat[12],and CropStat[13]are other alternatives that contain a user interface.META-R focuses only on analyzing multi-environment phenotypic data from experimental designs.Besides,META-R computes both phenotypic and genetic correlations among environments;and phenotypic and genetic correlations among traits either by environment or combined across environments.These correlations can be calculated either by management level or across all management levels.To show how META-R works,we used two data sets generated by the International Maize and Wheat Improvement Center(CIMMYT)with alpha-lattice and randomized complete block designs.
2.Materials and methods
2.1.Experimental data
The first data set comes from the DTMA(Drought Tolerance Maize for Africa)project and consists of 90 genotypes evaluated in nine environments;the experimental design per environment is a 9×10 alpha-lattice with two replications.Each environment represents a combination of location(Bako,Kakamega,Kiboko,Busia,Elgon)and planting condition(drought,low nitrogen,optimal).Four environments were managed under drought stress,two had low nitrogen and three had optimal conditions.The traits included in the analyses were anthesis date(AD,days),anthesis-to-silking interval(ASI,days),ratio of ears per plant(rEPP),number of plants at harvest(nP),and ear appearance(EA),in addition to grain yield(YLD,t ha-1).The YLD was adjusted by anthesis date or/and number of plants at harvest.For this experimental data set,BLUEs and BLUPs by environment and across environments(with and without covariable)will be calculated to determine the performance of the genotypes together with the heritability in wide sense,LSD at 5% and CV in %,among others.Furthermore,genetic correlations among environments will be assessed to create groups of environments in which the rank of genotypes are similar.Genetically correlated environments can be exploited to determine a selecting environment that can be used to breed for a target environment.
The second data set consists of 60 genotypes evaluated in 12 environments in seven Latin American countries;the experimental design was an RCBD with two replications.The traits assessed were:YLD,AD,silking date(SD,days),plant height(PH,cm),ear height(EH,cm),ear position(ratio between ear height and plant height,rEPH),and nP.The YLD data were collected in all environments,whereas data on the other traits were collected only in 11 environments.For this data set,the genetic correlation between traits will be calculated with the purpose of determining those highly correlated traits mainly with YLD.Genetic correlations among traits are used for doing indirect selection,predicting correlated responses(genetic gain),developing selection indices to select for multiple traits simultaneously,and determining the extent of G×E interaction to develop breeding strategies and understand the evolutionary process of traits.
2.2.META-R
META-R is a graphical user interface designed to work under the windows operating system.Its core component consists of a set of seven R scripts[14]developed from META[3].This suite is linked to a graphical user interface(GUI)created in the Java language.All scripts were developed using the LME4 package[15],which fits linear and generalized mixed effects models.A flow diagram of how META-R works is given in Fig.1.
2.3.Running META-R
META-R can be downloaded at no cost from the CIMMYT web link: https://data.cimmyt.org/dataset.xhtml?persistentId=hdl:11529/10201.Once META-R is downloaded,it can be installed by clicking twice on the file META-R.exe;the installed file is deposited in drive C;the software also generates a manual that can be consulted in case that any doubt arises.The next step is to load the data to be analyzed by clicking on‘Open File’(Fig.2)and the raw data to be analyzed.The data must be in a comma-separated file(csv)format with the names of the components of the experimental design(factors)and traits in the first row.After loading the data,the user must specify the details of the analysis to run(Fig.3):the experimental design to be analyzed,factor names,and the name of the output folder where the results will be saved.Analyses can be performed separately for each level of any grouping factor such as management,country,soil type,crop or any other criterion.Also,if adjusting by covariate(s)is desired,the user will be able to choose up to three covariates.
To go on to the next step,click on‘Continue’.In this step,the user needs to select the type of analysis to be performed(genetic correlation among environments,genetic correlation among traits,or BLUEs and BLUPs),the type of analysis(individual or combined,identifying or not identifying the management conditions)and the traits to be analyzed(Fig.4).When there are selected covariates,it is necessary to specify the trait of interest(MRV–Main Response variable-)that will be adjusted by the covariate(s),as well as choose secondary traits which could be adjusted by the covariate(s).META-R allows selecting whether the type of analysis will be by management,by environment,combined across all analyses without identifying management,or combined across all environments.Additionally,it is possible to select the environments to be included in the analysis.
The last step is running the analysis by clicking on‘Analyze’.While the program is running,a bar indicating that it is running will be displayed.When the analysis is complete,META-R will send the user a message that says“successful analysis”and the results will be saved in the output folder the user indicated at the beginning of the process.A window with a file explorer containing all files created in the output folder will be shown;the files can be opened by clicking twice on them,and the results of the analysis will be created in the same directory as the raw data.If the process finishes with errors,it will be displayed in the META-R screen where the possible causes can be seen.
A user-defined heritability threshold(default 0.05)will be applied to each single environment analysis to be considered in the calculation of both genetic correlations(among environments and among traits).Likewise,only those environments passing the heritability threshold will be included in all the combined analyses across environments.
2.4.Mixed and fixed models that make up META-R
The linear mixed models used in META-R are implemented in the LME4 R-package[15]that uses REML to estimate the variance components.
When the experimental design is an RCBD by one environment and adjusted by a covariate,the model becomes

On the other hand,the linear model for analyzing individual environments using a lattice or alpha-lattice design and adjusting by a covariate is:

where Yijkis the trait of interest,μis the overall mean effect,Repiis the effect of the ith replicate,Blockj(Repi)is the effect of the jth incomplete block within the ith replicate,Genkis the effect of the kth genotype,Cov is the effect of the covariate,andεijkis the effect of the error associated with the ith replication,jth incomplete block,and kth genotype,which is assumed to be iid normal with mean zero and varianceσε2.In both models,all effects,except the overall mean and covariate,are declared to be random and iid normal with mean zero and effect-specific variances.The random assumption for the genotype effects allows to calculate BLUPs and broad-sense heritability;however,when calculating BLUEs the genotypes are considered as fixed effects.For analyses of one environment without adjusting by a covariate,the models are the same as in Eqs.(1)and(2),except that the term of the covariate is deleted.
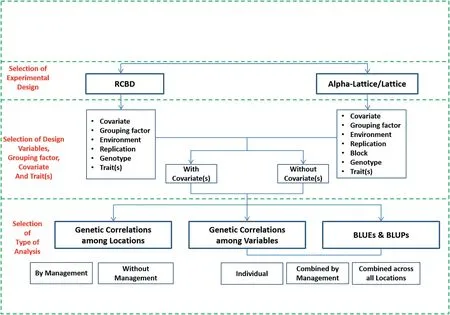
Fig.1–Flow diagram showing the logical process that META-R follows to perform METs analyses.
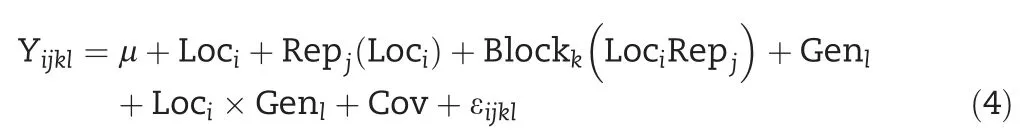
Regarding across environments analysis by management conditions or across all environments by all managements,new terms are added to the above models.Hence,for a combined analysis across environments on an RCBD,the model becomes

where the new terms Lociand Loci×Genkare the effects of the ith environment and the environment×genotype(G×E)interaction,respectively.
For the lattice or alpha-lattice design adjusted by a covariate,the model is
Likewise,all the effects,except the overall mean and covariate,are considered random and iid normal with mean zero and effect-specific variances.The genotype is regarded as fixed effect when calculating BLUEs.For combined analyses without adjusting by a covariate,the models are the same as in Eqs.(3)and(4),except that the term of the covariate is deleted.
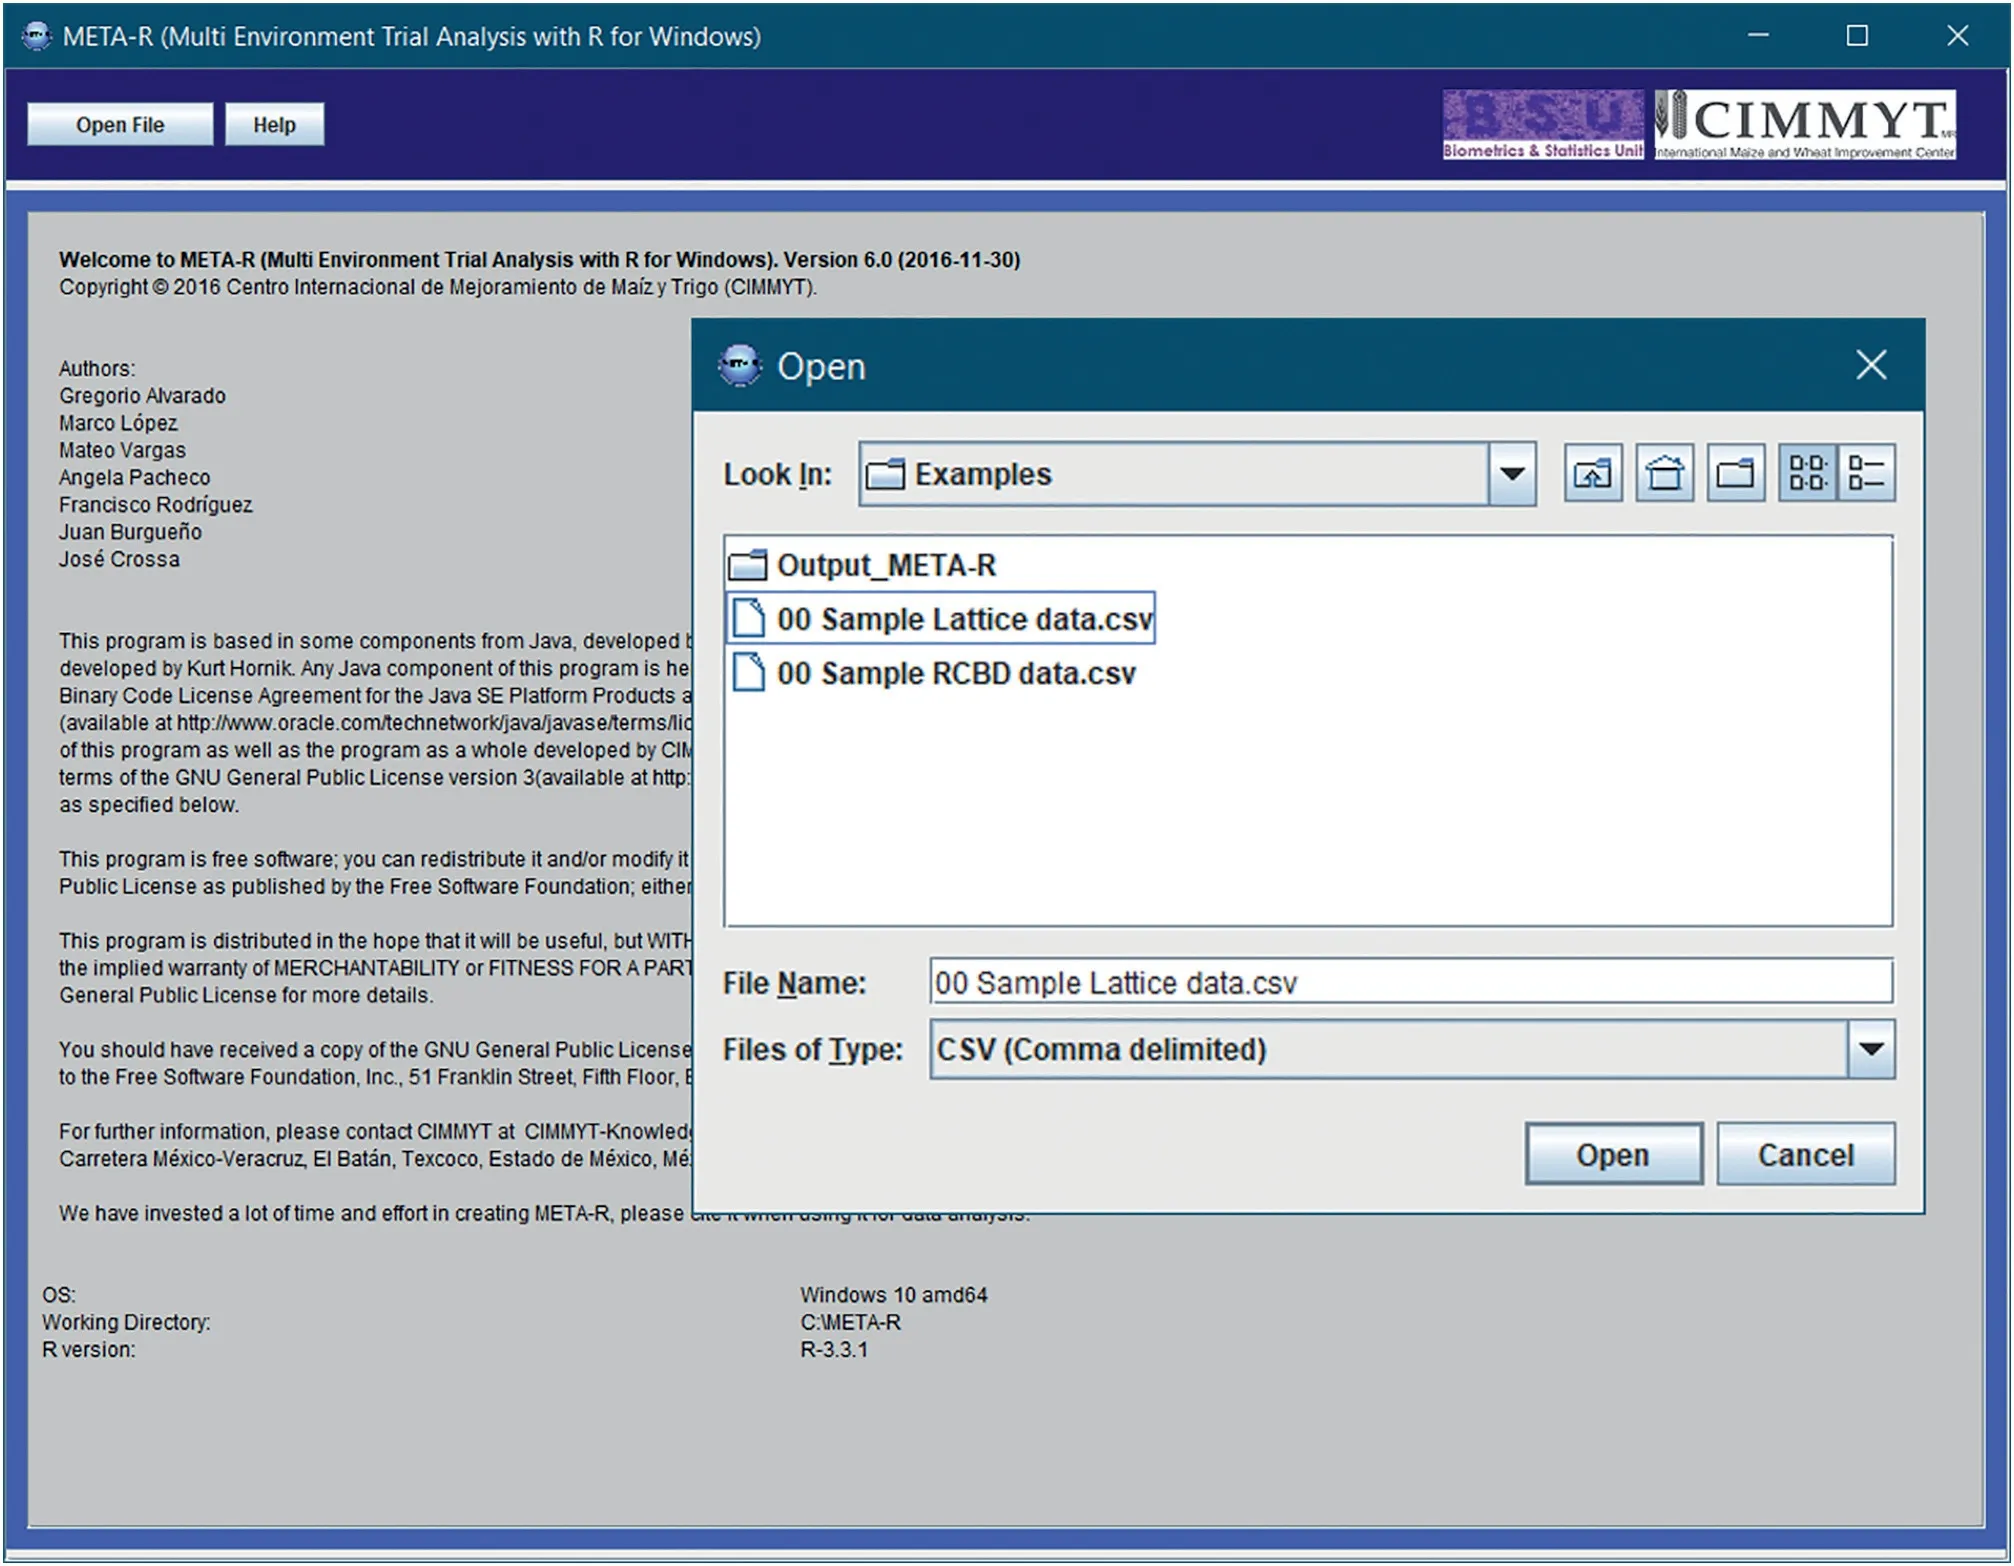
Fig.2–META-R input menu‘Open file’(needs comma delimited format(.csv)data)and‘Help’which contains the operation manual as well as the theory regarding multi-environment trials(METs)that supports META-R.
2.5.Heritability,genetic correlations and other statistics computed by META-R
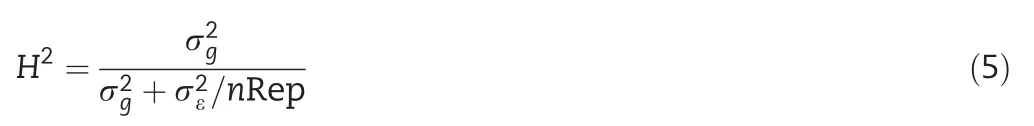
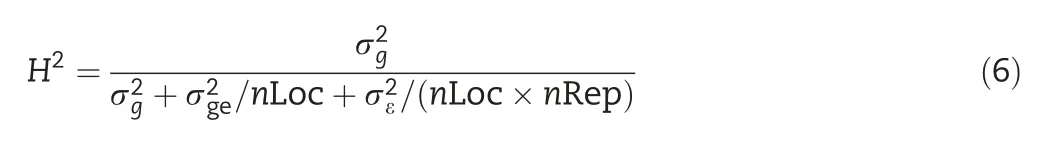
The broad-sense heritability of a given trait at an individual environment is calculated as
META-R calculates matrices of phenotypic and genetic correlations among environments(for a given trait)and among traits(either within a single environment or across environments),from which a distance matrix is calculated as the identity matrix(matrix with ones in the main diagonal and zeros elsewhere)minus the genetic correlation matrix.The distance matrix is used as the input data set to perform a cluster analysis and to create a dendrogram,as well as a biplot graph of the principal component analysis(PCA).Only traits whose heritability passing the user-specified threshold(the default is 0.05)are considered to create these plots.Both plots can be saved as a PDF,PNG,or WMF file.The WMF files can be imported into several Microsoft Office programs(Power Point,Excel,MS Word)in order to improve the quality by modifying such characteristics as size,color,and font type in labels or titles,among others.
The phenotypic correlations among environments or between traits are simple Pearson correlations between different pairs of environments or traits.The genetic correlations among environments are calculated using equations from Cooper[1],as
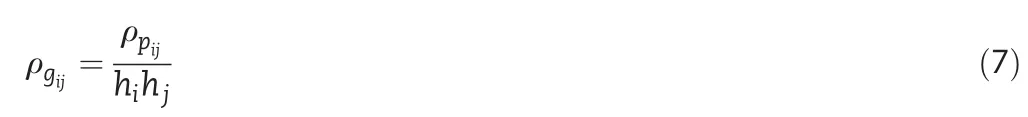
whereρpijis the phenotypic correlation between environments i and j;and hiand hjare the square roots of heritabilities of environments i and j,respectively,obtained using Eq.(5).


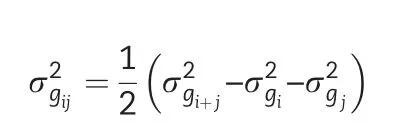
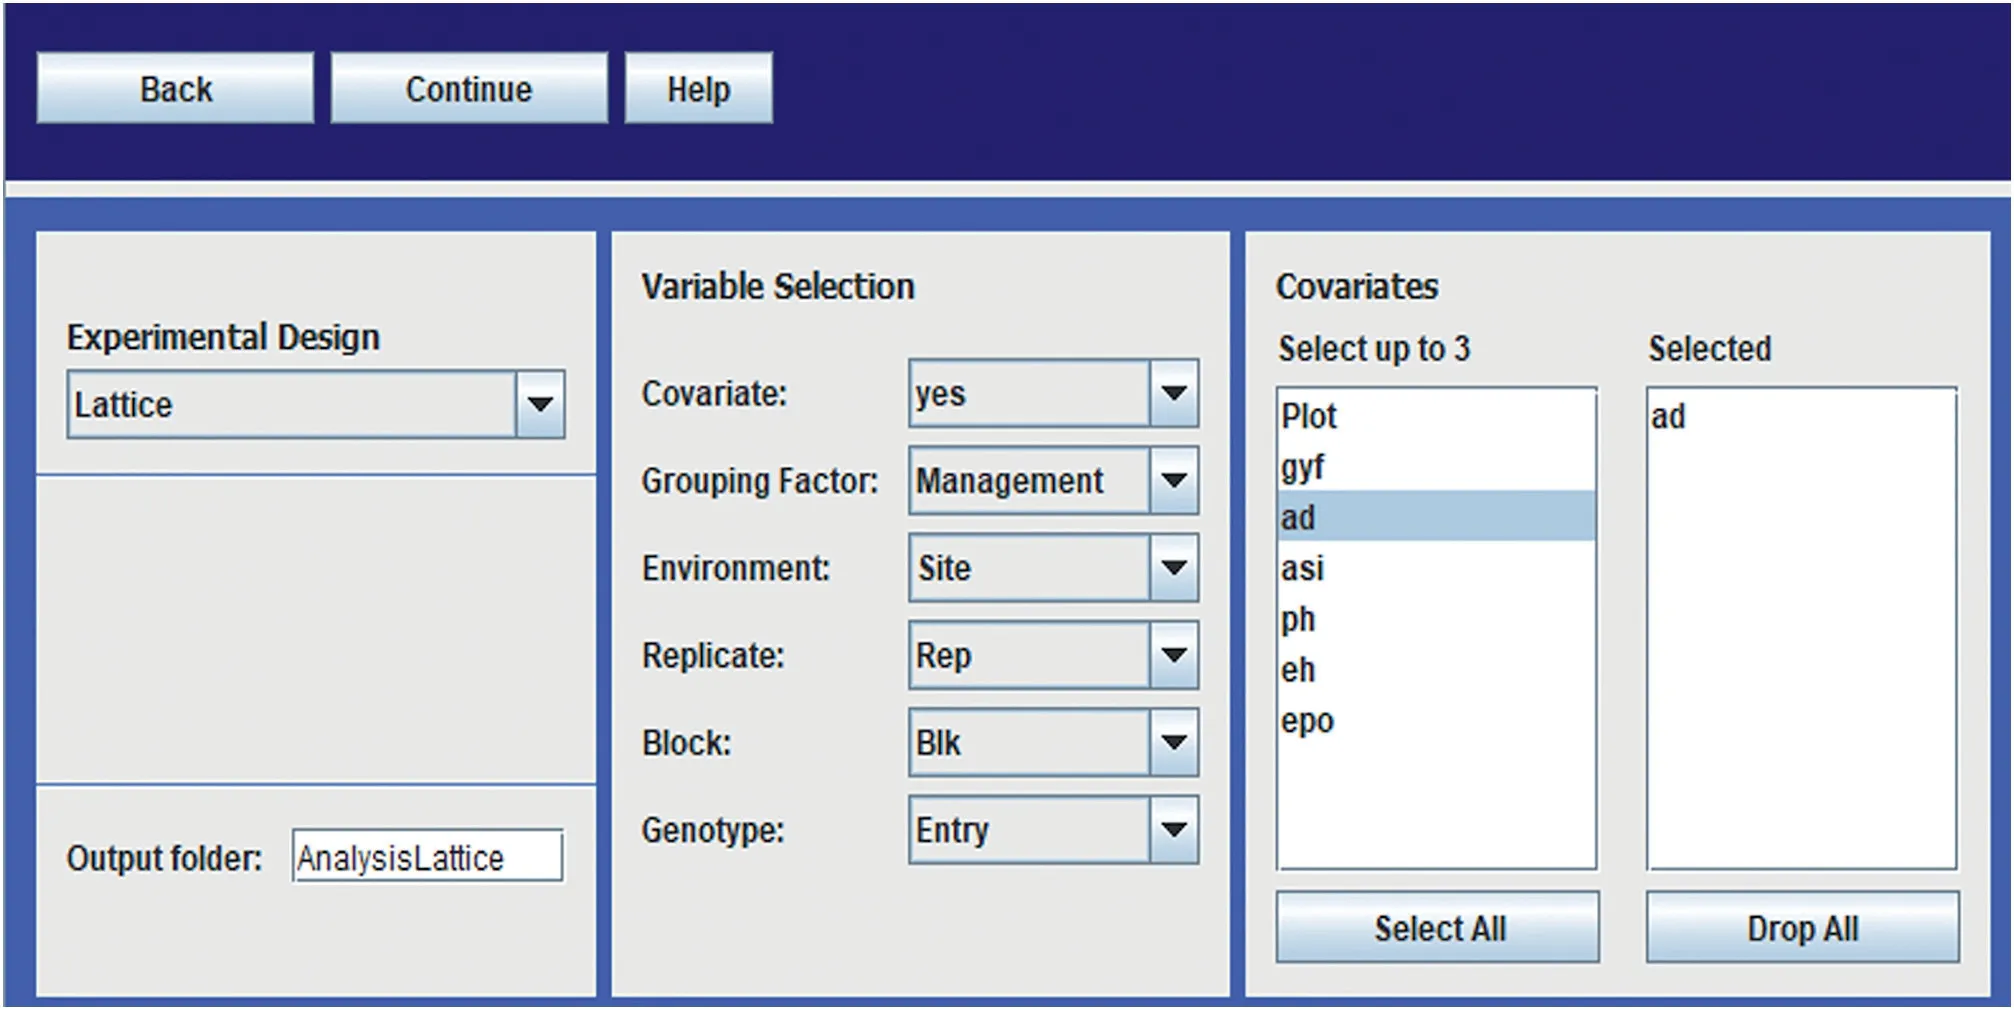
Fig.3–META-R analysis menus.First specification:the user should select the experimental design(RCBD or Lattice),use a covariate(if desired),and must match the raw data set;the Grouping factor,the Environment,the Replicate,the Block and the Genotype.
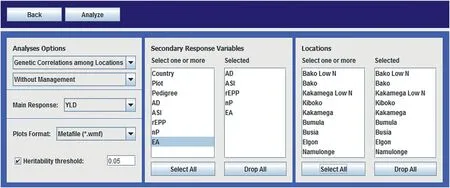
Fig.4–META-R analysis menus.Second specification:the user should select the type of analysis(BLUPs and BLUEs,genetic correlations among environments or genetic correlations among traits),the response traits to be analyzed,and the environments and/or management levels to be included in the analysis.
whereσgiandσgjare the square roots of the genotypic variances of the ithand jthtraits,respectively.

3.Results
3.1.Lattice data set,drought tolerance data
Genetic and phenotypic correlation among environments analyses were performed according to Eq.(7)and results are presented in Table 1.The heritability for each environment was calculated as in Eq.(5)after fitting the model in Eq.(2)for grain yield with the genotype effect considered as random.In all environments,grain yield had a heritability>0.05;therefore,all environments were kept in the analysis.A clustering dendrogram(not showed)was constructed from the correlation matrix,and a PCA biplot graph was generated for the first two principal components of the distance matrix(Fig.5).Four groups can be identified from the genetic correlations'biplot:(i)Kiboko under drought;(ii)Kakamega under low N and Busia under drought;(iii)Kakamega and Bako under normal conditions;and(iv)Bako under low N and Elgon drought.
BLUEs and BLUPs were also calculated:(i)within environment(Table 2)after fitting model in Eq.(2),(ii)combining environments within management(Table 3)using model in Eq.(4),and(iii)combining all environments(Table 4)using model in Eq.(4).In addition,statistics including variance component estimates,heritability,grand mean,LSD at 5%,and CV in percentage are provided.For this data set,anthesis date was used as a covariate because under stress conditions(low N,drought,etc.)it can reduce the variability associated with random patterns,and more precise estimates and predictions are obtained.Given that 30 genotypes were analyzed,it would not be practical to present results for each genotype;instead,the first three genotypes and the statistics were chosen.For the same reason,only the results for the first two environments and two management conditions were included.Results in the tables are organized as follows:each trait has two columns,one for BLUEs and another for BLUPs;the first column also contains the statistics,which helps the user to make decisions.It is important to highlight that grain yield was corrected by using anthesis date as a covariate.
3.2.RCBD data set from CIMMYT's Global Maize Program for Latin America
The second data set comes from CIMMYT's Global Maize Program for Latin America and the Caribbean containing seven traits.Phenotypic and genetic correlations among all pairs of traits were calculated according to Eq.(8)where variance components were calculated by fitting the model in Eq.(3)with the genotype effect considered as random.The PCA biplot constructed from the distance matrix among traits is shown in Fig.6.This biplot allowed to distinguish three main clusters:(i)days to flowering(both AD and SD),(ii)grain yield and height(PH,EH,and the ratio rEPH),and(iii)number of plants.
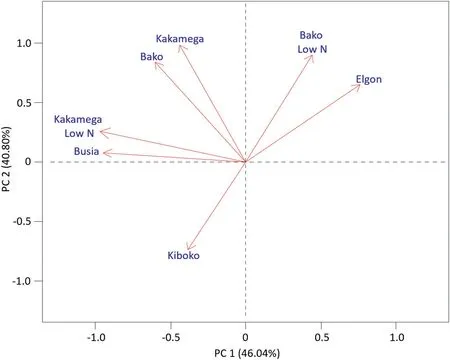
Fig.5–Plot of the first two principal components of the genetic correlation for grain yield among environments for the DTMA sample lattice data set.
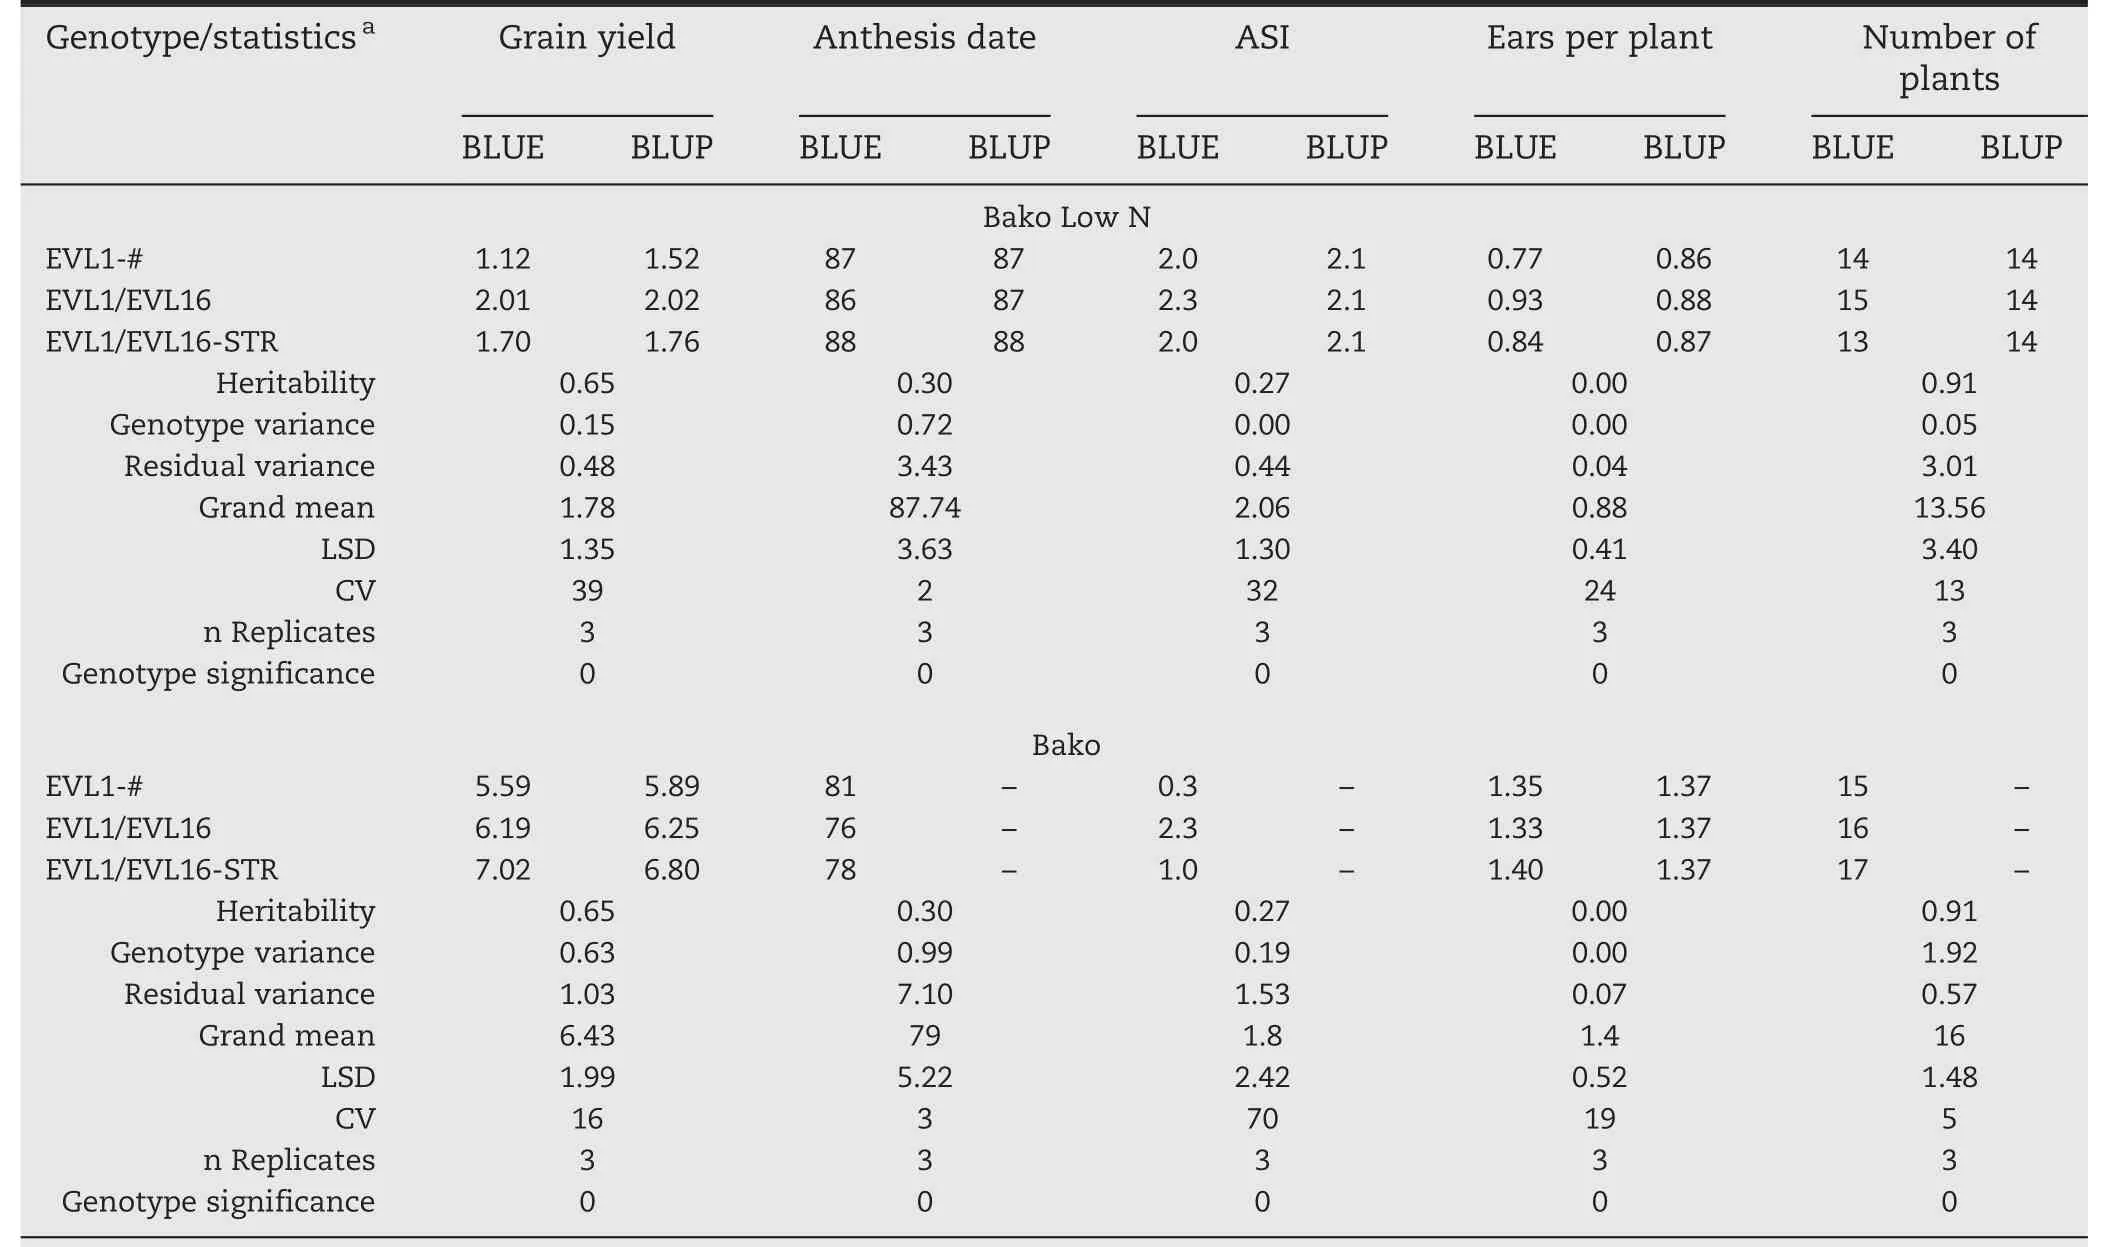
Table 2–Results for the first three genotypes of the sample lattice data set individual analysis for each location using anthesis date as a covariate for grain yield.
4.Discussion
4.1.Lattice data set,drought tolerance maize data
Interesting conclusions may be drawn from METs information on genotypes and response variables that were evaluated under different management conditions.For instance,grain yield showed a higher correlation among environments;and genotypes that showed good performance under optimal conditions did not show good performance under low nitrogen when they were assessed in the same environment.
To obtain BLUEs and BLUPs,META-R can adjust any trait using one or more covariates.By applying covariance analysis,performed through regression models,we can reduce the error variance to a greater extent;overall,under stress conditions,much of the variation is due to the inherent variation in soil conditions[9].When grain yield was adjusted by anthesis date as a covariate,results showed that BLUEs and BLUPs are quite different than when they are adjusted without a covariate.For example,for the combined analysis across all environments,the BLUP of the highest yielding genotype(ECAVL2/ECAVL16-STR)was 4.42 t ha-1,while without adjustment it was 4.31 t ha-1(Tables S1 and S2).On the other hand,regarding management conditions,we can see that under optimal conditions and adjusting by anthesis date,ECAVL2/ECAVL16-STR yielded 8.01 t ha-1,but only 7.88 t ha-1without adjusting by the covariate(Tables S3 and S4).Furthermore,under low nitrogen management,this genotype yielded only 3.51 t ha-1and 3.34 t ha-1adjusting and not adjusting by the covariate,respectively(Tables S5 and S6).Similarly,under drought management it yielded 2.32 t ha-1and 2.31 t ha-1with and without adjusting by anthesis date,respectively(Tables S7 and S8).This confirms the findings of previous studies that showed the importance of adjusting by anthesis date when the trial analysis isperformed under stress conditions[9].META-R provides BLUEs and BLUPs for all traits,including MRVs that can be adjusted by a covariate.If the data are balanced and orthogonal,then BLUEs and BLUPs are equivalent;however,this is rare in METs,especially under incomplete block designs,including lattice and alpha-lattice designs.It is important to note that the genotypes with the best performance under optimal conditions do not always perform well under stress conditions.In this case,ECAVL2/ECAVL16-STR was the highest yielding genotype under optimal conditions;however,when tested under low nitrogen and under drought,it was ranked third and second,respectively.The differences in ranking were within the LSD statistical criteria.
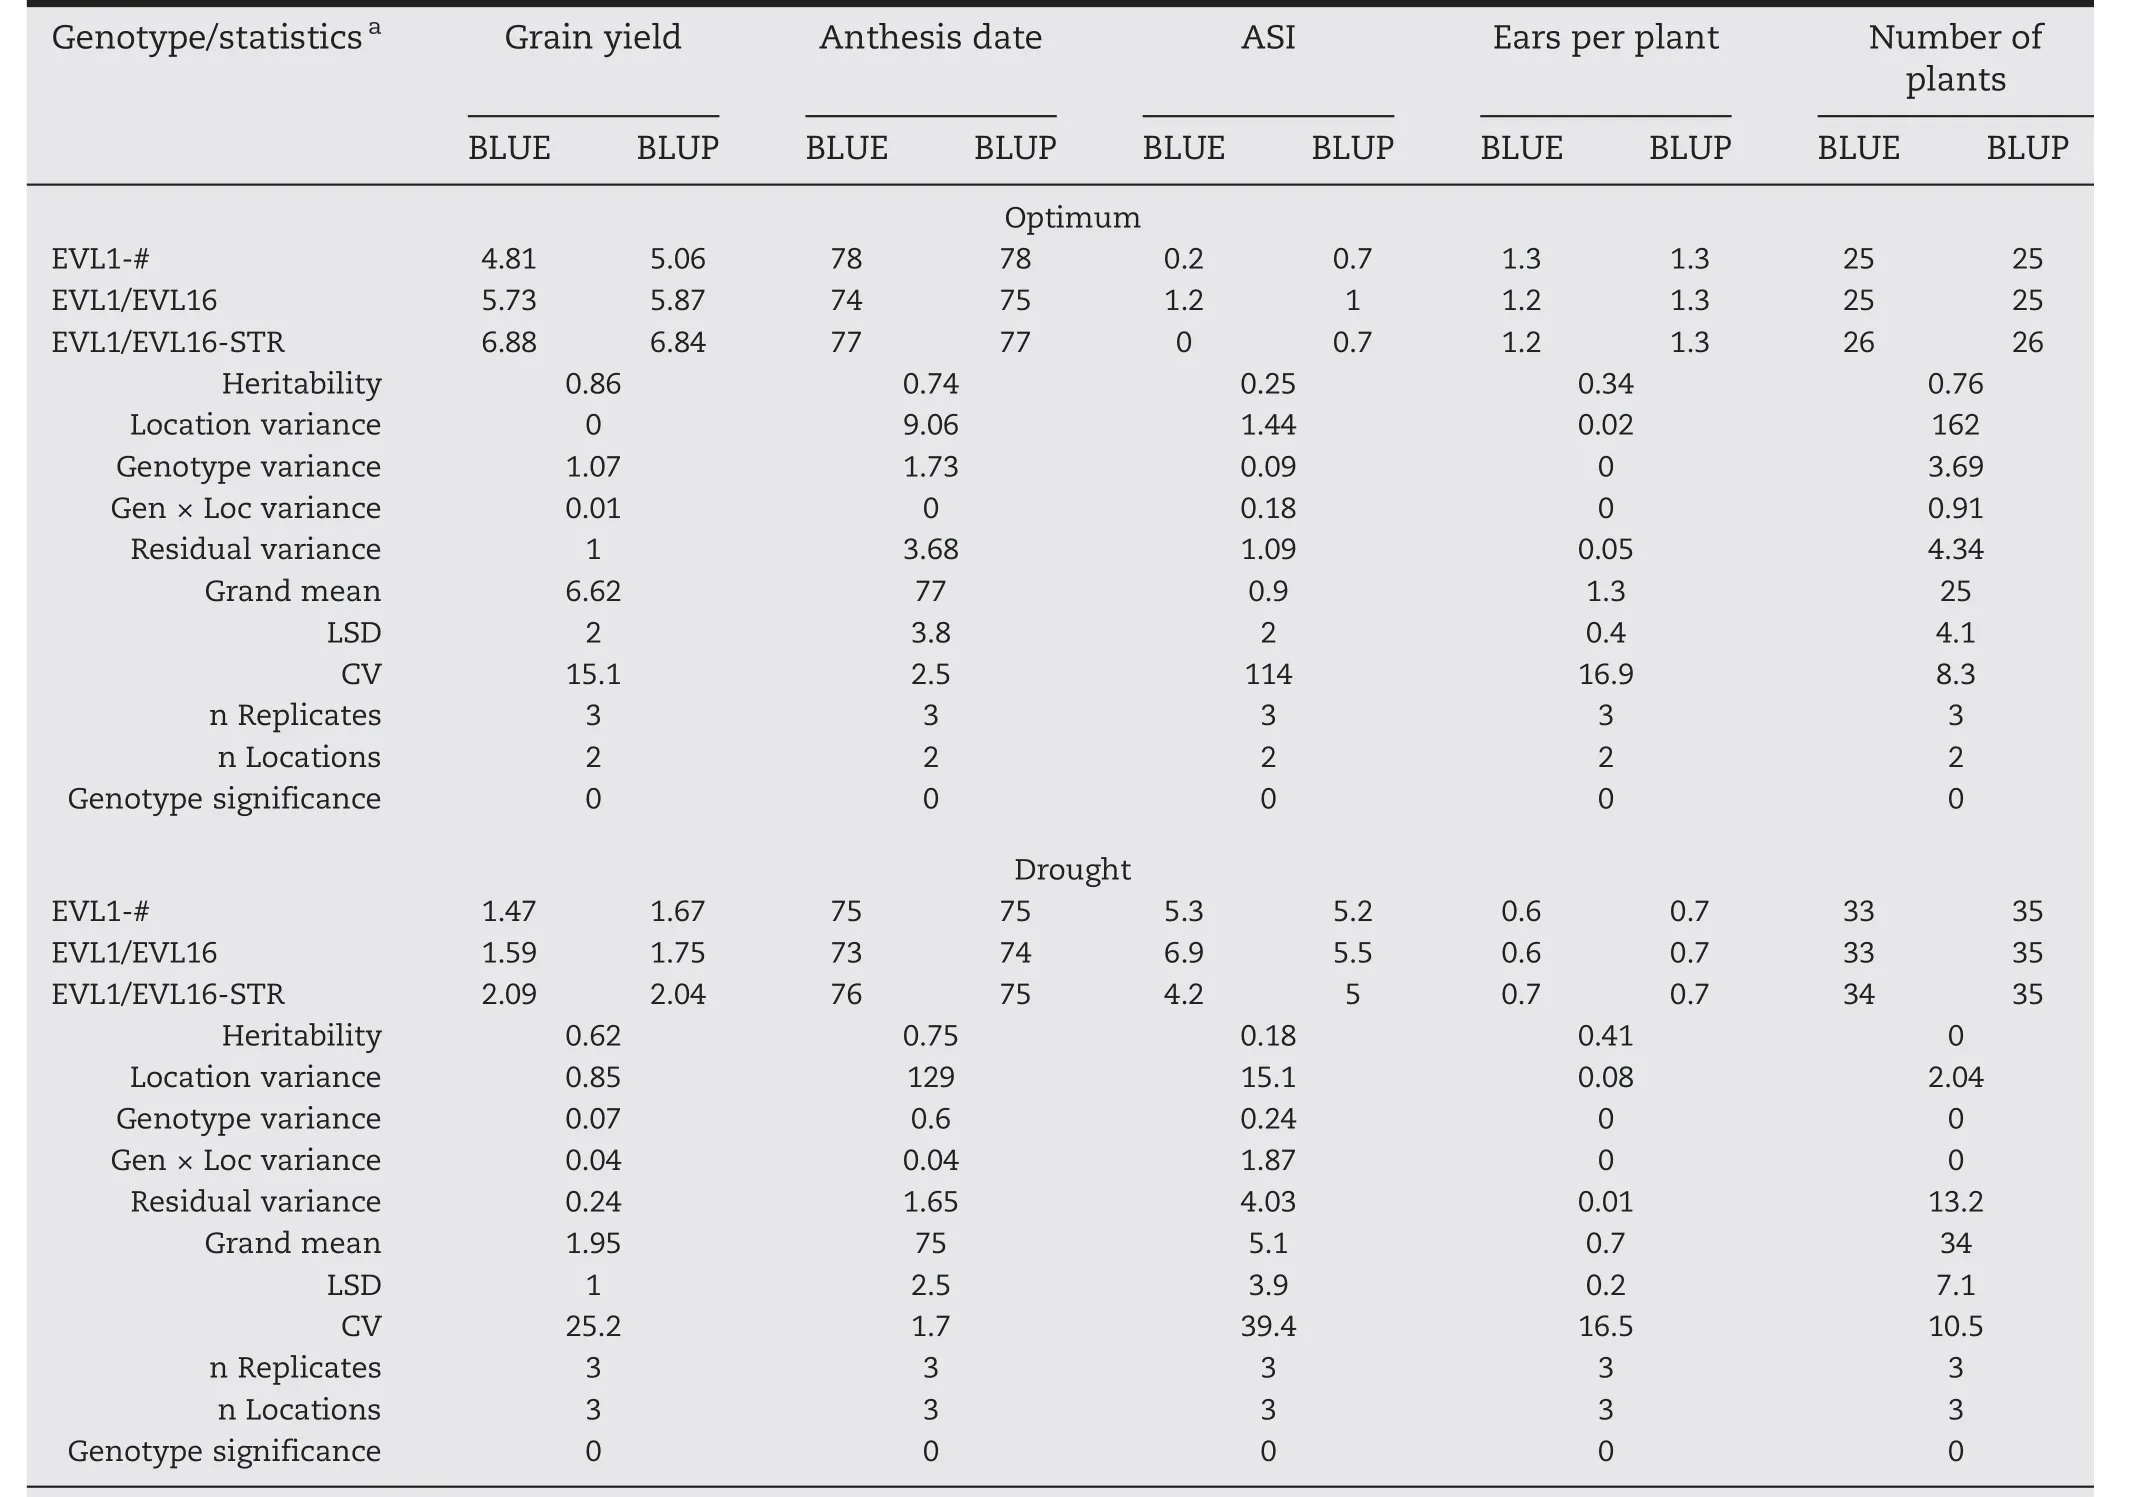
Table 3–Results for the first three genotypes of the sample lattice data set combined analysis by management conditions(optimum and drought)using anthesis date as a covariate for grain yield.
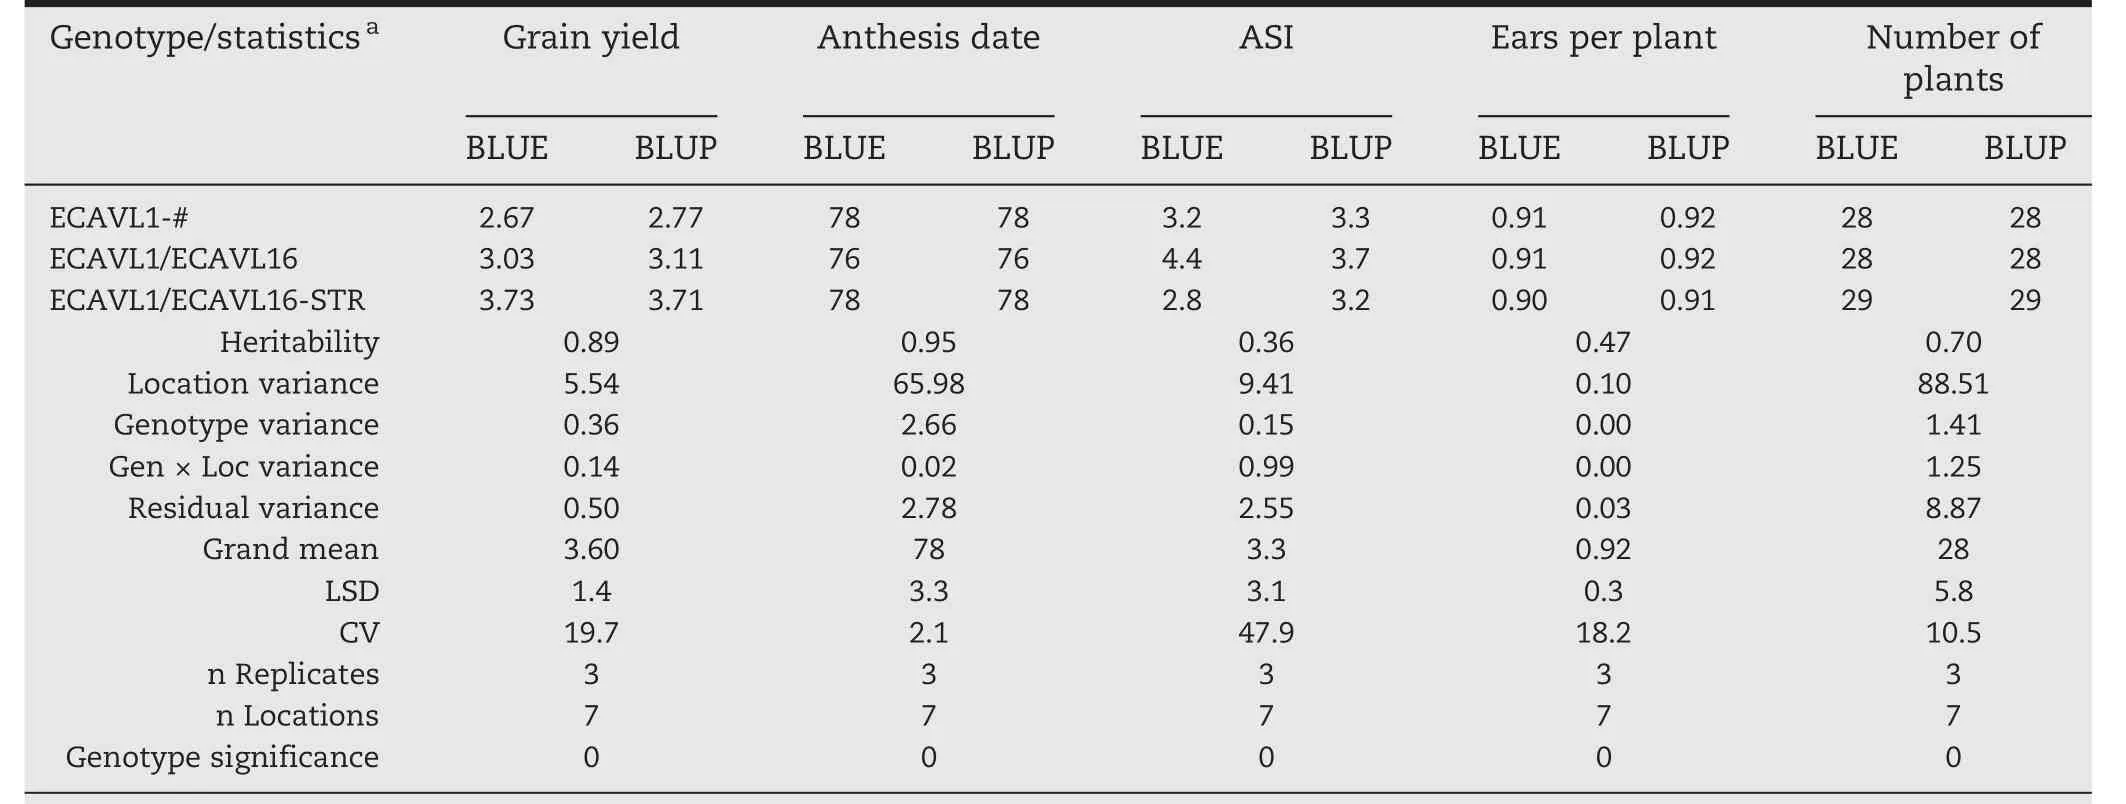
Table 4–Results for the first three genotypes of the sample lattice data set combined analysis across seven locations using anthesis date as a covariate for grain yield.
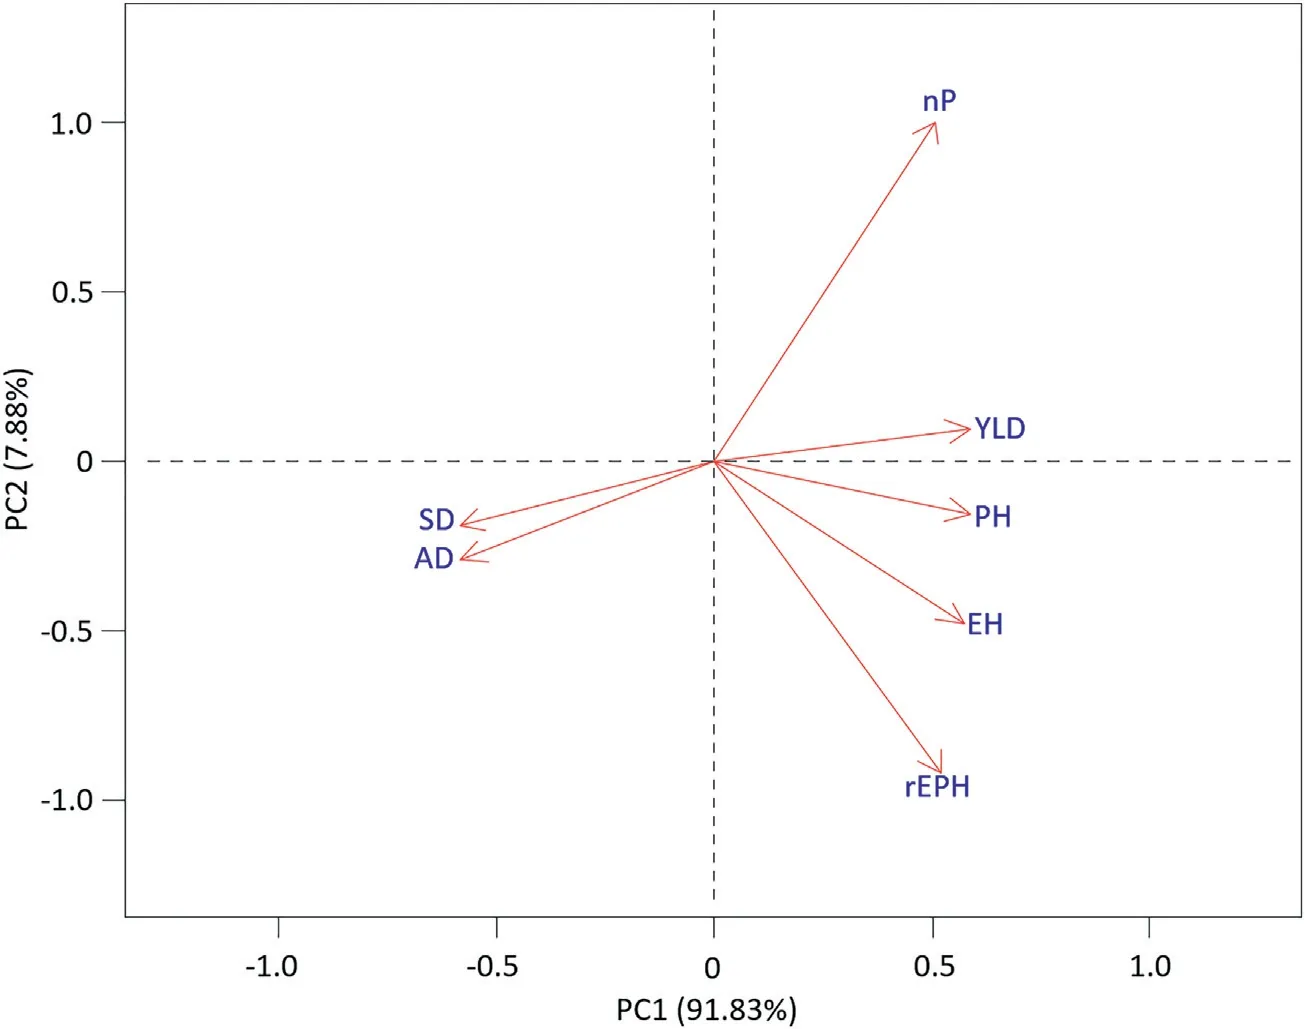
Fig.6–Plot of the first two principal components of the genetic correlations among traits for the RCBD data set from CIMMYT's Global Maize Program for Latin America.
4.2.RCBD data set from CIMMYT Global Maize Program for Latin America
The RCBD data showed some interesting patterns when genetic correlations among traits were plotted(Fig.6).Three groups can be distinguished from this analysis:(i)days to flowering(both male and female):for instance,in this case,genetic correlations between days to flowering and yield were-0.7085 and-0.7289 for anthesis and silking dates,respectively;this suggests that selection in earlier maturing plants may increase grain yield in these hybrids,because in late periods there is poor grain-filling due to a less favorable photoperiod;of course we must also consider other factors such as water availability;(ii)grain yield and height:for this group,all correlations between grain yield and height were positive,e.g.,0.8584,0.7926 and 0.6554 for plant height,ear height and ear position(ear height-plant height ratio),respectively;for this data set,it could be that selection for grain yield increases when plants and ears are tall;(iii)the last group comprises only number of plants;however,this trait had a positive genetic correlation with grain yield(0.6522),which indicated that selection for grain yield increases with plant density,as expected,up to certain densities.
4.3.Contribution of META-R
META-R offers plant breeders an easy way to analyze data derived from METs.The importance of METs in breeding programs relies in the increase of the number of environments(year,location,year-location,etc)as well as some types of management conditions(well-watered,stress,etc)to expand the space of evaluation of genotypes.With this,METs enable breeders to take more robust decisions related to the performance of genotypes.Analyses provided by METAR include calculation of BLUEs and BLUPs for every trait,as well as statistics such as broad-sense heritability to estimate the selection response,the least significant difference for comparing and selecting the best performing genotypes,and the coefficient of variation to determine whether the experiment was well conducted in the field.Furthermore,META-R allows adjusting the variable of interest by a covariate,for example,when working under different management conditions such as nutrient deficiency(macro-and micronutrients),water availability(drought or optimal conditions),and biotic stress(pests and diseases).META-R also calculates genetic correlations among environments and genetic correlations among traits for METs with large amounts of data,including different types of management.Scripts of META-R are derived from META[3]which does not calculate genetic correlations among traits;it only computes genetic correlations among environments.
Genetic correlations among environments are useful for characterizing and grouping environments based on G×E interaction.This means that we can identify which environments within each group have more genetic similarities or differences.Based on the latter approach,environments that,singly or in conjunction(referred to as mega-environments),provide effective screening for genotypes can be identified[16].Determining genetic correlations among traits can be helpful to evaluate the correlated response in a target trait that can be achieved by indirectly selecting for a secondary trait[17].For instance,NDVI(normalized difference vegetation index)or CT(canopy temperature)can be used to indirectly select for physiological aspects such as chlorophyll content,water status,and biomass[18].Indirect selection will be more effective than direct selection if the correlated secondary trait is highly heritable,and less difficult and inexpensive to measure or evaluate.
Author contributions
Gregorio Alvarado, Mateo Vargas, and Marco A. Lopez-Cruz conceived the idea and developed the beta version of META-R. Gregorio Alvarado, Juan Burgue?o, José Crossa,Mateo Vargas, and Marco A. Lopez-Cruz collaborated in writing the manu-script. Gregorio Alvarado, Francisco M.Rodríguez, Angela Pacheco, Paulino Pérez-Rodríguez, and Marco A. Lopez-Cruz wrote the R scripts. Francisco M.Rodríguez and Angela Pacheco provide maintenance to the software.
Declaration of competing interest
The authors declare no conflict of interest.
Acknowledgments
We are grateful for the financial support provided by the Bill&Melinda Gates Foundation and CIMMYT's CGIAR CRP(MAIZE and WHEAT),as well as the USAID Projects(Cornell University and Kansas State University)that generated the CIMMYT wheat data analyzed in this study.We acknowledge the financial support provided by the Foundation for Research Levy on Agricultural Products(FFL)and the Agricultural Agreement Research Fund(JA)in Norway through NFR grant 267806.
Appendix A. Supplementary data
Supplementary data for this article can be found online at https://doi.org/10.1016/j.cj.2020.03.010.
- The Crop Journal的其它文章
- Quantitative genetic studies with applications in plant breeding in the omics era
- Brief Guide for Authors
- Use of family structure information in interaction with environments for leveraging genomic prediction models
- Modeling and simulation of recurrent phenotypic and genomic selections in plant breeding under the presence of epistasis
- A sulfotransferase gene BnSOT-like1 has a minor genetic effect on seed glucosinolate content in Brassica napus
- Genome-wide prediction in a hybrid maize population adapted to Northwest China