
Investigation of the Heat Budget of the Tropical Indian Ocean During Indian Ocean Dipole Events Occurring After ENSO
2020-09-29 00:53:12XIAHaofengandWUKejian
XIA Haofeng, and WU Kejian
Investigation of the Heat Budget of the Tropical Indian Ocean During Indian Ocean Dipole Events Occurring After ENSO
XIA Haofeng, and WU Kejian*
College of Oceanic and Atmospheric Science, Ocean University of China, Qingdao 266100, China
The Indian Ocean Dipole (IOD) is an important natural mode of the tropical Indian Ocean (TIO). Sea surface temperature anomaly (SSTA) variations in the TIO are an essential focus of the study of the IOD. Monthly variations of air-sea heat flux, rate of change of heat content and oceanic thermal advection in positive/negative IOD events (pIODs/nIODs) occurring after El Ni?o/ La Ni?a were investigated, using long-series authoritative data, including sea surface wind, sea surface flux, ocean current, etc. It was found that the zonal wind anomaly induced by the initial SSTA gradient is the main trigger of IODs occurring after ENSOs. In pIODs, SSTA evolution in the TIO is primarily determined by the local surface heat flux anomaly, while in nIODs, it is controlledby anomalous oceanic thermal advection. The anomalous southwestern anticyclonic circulation in pIODs enhances regional differences in evaporative capacity and latent heat, and in nIODs, it augments the east-west difference in the advective thermal budget.Further, the meridional anomaly mechanism is also non-negligible during the development of nIODs. As the SWA moves eastward, the meridional SWA prevails near 60?E and the corresponding meridional anomalous current appears. The corresponding maximum meridional thermal advection anomaly reaches 200Wm?2in September.
IODs after ENSO; SSTA; air-sea heat flux; oceanic thermal advection
1 Introduction
The Indian Ocean Dipole (IOD), recognized as an ano- malous modal signal in tropical SSTs, exists in the tropical Indian Ocean (TIO) and has a significant influence on its surroundings and the El Ni?o/La Ni?a in the tropical Pacific (, Saji, 1999; Webster, 1999; Saji and Yamagata, 2003; Behera, 2006; Forootan, 2016; Nur’utami and Hidayat, 2016). The IOD is an important natural ocean-atmosphere coupled mode in the Indian Ocean. Strength of the IOD can be defined as the IOD index, which is the difference in the average SSTAs between IOD Region 1 (10?S–10?N, 50?–70?E, noted as R1) and IOD Region 2 (0?–10?S, 90?–110?E, noted as R2).
The twin signals, IOD and ElNi?o/LaNi?a (ENSO), are usually treated as a combination. Plenty of historical observations and model results have indicated that ENSO could influence the occurrence of IOD (, Annamalai, 2003; Chowdary and Gnanaseelan, 2007; Yang, 2010; Stuecker, 2017), and even the evolution of IOD (, Allan, 2001; Bracco, 2005; Behera, 2006; Saji, 2006; Cai, 2011, 2012; Hong, 2014; Ham, 2017) in the TIO. Widely accepted air-sea interaction mechanisms in IOD events include the Bjerknes feedback (Bjerknes, 1969), the wind-evaporation-SST feedback (Li, 2003), the oceanic Rossby wave adjustive process (Webster, 1999; Huang and Kinter, 2002; Xie, 2002; Rao and Behera, 2005; Spencer, 2005), the SST-cloud-radiation feed- back (Hong, 2008a, b), and the wind-thermocline-SST feedback. Recently, IOD categorization was investigated in some studies based on the relationship between the IOD and ENSO. Guo (2015) categorized the IODs primarily into two types, according to different triggering conditions. Type I IODs (first type) occurring in the developing phase of ENSO are triggered by the anomalous Walker Circulation (WC), while Type II IODs (second type) occurring in the year after ENSO are triggered by the internal air-sea interaction, which is induced more by the initial zonal SSTA. Triggers of Type II IODs indicate the inhomogeneous basin-wide warming/cooling in the TIO.
According to previous work, trigger conditions of Type I IODs, resulting from the weakened/strengthened WC induced by ENSO in the tropical Pacific, are widely accepted (Annamalai, 2003; Fischer, 2005; Zhong, 2005; Hong, 2010). However, quite a few uncertainties in the internal ocean-atmosphere interaction in Type II IODs need to be further investigated. In addition, previous research has focused on the large-scale atmospheric circulation anomaly, and the focus of IOD research has been primarily the WC anomaly and atmospheric forcing. To investigate the SSTA variation in the TIO in depth, the following issues should be addressed: How do ocean-atmosphere processes affect the evolution of the mixed layer temperature (MLT) in Type II IODs? What role does seawater self-movement play in Type II IODs? Is there any difference in the triggers of Type II pIODs and Type II nIODs?
Using long-time series data obtained from authoritative organizations, the heat budget of the mixed layer during the formation and development phases of positive/negative Type II IODs were studied using synthetic analysis, anomaly analysis, and relationship analysis. This paper is organized as follows: Section 2 introduces the data and methods. Section 3 focuses on the analysis and results of the evolutions of various factor anomalies in the mixed layer. Discussion and summary are given in Sections 4 and 5, respectively.
2 Data and Methods
In order to examine the variability of SSTA and the corresponding SWAs for the different types of IODs, Sea surface wind (SSW) and SST were obtained from the dataset CERA-20C (January 1901–December 2010, http://apps.ecmwf.int/datasets/) of the European Centre for Medium-Range Weather Forecasts (ECMWF). and the dataset of the newly developed Ocean-Air Fluxes. The product currently includes ERA-Interim, ERA-20C, ERA-20CM, ERA-40, CERA-20C,Here the latest product CERA-20C dataset, as the final version of ERA-20CM and ERA-20C, were adopted to demonstrate the anomalies, SSWA, and SSTA. CERA-20C assimilated surface pressure and marine wind observations as well as the ocean temperature and salinity profiles from 1901 to 2010, and corrected the errors of the past observation and model data. The Ocean-Air Fluxes project originates from the Woods Hole Oceanographic Institution, and surface heat flux fields were derived from combining optimal satellite measurements and outputs of surface meteorological fields using the bulk flux algorithm 3.0 (Yu, 2004). Here the monthly averaged data were selected at a 0.75?×0.75? resolution.
In this paper, monthly evolutions of sea surface heat flux were investigated throughnet(surface net heat flux), SW (shortwave radiation flux), LW (longwave radiation flux), LH (latent heat flux), and SH (sensible heat flux) data, acquired from the datasets published by both ECMWF and Ocean-Air Fluxes. In total, there were 10 IOD events occurring in the year after an ENSO during the past 63 years (Guo, 2015). Data and anomalies for pIODs/nIODs were synthesized.
Ocean temperature and monthly climatology of horizontal velocity at different levels were used to calculate oceanic thermal advection and the heat content change rate. These datasets were derived from simple ocean data assimilation (SODA) reanalysis developed at the University of Maryland (Carton, 2000a, b; Carton and Giese, 2008). Velocity and temperature fields were in 5-day intervals spanning 1970–2009 with a 0.5?×0.5? horizontal resolution and a 10m vertical resolution near the surface, for a total of 40 vertical levels. Mean value was calcu-lated using the values of different levels according to the seasonal variation in the mixed layer depth (MLD). The MLD adopted here was from the U.S. NRL (Naval Research Laboratory), Stennis Space Center. The method of NMLD (Naval Research Laboratory Mixed Layer Depth) climatology calculation accommodated not onlydata but also climatological datasets that typically have a much lower vertical resolution.
To investigate the monthly variations in Type II pIODs/nIODs, the methods of synthetic analysis, anomaly analysis, and lead/lag relationship analysis were adopted in the data processing. Upper ocean heat budget was calculated by the three-dimensional heat conservation equation:

in whichnetrepresents the net income or loss value at the sea surface:

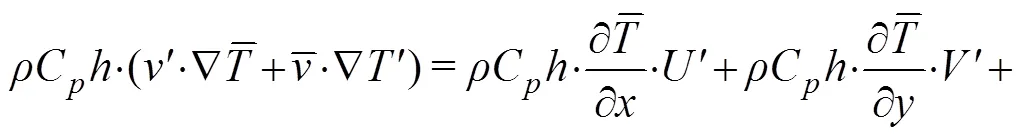
whereis the sea water density;Cis the heat capacity of seawater;represents MLT;is the horizontal velocity vertically averaged in the mixed layer;is the vertical entrainment velocity; Δis the temperature difference between the mixed layer and the adjacent layer below it. Further,ρCh·?/?is the rate of heat content change term;ρChv·?is the thermal advection term, andρChw·Δt/is the vertical thermal entrainment term. Considering the average and anomalous values of these variables in Type II IODs,

Here, according to actual ocean currents in the mixed layer and magnitude comparison, the anomaly analysis of the vertical thermal entrainment term,ρChwΔt/,could be neglected due to its minor contribution. Thus, Eq. (2) can be transformed into:


3 Analysis and Results
3.1 Heat Content Change Rate andQnet
The change rate of heat content (HC) in the mixed layer was calculated asρCh·?/?. Correlation of the monthly averaged evolutions of HC change rate andnetin positive/negative Type II IODs (hereafter shortened to pIODs/nIODs) is displayed in Fig.1. Here, ?/?is calculated as the difference between the mean MLT of the last five and the first 5 days in one month. Generally, Corr<,net> (correlation between the change rate of the HC and sea surfacenet) in pIODs is closer than that between nIODs in the TIO basin. Values of Corr<,net> exceed 0.6, and the corresponding significance, exceeds 95% in most areas of the R2 in pIODs (Fig.1a). However, some areas of R1, particularly those near 60?E, show much lower correlation, even a weak negative correlation in nIODs.
The IOD is a natural zonal mode and the ocean variables always show zonal distribution. Considering the complex land-sea distributions in the TIO, the average value of meridians along the zonal direction could represent the variations of the main physical quantities. Here, the monthly averaged evolutions of HC change rate in the mixed layer are denoted in Fig.2. Variations inρCh·?/?displayed in pIOD/nIOD were almost consistent. Given phases of HC change rate showed a significant transition in R1 (Figs.2aand2c) from April to May, and the ?/?changed from positive to negative, which indicated heat loss in the mixed layer. In general, the average MLT in R1 kept decreasing when IODs were forming, while, in the same period, the average MLT showed an obvious opposite phase in some areas of R2. This process indicated that, during this period, HC difference between R1 and R2 were significantly augmented.
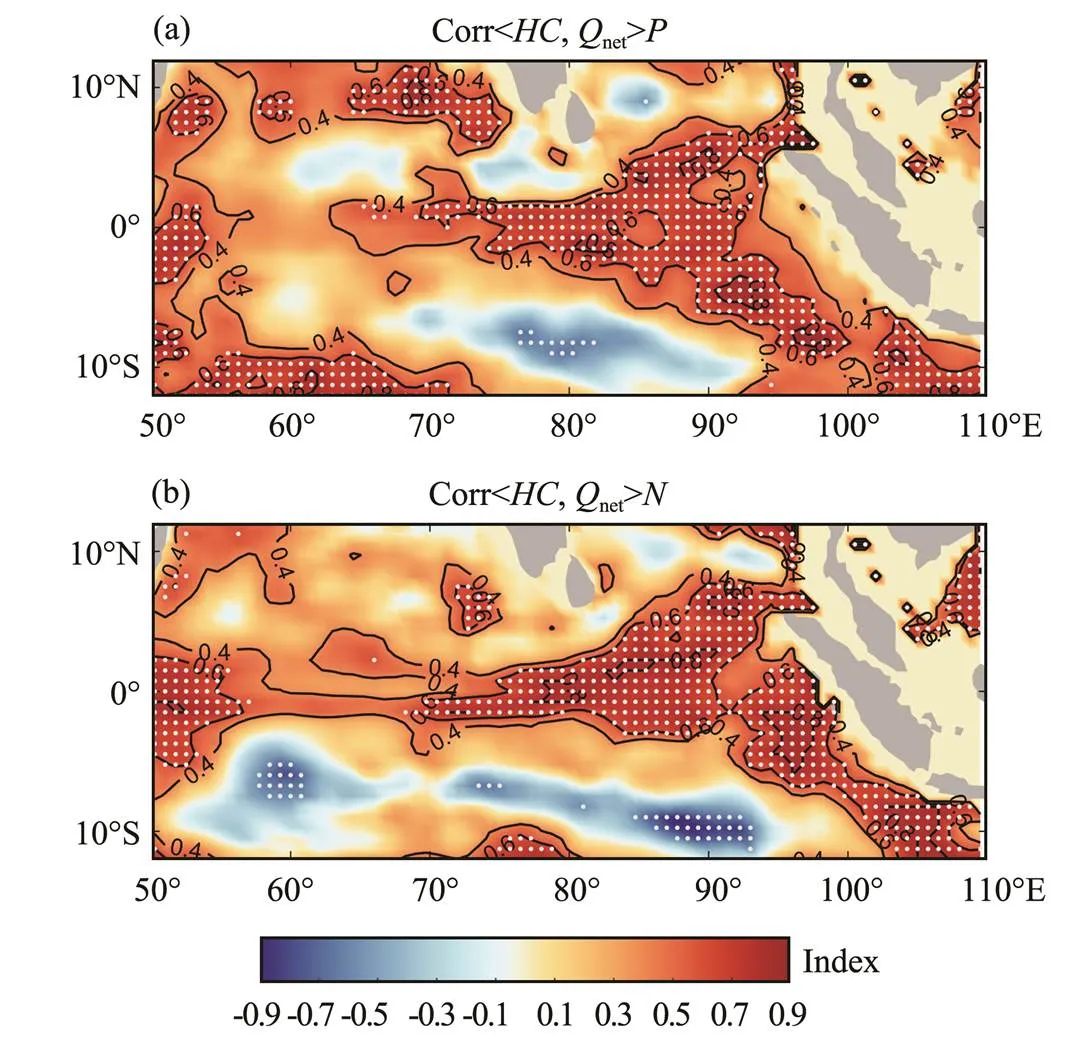
Fig.1 Correlation of the rate of change of HC and surface Qnet in pIODs/nIODs. Dotted regions denote significance>95% level.

Fig.2 Monthly estimates of the rate of change of HC in nIODs ((a), (b) correspond to R1, R2) and pIODs ((c), (d) correspond to R1, R2).
3.2 Sea Surface Heat Flux
Month-to-month evolution of surface heat flux anomalies in pIOD/nIOD are shown in Fig.3. Overall, the magnitude of each component in pIODs was significantly larger than those in nIODs, and the seasonal variations in pIODs were more obvious. In pIODs, the anomaly of LW was only ?5Wm?2or less throughout the year, and SH anomaly was also minor. Therefore, a discussion of the variations in LW and SH are not required here. Maximum SW anomaly reached 10Wm?2and ?5Wm?2in R1 and R2, respectively. Evolution of SW in pIODs could enlarge the differences in heat budget anomalies between the two regions, a result of its regionally inhomogeneous surface heat budget. However, the temporal variability of SW did not show any seasonal character. Variations in LH anomaly showed the most significant difference between the two regions and presented the clearest monthly character. During the period of pIOD (from April to June), the maxima of LH were on the order of 20Wm?2and ?10Wm?2in R1 and R2, respectively. In some way, variability of LH determined the evolution ofnetin pIODs. However, all components of thenetanomaly in nIODs were <5Wm?2throughout the year, and they did not have obvious seasonal or spatial variability. Spatial distributions ofnetanomaly in pIODs/nIODs corresponded to the Corr<,net> shown in Fig.1 due to the consistent regional difference in distribution.
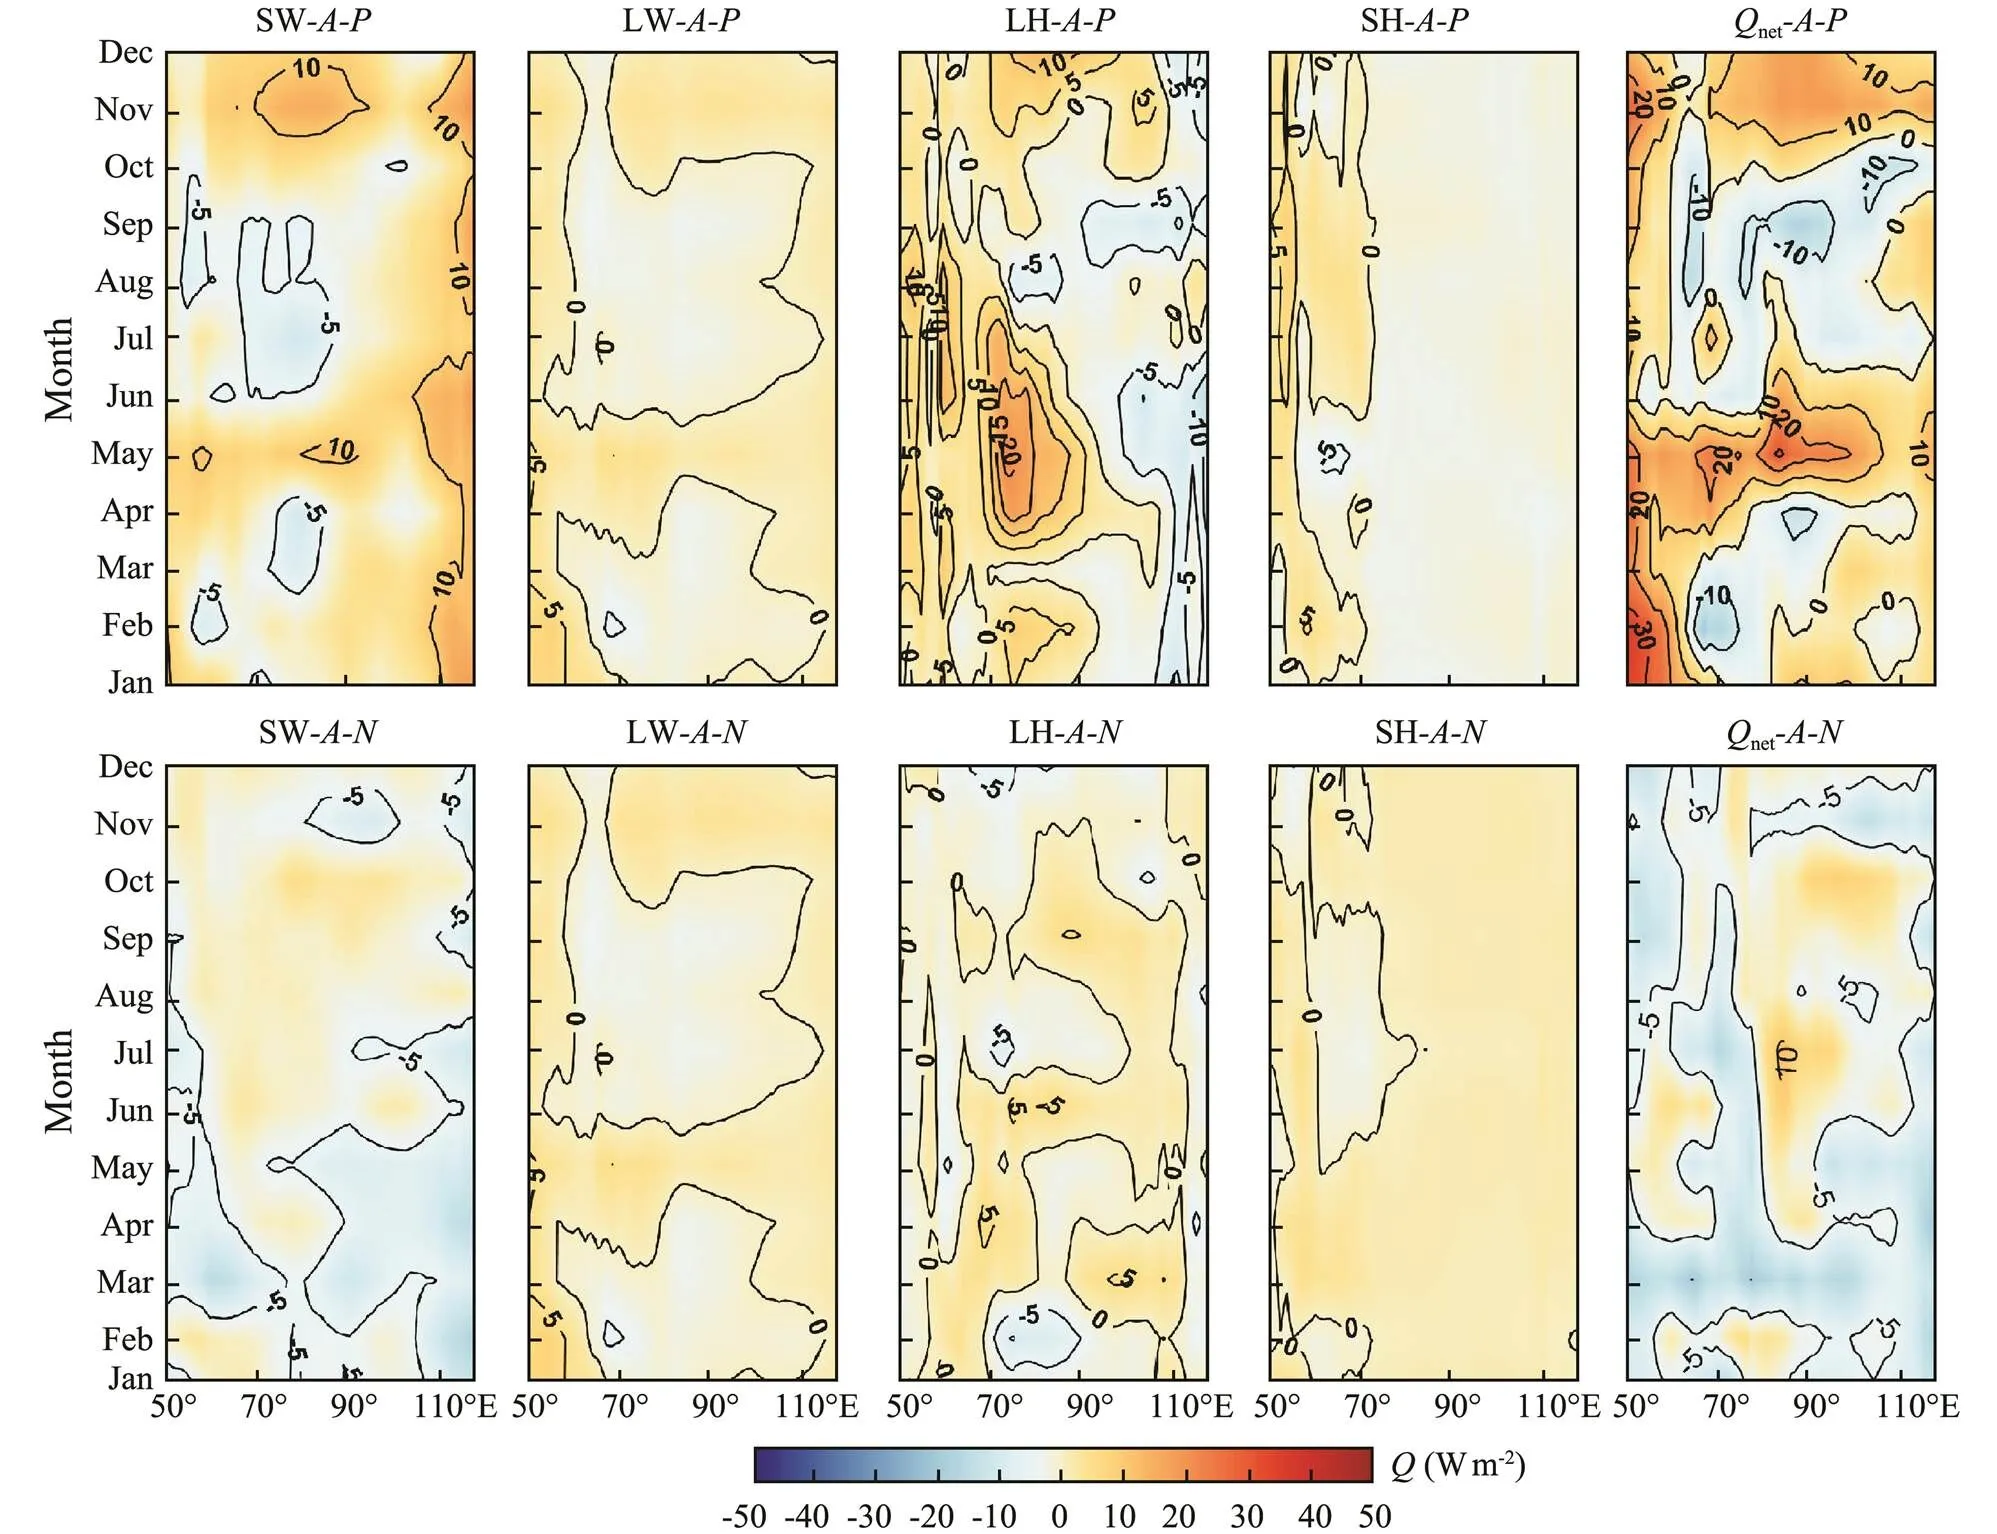
Fig.3 Monthly evolutions of surface heat flux anomalies. First row and second row denote pIODs and nIODs, respectively. From left to right, SW, LW, LH, SH, and Qnet are displayed ordinally.
3.3 Oceanic Thermal Advection Anomalies
Section 3.2 indicates that atmospheric thermal forcing might have been the main driver for the MLT variation in R1 and R2, particularly in pIODs. However, the variability of surface heat flux anomaly in Fig.3 is not in full accord with the change rate of HC variation, and the spatial distribution in Fig.1 indicates that the least correlation appeared in the areas near 60?E of R1, particularly in nIODs. Temporal lags and spatial discordance might be explained by oceanic thermal advection displayed in Fig.4. The ocean current can be expected to have an important influence on the change in ?/?through Eq. (1) because the oceanic thermal advection term reflects the effects of oceanic dynamic processes on SST; warm or cold water transported by the horizontal current had effects on the local heat budget balance. Here, another important term in Eq. (1), the advective thermal effect in the mixed layer, is investigated.
The oceanic thermal advection anomalies distributed along the zonal direction are shown in Fig.4. Colors denote values of oceanic thermal advection in the areas. Negative phase indicated the heat gain from the dynamic process in the ocean, while the positive phase indicated the heat loss of the ocean. Significant oceanic thermal advection anomalies always appeared in R1, during the period of formation and development of IODs (from June to October). Location of the anomalies appeared near 60?E of R1, which corresponded well with the minimum correlation in Fig.1. In the pIODs, maximum negative anomalies reached ?200Wm?2near 60?E in August and September, while maximum positive anomalies reached 200Wm?2near 55?E. In the nIODs, positive anomalies were clearly dominant, reaching 200–400Wm?2near 60?E, from June to October.
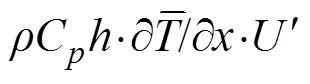
Fig.6 shows that the composited differences (mean values of R1 minus mean values of R2) were cross-correlative to the corresponding IOD index (also the mean SSTA in R1 minus the mean SSTA in R2). At the monthly ave- rage state, differences in oceanic thermal advection between R1 and R2 were highly corrective to the IOD index, and the maximum positive (negative) correlation coefficient of 0.65 (?0.6) was found in the negative (positive) IOD event, with a lag of two (one) months.
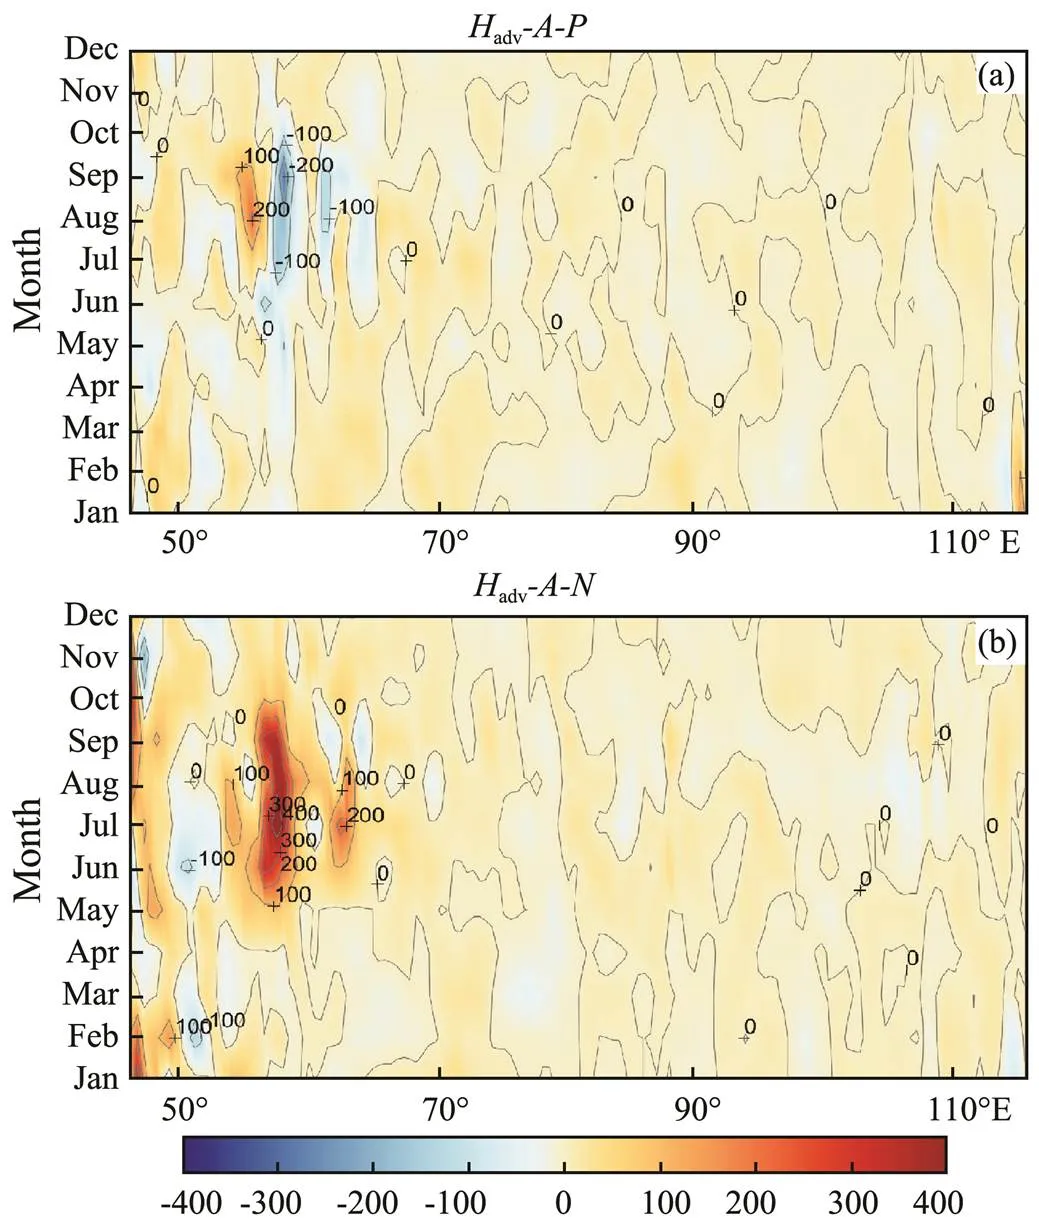
Fig.4 Monthly evolutions of oceanic thermal advection anomalies in IOD years. (a) pIODs, (b) nIODs.

Fig.5 Monthly evolutions of oceanic thermal advection anomalies. Terms,, in pIODs are displayed in (a)–(c), in nIODs are displayed in (d)–(e).

Fig.6 Composited cross-correlation between the differences (R1-R2) in thermal advection/Qnet and the respective IOD index.
3.4 Mean Current Anomalies in IODs
IOD events always occur at the end of summer and disappear in autumn. Variations in spatial distribution concerning the current anomaly from May to October are shown in Fig.7 and SWAs and SSTAs in the corresponding months during pIODs/nIODs are shown in Figs.8 and 9. Generally speaking, 1) the magnitude of current anomalies shown in nIODs was more significant than that in pIODs, particularly in the coastal areas in R1; 2) in the period of IOD development (from July to September), the current anomalies in nIODs significantly increased, but not for pIODs, and 3) the major direction of the anomalous current in pIODs/nIODs showed opposite results.
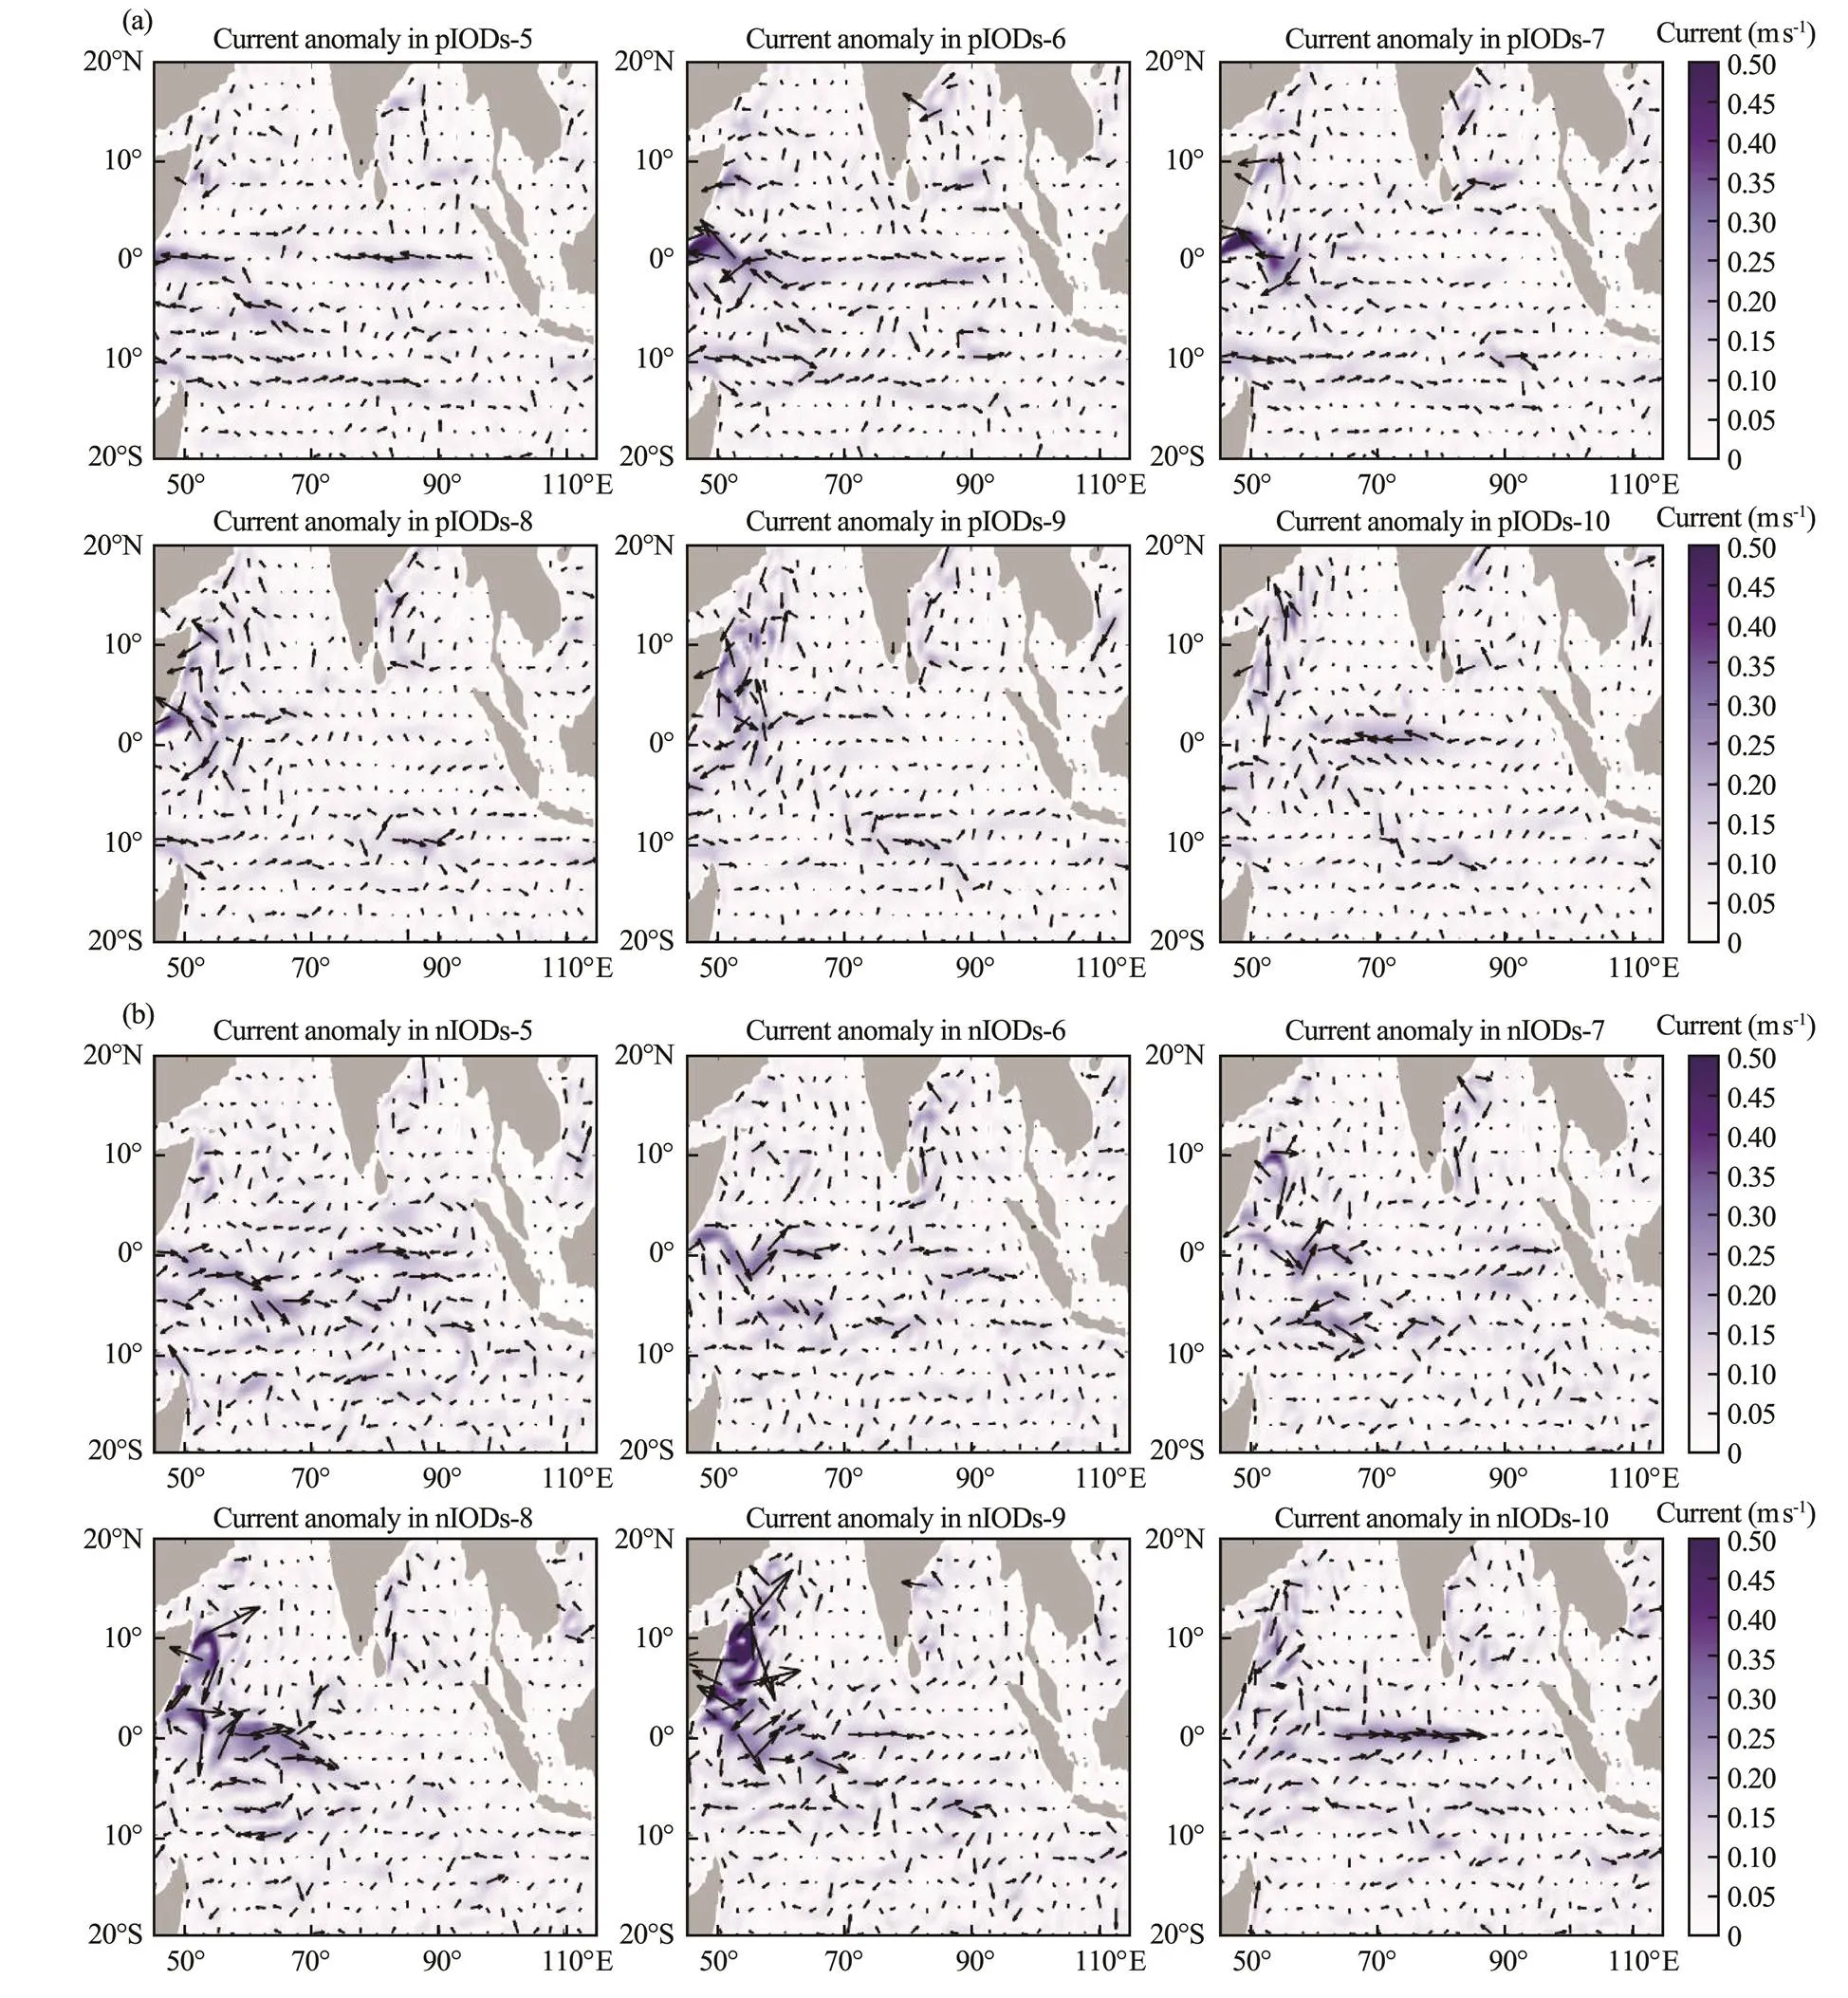
Fig.7 Distribution of mean current anomalies in the mixed layer from May to October. (a) pIODs, (b) nIODs.
Results displayed in Section 3.3 indicates that the spatial distribution of anomalous thermal advection in nIODs was more significant than that in pIODs. As shown in Fig. 9, SWAs in nIODs form an obvious anomalous wind circulation at the center of the TIO in boreal summer. While different from SWAs, the westward mean current anomaly is prevailed in those areas, and the zonal anomaly was not obvious (Fig.7b). At the end of summer, the anomalous wind circulation moved eastward, and the direction of SWA in R1 changed with the local SSTA variation. From August to September, as the SWA increased, the zonal and meridional anomalous currents both appeared and induced the thermal advection anomalies in R1. Current anomaly was significant for both zonal and meridional directions near 60?E, due to the existence of the zonal and meridional SSTA gradients. In October, the current anomaly began to decrease in the whole ocean basin and the anomalous wind circulation moved back. Magnitude of SWA in pIODs was larger than that in nIODs and the main directions in the corresponding areas were opposite, which was different from the average current anomaly in the mixed layer.
4 Discussion
The termρCh·?/?in Eq. (1) determines the variability of MLT, and Eq. (7) indicates that the SSTA variation is primarily controlled by the surface heat flux anomaly and anomalous oceanic thermal advection. Meanwhile, evolution of the HC change rate did increase the difference in SST between R1 and R2 during the formulation of Type II IODs; this promoted the occurrence of nIODs but inhibited pIODs. The relationship between the change rate of HC anomaly andnetanomaly was highly correlative in R1 and R2, except for the areas near 60?E. Variance in thenetanomaly played a crucial role in MLT variation, and among the four components in Eq. (2), LH determined thenetvariation in pIODs. First, the magnitudes ofnetanomalies in Type II pIODs were generally several times larger than those in nIODs, which corroborated the result that the Corr<,net> in pIODs was higher than that in nIODs, overall, in the TIO. Second, the contribution of LH in pIODs had a wider influence in the space and time domain than that in nIODs. The evolution of the LHanomaly should be considered as the main reason fornetvariation in most regions.
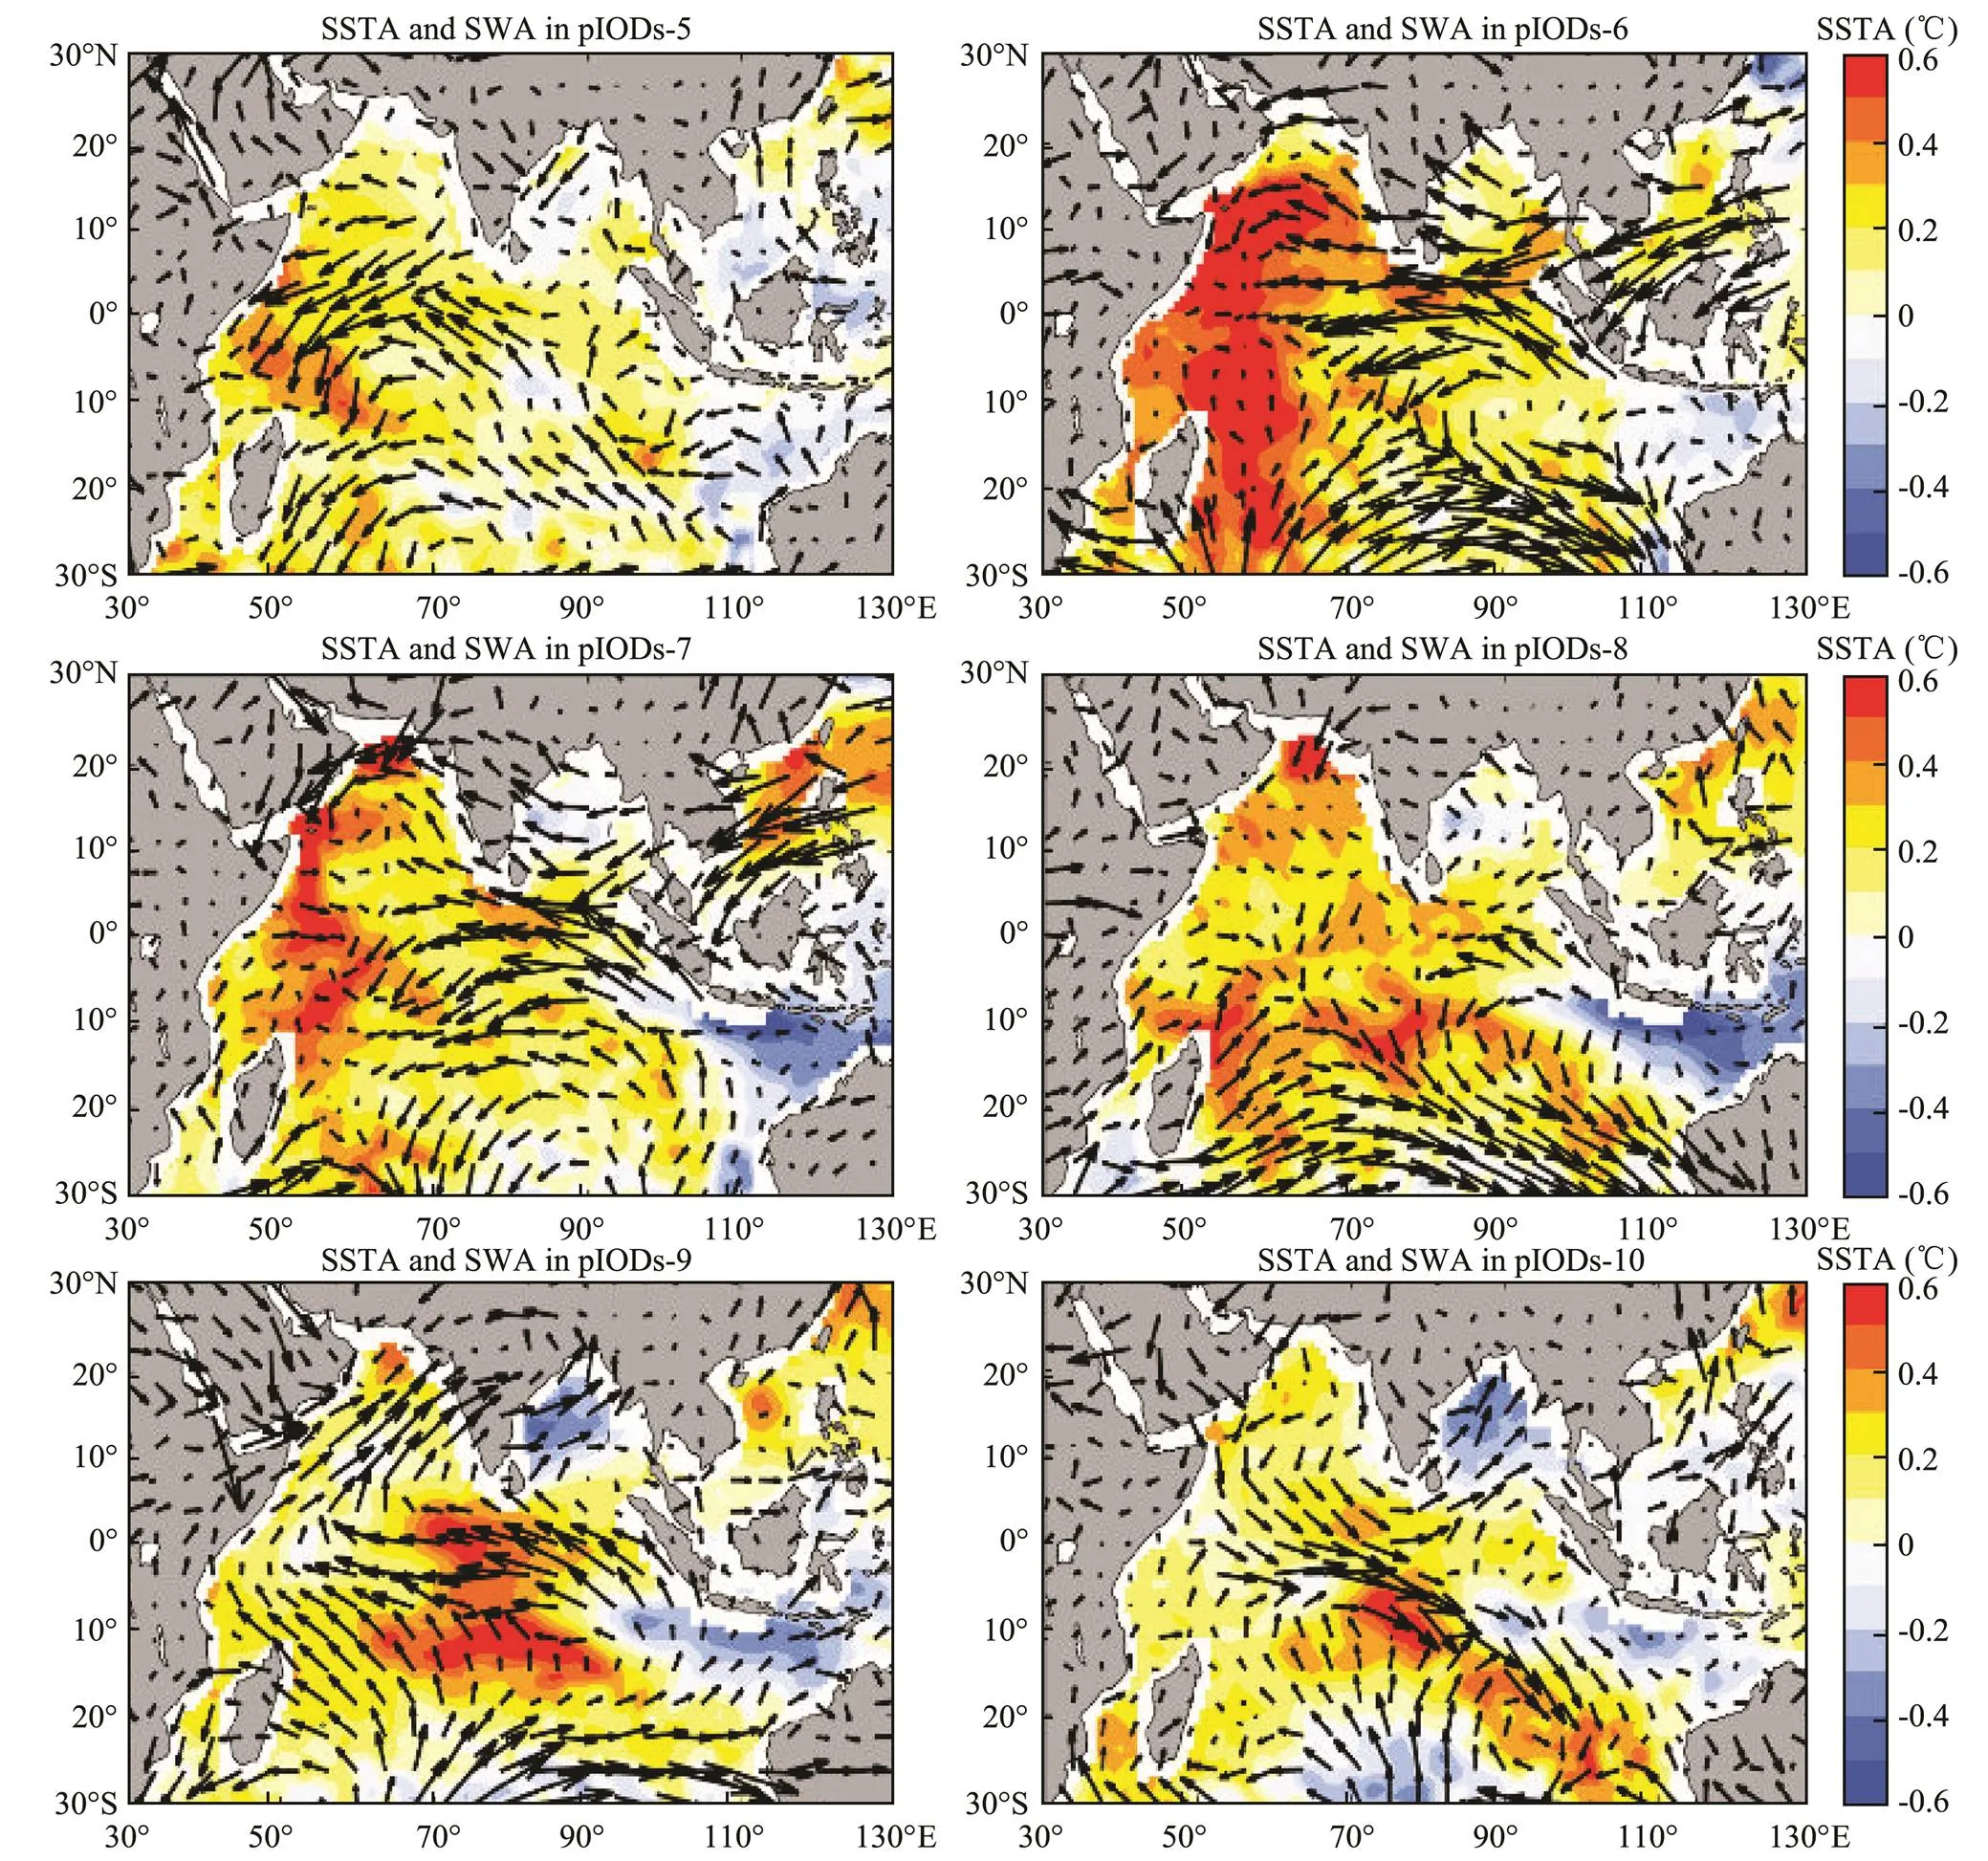
Fig.8 Distribution of SSTA and SWA from May to October for pIODs.
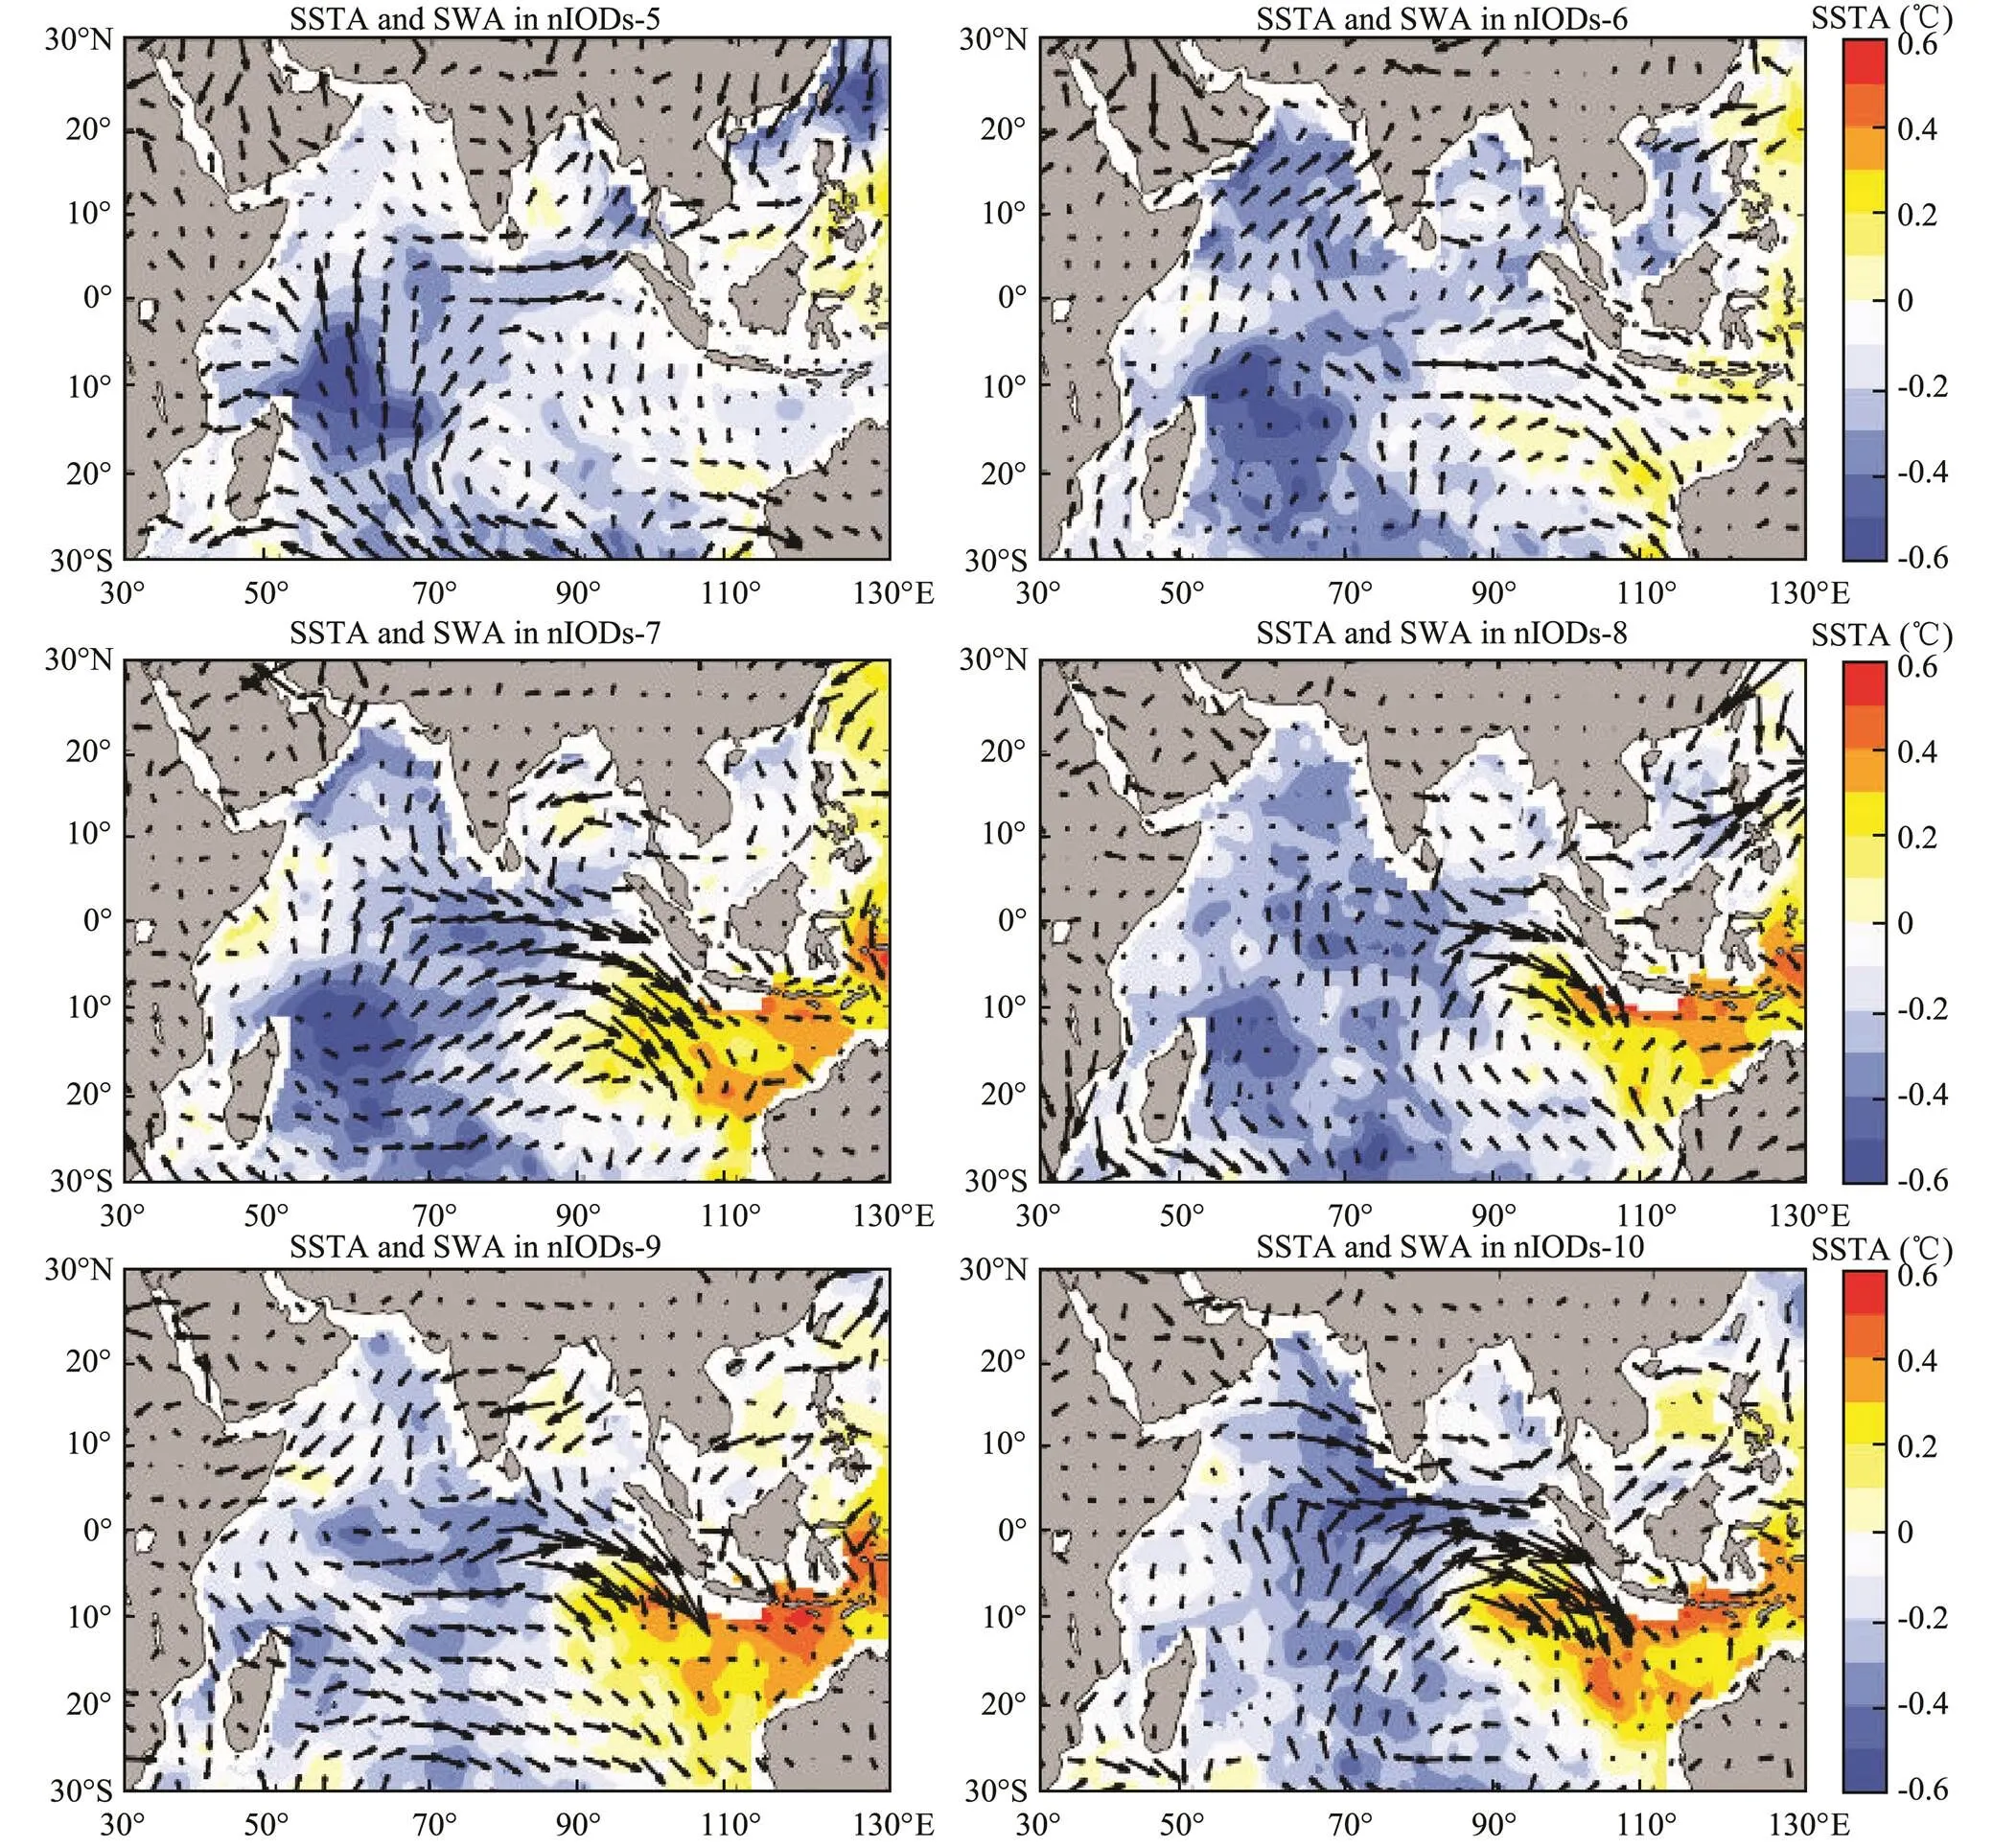
Fig.9 Distribution of SSTA and SWA from May to October for nIODs.
Oceanic thermal advection, which represented a typical thermal transport process by the ocean water self-movement, played a crucial role in R1. Combined with the result that the Corr<,net> in pIODs was higher than that in nIODs, oceanic thermal advection anomalies in most areas, inducing local heat loss or to gain, could be considered as a reasonable explanation for the inconsistency between the rates of change in the HC anomaly and thenetanomaly appearing in the areas near 60?E. In the relevant region, the magnitude of oceanic thermal advection in the nIODs greatly exceeded that in the pIODs from June to October, as the larger magnitudes of current anomalies show in Fig.7. Considering the lag correlation shown in Fig.6, the composite heat loss indicated that mean oceanic thermal advection played a crucial role in the increase in negative SSTA. Different from thenetanomaly, the anomalous advective heat relied not only on atmospheric forcing, but also on the background current field (Fig.10). Considering the distribution of the mean current of the mixed layer from May to October, the superimposed current in nIODs was stronger than that in pIODs, thus the advective thermal effect on nIODs was more significant.
Zonal current anomalies in the equatorial region agreed well with the local SWA from June to October. Figs.8 and 9 indicate that the regional SSTA difference was the direct reason for the formation of SWA, so this process could be explained by the ‘zonal SSTA and SWA trigger’ proposed in Guo (2015). Nevertheless, the results showed that the meridional anomalous thermal advection was also non-negligible during the formation of IODs, particularly nIODs. With the development of nIODs, the anomalous wind circulation moved toward the east, and the meridional SWA was prevailing in the areas near 60?E in R1. SSTA gradient also exited in a S-N direction, besides the zonal distribution. As the center of SSTA moved eastward, the meridional SSTA difference appeared near 60?E in R1 and the southward component of SWA formed in the months from August to October. In pIODs, the superimposed wind in the corresponding areas, where the anomalous wind circulation was located, was strong in the eastern TIO and weak in the western TIO. Evaporative capacity was enhanced/weakened by the SWA and relative humidity during the occurrence of IOD, which could explain the regional difference in LH. The large-scale General Atmospheric Circulation (GAC) anomaly in the pIODs, which was left by the ENSO that occurred in the previous year, was concretely represented as the stronger initial fields, including the SSTA, SSWA, SLPA, in the TIO.
The MLD anomaly in IODs is not discussed here. To verify the accuracy of the calculations and account for the error, the seasonal MLD depth in the TIO for R1 and R2 are displayed in Fig.11. Vertical entrainment term was less than 5Wm?2throughout the whole year. The residual term would slightly increase since June in each IOD index region, which may be due to an error in data or calculation during the period of seasonal increase in MLD.
5 Summary
In this study, long-series data obtained from official sources was adopted to investigate heat conservation in the mixed layer during Type II IODs occurring in the year after ENSO with statistical methods. Conclusions are summarized as follows: 1) The SSTA difference (between R1 and R2) in pIODs occurring after an El Ni?o is more controlled by the significant regional differences in surface heat flux anomalies, which are related to the initial anomalous air-sea field. Effect of self-movement of ocean water, especially the advective thermal transport anomaly in the region R1 induced by the anomalous current, acts as a more dominant factor in the formation of nIODs. 2) Appearance of the zonal oceanic thermal advection anomaly is triggered by the zonal current anomaly and SWA induced by the zonal SSTA gradient. It is noteworthy that this trigger accords well with the mechanism proposed by Guo (2015). In nIODs, the zonal SSTA gradient could increase the advective thermal effect in R1 and enlarge the SSTA difference between R1 and R2, while in pIODs, the zonal mechanism would enhance the regional difference in evaporative capacity and LH. 3) Besides the zonal SSTA gradient, the meridional SSTA difference and the SWA induced meridional current anomaly were also non-negligible. With the center of SSTA moving eastward, the meridional SWA difference appears near 60?E in R1 due to the regional meridional SSTA difference. Meridional thermal advection makes a crucial contribution during the formation of IODs, particularly nIODs.

Fig.10 Distribution of the mean mixed layer current layer from May to October.

Fig.11 Seasonal average mixed layer depth.
In the future, we will continue to explore more ocean-atmosphere triggers of Type II IODs (occurring after an ENSO). From the view of large-scale air-sea interaction, combined with the atmospheric theory of ‘teleconnections’ we would conduct further analysis of the variations in the large-scale radial atmospheric and zonal atmospheric circulations, through long-series meteorological observation or modeling data. We also anticipate that numerical simulation, coupling regional atmospheric and oceanic models, will obtain more detailed data and explore more triggers.
Acknowledgements
This study is supported by the National Key Research and Development Program of China (No. 2016YFC1402000) and the National Natural Science Foundation of China (Nos. 51509226, 51779236).
Allan, R. J., Chambers, D., Drosdowsky, W., Hendon, H., Latif, M., Nicholls, N., Smith, I., Stone, R. C., and Tourre, Y., 2001. Is there an Indian Ocean dipole, and is it independent of the El Ni?o-Southern Oscillation?, 6: 18-22.
Annamalai, H., Murtugudde, R., Potemra, J., Xie, S. P., and Wang, B., 2003. Coupled dynamics over the Indian Ocean: Spring initiation of the zonal mode., 50: 2305-2330, DOI: 10.1016/s0967-0645(03)00058-4.
Behera, S. K., Luo, J. J., Masson, S., Rao, S. A., Sakuma, H., and Yamagata, T., 2006. A CGCM study on the interaction between the IOD and the ENSO., 19: 1688-1705, DOI: http://dx.DOI.org/10.1175/JCLI3797.1.
Bjerknes, J., 1969. Atmospheric teleconnections from the equatorial Pacific., 97: 163-172, DOI: 10.1175/1520-0493(1969)0972.3.CO;2.
Bracco, A., Kucharski, F., Molteni, F., Hazeleger, W., and Severijns, C., 2005. Internal and forced modes of variability in the Indian Ocean,, 32: L12707, DOI: 10.1029/2005GL023154.
Cai, W., van Rensch, P., Cowan, T., and Hendon, H. H., 2011. Teleconnection pathways of the ENSO and the IOD and the mechanisms for impacts on Australian rainfall., 24: 3910-3923, DOI: 10.1175/2011JCLI4129.1.
Cai, W., van Rensch, P., Cowan, T., and Hendon, H. H., 2012. An asymmetry in the IOD and the ENSO teleconnection pathway and its impact on Australian climate., 25: 6318-6329, DOI: 10.1175/JCLI-D-11-00501.1.
Carton, J. A., Chepurin, G., Cao, X., and Giese, B., 2000a. A simple ocean data assimilation analysis of the global upper ocean 1950–1995: Part 1. Methodology., 30: 294-309, DOI: 10.1175/1520-0485(2000)030<0294:asodaa>2.0.co;2.
Carton, J. A., Chepurin, G., and Cao, X., 2000b. A simple ocean data assimilation analysis of the global upper ocean 1950–1995: Part2.Results.,30:311-326, DOI: 10.1175/1520-0485(2000)030<0294:asodaa>2.0.co;2.
Carton,J.A.,andGiese,B.S.,2008.Areanalysisofoceanclimate using Simple Ocean Data Assimilation (SODA).,136:2999-3017,DOI:10.1175/2007mwr1978.1.
Chowdary, J. S., and Gnanaseelan, C., 2007. Basin-wide warming of the Indian Ocean during El Ni?o and Indian Ocean dipole years., 27: 1421-1438, DOI: 10.1002/joc.1482.
Fischer, A. S., Terray, P., Guilyardi, E., Gualdi, S., and Delecluse, P., 2005. Two independent triggers for the Indian Ocean dipole/zonal mode in a coupled GCM., 18: 3428-3449, DOI: 10.1175/JCLI3478.1.
Forootan, E., Awange, J. L., Schumacher, M., and Kusche, J., 2016. Quantifying the impacts of ENSO and IOD on rain gauge and remotely sensed precipitation products over Australia., 172: 50-66, DOI: 10.1016/j.rse.2015.10.027.
Guo, F., Liu, Q., Sun, S., and Yang, J., 2015. Three types of Indian Ocean Dipoles., 28: 3073-3092, DOI: 10.1175/JCLI-D-14-00507.1.
Huang, B., and Kinter, J. L. III, 2002. Interannual variability in the tropical Indian Ocean., 107: 3199, DOI: 10.1029/2001JC001278.
Ham, Y. G., Choi, J. Y., and Kug, J. S., 2017. The weakening of the ENSO-Indian Ocean Dipole (IOD) coupling strength in re- cent decades., 49: 249-261, DOI: 10.1007/s00382-016-3339-5.
Hong, C. C., Lu, M. M., and Kanamitsu, M., 2008. Temporal and spatial characteristics of positive and negative Indian Ocean dipole with and without ENSO., 113: D08107, DOI: 10.1029/2007JD009151.
Hong, C. C., Li, T., and Luo, J. J., 2008. Asymmetry of the Indian Ocean Dipole. Part II: Model diagnosis., 21: 4849-4858, DOI: 10.1175/2008JCLI2223.1.
Hong, C. C., Li, T., Lin, H., and Chen, Y. C., 2010. Asymmetry of the Indian Ocean basinwide SST anomalies: Roles of ENSO and IOD., 23: 3563-3576, DOI: 10.1175/2010JCLI3320.1.
Hong, X. Y., Hu, H. B., Yang, X. Q., Zhang, Y., Liu, G. Q., and Liu, W., 2014. Influences of Indian Ocean interannual variability on different stages of El Ni?o: A FOAM1.5 model approach.–, 57: 2616-2627, DOI: 10.1007/s11430-014-4932-2.
Li, T., Wang, B., Chang, C. P., and Zang, Y., 2003. A theory for the Indian Ocean dipole-zonal mode., 60: 2119-2135, DOI: 10.1175/1520-0469(2003)060,2119:ATFTIO.2.0.CO;2.
Nur’utami, M. N., and Hidayat, R., 2016. Influences of IOD and ENSO to Indonesian rainfall variability: Role of atmosphere-ocean interaction in the Indo-Pacific sector., 33: 196-203, DOI: 10.1016/j.proenv.2016.03.070.
Rao, S. A., and Behera, S. K., 2005. Subsurface influence on SST in the tropical Indian Ocean: Structure and interannual variability., 39: 103-135, DOI: 10.1016/j.dynatmoce.2004.10.014.
Saji, N. H., Goswami, B. N., Vinayachandran, P. N., and Yamagata, T., 1999. A dipole mode in the tropical Indian Ocean., 401: 360-363, DOI: 10.1038/43854.
Saji, N. H., Xie, S. P., and Yamagata, T., 2006. Tropical Indian Ocean variability in the IPCC twentieth-century climate simu- lations., 19: 4397-4417, DOI: 10.1175/jcli3847.1.
Spencer, H., Sutton, R. T., Slingo, J. M., Roberts, M., and Black, E., 2005. Indian Ocean climate and dipole variability in Hadley Centre coupled GCMs., 18: 2286-2307, DOI: 10.1175/JCLI3410.1.
Stuecker, M. F., Timmermann, A., Jin, F., Chikamoto, Y., Zhang, W., and Wittenberg, A. T., 2017. Revisiting ENSO/Indian Ocean dipole phase relationships., 44: 2481-2492, DOI: 10.1002/2016GL072308.
Webster, P. J., Moore, A. M., Loschnigg, J. P., and Leben, R. R., 1999. Coupled ocean-atmosphere dynamics in the Indian Ocean during 1997–98., 401: 356-360, DOI: 10.1038/43848.
Xie, S. P., Annamalai, H., Schott, F. A., and McCreary, J. P., 2002. Structure and mechanisms of South Indian Ocean climate variability., 15: 864-878, DOI: 10.1175/1520-0442(2002)015,0864: SAMOSI.2.0.CO;2.
Yang, J. L., Liu, Q., and Liu, Z., 2010. Linking observations of the Asian monsoon to the Indian Ocean SST: Possible roles of Indian Ocean basin mode and dipole mode., 23: 5889-5902, DOI: 10.1175/2010JCLI2962.1.
Yu, L., Weller, R. A., and Sun, B., 2004. Improving latent and sensible heat flux estimates for the Atlantic Ocean (1988–1999)by a synthesis approach., 17: 373-393, DOI: 10.1175/1520-0442(2004)017<0373:ilashf>2.0.co;2.
Zhong, A., Hendon, H. H., and Alves, O., 2005. Indian Ocean variability and its association with ENSO in a global coupled model., 18: 3634-3649, DOI: 10.1175/JCLI3493.1.
. E-mail: kejianwu@ouc.edu.cn
June 25, 2019;
August 23, 2019;
September 2, 2019
(Edited by Xie Jun)
 Journal of Ocean University of China2020年3期
- Journal of Ocean University of China的其它文章
- Estimation of the Reflection of Internal Tides on a Slope
- The New Minimum of Sea Ice Concentration in the Central Arctic in 2016
- Image Dehazing by Incorporating Markov Random Field with Dark Channel Prior
- Biochemical Factors Affecting the Quality of Products and the Technology of Processing Deep-Sea Fish,the Giant Grenadier Albatrossia pectoralis
- Propulsion Performance of Spanwise Flexible Wing Using Unsteady Panel Method
- Study on Wave Added Resistance of a Deep-V Hybrid Monohull Based on Panel Method