
Altered profiles of fecal bile acids correlate with gut microbiota and inflammatory responses in patients with ulcerative colitis
2021-07-12 07:55:06ZhenHuanYangFangLiuXiaoRanZhuFeiYaSuoZijunJiaShuKunYao
World Journal of Gastroenterology 2021年24期
Zhen-Huan Yang, Fang Liu, Xiao-Ran Zhu, Fei-Ya Suo, Zi-jun Jia, Shu-Kun Yao
Abstract
Key Words: Ulcerative colitis; Gut microbiota; Bile acids; Takeda G-protein-coupled receptor 5 ; Vitamin D receptor
INTRODUCTION
Ulcerative colitis (UC) is a form of inflammatory bowel disease (IBD). It is characterized by continuous and diffuse inflammation starting in the rectum that can extend to proximal segments of the colon. The typical symptoms of UC include bloody diarrhea, abdominal pain, fecal urgency, and tenesmus. According to relevant epidemiological studies, the prevalence rates are high in Western developed countries,particularly in Europe (505 per 100000 in Norway) and North America (286 per 100000 in the United States)[1 ]. With the popularization of colonoscopy screening and changes in lifestyle and diet, the incidence and prevalence of UC have been increasing over time worldwide[2 ].
The natural history of UC includes periods of remission and flare-ups, and the goal of therapy is to induce and maintain clinical remission free of corticosteroids, thus minimizing the impact on quality of life[3 ]. Currently, treatments for UC include 5 -aminosalicylates[4 ], corticosteroids[5 ], antitumor necrosis factor alpha drugs[6 ],antibiotics[7 ], probiotics[8 ], and immunosuppressants[9 ]. Studies indicate that a substantial proportion of patients who fail to respond to mesalamine for remission induction often rely on corticosteroids and/or immunomodulators to control the disease[10 ]. Corticosteroid resistance/refractoriness rates range from 8 .9 % to 25 % in individuals with IBD[11 ,12 ]. Patients with long-standing IBD involving at least 1 /3 of the colon are at an increased risk for colorectal cancer [13 ]. Colectomy is needed in up to 15 % of patients with UC[14 ]. Therefore, it is necessary to explore the pathogenesis of UC, and effective therapies that can induce and maintain remission in UC without serious side effects are forthcoming.
The etiology and pathogenesis of IBD are still unclear. It is generally believed that various factors, such as the environment, genetics, immunity, and intestinal microbes,play a key role in the occurrence and development of IBD[15 ]. The human gut microbiota is a dynamic and diverse community of commensal bacteria, fungi, and viruses; among them, bacteria, of which there are over 1000 different species,constitute the majority[16 ,17 ]. Microorganisms regulate multiple aspects of host functions, including fermentation of dietary fibers[18 ], pathogen defense[19 ],metabolism, and immune maturation[20 ]. Multiple studies have indicated differences in the composition of the gut microbiota in UC, including reduction in diversity,decreased abundances of bacterial taxa within theFirmicutesandBacteroides, and increases in the members of theProteobacteria phylum, such asEnterobacteriaceae[21 -23 ].
One of the primary modes by which the gut microbiota interacts with the host is by means of metabolites. Bile acid (BA) metabolites have recently drawn much attention in UC. BAs can be divided into two categories based on structure: Free BAs, including cholic acid (CA), chenodeoxycholic acid (CDCA), deoxycholic acid (DCA), and lithochalic acid (LCA); and conjugated BAs, which are a combination of the abovementioned free BAs and glycine or taurine. BAs can also be divided into primary BAs and secondary BAs based on the source. The intestinal microbiota converts the primary BAs synthesized by host cells to secondary BAs. A few clinical studies have shown that there is a disorder of BA metabolism in patients with UC, which is characterized by enrichment of primary BAs and conjugated BAs and reduction of secondary BAs such as LCA and DCA[24 -26 ]. Nevertheless, previous studies have only measured various fecal BAs but have not extensively investigated their relationships with the gut microbiota, its metabolites, and inflammatory cytokines in patients with UC.
BA receptors mediate the effects of BAs in the intestine, including nuclear receptors and membrane receptors. Nuclear receptors include farnesoid X receptor (FXR),pregnane X receptor, and vitamin D receptor (VDR). Membrane receptor refers to G protein-coupled bile acid receptor 1 , also known as Takeda G protein-coupled receptor 5 (TGR5 )[27 ,28 ]. The TGR5 and VDR signaling pathways play an important role in regulating inflammatory responses, cell proliferation, and apoptosis and controlling glycolipid and energy metabolism. Animal studies have shown that TGR5 and VDR participate in intestinal immune regulation and barrier function and reduce inflammatory responses[29 ]. However, the expression of the BA receptors VDR and TGR5 in colonic mucosal specimens from UC patients is still unclear.
Therefore, we hypothesized that dysregulation of the gut microbiota and altered constitution of fecal BAs may participate in regulating inflammatory responsesviathe BA receptors TGR5 and VDR. This study focused on the changes in the gut microbiota,fecal BA profiles, and BA receptor expression in the colonic mucosa. Correlations between these parameters were also analyzed. The findings may provide new insights into the pathogenesis of UC and the development of effective therapeutic methods for UC.
MATERIALS AND METHODS
Recruitment of subjects and sample collection
Based on the sample size of other studies[26 ,30 -32 ], a total of 32 UC patients and 23 age- and sex-matched healthy controls (HCs) were recruited in the study. All patients were treated at the gastroenterological department of China-Japan Friendship Hospital from April 2019 to January 2020 . Ulcerative colitis usually presents with bloody diarrhea and is diagnosed by colonoscopy and histological findings, as well as the exclusion of infectious and noninfectious colitis. The Mayo score of disease activity of the enrolled patients was required to be 4 -12 to ensure that the clinical symptoms were significant at the study entry.
The exclusion criteria for UC patients were as follows: (1 ) Below the age of 18 or above the age of 65 years; (2 ) Use of probiotics or prokinetics, antispasmodics, and analgesics within 2 wk, or antibiotics, corticosteroids, immunosuppressants, BA sequestrants, and lipid-lowering agents within 3 mo; (3 ) Previous major abdominal surgery or organic diseases such as celiac disease; (4 ) Severe hypertension, diabetes,coronary heart disease, psychiatric disorders, or biliary or liver comorbidities; (5 )Pregnancy, lactation, or planned pregnancy; and (6 ) Uncooperativeness. All subjects gave written informed consent before participation. The study protocol was approved by the Ethics Committee of the China-Japan Friendship Hospital (No. 2019 -K16 ).
After enrollment, the clinical status of each subject was first assessed using validated questionnaires. Fasting blood specimens were collected from all subjects,and serum samples were obtained and stored at -80 °C until analysis. Stool samples were collected as soon as possible within 1 d of UC patients' visit to prevent initiation of medical treatment from changing the composition of the intestinal flora. The pharmacological agents aforementioned were not allowed throughout the study period. Each fecal sample was divided into two parts with sterile plastic tubes after defecation. Samples were frozen in liquid nitrogen immediately and stored at -80 °C.All subjects were required to maintain their daily dietary habits at least 1 wk before the collection of the stool samples and until all of the assessments were finished. The next day, subjects underwent colonoscopy after standard bowel preparation with polyethylene glycol electrolyte solution, and one mucosal pinch biopsy was taken from the colorectal lesion. The specimen was immediately fixed in 10 % formalin for at least 72 h, embedded in paraffin, and sectioned (4 μm) for immunohistochemistry.
Clinical assessments
Clinical assessments were first conducted using standardized questionnaires. The severity indexes of UC were assessed using the previously validated Mayo score[33 ].The scoring system determines the severity of UC based on the patient’s bloody diarrhea, doctor’s assessment, and colonoscopy. Montreal classification was used to assess the extent of UC[34 ]. The Bristol Stool Form Scale (BSFS), a 7 -point scale, was used to measure stool form.
DNA extraction, 1 6 S rDNA amplification, and Illumina sequencing
Total DNA extraction was performed according to the instructions of the E.Z.N.A. soil kit (Omega Biotek, Norcross, GA, United States). The DNA concentration and purity were determined using a Thermo NanoDrop2000 , and the quality of DNA extraction was validated by 1 % agarose gel electrophoresis; 341 F (5 ′-CCTACGGGRSGCAGCAG-3 ′) and 806 R (5 ′-GGACTACVVGGGTATCTAATC-3 ′) primers were used for PCR amplification of the V3 -V4 variable region using the following amplification procedure: Predena-turation at 95 °C for 3 min, amplification for 27 cycles(denaturation at 95 °C for 30 s, annealing at 55 °C for 30 s, and extension at 72 °C for 30 s), and final extension at 72 °C for 10 min (PCR instrument: ABI GeneAmp 9700 ). The 20 μL reaction mixture included 4 μL of 5 × FastPfu buffer, 2 μL of 2 .5 mmol/L dNTPs,0 .8 μL of primer (5 μmol/L), 0 .4 μL of FastPfu polymerase, and 10 ng of DNA template.
The PCR products were recovered using a 2 % agarose gel, purified with an AxyPrep DNA Gel Extraction Kit (Axygen Biosciences, Union City, CA, United States), eluted with Tris-HCl, and detected by 2 % agarose electrophoresis. Quantification was performed using QuantiFluor-ST (Promega, United States). Sequencing was performed using Illumina’s MiSeq PE250 platform (Illumina, San Diego, United States).
Bile acid quantitation
BAs in feces were measured according to previously reported methods[35 ,36 ]. A Waters ACQUITY ultra-performance LC system coupled with a Waters XEVO TQ-S mass spectrometer with an ESI source controlled by MassLynx 4 .1 software (Waters,Milford, MA) was used for all analyses. Chromatographic separations were performed with an ACQUITY BEH C18 column (1 .7 μm, 100 mm × 2 .1 mm internal dimensions;Waters, Milford, MA). UPLC-MS raw data obtained in negative mode were analyzed using TargetLynx Applications Manager version 4 .1 (Waters Corp., Milford, MA) to obtain calibration equations and the concentration of each BA in the samples.
Immunohistochemistry
Paraffin sections were processed for immunohistochemistry. Following deparaffinization, antigen repair, endogenous peroxidase inhibition, and nonspecific antigen blocking, the sections were incubated with primary antibodies (rabbit monoclonal anti-TGR5 antibody, 1 :100 ; rabbit monoclonal anti-VDR antibody, 1 :100 ; Abcam,Cambridge, United Kingdom) overnight at 4 °C. Following thorough washing with PBS, slides were incubated at room temperature for 1 h with horseradish peroxidaseconjugated anti-mouse rabbit secondary antibody (Zhongshan Gold Bridge, Beijing,China) and then visualized using diaminobenzidine. Finally, slides were counterstained with hematoxylin and viewed under a light microscope.
For each section, five nonoverlapping fields at 400 × magnification were randomly selected and scanned under an OLYMPUS microscope. Images were analyzed with Image-Pro Plus 6 .0 software (Media Cybernetics, Bethesda, MD, United States). The mean optical density of the mucosal staining area was used to measure the expression of TGR5 and VDR. All sections were inspected independently by two blinded observers, and the mean values of the readings were used for final analysis.
Statistical analysis
Statistical analyses were performed using SPSS software, version 24 .0 (SPSS Inc,Chicago, IL, United States). The normality of the distribution of the variables was tested using the Shapiro-Wilk test. Normally distributed data are presented as the mean ± SD, and abnormally distributed data are expressed as the median[interquartile range (IQR)]. Comparisons between groups were performed using independent samplet-tests for normally distributed data with homogeneous variances or nonparametric Mann-WhitneyUtests. Theχ2test or Fisher’s exact test was used to analyze qualitative data. Correlations between BA metabolites and other parameters were explored using Pearson’s correlation analysis for normally distributed data or Spearman’s correlation analysis for nonnormally distributed data or ranked data.Pvalues were two-sided, and differences were considered significant atP< 0 .05 .Statistical charts were generated with GraphPad Prism 5 .0 software (GraphPad Software Inc, La Jolla, CA, United States).
RESULTS
Characteristics of study subjects
The demographics and clinical characteristics of UC patients and HCs are presented in Table 1 . Thirty-two UC patients (17 males and 15 females; median age 37 .0 years, IQR:32 .00 -49 .75 ) and twenty-three HCs (13 males and 10 females; median age 32 .0 years,IQR: 27 .00 -51 .00 ) were enrolled in this study. There were no significant differences between the groups in age (P= 0 .570 ), sex (P = 0 .803 ), or body mass index (P = 0 .337 ).In UC patients, the duration of disease ranged from 0 .5 to 25 years (median 2 years).According to the Mayo scores (7 .8 ± 1 .9 ), 5 (15 .6 %) patients had mild UC, and 25 (78 .1 %) had moderate UC. The BSFS score [UC: 6 .0 (6 .0 , 6 .0 ) vs HC: 4 .0 (4 .0 , 4 .0 )] was significantly higher in UC patients than in HCs.
Structural characteristics of gut microbiota in the UC and control groups
Among the 594 operational taxonomic units (OTUs) detected, a total of 317 OTUs were identified in the two groups, including 86 unique OTUs in the UC group and 191 unique OTUs in the control group (Figure 1 A). The dilution curve analysis based on the Sobs index for community richness and the Shannon index for community diversity showed that the sequencing volume covered all the microorganisms in the samples and met the data analysis requirements (Figure 1 B). The species accumulation curve based on whether the sample size is sufficient and the estimated species richness showed that the sequencing sample size was sufficient, which can reflect most of the microbial information in the sample (Figure 1 C). Principal coordinate analysis was performed to assess the similarity of the bacterial communities, which clearly differentiated the intestinal flora of the UC group from the control group (Figures 1 D). Chao community richness index or the Shannon and Simpson community alpha diversity indexes of the UC group were significantly lower than those of the control group,indicating that the diversity of flora was reduced (Figure 1 E). The community compositions of the intestinal microbes in the UC group and control group were analyzed at the phylum and genus levels. At the phylum level, the dominant phyla found in both groups wereFirmicutes,Bacteroidetes,Proteobacteria, andActinobacteria(the proportions in the two groups were 46 .06 %, 28 .69 %, 20 .60 %, and 3 .61 % vs 68 .75 %, 26 .32 %, 2 .28 %,and 1 .66 %, respectively), while at the genus level,Bacteroides,Faecalibacterium,Escherichia,Prevotella, andRoseburiawere the top five genera (the proportions of which were 24 .64 %, 10 .88 %, 15 .03 %, 6 .50 , and 4 .96 % vs 21 .05 %, 24 .59 %, 0 .63 %, 7 .12 % and 8 .32 %, respectively) (Figure 1 F).
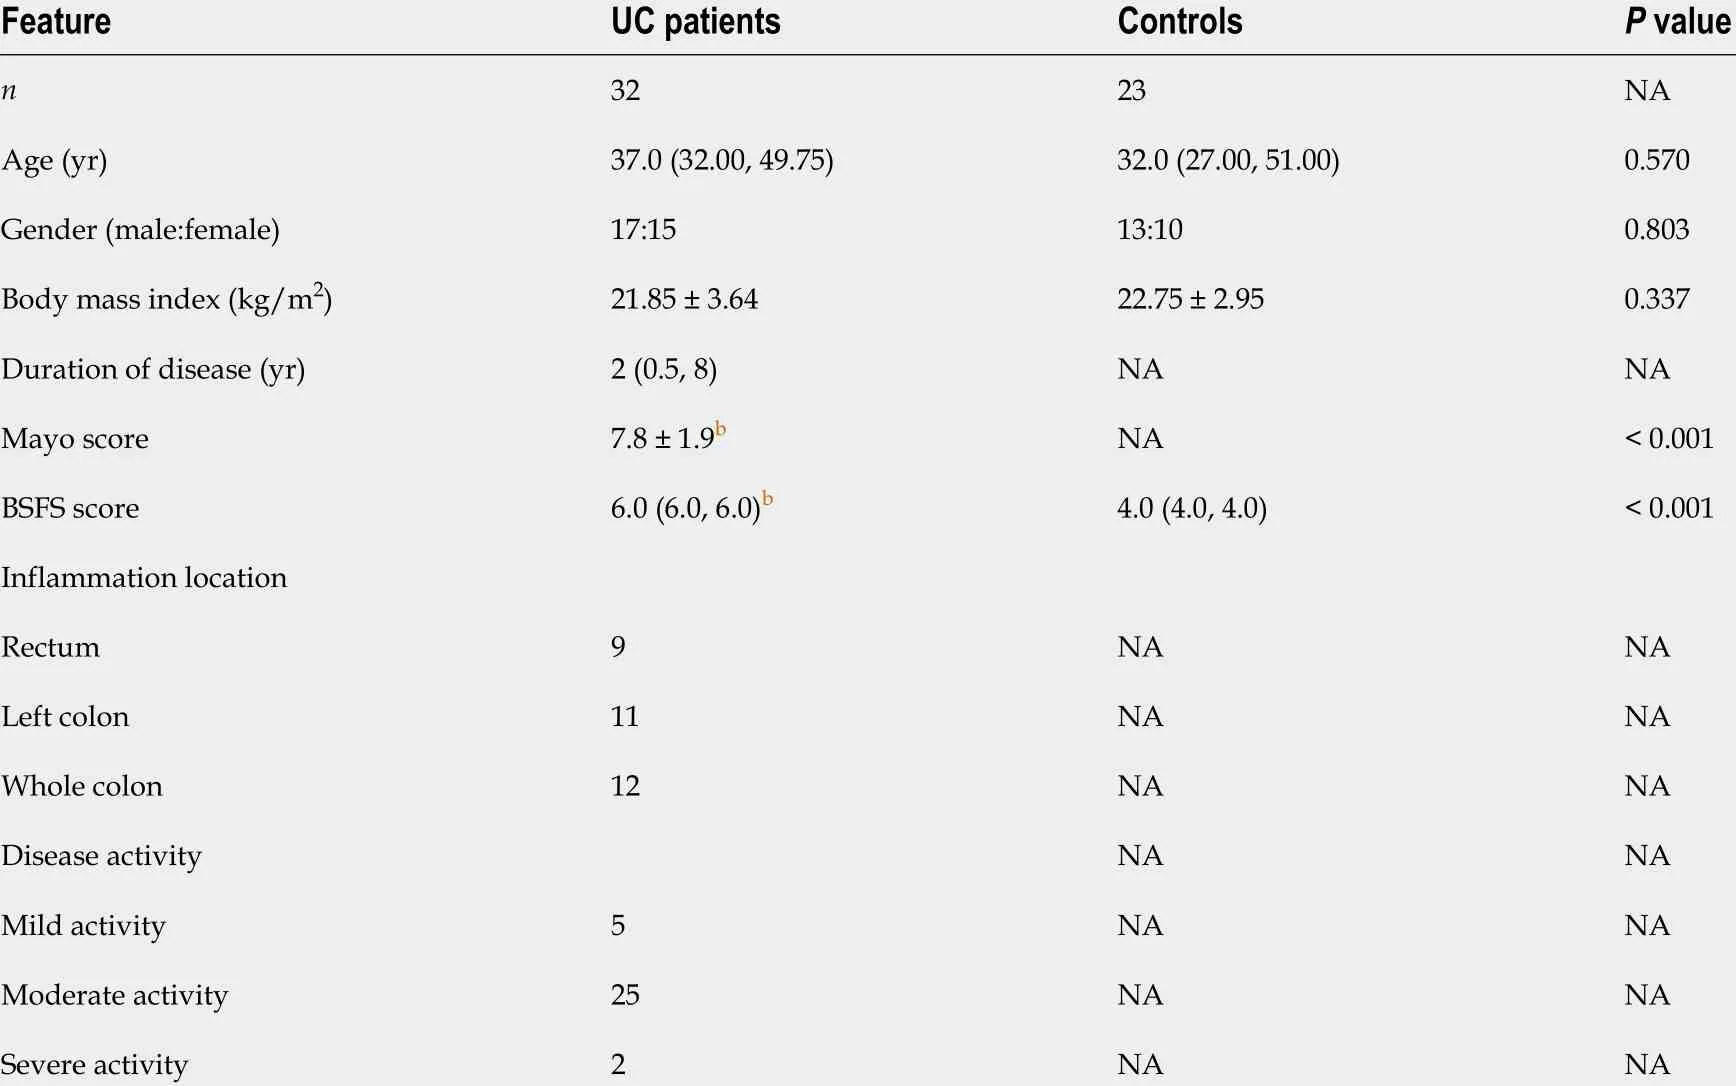
Table 1 Demographics and clinical characteristics of the study subjects
Screening of different key gut microbiota between the UC and control groups
The Wilcoxon rank sum test of differential species between the two groups showed significant changes in the intestinal microbes between the UC and control groups(Figure 2 A). At the phylum level,FirmicutesandProteobacteriain the UC group were significantly different from those in the control group (P= 3 .75 × 105 , P = 2 .99 × 109 ). At the genus level, the percentages ofClostridium IV,Butyricicoccus,Clostridium XlVa,Faecalibacterium,Roseburia, andCoprococcusin the UC group were significantly lower than those in the control group (P= 8 .28 × 107 , P = 0 .0002 , P = 0 .003 , P = 0 .0003 ,P=0 .0004 , and P = 7 .38 × 106 , respectively), and the percentages ofEscherichia,Enterococcus,Klebsiella, andStreptococcuswere significantly higher than those in the control group (P= 3 .63 × 105 , P = 8 .59 × 105 , P = 0 .003 , and P = 0 .016 , respectively).LEfSe analysis identified (threshold 2 ) the differential intestinal microbial communities b,etween the two groups (Figure 2 B).Clostridia,Clostridiales,Firmicutes,RuminococcaceaeandFaecalibacteriumwere significantly enriched in the control group.Proteobacteria,Gammaproteobacteria,Enterobacteriaceae,Enterobacteriales, andEscherichia_Shigellawere significantly enriched in the UC group.
Analysis of difference in fecal BAs between the UC and control groups
PCA was performed to evaluate the similarity of the fecal BAs of the two groups.Twenty-four BAs clearly distinguished the UC group from the control group(Figure 3 ). Fecal secondary BAs were significantly decreased in UC patients compared with healthy controls (Figure 3 B). The concentrations of fecal secondary BAs such as LCA, DCA, 12 _ketoLCA, glycol-deoxycholic acid (GDCA), glycol-lithocholic acid(GLCA), and tauro-lithocholic acid (TLCA) were significantly lower than those in healthy controls (P= 8 .1 × 108 , P = 1 .2 × 107 , P = 6 .3 × 107 , P = 3 .5 × 104 , P = 1 .9 × 103 ,andP= 1 .8 × 102 , respectively) (Figure 3 C-H). The concentrations of primary BAs such as taurocholic acid (TCA), CA, tauro-chenodeoxycholic acid (TCDCA), and glycolchenodeoxycholic acid (GCDCA) were significantly higher than those in HCs (P= 5 .3 × 103 , P = 4 × 10² , P = 0 .042 , and P = 0 .045 , respectively) (Figure 3 I and M). The concentrations of CDCA and glycol-cholic acid (GCA) showed a tendency to increase in UC patients but failed to reach a significant level (P= 0 .138 and P = 0 .074 , respectively)(Figure 3 J and N).
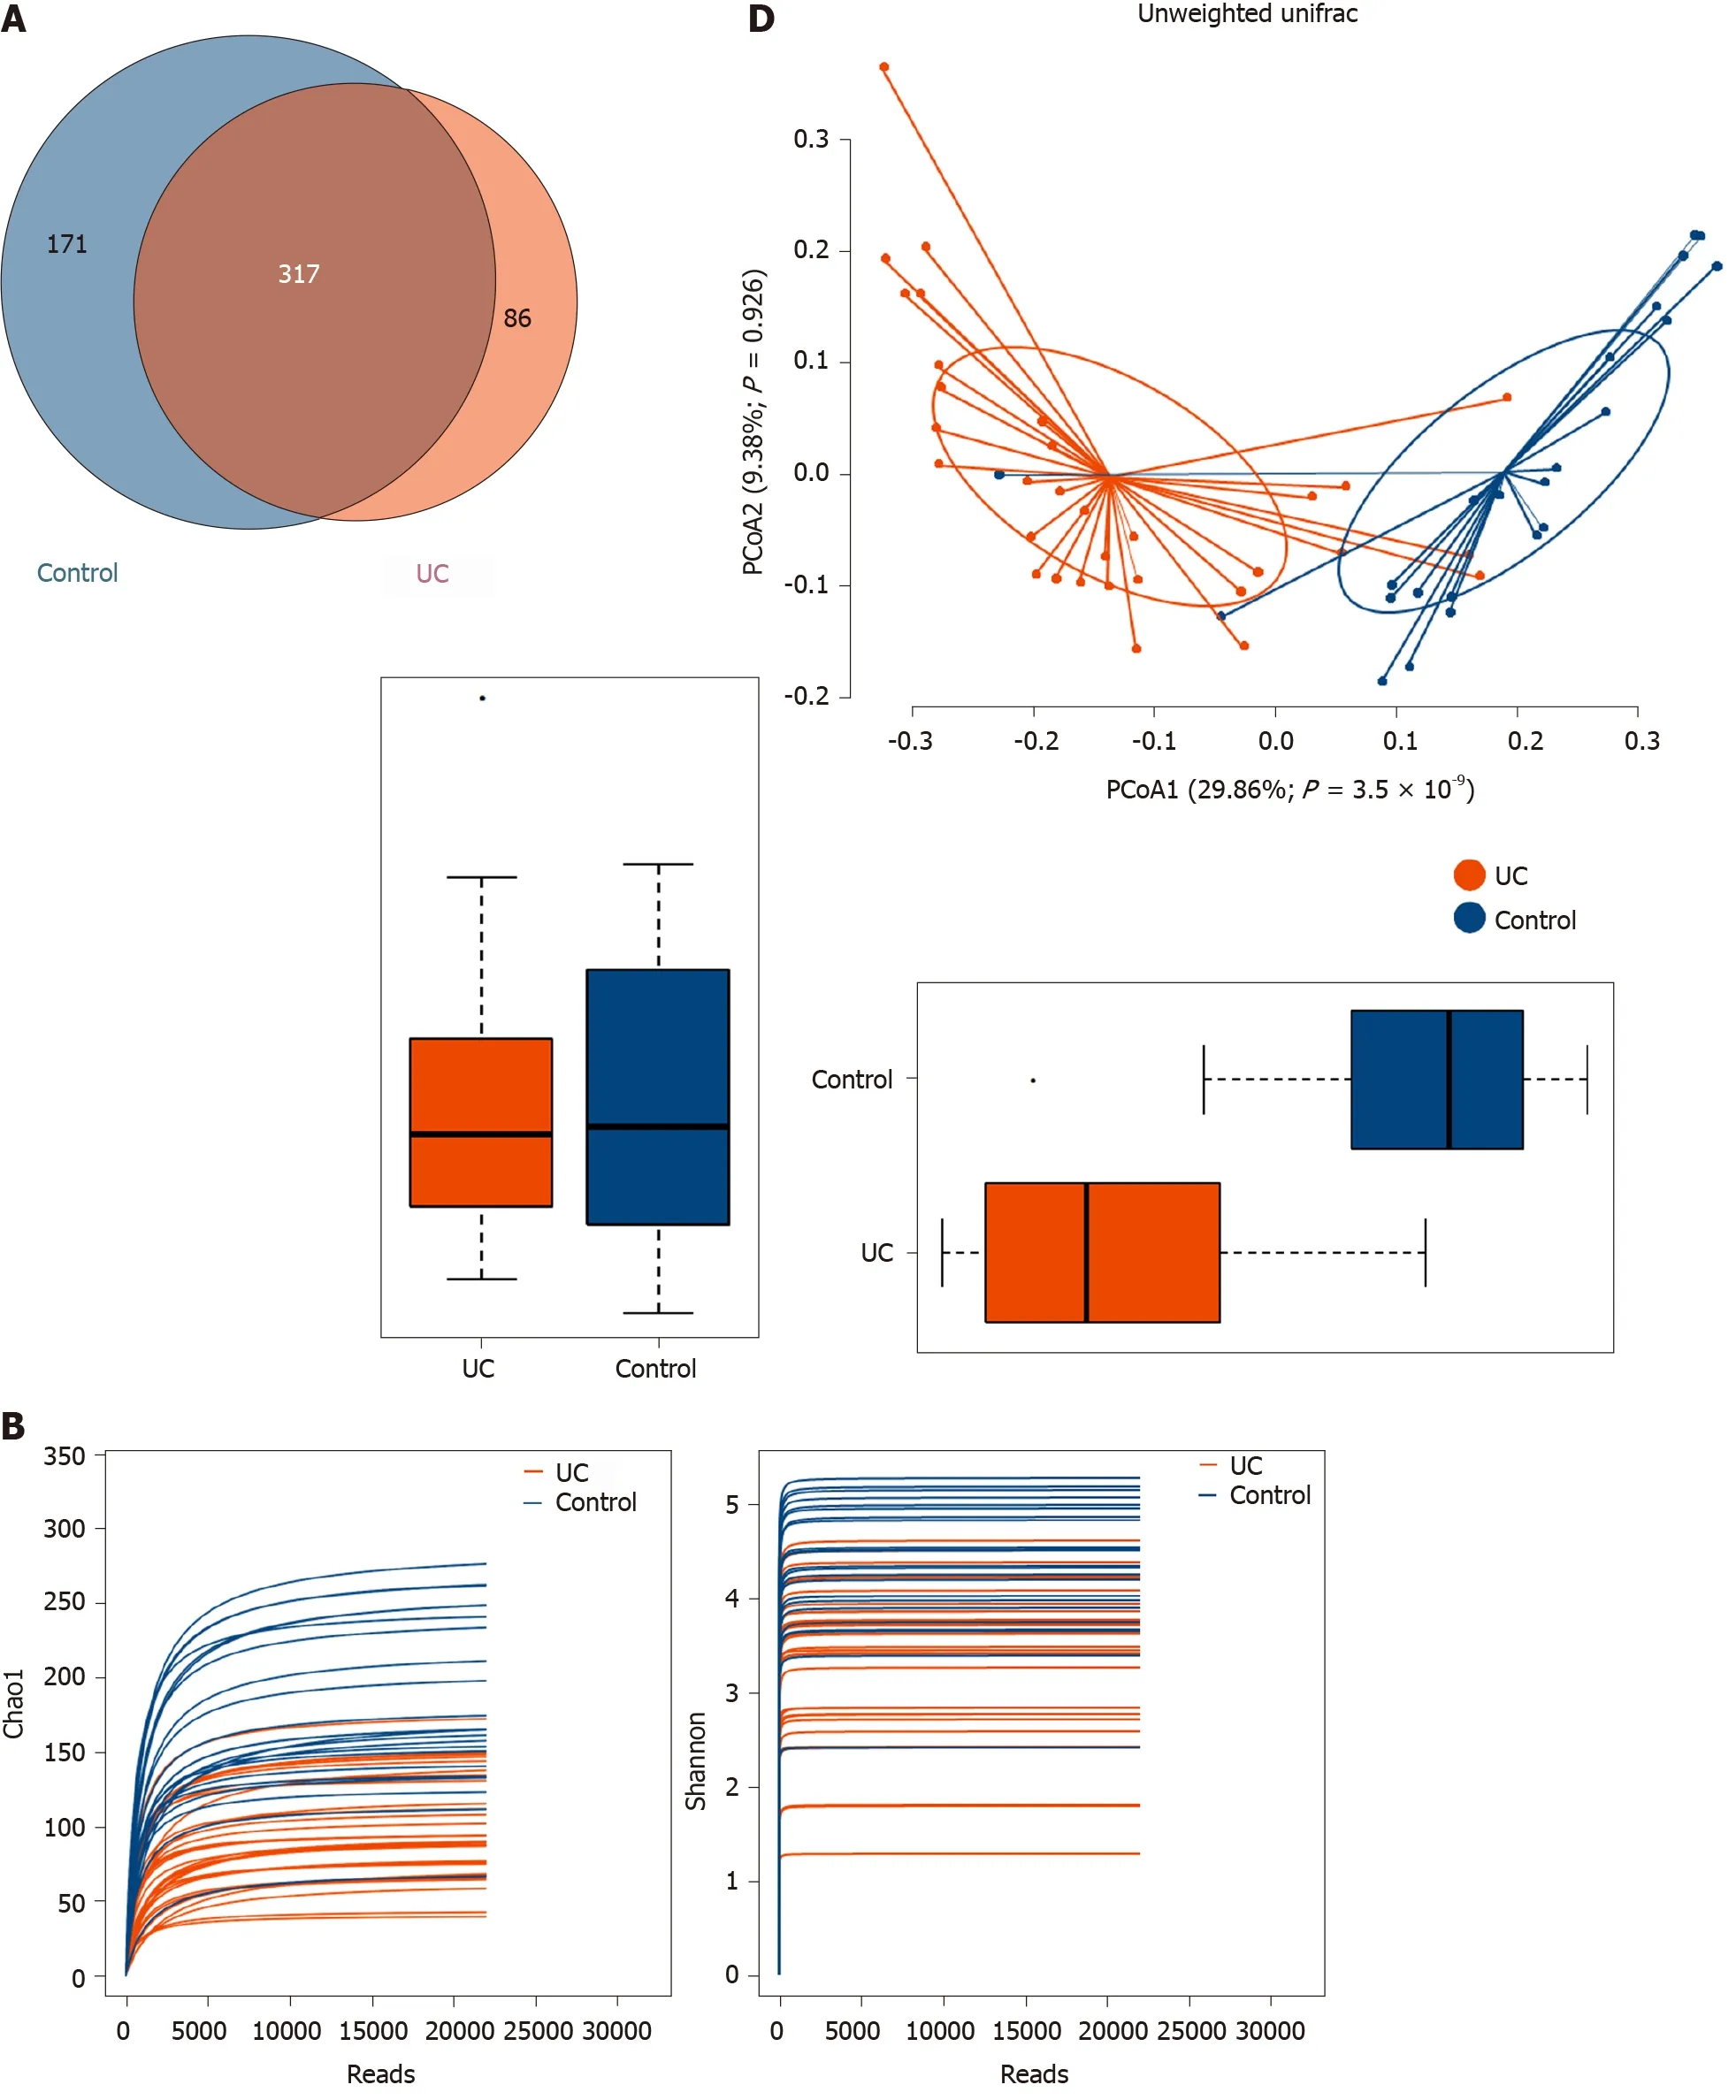
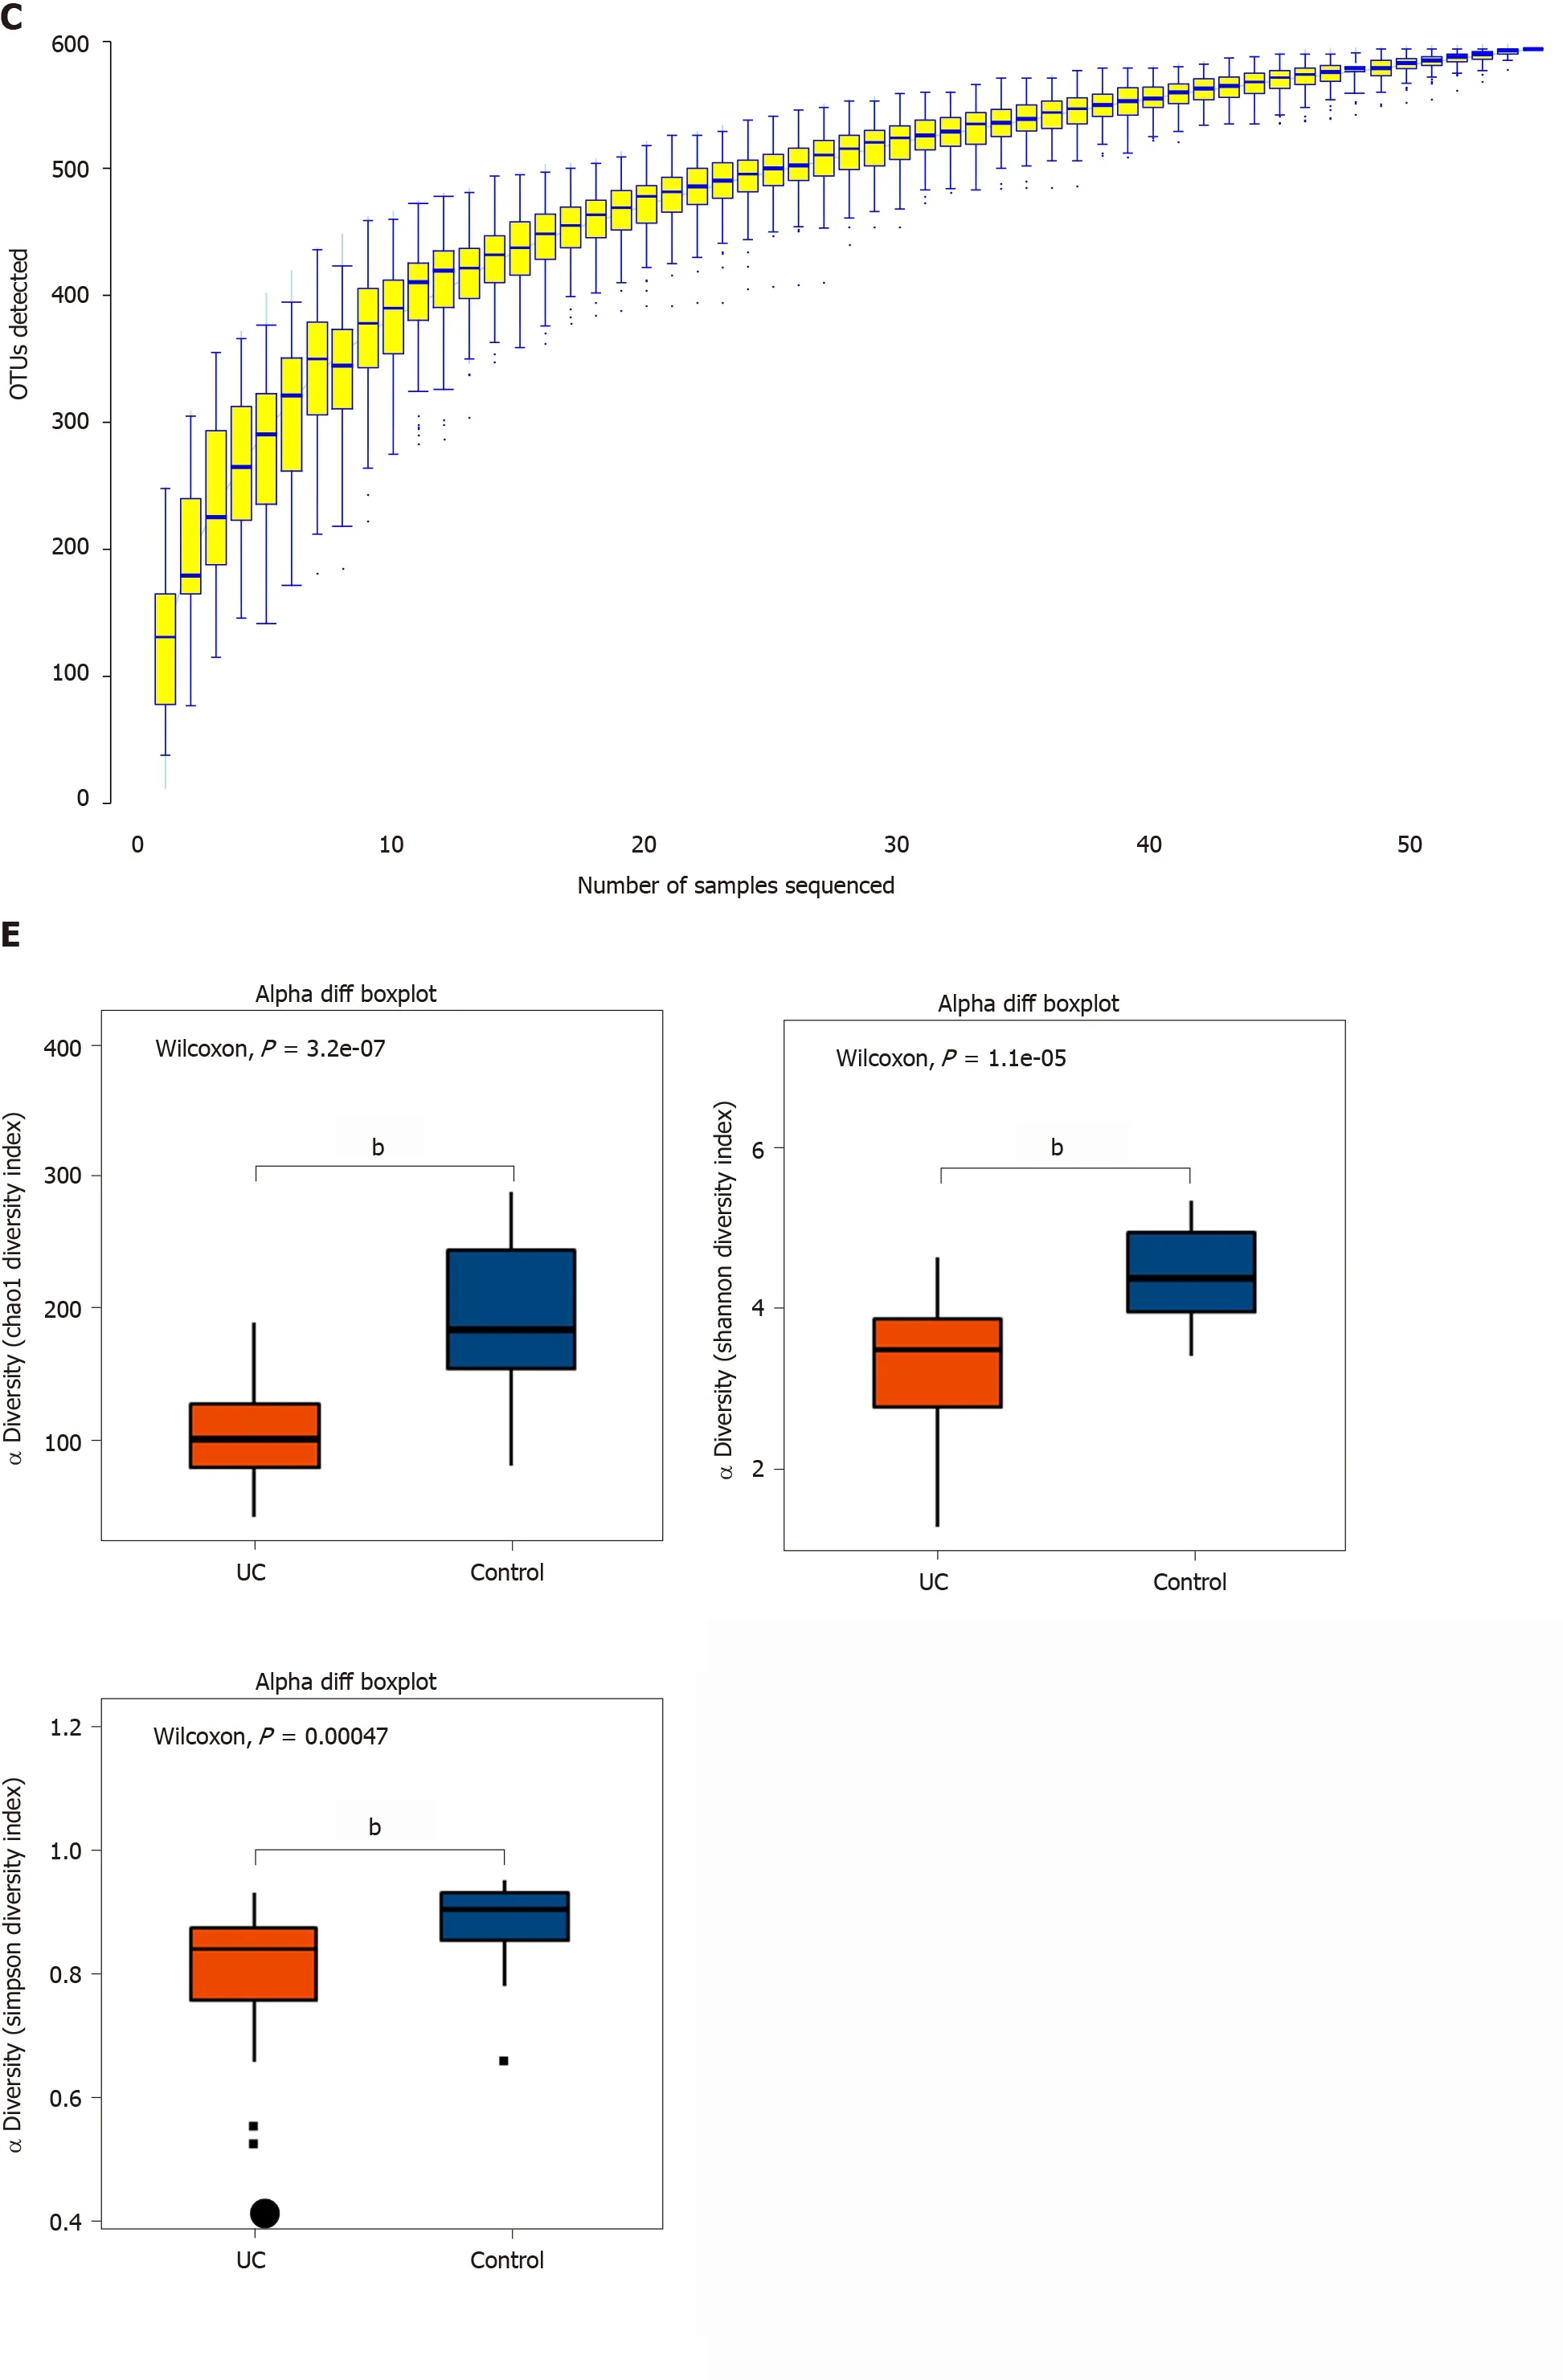
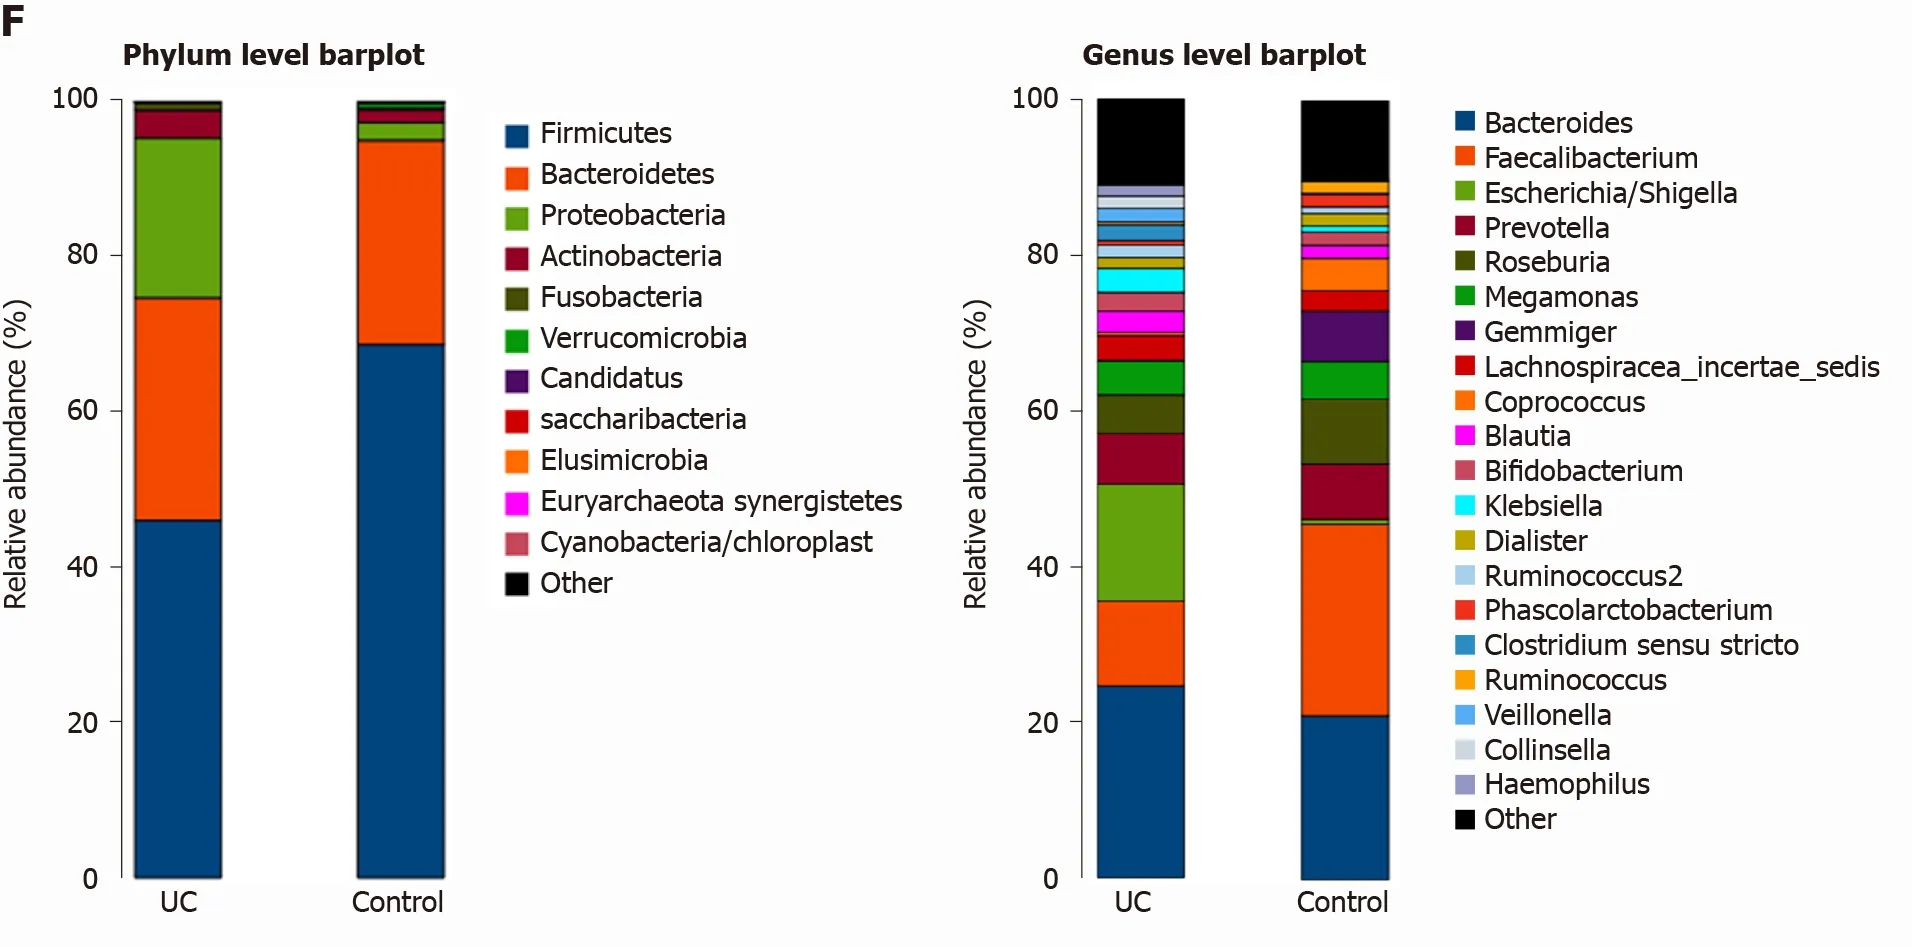
Figure 1 Structural characteristics of intestinal microbes in the ulcerative colitis and control groups. A: Among the 594 operational taxonomic units (OTUs) detected, a total of 317 OTUs were identified in the two groups, including 86 unique OTUs in the UC group and 191 unique OTUs in the control group.B: The dilution curve analysis based on the Chao1 index for community richness and the Shannon index for community diversity showed that the sequencing volume had covered all the microorganisms in the samples. C: The species accumulation curve shows that the sequencing sample size was sufficient, which reflected most of the microbial information in the sample. D: Principal coordinate analysis clearly differentiated the intestinal flora of the ulcerative colitis (UC) group from the control group. E: Chao community richness index or the Shannon and Simpson community α diversity indexes of the UC group were significantly lower than those of the control group. F: The community compositions of the intestinal microbes in the UC group and the control group were analyzed at the phylum and genus levels. UC:Ulcerative colitis; OTUs: Operational taxonomic units; PCoA: Principal coordinate analysis.
Correlations between fecal BAs and intestinal microbes in all subjects
Correlative assessments were made on the fecal BAs and intestinal microbes(Figure 4 ). The results showed that DCA, LCA, and 12 _ketoLCA were negatively correlated withEnterococcus,Klebsiella,Streptococcus, andLactobacillus. CA, CDCA,TCA, TCDCA, GCA, and GCDCA were positively related withEnterococcus,Klebsiella,S,treptococcus, andLactobacillus.Butyricicoccus,Roseburia,Clostridium IV,Faecalibacterium Ruminococcus,Clostridium XlVb,Coprococcus,andAlistipeswere negatively correlated with the concentrations of CA, CDCA, TCA, TCDCA, GCA, and GCDCA and positively correlated with the concentrations of DCA, LCA, 12 _ketoLCA, GLCA, and GDCA.
Mucosal immunohistochemistry
Representative photomicrographs of the immunoreactivity of TGR5 and VDR in the mucosa of UC patients and HCs are shown in Figure 5 A-D (× 400 magnification). The level of TGR5 in mucosal biopsies was significantly higher in UC patients than in HCs(0 .019 ± 0 .013 vs 0 .006 ± 0 .003 , P=0 .0003 ) (Figure 5 E). VDR expression in colonic mucosal specimens decreased significantly in UC patients (0 .011 ± 0 .007 vs 0 .016 ±0 .004 , P = 0 .033 ) (Figure 5 F).
Serum inflammatory cytokine levels and correlations between fecal BAs and serum inflammatory cytokines
The levels of inflammatory cytokines in the serum of UC patients and HCs were quantified by ELISA. The levels of IL-1 α, IL-1 β, TNF-α, IL-2 , and IL-6 were significantly higher in UC patients (P< 0 .0001 ) (Figure 6 A-E). TCA, GCA, and GCDCA were positively correlated with IL-1 α (P < 0 .05 ); TCA and TNF-α were positively correlated (P <0 .05 ); LCA, DCA, 12 -KetoLCA, TLCA, GDCA, and 6 -Keto-LCA were negatively correlated with the levels of IL-1 α, IL-1 β, TNF-α, and IL-6 (P < 0 .01 )(Figure 6 F and G).
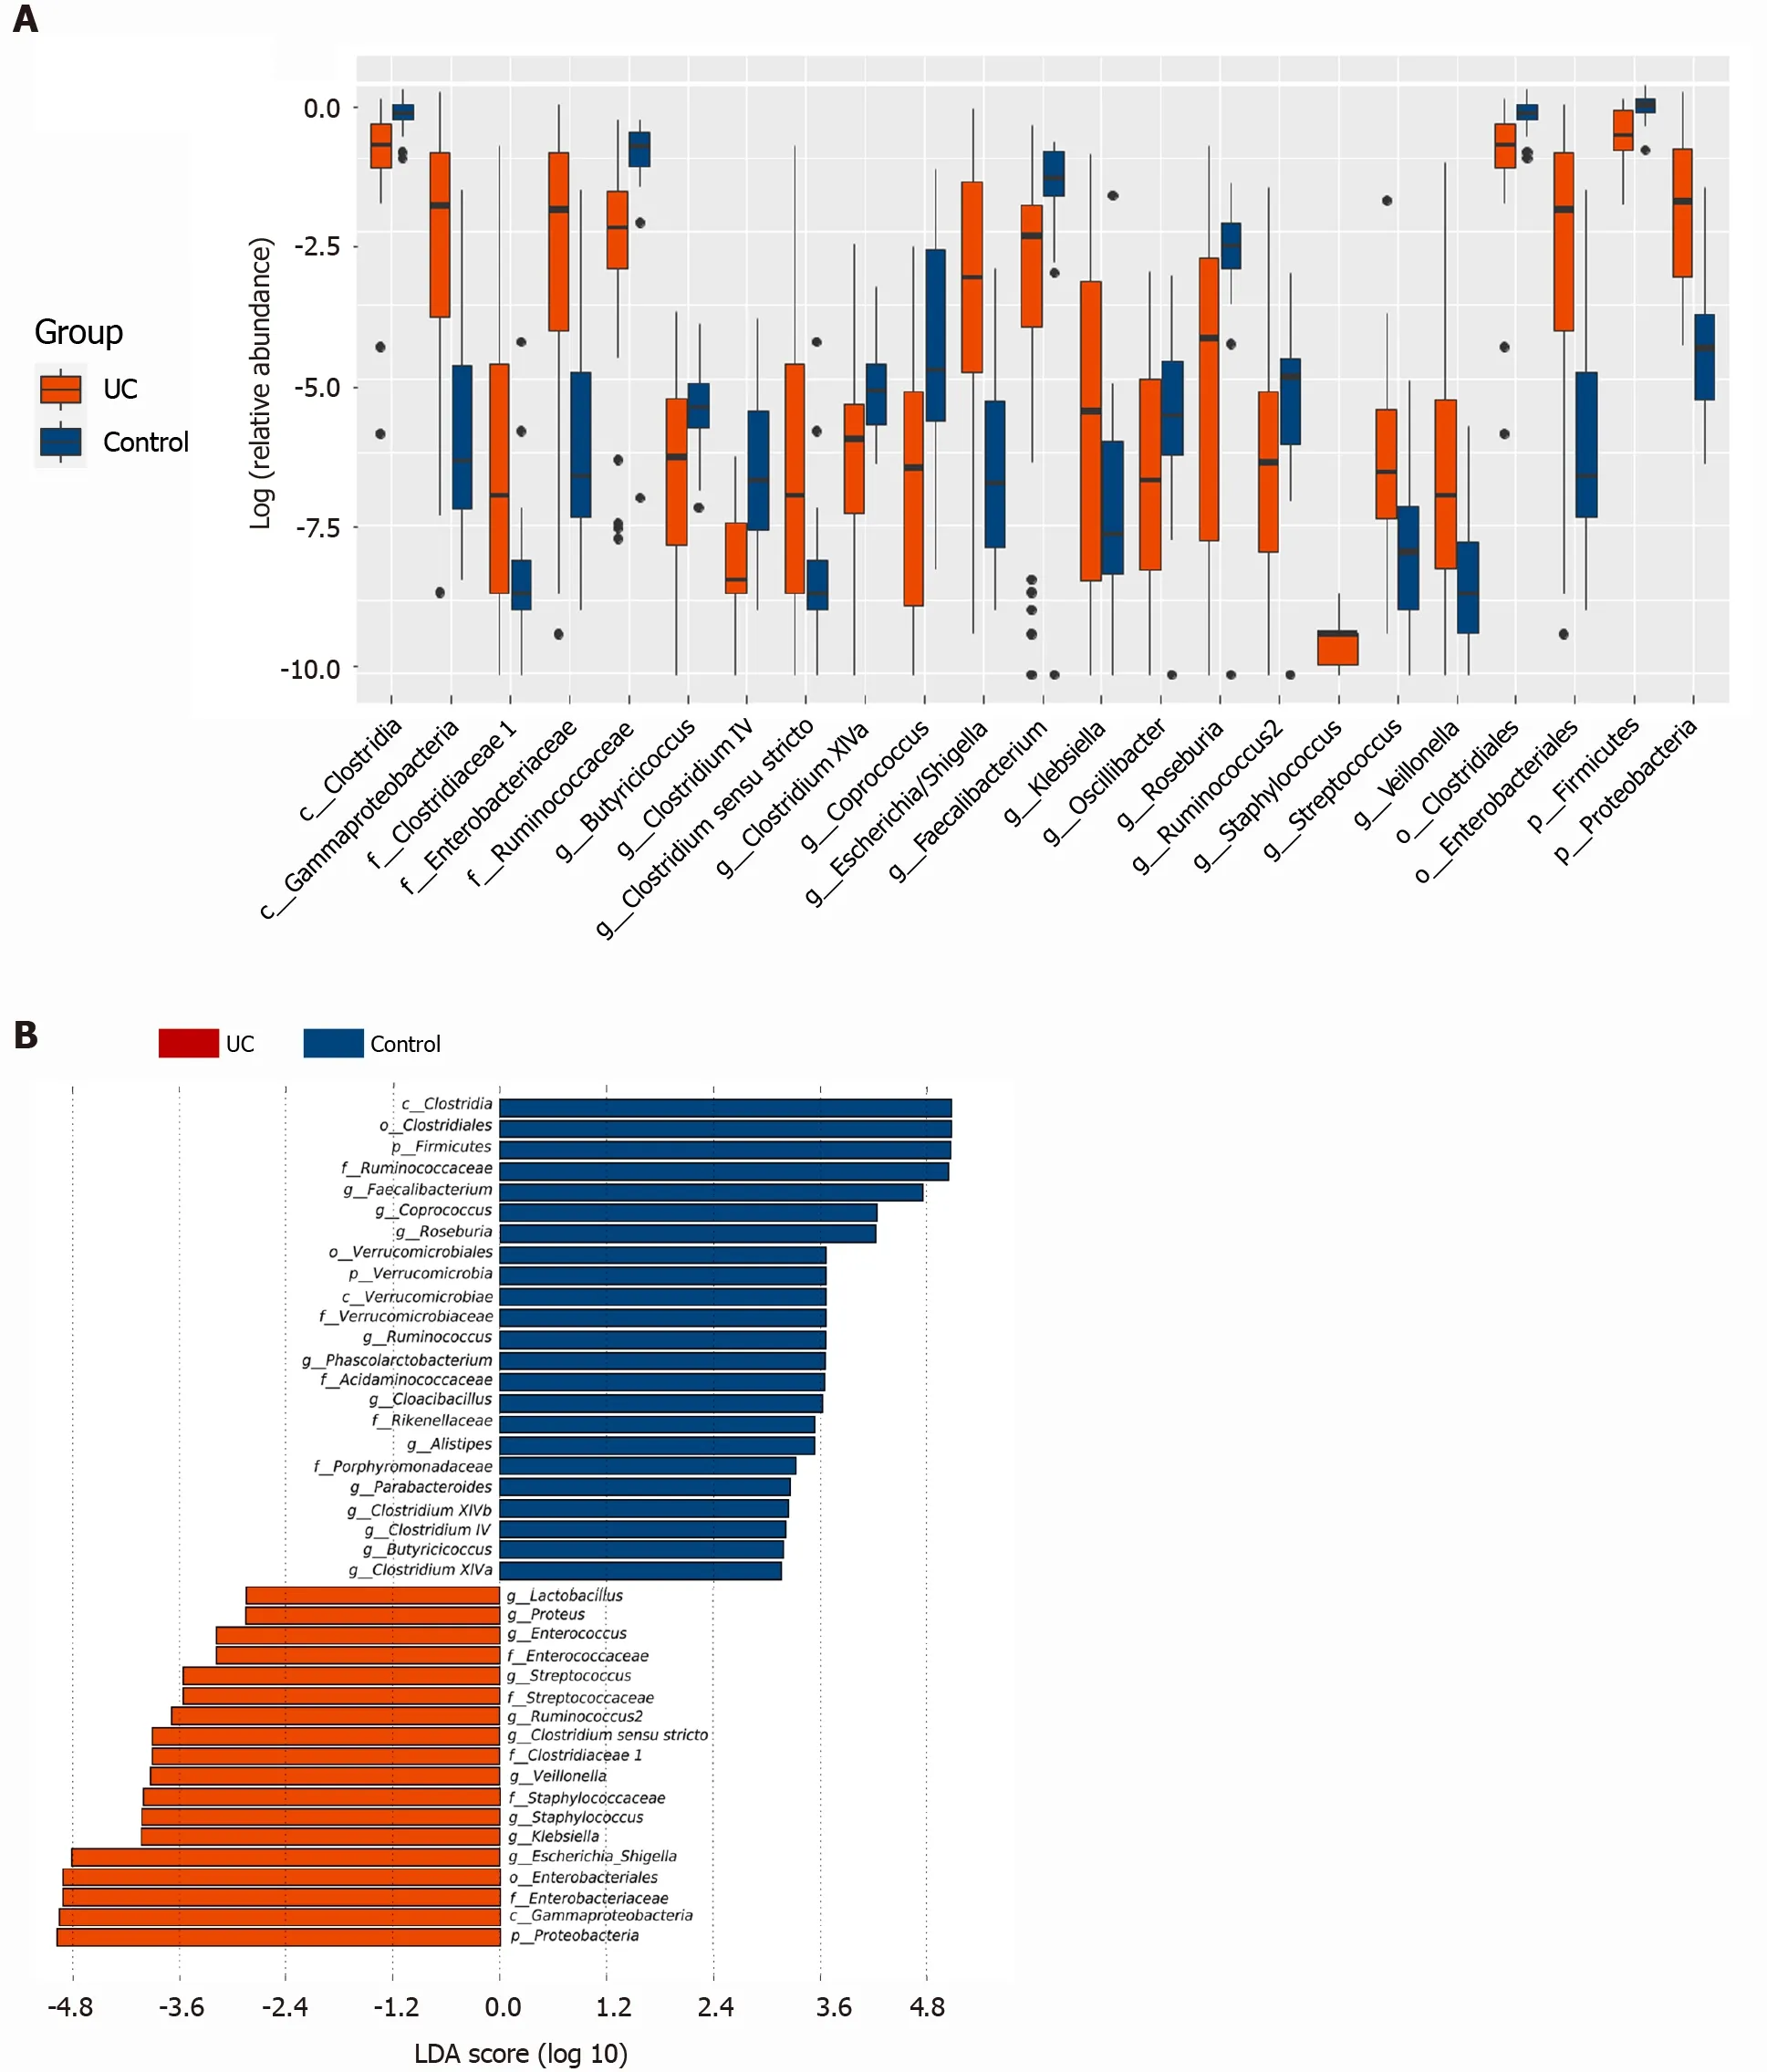
Figure 2 Screening of different key microorganisms between the ulcerative colitis and control groups. A: The Wilcoxon rank sum test of differential species between the two groups showed significant changes in the intestinal microbes between the ulcerative colitis and control groups; B: LEfSe analysis identified (threshold 2 ) the differential intestinal microbial communities between the two groups. UC: Ulcerative colitis; LDA: Linear discriminant analysis.
DISCUSSION
This study comprehensively investigated the changes in fecal BA profiles and analyzed the associations of BAs with the gut microbiota and inflammation in patients with UC. As expected, these data confirmed the differences in fecal BA compositions between UC patients and HCs, and the concentrations of some BAs were significantly correlated with the gut microbiota and serum inflammatory cytokines. Specifically, the concentrations of fecal secondary BAs such as LCA, DCA, GDCA, GLCA, and TLCA in UC patients were significantly lower than those in HCs and were positively correlated withButyricicoccus, Roseburia, Clostridium IV, Faecalibacterium,andClostridium XlVb. The concentrations of primary BAs such as TCA, CA, TCDCA, and GCDCA in UC patients were significantly higher than those in HCs and positively correlated withEnterococcus, Klebsiella, Streptococcus, Lactobacillus, and proinflammatory cytokines. The mucosal expression of the BA membrane receptor TGR5 was significantly elevated in UC patients. Additionally, BA nuclear receptor VDR expression in colonic mucosal specimens was significantly decreased in UC patients.Based on these findings, we concluded that dysregulation of the gut microbiota and altered constitution of fecal BAs may participate in regulating inflammatory responsesviathe BA receptors TGR5 and VDR.
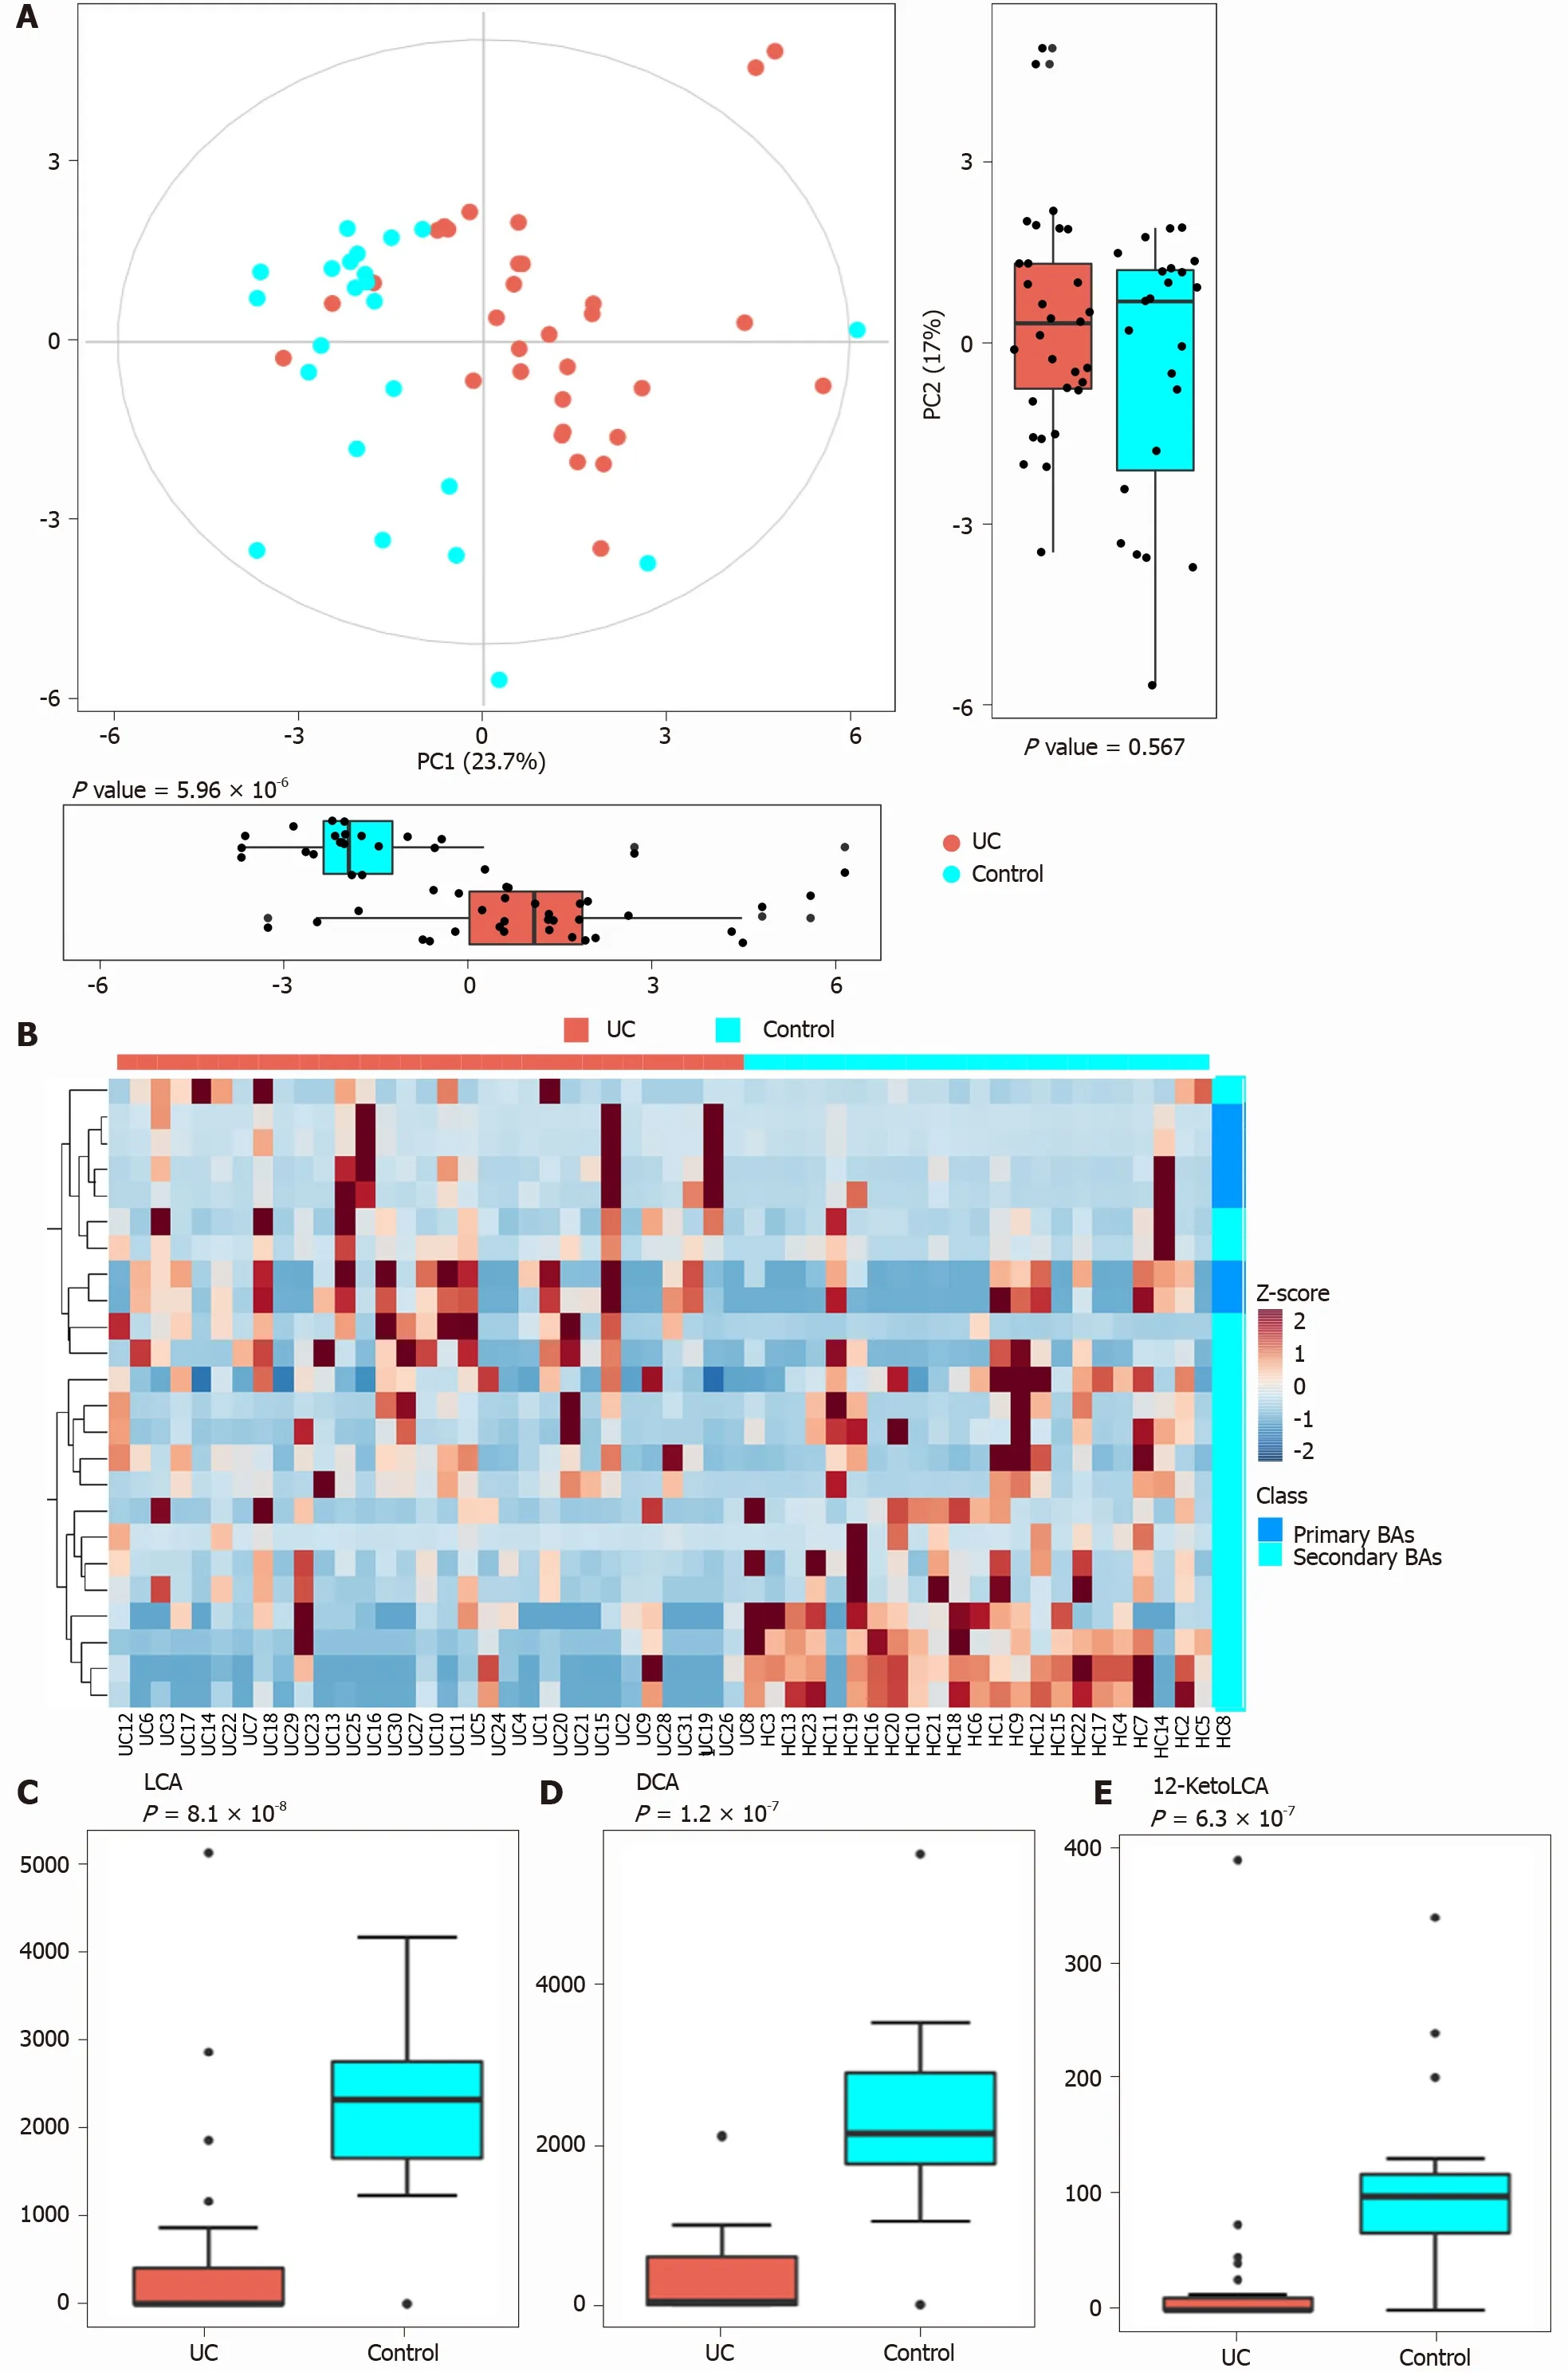
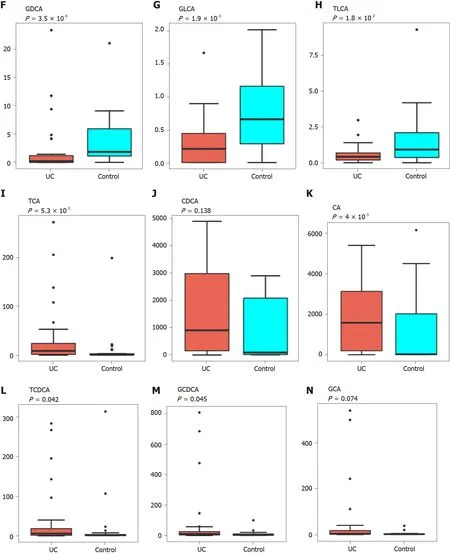
Figure 3 Analysis of difference in fecal bile acids between the ulcerative colitis and control groups. A: Principal component analysis was performed to evaluate the similarity of the fecal BAs of the two groups. Twenty-four BAs clearly distinguished the ulcerative colitis (UC) group from the control group;B: Heatmap showing the individual BA concentrations in the samples (log-transformed). Shades of red and blue represent high and low BA concentrations,respectively (see color scale); C-H: Fecal secondary BAs in UC patients, such as lithocholic acid, deoxycholic acid, glyco-deoxycholic acid, glyco-lithocholic acid, and tauro-lithocholate, were significantly lower than those in healthy controls; I and K-M: The primary BAs such as tauro-cholic acid, cholic acid, tauro-chenodeoxycholic acid, and glyco-chenodeoxycholic acid were significantly higher than those in healthy controls; J and N: The concentrations of chenodeoxycholic acid and glyco-cholic acid showed a tendency to increase in UC patients but the increases were not significant. UC: Ulcerative colitis; PCA: Principal component analysis; BAs: Bile acids;LCA: Lithocholic acid; DCA: Deoxycholic acid; GDCA: Glyco-deoxycholic acid; GLCA: Glyco-lithocholic acid; TLCA: Tauro-lithocholate; TCA: Tauro-cholic acid; CA:Cholic acid; TCDCA: Tauro-chenodeoxycholic acid; GCDCA: Glyco-chenodeoxycholic acid; CDCA: Chenodeoxycholic acid; GCA: Glyco-cholic acid.
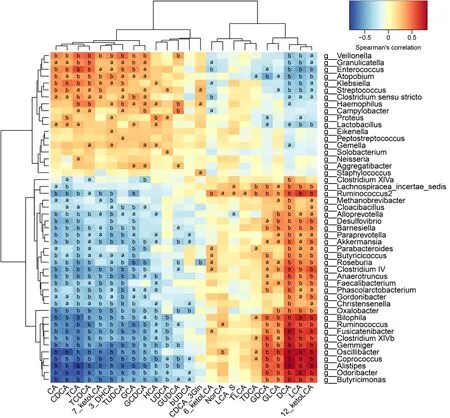
Figure 4 Correlations between fecal bile acids and intestinal microbes. A heatmap of correlative assessments was made on the fecal bile acid metabolites and intestinal microbes (aP < 0 .05 , bP < 0 .01 ). LCA: Lithocholic acid; DCA: Deoxycholic acid; GDCA: Glyco-deoxycholic acid; GLCA: Glyco-lithocholic acid; TLCA: Tauro-lithocholate; TDCA: Tauro-deoxycholic acid; UDCA: Ursodeoxycholic acid; TUDCA: Tauro-ursodeoxycholic acid; GUDCA: Glyco-ursodeoxycholic acid; TCA: Tauro-cholic acid; CA: Cholic acid; TCDCA: Tauro-chenodeoxycholic acid; GCDCA: Glyco-chenodeoxycholic acid; CDCA: Chenodeoxycholic acid; GCA:Glyco-cholic acid.
For demographics, 32 UC patients (17 males and 15 females; median age 37 .0 years,IQR: 32 .00 -49 .75 ) were enrolled in this study. Similar to previous studies, no sex predominance existed in UC, and the peak age of disease onset was between ages 30 years and 40 years[37 ]. In order to prevent initiation of medical treatment from changing the composition of the intestinal flora of UC patients, we collected stool samples as soon as possible within 1 d of UC patients' visit to ensure that the clinical symptoms were significant at the study entry. Except for five patients who took mesalazine for a short period of time, the remaining active (relapse) patients included in our study did not receive any treatment before collecting stool and serum samples.Although the time of active disease is not specified, the Mayo score of disease activity of the enrolled patients was required to be 4 -12 .
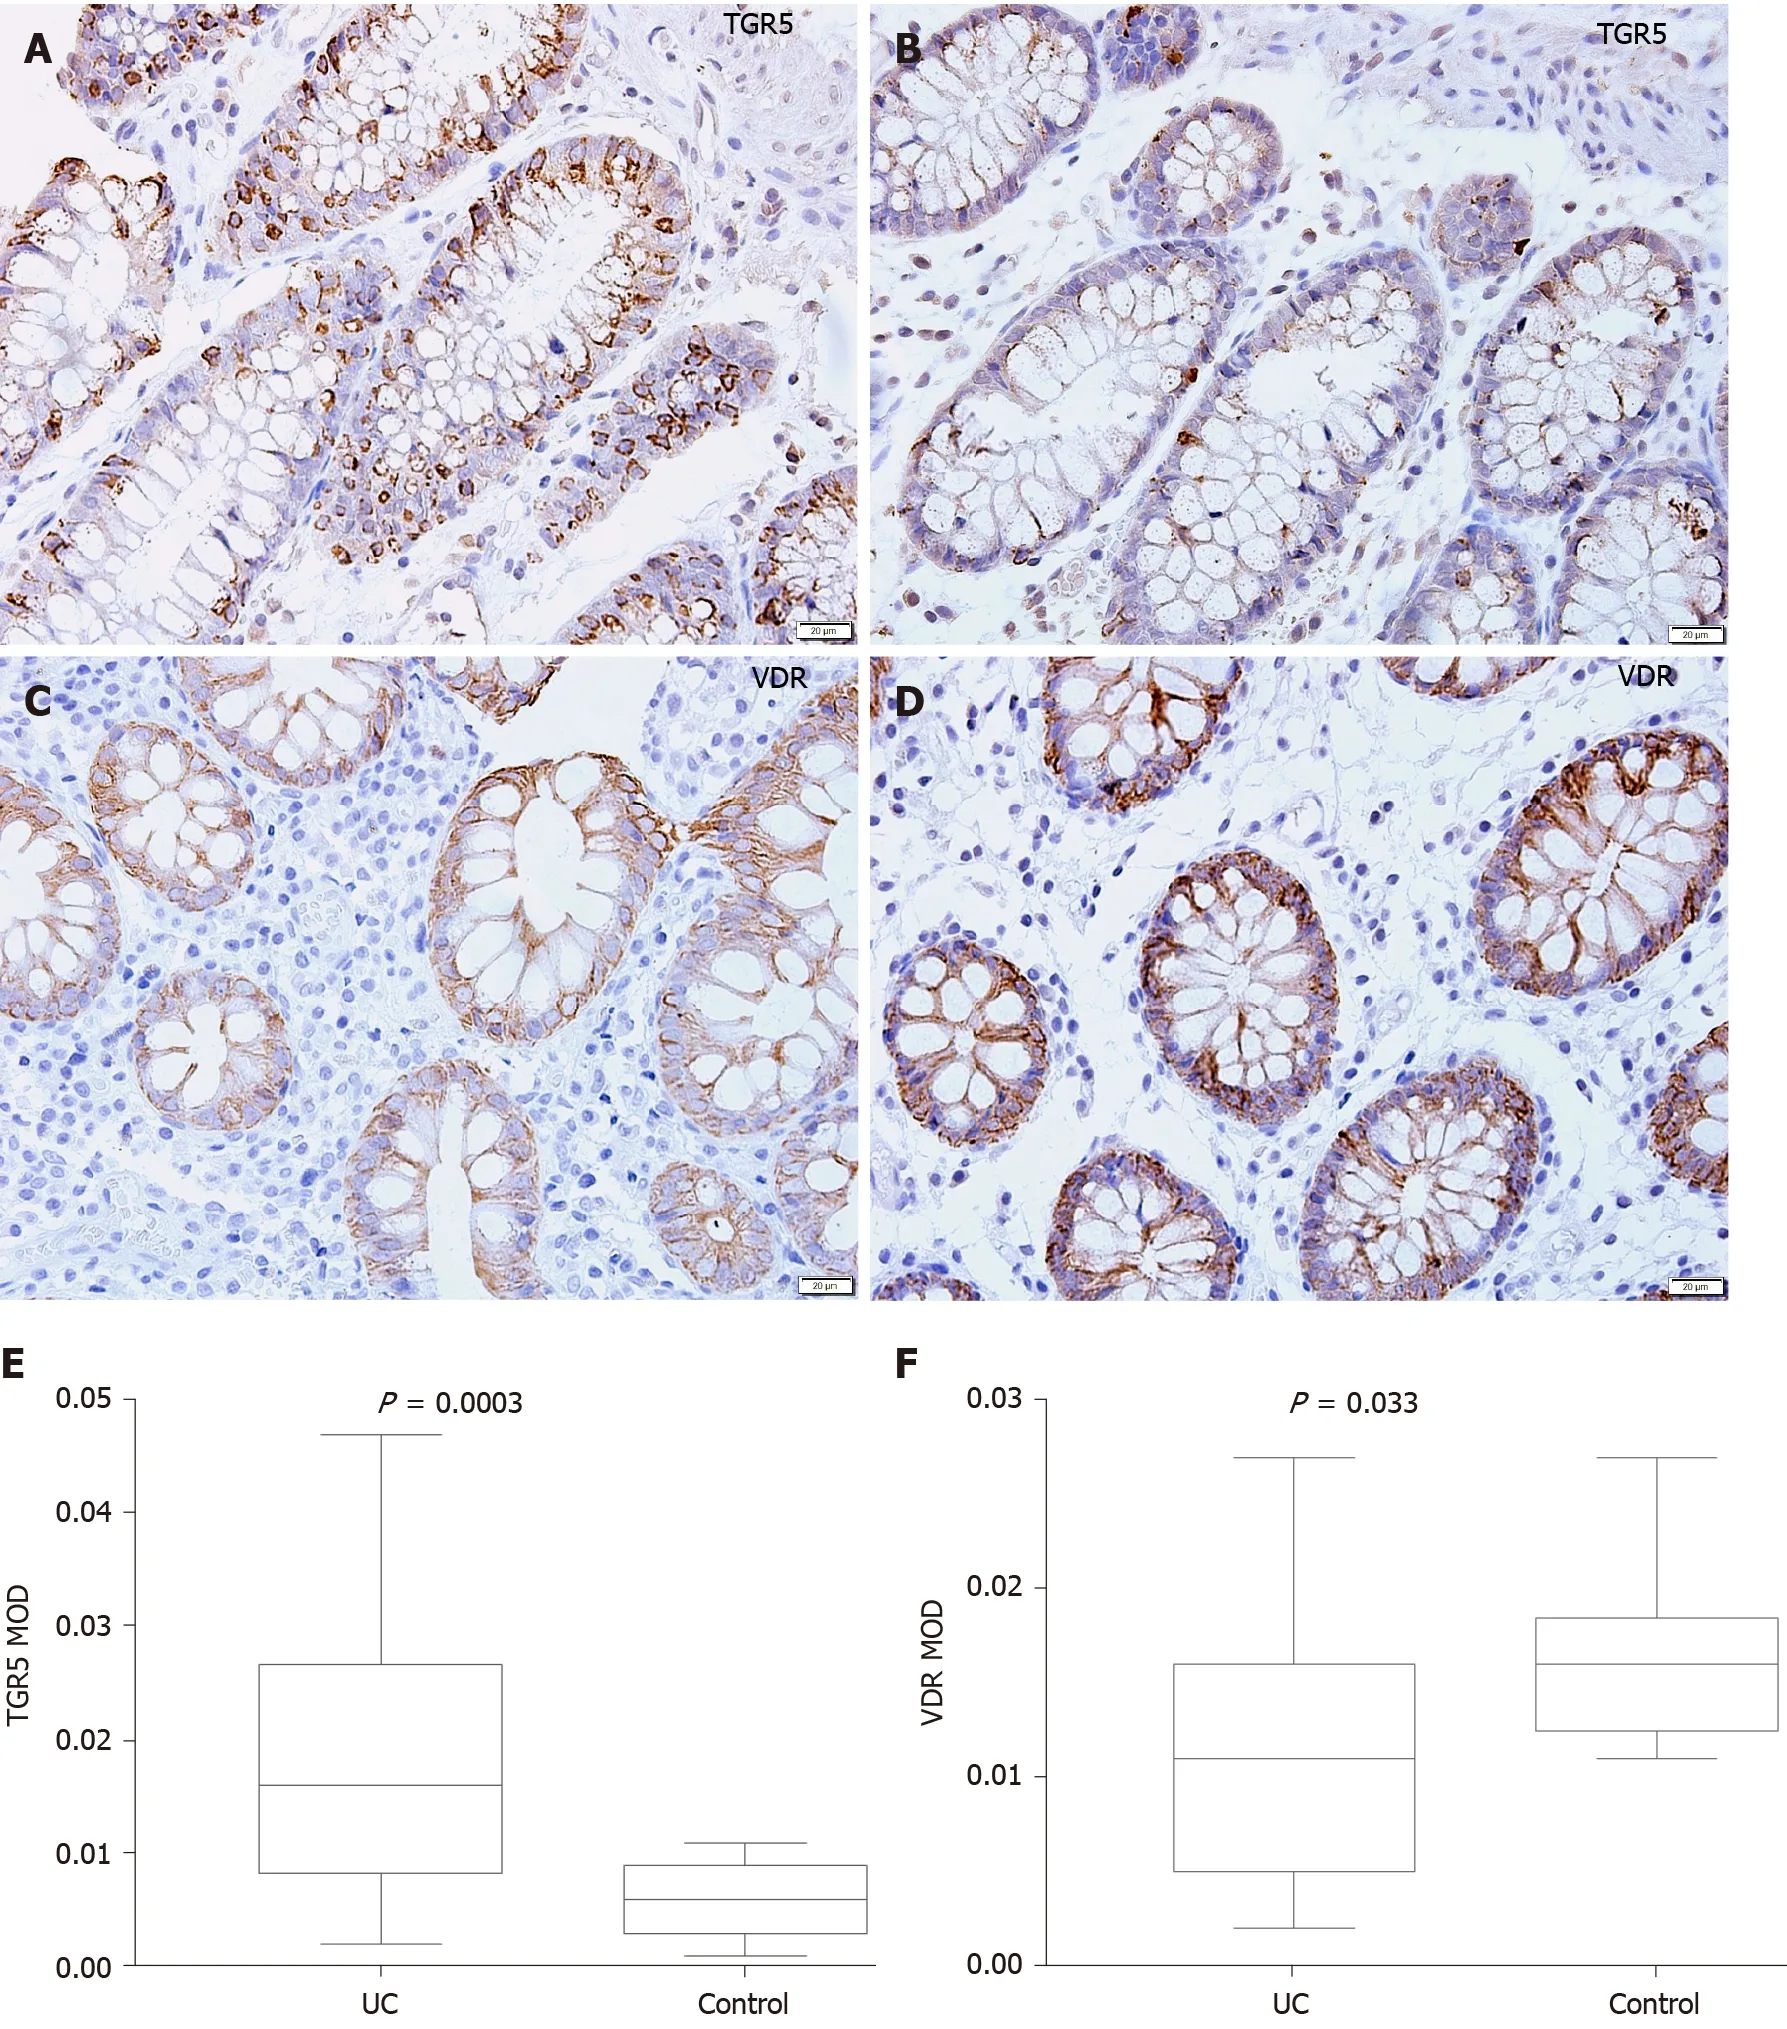
Figure 5 Mucosal immunohistochemistry in patients with ulcerative colitis and healthy controls. A and B: Takeda G protein-coupled receptor 5 (TGR5 ) immunoreactivity was mainly scattered in the epithelium in ulcerative colitis (UC) patients (scale bar = 20 μm); C and D: Vitamin D receptor (VDR)immunoreactivity was distributed in the epithelium and lamina propria in UC patients and healthy controls (Scale bar = 20 μm); E: The mean optical density of TGR5 in the colonic mucosa in UC patients was significantly higher than that in healthy controls (P = 0 .0003 ); F: The mean optical density of VDR in the colonic mucosa decreased significantly in patients (P = 0 .033 ). UC: Ulcerative colitis; TGR5 : Takeda G protein-coupled receptor 5 ; VDR: Vitamin D receptor; MOD: Mean optical density.
Gut microbes were demonstrated to be an essential factor in intestinal inflammation in UC. It has been consistently shown that there is a decrease in biodiversity and species richness in UC[38 ]. Changes in the composition of the gut microbiota led to metabolite alterations that are likely to have a role in UC pathogenesis[39 ]. The intestinal microbiota converts ingested food or host products into metabolites that target either the intestinal microbial population or host cells. Hence, the presence of metabolites depends on microbial metabolic activity[40 ,41 ]. It is estimated that more than 50 % of metabolites found in fecal matter and urine are derived from or modified by the intestinal microbiota[42 ]. It is particularly noteworthy that the intestinal flora has an important influence on the composition of BA metabolites. The BAs in feces are mainly secondary BAs but also contain a small amount of primary BAs, trace conjugated BAs, and ursodeoxycholic acid (UDCA)[43 ]. The conversion of conjugated BAs to free BAs depends on the bile salt hydrolase that exists in the intestinal flora[44 ], which has been identified inBacteroides fragilis, Clostridium, Lactobacillus,andBifidobacterium. Thus, we infer that the imbalance of the intestinal flora affects the deconjugation of BAs, leading to an increase in the concentration of conjugated BAs. In agreement with these studies, we found that the concentrations of conjugated BAs such as TCA, TCDCA, and GCDCA in UC patients were significantly higher than those in HCs and negatively related toClostridium IV,Faecalibacterium,Ruminococcus,andClostridium XlVb.
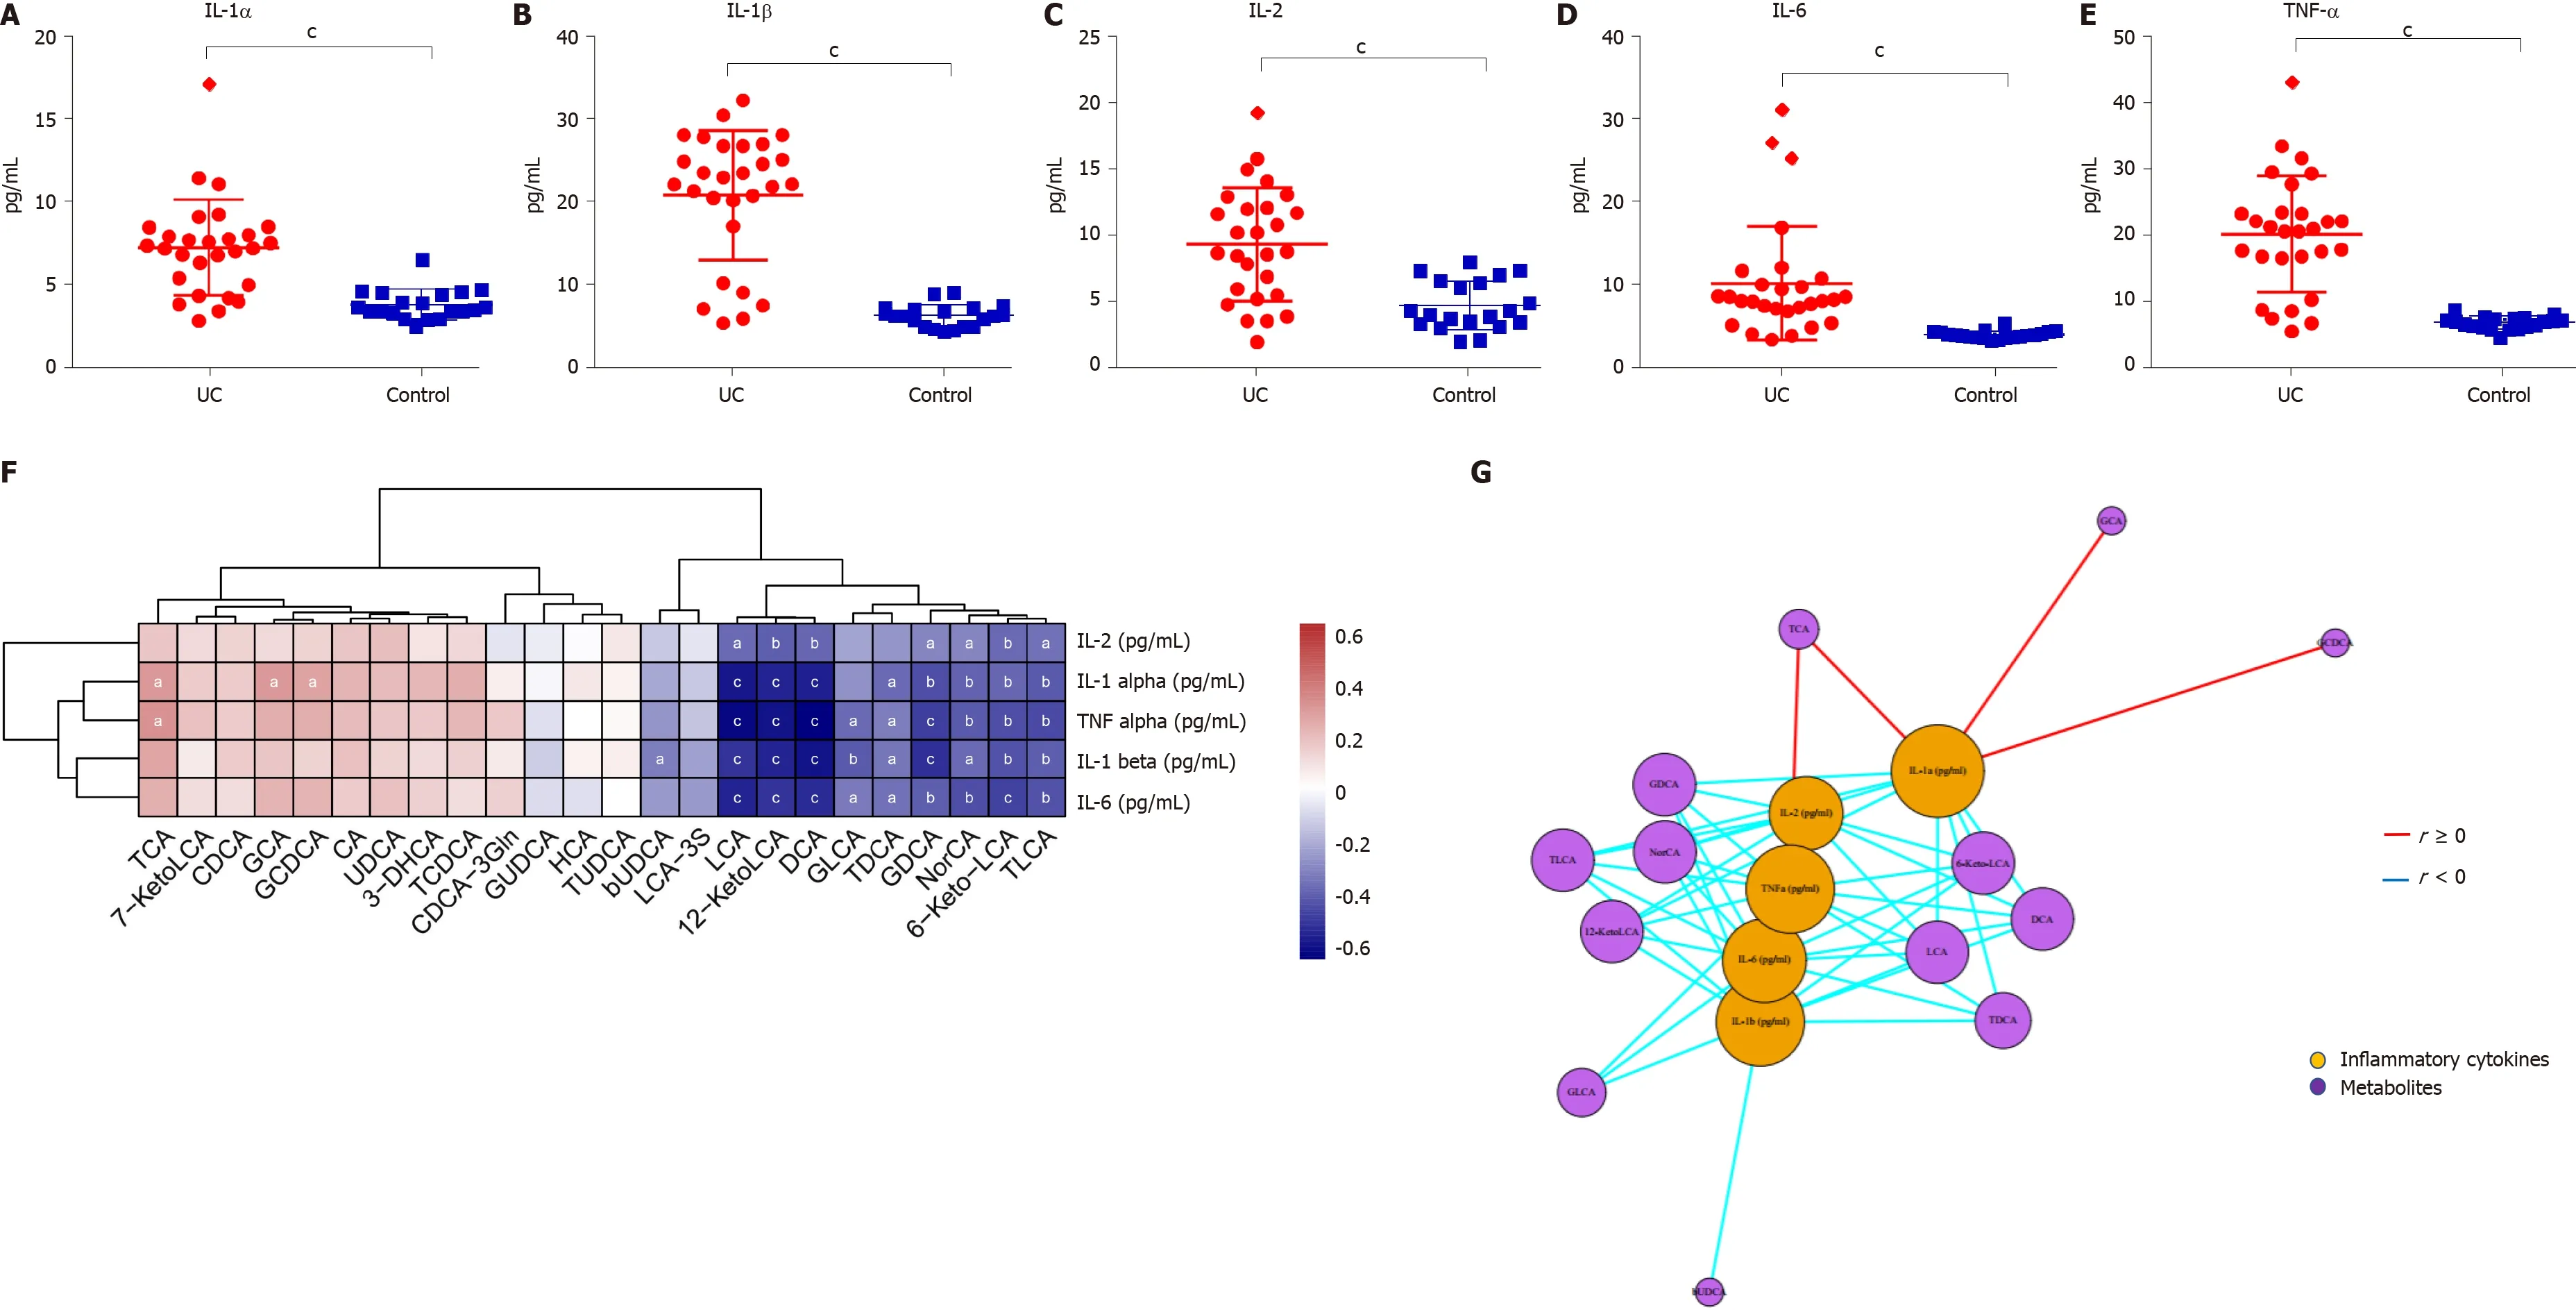
Figure 6 Serum inflammatory cytokine levels and correlations between fecal bile acids and serum inflammatory cytokines in all subjects. A-E: The levels of IL-1 α, IL-1 β, TNF-α, IL-2 , and IL-6 were significantly higher in UC patients (P < 0 .0001 ); F: A heatmap of correlative assessments was made of the fecal bile acids and serum inflammatory cytokines ( aP < 0 .05 , bP < 0 .01 , cP < 0 .001 ); G: A network diagram of correlative assessments was made on the fecal bile acid metabolites and serum inflammatory cytokines (purple nodes represent bile acid metabolites and orange nodes represent inflammatory cytokines; red lines represent positive correlations and blue lines represent negative correlations). aP < 0 .05 , bP < 0 .01 ,cP < 0 .001 . LCA: Lithocholic acid; DCA: Deoxycholic acid; GDCA: Glyco-deoxycholic acid; GLCA: Glyco-lithocholic acid; TLCA: Tauro-lithocholate; TDCA: Tauro-deoxycholic acid; UDCA: Ursodeoxycholic acid; TUDCA: Tauro-ursodeoxycholic acid;GUDCA: Glyco-ursodeoxycholic acid; TCA: Tauro-cholic acid; CA: Cholic acid; TCDCA: Tauro-chenodeoxycholic acid; GCDCA: Glyco-chenodeoxycholic acid; CDCA: Chenodeoxycholic acid; GCA: Glyco-cholic acid.
A sequence of enzymatic reactions in the liver converts cholesterol to primary BAs in humans. The intestinal microbiota converts primary BAs to secondary BAs by various reactions, including deconjugation, dehydroxylation, esterification, and desulfatation[29 ,45 -47 ]. Dehydroxylation only occurs after deconjugation and is catalyzed by the Firmicutes phylum,includingClostridiumandEubacterium.Desulfatation driven by BA sulfatase is catalyzed byClostridium,Peptococcus,Fusobacterium, andPseudomonas[47 ,48 ]. Therefore, dysregulation of gut microbiota impairs the deconjugation, dehydroxylation, and desulfatation of BAs. As a result,patients with UC have increased secondary BAs and decreased primary BAs. In accordance with these studies, we also found that the concentrations of fecal secondary BAs such as LCA, DCA, GDCA, GLCA, and TLCA in UC patients were significantly lower than those in HCs and were positively correlated with
Butyricicoccus,Roseburia,Clostridium IV,Faecalibacterium, andClostridium XlVb.
Moreover, we demonstrated that altered constitution of fecal BAs may participate in regulating inflammatory responsesviaBA receptors. TGR5 is a BA reactive receptor expressed in various cell types and is widely distributed throughout the gastrointestinal tract[49 ]. Different types of BAs have different agonistic effects on TGR5 : LCA > DCA > CDCA > UDCA > CA[50 ]. TGR5 also plays a role in inflammation, energy balance, and insulin signaling[51 ]. Studies have shown that TGR5 negatively regulates liver inflammation in mice by antagonizing NF-κB signaling.Compared with WT mice, mice withTGR5gene deficiency have significantly higher levels of serum inflammation markers after induction with LPS, but treating WT mice with TGR5 agonists can reduce inflammatory responses[52 ]. Nevertheless, TGR5 is increased in experimental colitis, and the mRNA expression ofTGR5is upregulated in patients with Crohn’s disease[53 ,54 ]. The anti-inflammatory properties of TGR5 indicate that TGR5 activation may be beneficial to IBD, which might be a compensatory mechanism to counterbalance the vicious cycle of inflammation in IBD.
In addition, this study found that BA metabolites can regulate the immune response in a VDR-dependent fashion. The nuclear receptor VDR is highly expressed in the small intestine and colon and is an essential regulator of intestinal cell proliferation,barrier function, and immunity[55 ,56 ]. Evidence strongly supports a protective effect of VDR in UC, and the underlying mechanism may be that VDR can ameliorate intestinal inflammation by downregulating NF-κB signaling and activating autophagy[57 ,58 ]. In experimental models of colitis,Vdrwhole-body knockout mice are known to develop severe colitis[59 ]. The secondary BA LCA, as a VDR ligand that is produced byClostridiumbacteria in the gut lumen, controls Th1 immune responses and suppresses the production of the Th1 cytokines IFNγ and TNFα by activating VDR[60 ].Vdrknockout mice have lowerClostridiumin the gut, illustrating the influence of crosstalk between the microbiome and VDR signaling in immunity[61 ]. Consistent with previous studies[62 ], the current study showed that the low expression of VDR in the intestine of patients with UC may be related to the imbalance of the flora and the decrease of secondary BAs such as DCA and LCA.
There were several limitations in this study. First, due to limited time and conditions, the sample size was relatively small in this study, and subgroup analysis of the microbiota composition and BA profiles with different disease activities and stages of UC patients has not been performed yet. Previous studies have shown that there are differences in the intestinal flora of UC patients during active and remission periods[63 ,64 ]. Longitudinal analyses revealed reduced temporal microbiota stability in UC,particularly in patients with changes in disease activity[65 ,66 ]. As the number of subjects increases, we will collect stool samples from a large population of patients with UC at different time points during periods of active and remission disease and rank the contribution of variables to microbiota composition and BA profiles. Second,our conclusions are based on observational research, and such cross-sectional studies do not provide information about the timing of dysbiosis relative to disease onset and,therefore, should be interpreted with caution particularly with regards to cause-effect relationships[39 ]. We will later conduct intervention studies and animal experiments to verify their relationship. Third, considering that the short-term modification of a diet can rapidly disturb the gut microbiota[67 ], all subjects were required to maintain their daily dietary habits before the collection of the stool samples. However, dietary constituents have been shown to affect the inflammatory status, in great part mediated through the modulation of the microbiota[68 ,69 ], so it is better to supply a standardized diet for subjects. The standardized diet minimizes diet-induced deviations in the gut microbiota and BA metabolites, but masks the gut microbiota under usual dietary habits. Therefore, the measures of gut microbiota and BAs before and after a standardized diet combined with a detailed assessment of the usual dietary habits of patients are necessary for a future study. Finally, since the nuclear FXR is mostly distributed in hepatocytes, the small intestine, and macrophages[50 ], this study did not detect the expression of FXR in the colonic mucosa.
CONCLUSION
In conclusion, this study provides new evidence that fecal BAs are closely related to the gut microbiota and serum inflammatory cytokines. Dysregulation of the gut microbiota and altered constitution of fecal BAs may participate in regulating inflammatory responsesviathe BA receptors TGR5 and VDR. This study provides a preliminary exploration for possible involvement of the gut microbiota and BA metabolites in the inflammatory responses of UC in humans.
ARTICLE HIGHLIGHTS
Research conclusions
Fecal BAs are closely related to the gut microbiota and serum inflammatory cytokines.Dysregulation of the gut microbiota and altered constitution of fecal BAs may participate in regulating inflammatory responsesviathe BA receptors TGR5 and VDR.These findings not only contribute to the understanding of the role of the gut microbiota and metabolites in UC pathogenesis but also offer a valuable reference for future research and more effective therapies.
Research perspectives
This preliminary study investigated the changes in the fecal BA metabolite profile and analyzed the relationship between metabolites, the gut microbiota, and inflammation in patients with UC. In the future, we will focus on the following aspects. First, due to limited time and conditions, the sample size was relatively small, which may impact the reliability of the conclusion. Second, we cannot draw causal inferences in this cross-sectional study. Therefore, conclusions need to be further verified by welldesigned large-sample clinical studies and basic studies. Third, diet was not standardized during the study period. It is necessary to standardize diet in future studies to avoid the influence of diet on the intestinal flora and metabolites.
ACKNOWLEDGEMENTS
We thank Dr. Du SY and Dr. Liu F for enrollment of participants.
 World Journal of Gastroenterology2021年24期
- World Journal of Gastroenterology的其它文章
- COVID-19 and its effects on the digestive system
- Weight loss interventions in living donor liver transplantation as a tool in expanding the donor pool: A systematic review and meta-analysis
- Disorders of the brain-gut interaction and eating disorders
- Stem cell injection for complex anal fistula in Crohn’s disease: A single-center experience
- Chronic intestinal failure and short bowel syndrome in Crohn’s disease
- Early genetic diagnosis of clarithromycin resistance in Helicobacter pylori