
A method to model the effect of pre-existing cracks on P-wave velocity in rocks
2020-07-12 12:35:02HaimengShenXiayingLiQiLiHaibinWang
Haimeng Shen, Xiaying Li, Qi Li,*, Haibin Wang
a State Key Laboratory of Geomechanics and Geotechnical Engineering,Institute of Rock and Soil Mechanics,Chinese Academy of Sciences, Wuhan,430071,China
b University of Chinese Academy of Sciences, Beijing,100049, China
Abstract Crack closure is one of the reasons inducing changes of P-wave velocity of rocks under compression. In this context, a method is proposed to investigate the relationships among P-wave velocity, pre-existing cracks, and confining pressure based on the discrete element method (DEM). Pre-existing open cracks inside the rocks are generated by the initial gap of the flat-joint model. The validity of the method is evaluated by comparing the P-wave velocity tested on a sandstone specimen with numerical result. As the crack size is determined by the diameter of particles, the effects of three factors, i.e. number, aspect ratio, and orientation of cracks on the P-wave velocity are discussed. The results show that P-wave velocity is controlled by the(i.e.number)of open micro-cracks,while the closure pressure is determined by the aspect ratio of crack.The reason accounting for the anisotropy of P-wave velocity is the difference in crack number in measurement paths. Both of the number and aspect ratio of cracks can affect the responses of P-wave velocity to the applied confining pressure. Under confining pressure, the number of open cracks inside rocks will dominate the lowest P-wave velocity, and the P-wave velocity of the rock containing narrower cracks is more sensitive to the confining pressure. In this sense, crack density is difficult to be back-calculated merely by P-wave velocity.The proposed method offers a means to analyze the effect of pre-existing cracks on P-wave velocity.
2019 Institute of Rock and Soil Mechanics, Chinese Academy of Sciences. Production and hosting by Elsevier B.V. This is an open access article under the CC BY-NC-ND license (http://creativecommons.org/licenses/by-nc-nd/4.0/).
Keywords:Pre-existing cracks P-wave velocity Discrete element method (DEM)Anisotropic rock
1. Introduction
It is acknowledged that the mechanical behaviors of rocks are affected by their microstructures,which are usually associated with the distribution and amount of voids (Peck et al., 1985; Yu et al.,2016; Peng et al., 2018). Based on the difference in void shapes,the voids in a rock can be generally divided into spherical pores and flat cracks. Many studies show that deformation of narrow flat cracks is much more sensitive to external forces than that of spherical pores (Bruner, 1976; Budiansky and O’Connell, 1976).Narrow flat cracks can significantly affect the elastic properties of rocks (Budiansky and O’Connell,1976). These cracks can be regarded as the defects of materials,i.e.the more the cracks in a rock,the weaker the mechanical properties of the rock.Besides,the presence of aligned cracks is one of the reasons accounting for rock anisotropy (Sayers, 2013; Kataoka et al., 2015; Levasseur et al.,2015), and thus the closure of cracks is regarded as the main cause for changes in rock anisotropy (Zhubayev et al., 2016).Additionally,failure planes of stressed rocks are correlated with the orientation and distribution of cracks (Petruzalek et al., 2019).Therefore,understanding the above information of cracks(such as crack number and orientation)inside rocks is helpful for predicting the mechanical behaviors of rock. However, it is rather difficult to directly obtain the information of cracks inside a rock in the laboratory, as well as the crack evolution process under loading.
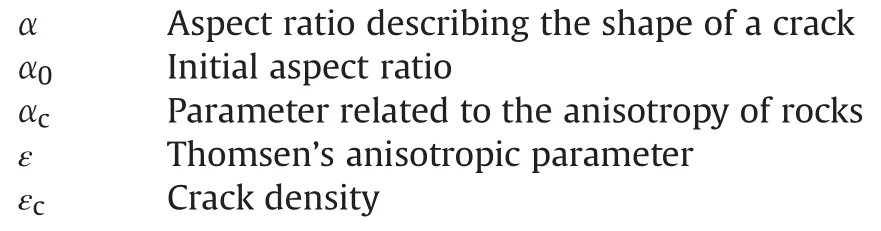
Measuring seismic wave velocity of a rock under different stresses is regarded as a useful technique for investigating the behaviors of cracks (Wang and Simmons,1978; Kataoka et al., 2015).For this, a series of poroelastic wave theories has been proposed(e.g. Biot,1956,1962). Based on these theories, the wave propagation theory of rocks is developed subsequently (O’Connell and Budiansky,1974; Tang, 2011). Crack density is a parameter significantly affecting seismic wave velocities (Tang et al., 2013; Sarout et al., 2017; Ding et al., 2018). Hadley (1976) analyzed crack densities and seismic wave velocities in Westerly granite with new crack geometry measurements and provided additional constraints necessary for calculating the wave velocities.Ding et al.(2017)used synthetic rocks to study P-wave velocity and rock anisotropy at differing crack densities. The crack density, εc, is generally defined as the ratio of the total crack volume to the rock volume(Hudson,1981; Ding et al., 2017):

whereNis the number of cracks,Vcis the volume of a single crack,andVris the rock volume.The shape of cracks is generally assumed to be penny-shaped, and each crack in the rock is hypothesized to have the same shape and size. Thus the crack volume can be calculated as
where a is the aspect ratio describing the shape of a crack,andais the radius of the crack.As shown in Eqs.(1)and(2),when the crack size is determined,the crack density can be calculated by both the aspect ratio and number of cracks.However,these two parameters are rather difficult to be directly measured in laboratory. The question is how the aspect ratio and number of cracks affect the seismic wave velocity.
With quick development of computing technology, numerical simulation has become a promising technique for scientific research.The discrete element method(DEM)was firstly proposed by Cundall and Strack(1979)to study the mechanical behaviors of rocks(Hazzard et al.2002;Sch?pfer et al.2009;Zhang et al.2019),and now it is one of the widely used numerical methods. Later,many researchers focused on the effect of cracks on the mechanical behaviors of rocks (Sch?pfer et al., 2009; Estay and Chiang, 2013;Wong and Zhang, 2014). Also, seismic waves are also introduced into DEM to analyze some cases in geotechnical engineering.Zhao and Crosta (2018) analyzed the dynamic failure of Tangjiashan landslide based on DEM model with recorded seismic waves.Zhao et al.(2018)used DEM to investigate the dynamic fragmentation of jointed rock blocks during rockslide-avalanches. Specifically, the internal force wave transmission is used to analyze the failure mechanism. Several researchers studied the seismic wave velocity of rocks based on DEM.For example,Toomey and Bean(2000)used a discrete particle scheme to simulate wave propagation in a rock,and the results are accurate compared with a high-order finite difference solution to the wave equation. Hazzard and Young(2004) investigated the relationships between stress and P-wave velocity based on DEM.Their results showed that P-wave velocity is mainly affected by cracks and coordination numbers, but the increase in P-wave velocity in models is much smaller than that in the laboratory under a high hydrostatic stress. Holt et al. (2005)numerically studied the stress-dependent P- and S-wave using the Hertzian contact law in DEM model,and the numerical results match the laboratory results. However, the above-mentioned studies barely address the issue of microstructures in rocks. In particular, the pre-existing open cracks are not taken into consideration, resulting in large differences between numerical and experimental results. Recently, Ji et al. (2018) presented a new method to include pre-existing open cracks in rocks,and succeeded in simulating the closure stage of cracks in axial compression tests.However,this modeling method used a linear parallel bond model,which may be not suitable for characterizing the relationship between confining pressure and seismic wave velocity. Hazzard and Young (2004) pointed out that when a bond is broken, the particleeparticle contacts act only at a point whereas the bond acts over some finite area. The stiffness effect of the particleeparticle contacts may not be the same as that in the parallel bonds, thus the effective modulus of the contact should be modified.That is the reason that the change of wave velocity obtained numerically is different from that in rocks under confining pressure. Potyondy(2015) suggested that it is possible to simulate the closure stage of cracks in uniaxial tests by modifying the initial microstructure.
In this context,a method is proposed to analyze the relationship among the pre-existing open cracks,confining pressure and P-wave velocity. Section 2 introduces how pre-existing open cracks are added to the numerical model. Next, the model is verified in comparison with experimental P-wave velocity in Section 3. The effects of three parameters(number,aspect ratio and orientation of cracks) on the evolution of P-wave velocity with confining pressures are presented in Section 4. Finally, the relationship of crack density and P-wave velocity is discussed in Section 5.
2. Methodology
2.1. Contact model
Particles and rigid walls are the basic elements in the DEM.Spherical balls and planes usually represent particles and walls in a three-dimensional (3D) model, and discs and lines in a twodimensional (2D) model. Rock specimen is generally assumed to be a collection of particles bonded by contacts. The Newton’s second law and the force-displacement law are the basic theories adopted in the DEM.The Newton’s second law states that particles can rotate,translate,and change their positions under the action of a force.When the particle position changes,the contact force can be updated based on the force-displacement law. Particle flow code(PFC) is one of platforms of the DEM developed by Itasca (2014).Holt et al.(2005)suggested that the diameter of a particle needs to be less than one tenth of the wavelength for reducing the energy dispersion caused by high frequencies. However, the number of particles is linked to computational efficiency,especially in the 3D model. Some researchers (e.g. Toomey and Bean, 2000; Thomas et al., 2009) used DEM to simulate wave propagation in granular materials based on 2D model.Toomey and Bean(2000)proved the accuracy of this method in simulating elastic wave propagation in rocks in comparison with the wave equation. Thus, to analyze the effect of cracks on P-wave velocity and consider computing efficiency, adoption of 2D model is desirable. In this work, a 2D numerical model is generated using the code of PFC2D.
The contact model defines the interactions of adjacent particles under forces,and it determines the accuracy of DEM modeling. To understand the effect of natural cracks on P-wave propagation,selection of contact models should be suitable for simulating not only the rock but also the behavior of crack closure. Three bond contact models are generally used for rock simulation in PFC:linear bond contact model (BCM), linear bond parallel model (BPM), and flat-joint model (FJM) (Potyondy and Cundall, 2004; Potyondy,2012, 2015). The force-displacement behaviors of these models are shown in Fig.1.In BCM,two adjacent particles are cemented by a bond at a point(see Fig.1a).These bonds can only transmit force and are then removed when the contact force exceeds its defined strength. Compared with BCM, BPM is characterized by a finitesized piece of bond (Fig. 1b), which makes the contact force act on a finite area but not at a point. Therefore, the bond can simultaneously transmit not only the force but also the moment. This advantage allows BPM to be used widely in recent years.However,the bonds will also be removed when the contact force exceeds its strength,resulting in contact changing from a finite-sized interface to a point. Therefore, a large difference in contact stiffness will be induced between unbonded and bonded particles in BPM. Since natural cracks have a finite-sized area, BPM is not suitable for simulating cracks, and not for their responses to crack closure either.Compared with BCM and BPM,due to the special structure,FJM is a better choice for simulating the closure of cracks,as shown in Fig.1c. In FJM, each particle consists of a disc and some skirted faces. Each of the skirted faces has a notional surface, and an interface exists between two notional surfaces. Some isolated elements are also set into the interface, and each element may be bonded or unbonded. These elements can transmit force. The interface in FJM can still resist rotation even after breaking(Wu and Xu,2016).In particular,the interface still exists even if the elements are unbonded, making it possible to simulate crack closure.
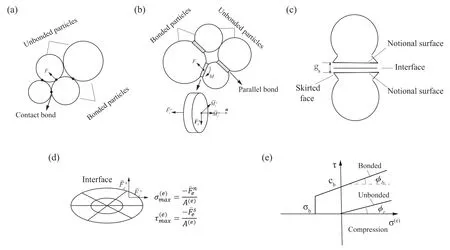
Fig.1. Both the bonded and unbonded particle behaviors of (a) the linear bond contact model, (b) the linear bond parallel model, and (c) the flat-joint model. (d) The stresses of elements; and (e) Strength envelopes of bonded and unbonded elements (modified after Potyondy (2015) and Potyondy and Cundall (2004)).
Fig.1d shows the element normal((e))and shear((e))stresses in a flat-joint contact. For a bonded element, the tensile strength(b)should be specified when the model is generated.Let(e)be the tensile stress((e)>0),and if(e)>b,the element is broken,and the element bond state can be modified to be unbonded.
Also, as shown in Fig. 1e, if the element is compressed (i.e.(e)< 0), the shear strength of bonded element (b) obeys Coulomb’s law:

wherecbandbare the cohesion and local friction angle, respectively; andis the interface normal stress, which is related to the surface gapdenotes the gap between the two notional surfaces.
For an unbonded element,the tensile strength is zero.As shown in Fig. 1e, the shear strength of unbonded element (r) can be calculated using the residual friction angle (r) as

2.2. Adding open cracks in initial specimens
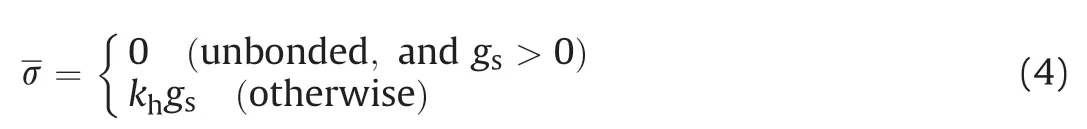
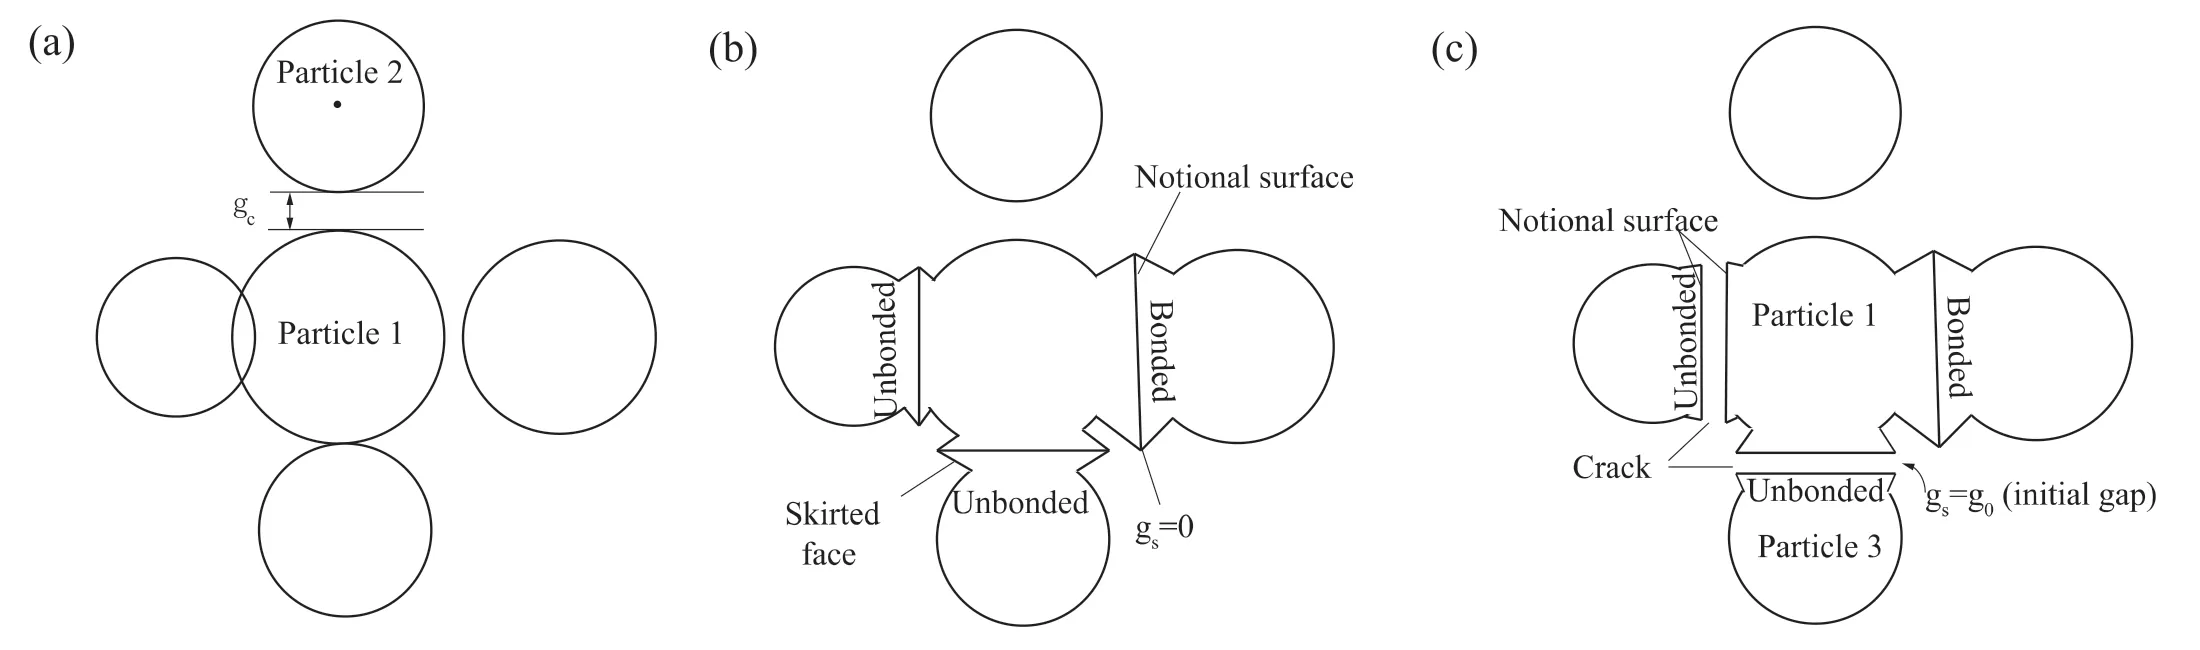
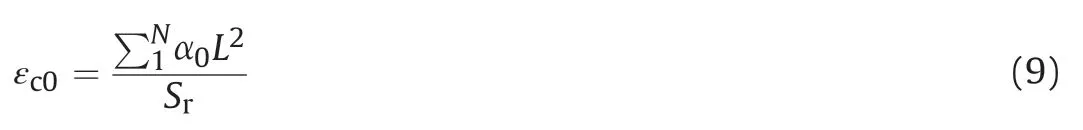
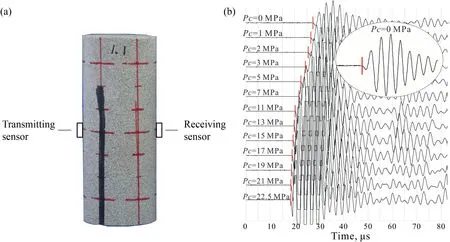
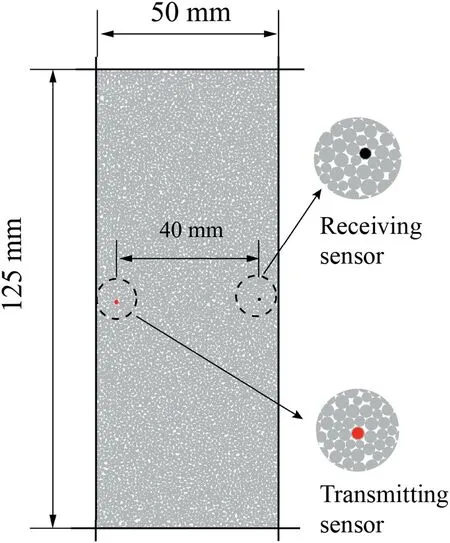
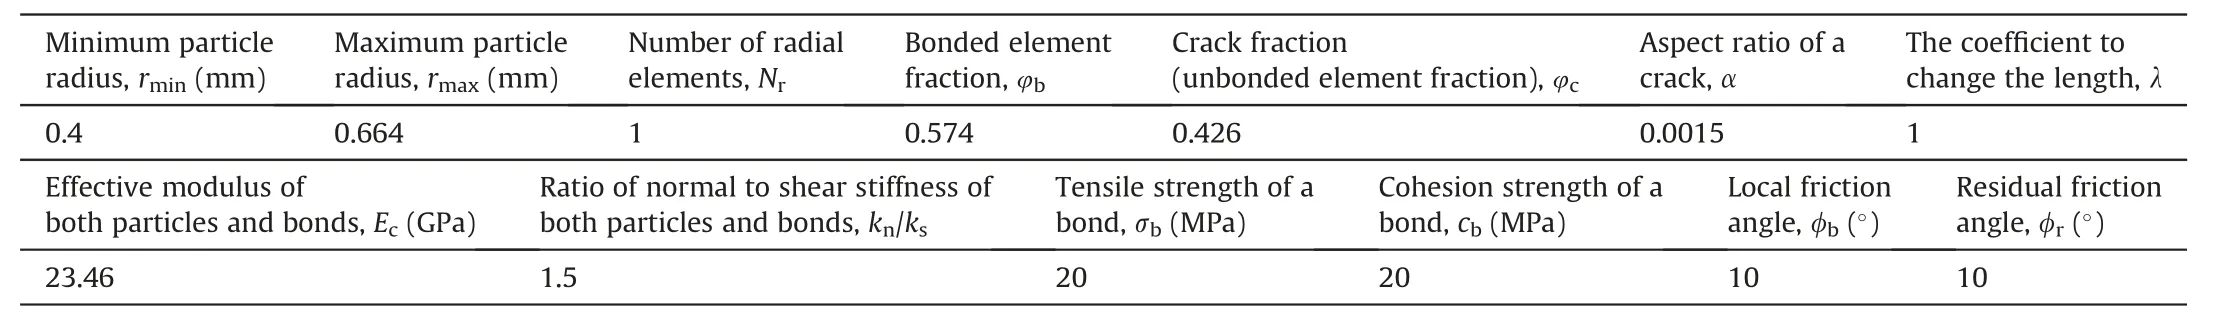
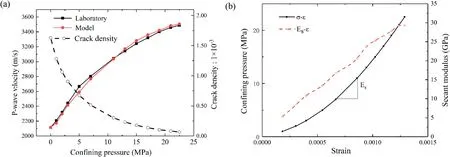
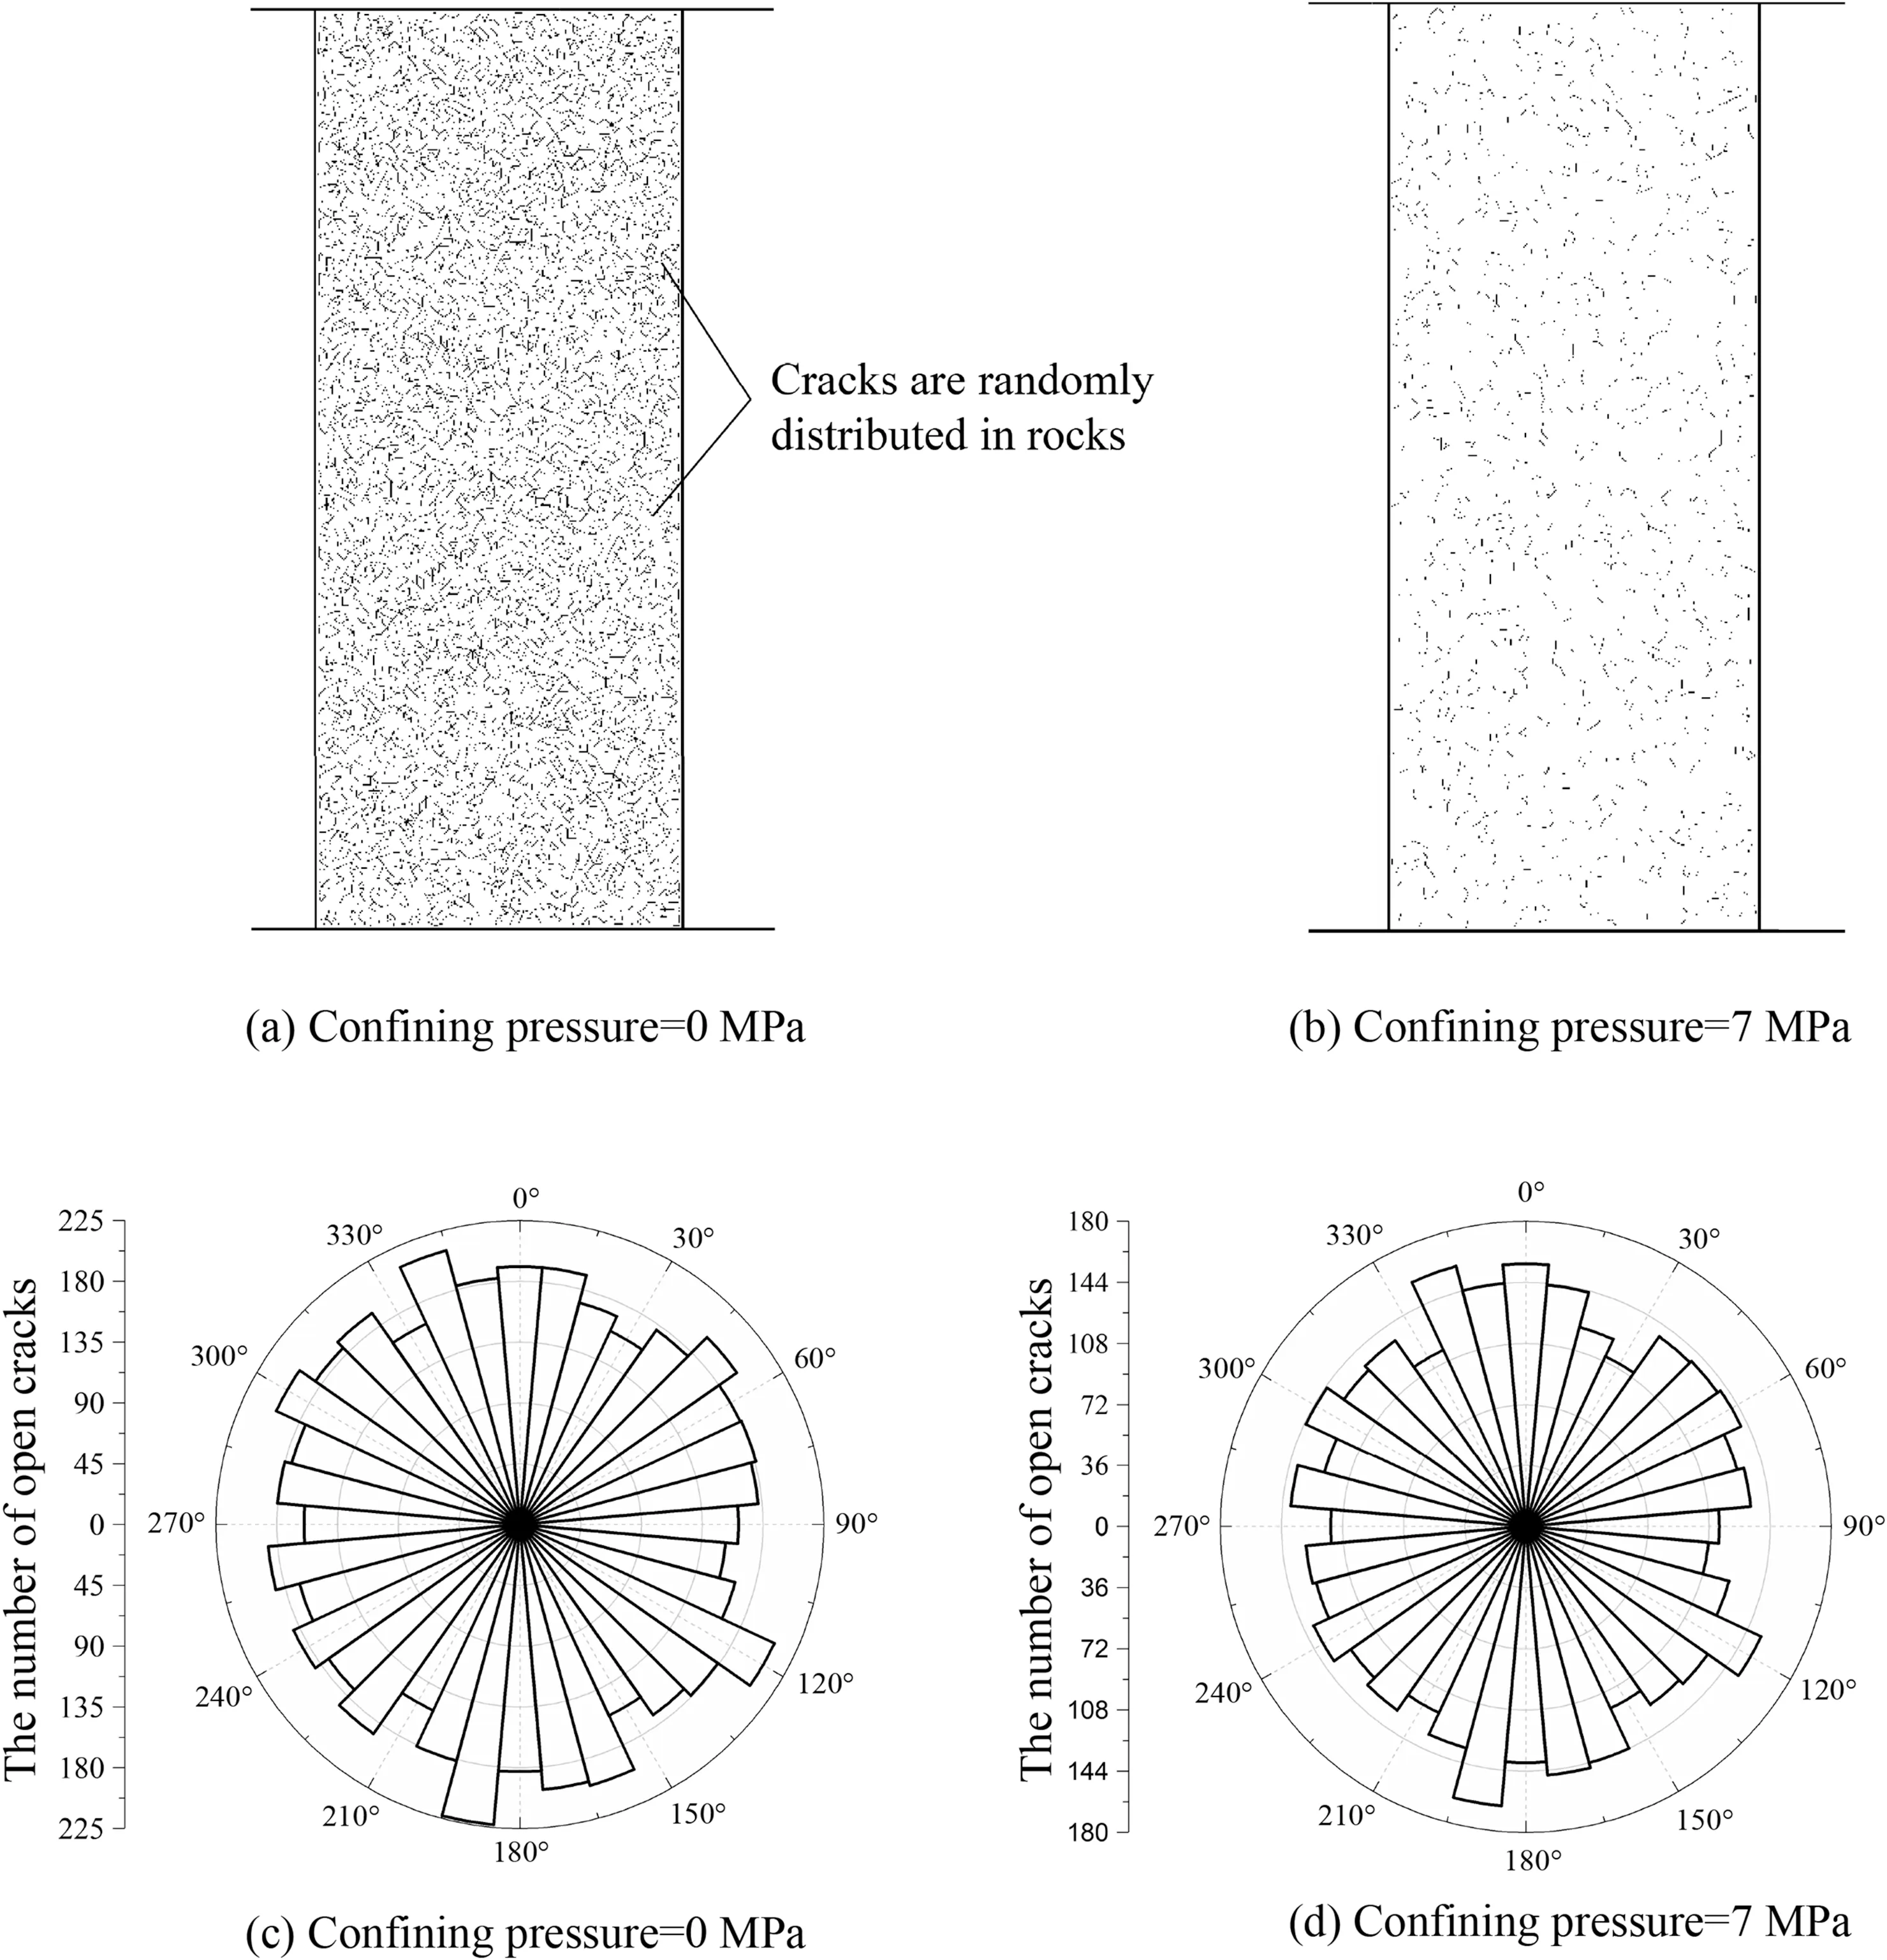
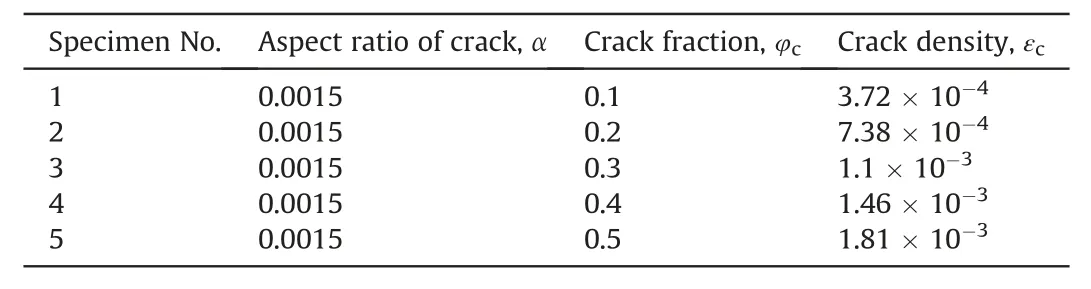
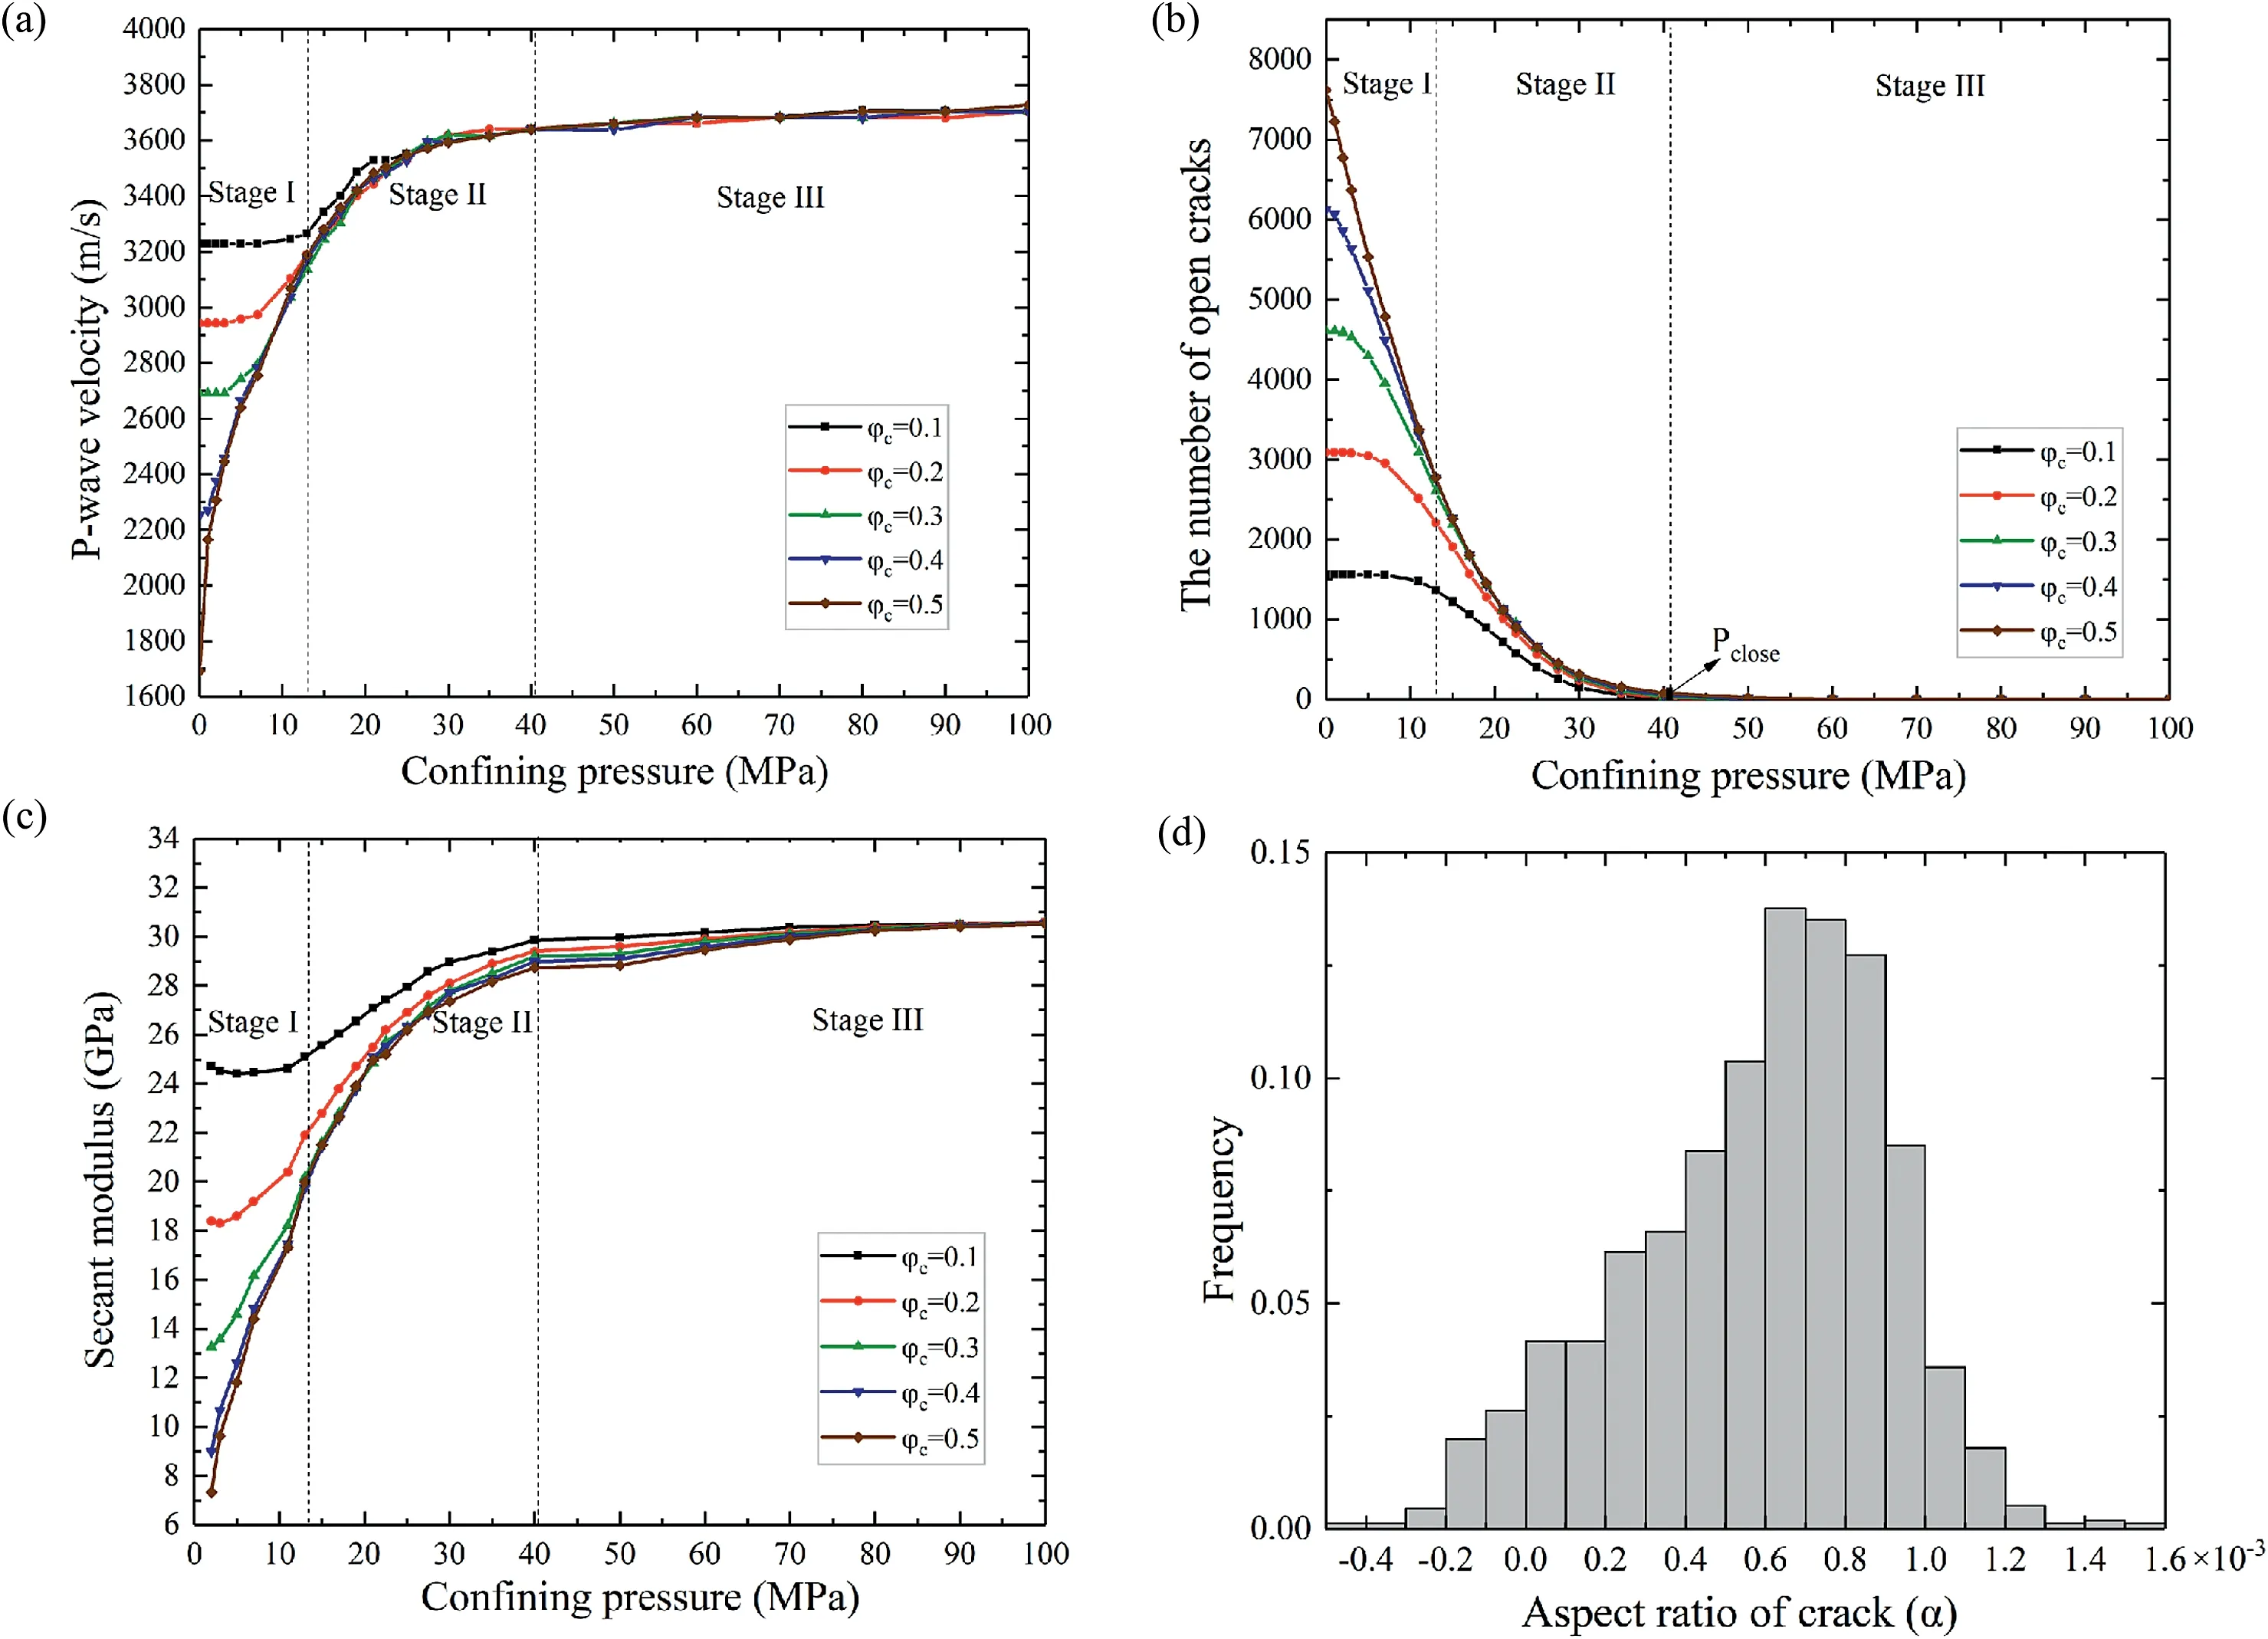
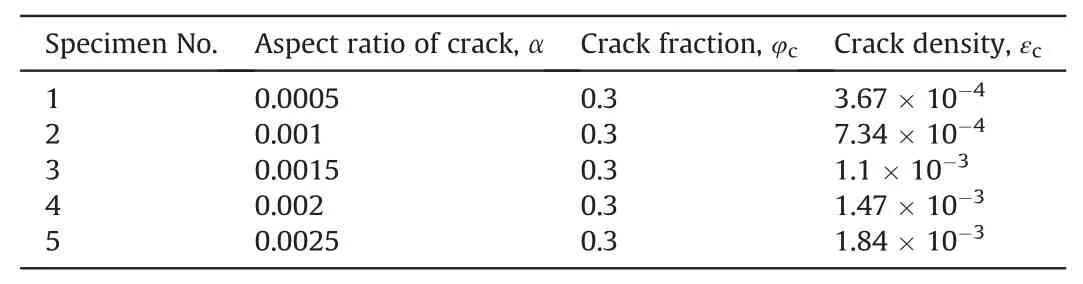
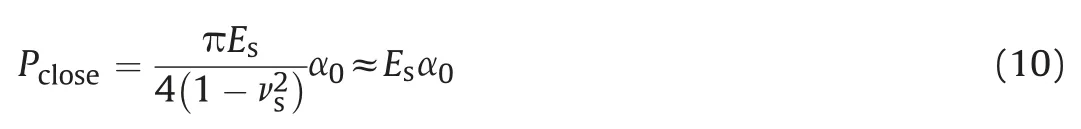
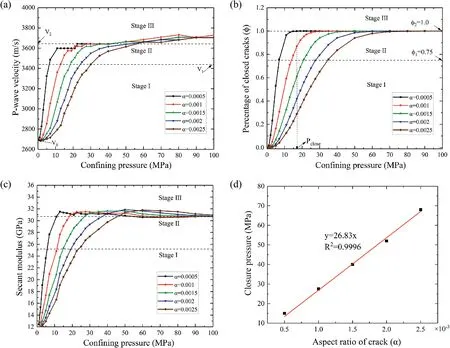
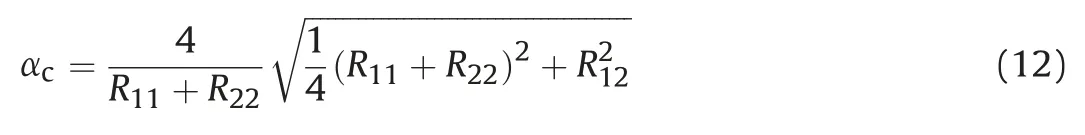
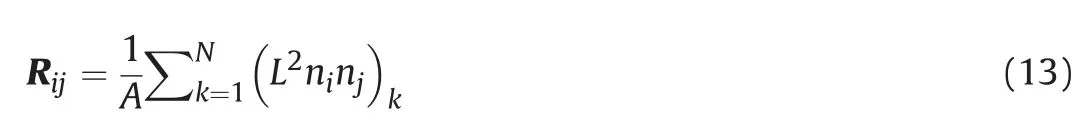
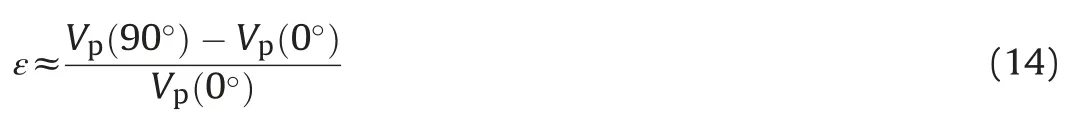
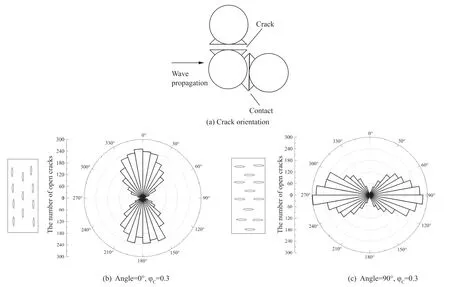
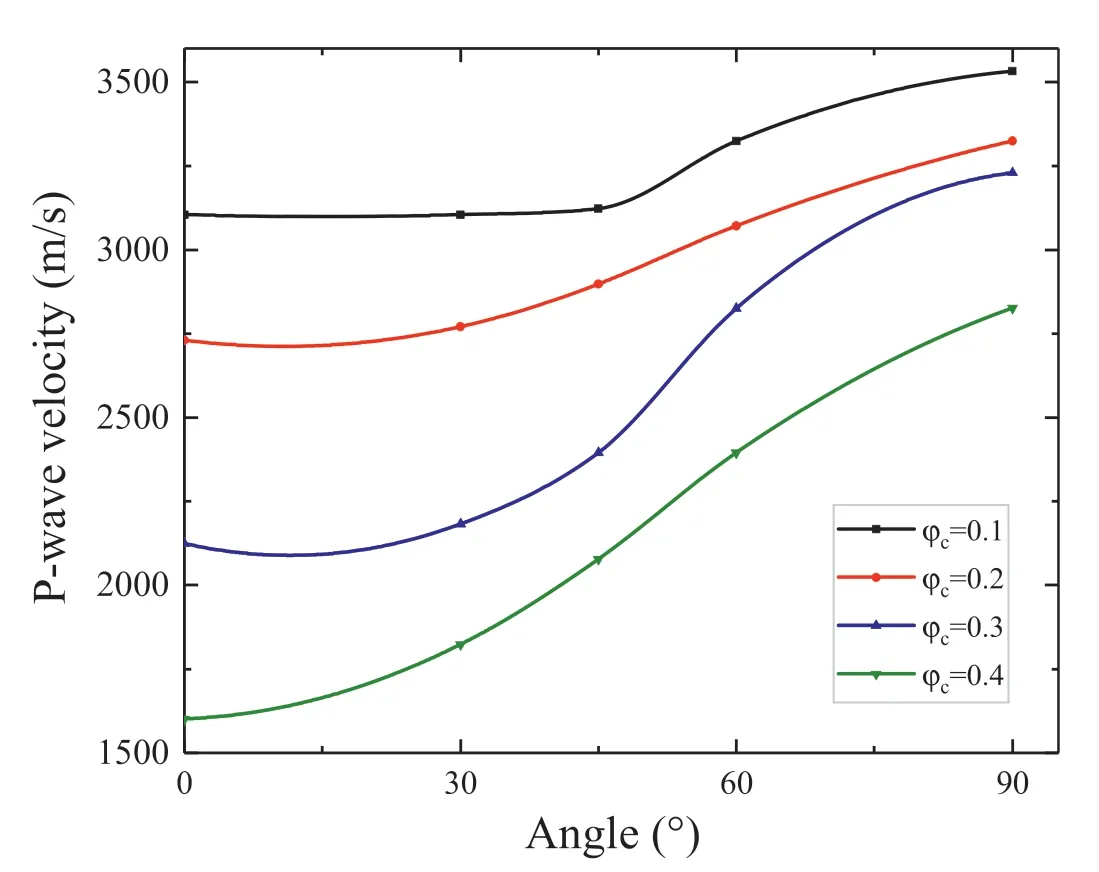
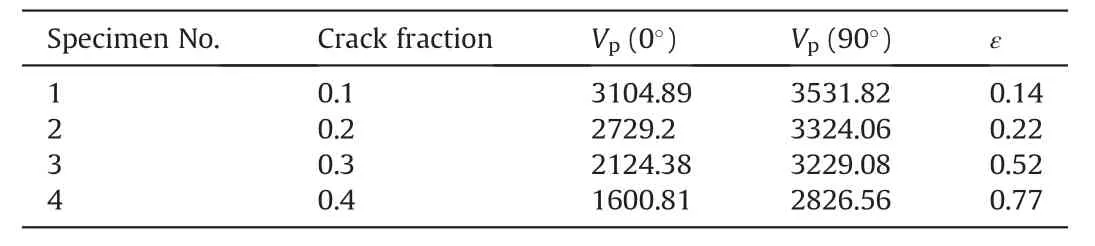
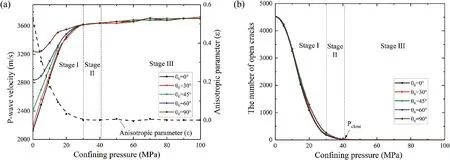
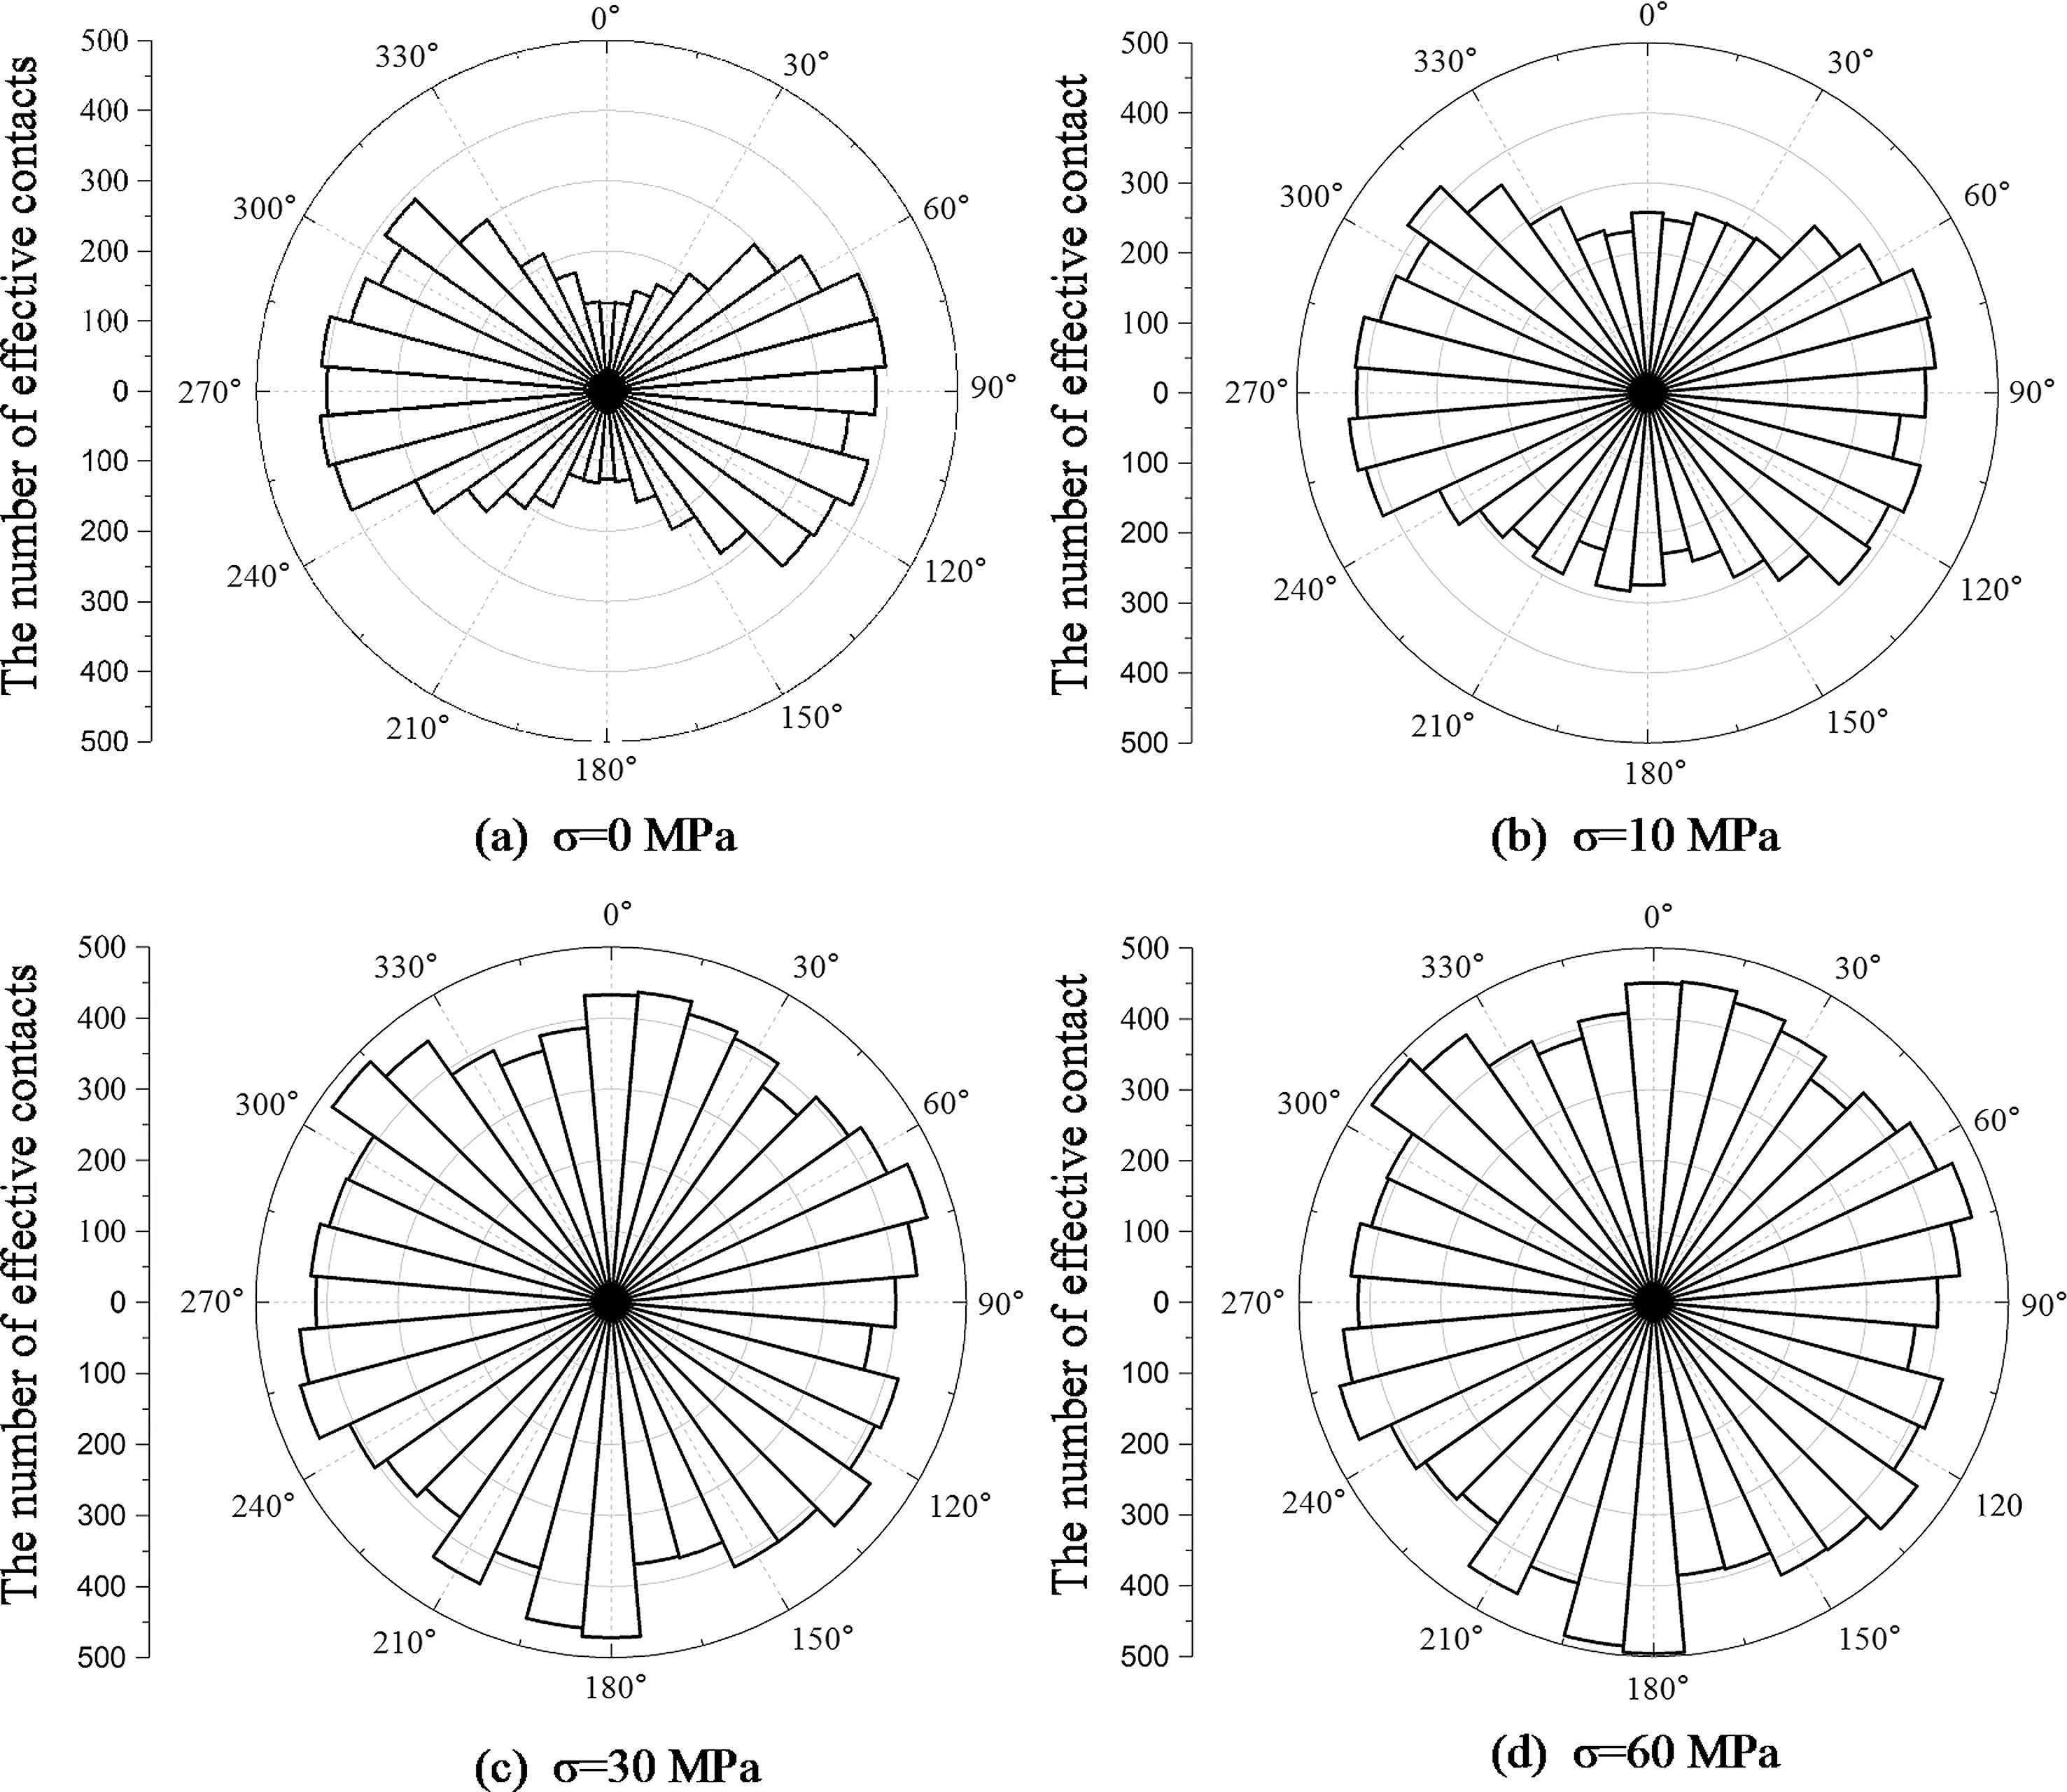
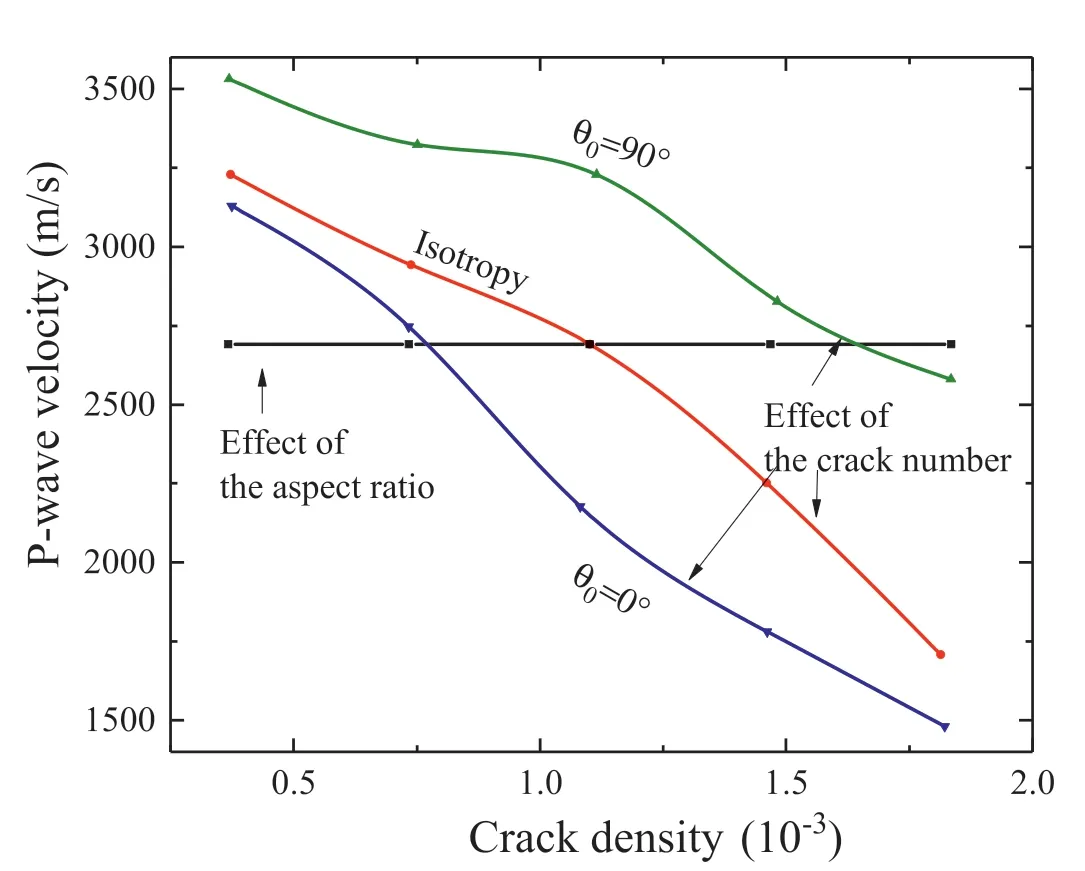
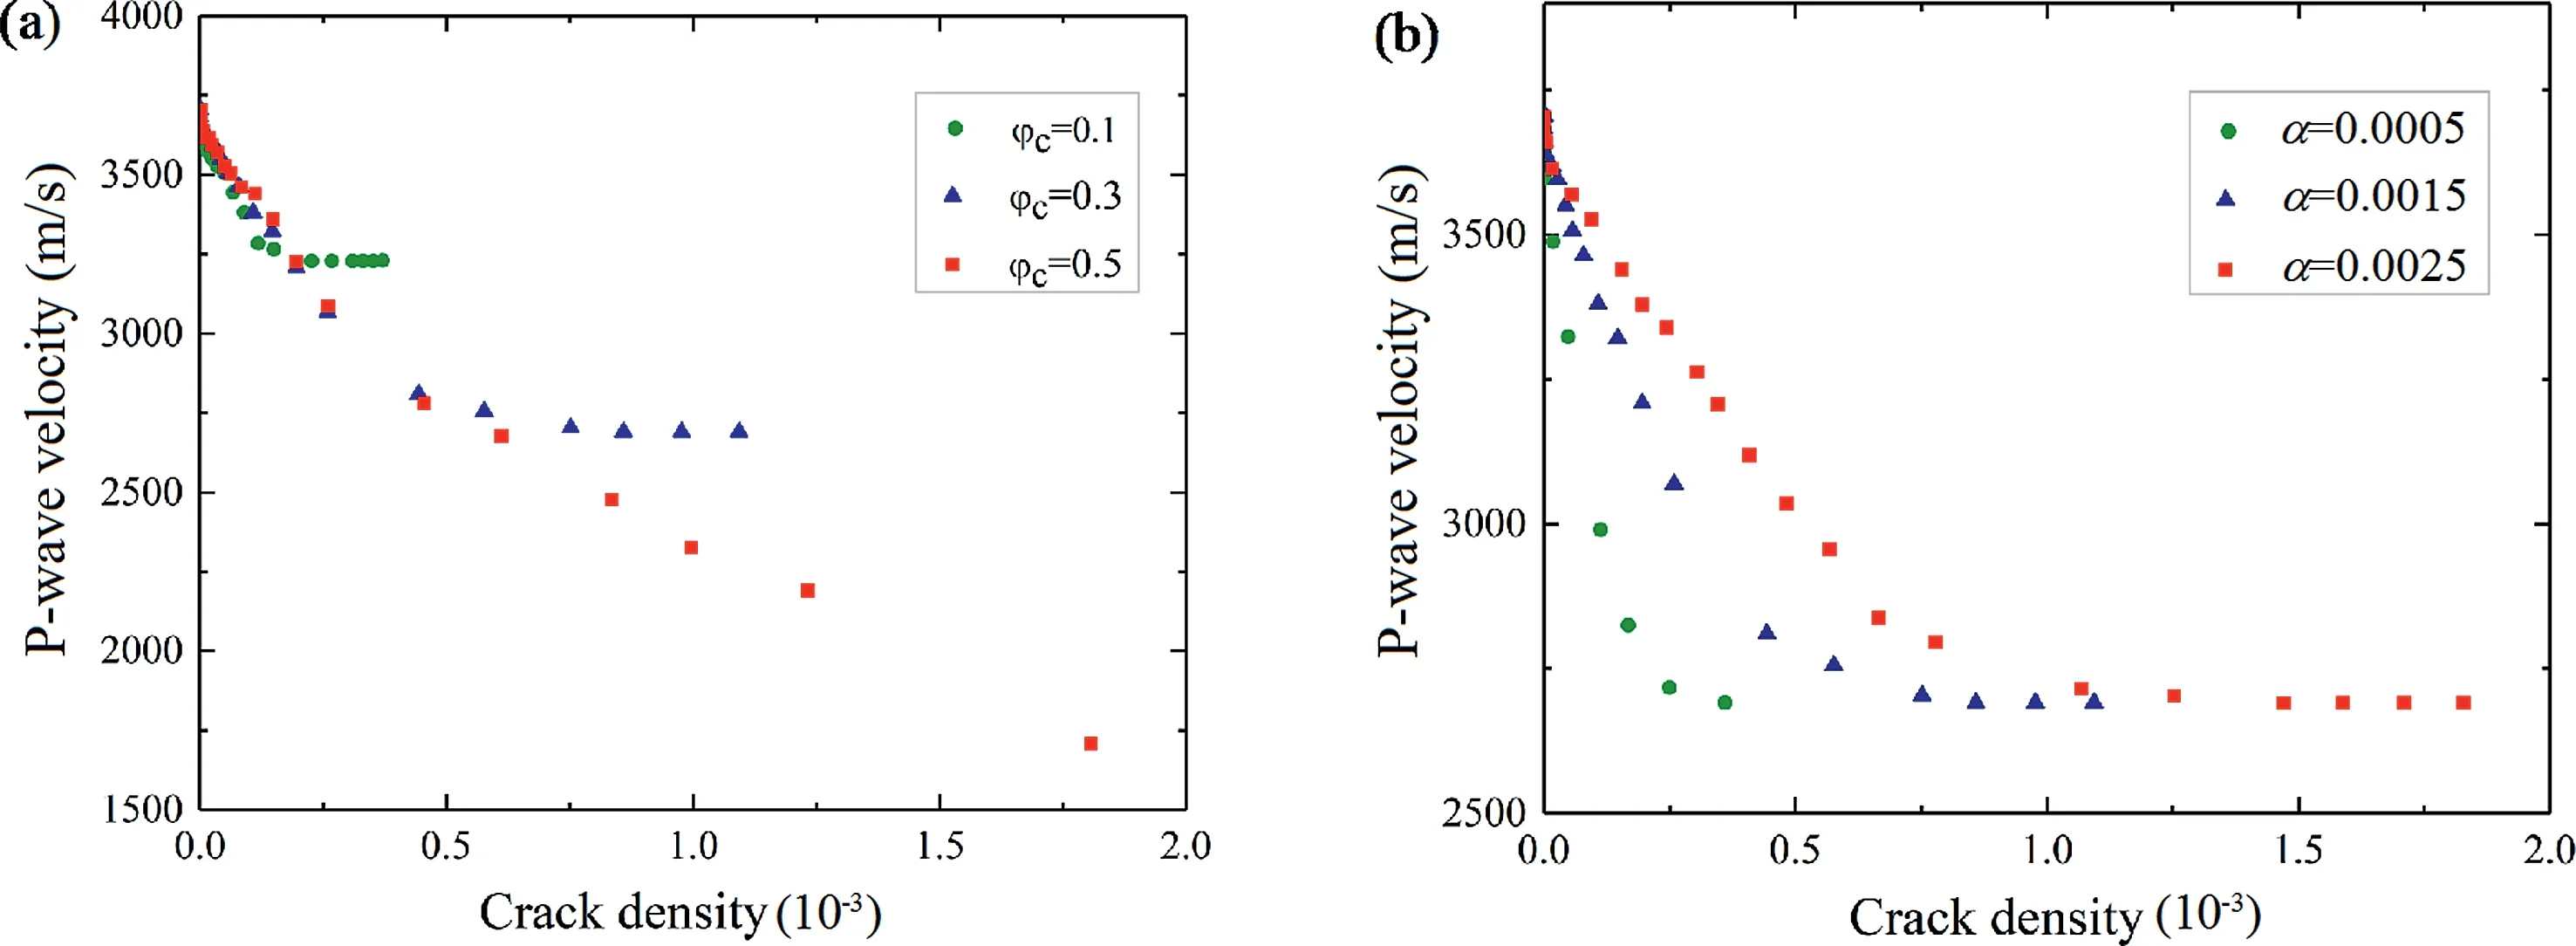
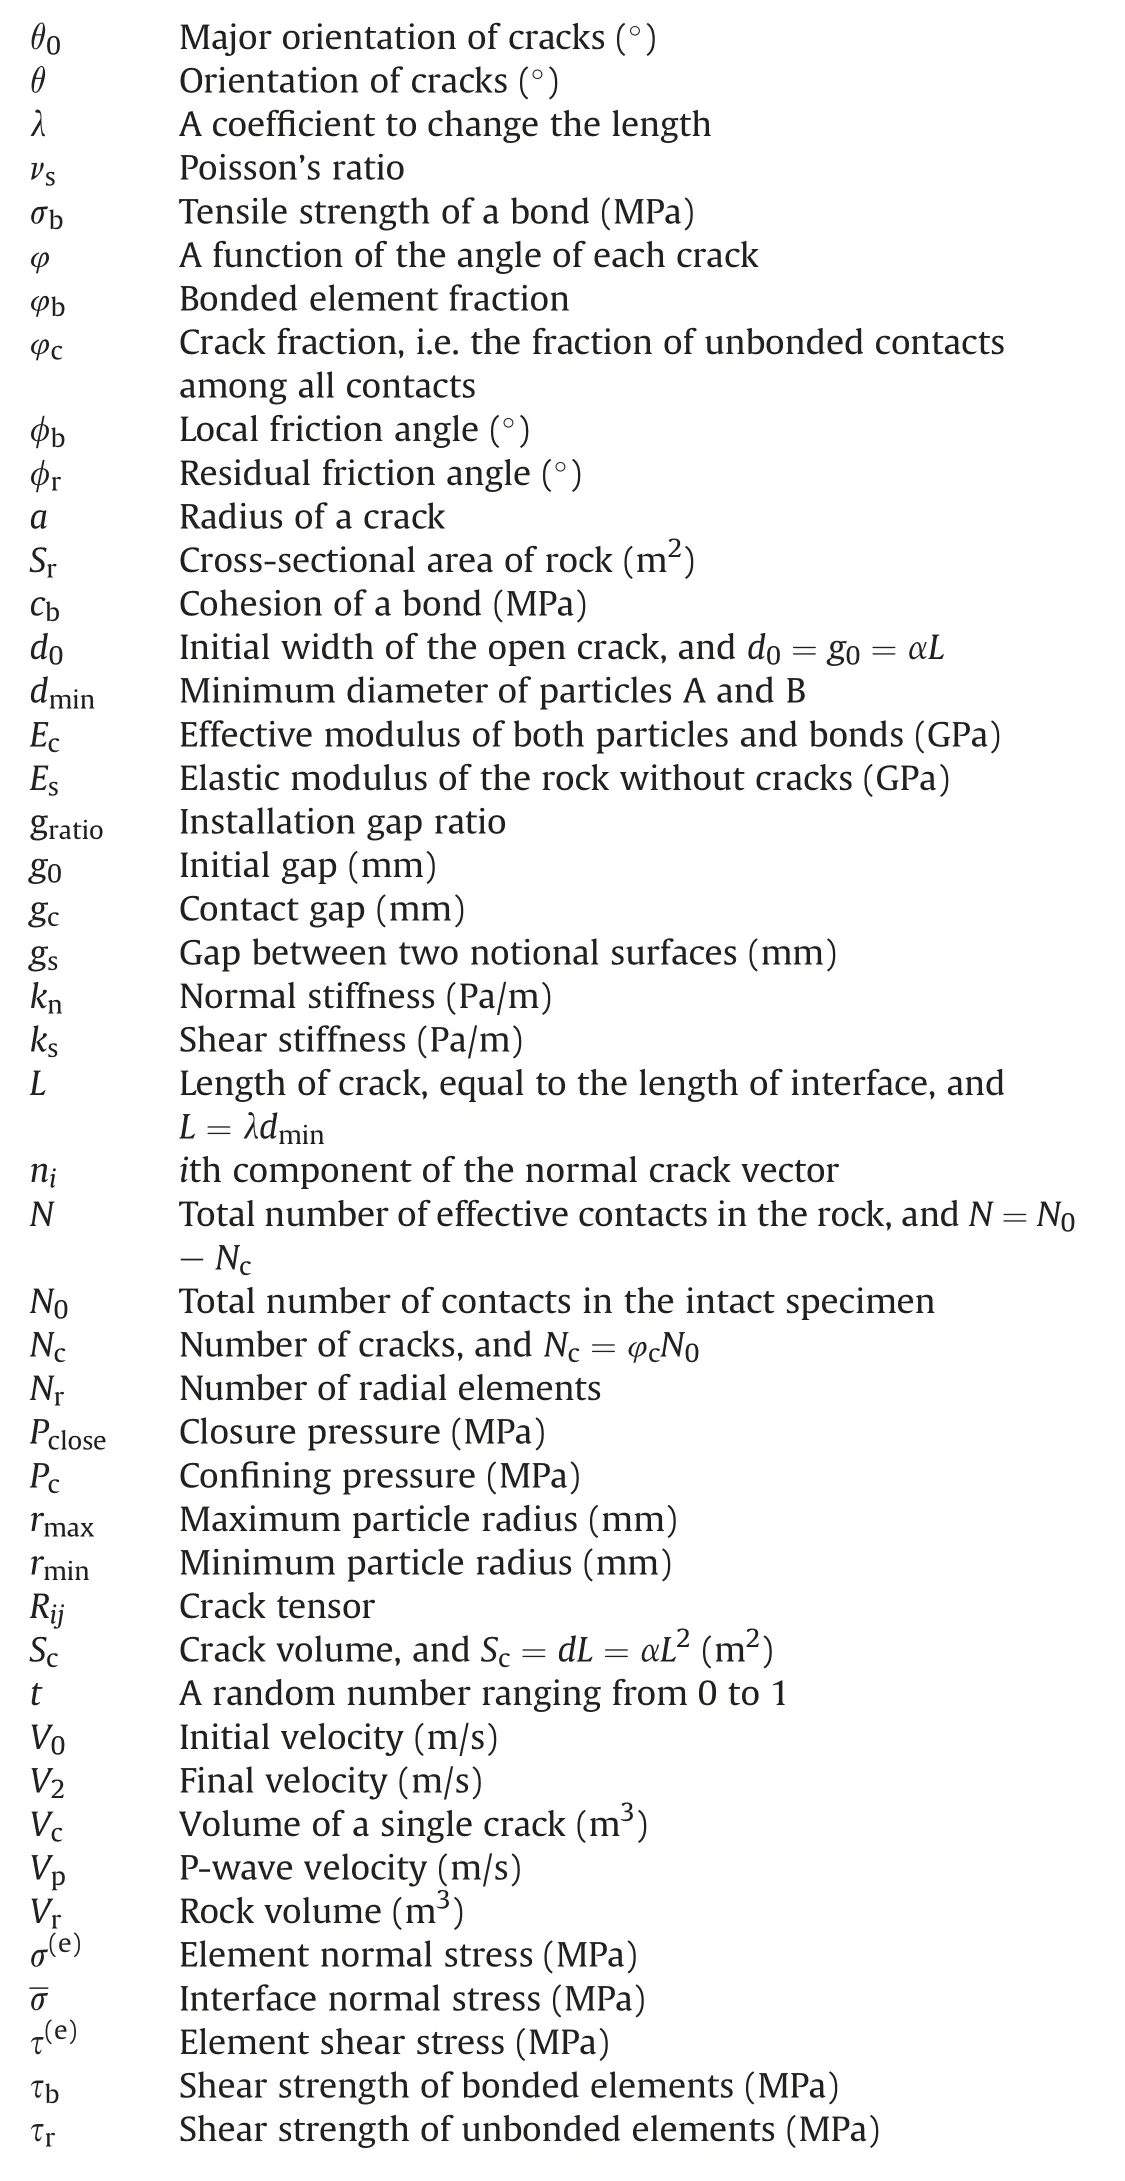
A contact gap(gc)is introduced to describe the gap between two particles, which is the difference between the radius of two particles and their relative positions,as shown in Fig.2a.In a specimen,ifgcis less than the radius of small particle multiplied by the installation gap ratio (gc To simulate the initially open cracks,a virtual gap is added into unbonded contacts by the initial gapg0(g0>0)(Fig.2c).Therefore,the value ofgsof the unbonded contacts is equal tog0in the initial specimen.In 2D numerical model,a crack is basically assumed to be rectangular. The crack density is wheredandLare the width and length of a crack,respectively;andSris the cross-sectional area of rock. It is noted that only the open cracks are counted for the calculation of crack density. Here,Lis equal to the length of the interface of the corresponding flat-joint contact, which can be determined by the particle size as Fig. 2. Schematic diagram of (a) the relative position of particles, (b) the installation of flat-joint contacts, and (c) the installation of open cracks. wheredminis the minimum diameter of the corresponding particles(Fig.2c),andis a coefficient to change the crack length.The initial width(d0)of the open crack is equal tog0,and is controlled by the initial aspect ratio of crack (a0) as According to the above descriptions, the length of cracks determines the size of cracks and the aspect ratio describes the crack shape (wide or narrow). The crack volume is defined asScdLaL2.The initial crack density(εc0)is calculated in the initial specimens: To build a rock model with a specified quantity of open cracks,an intact specimen without cracks is first generated with a series of densely packed particles. Meanwhile, the flat-joint contacts are added into the specimen. Then, a portion of the contacts is randomly chosen to be unbonded, andgsof these unbonded contacts is set tog0.The rest of contacts are bonded.The fraction of the unbonded contacts is defined as the crack fraction(c).The number of cracks can be calculated asNccN0, whereN0is the total number of contacts in the intact specimen. The size of cracks is much smaller than the specimen size, and these cracks are randomly and dispersedly distributed in the specimen. Although few small cracks may be connected to be a larger crack,there is no major fracture in the specimen, and the number of cracks can describe the content of cracks in rock. All the bonded contacts are the effective contacts. Besides, unbonded contacts withgs0 are also the effective contacts.In the initial specimen,becausegsof all the unbonded contacts is equal tog0,which is greater than zero,the total number of effective contactsNin the rock can be calculated asNN0eNc. In order to verify the model, P-wave velocity of a sandstone specimen is measured under different confining pressures (Pc) in the laboratory.The sandstone specimen is sampled from an outcrop in the lower Shaximiao Formation in the Sichuan Basin,China,and then cored into a cylindrical specimen with a length of 125 mm and a diameter of 50 mm(Li et al.,2016).The density of the sandstone specimen is approximately 2490 kg/m3, and the porosity is 7%e 14%.The specimen was dried at room temperature of 20C for more than one month before testing. Fig. 3a shows a photograph of the sandstone specimen.Two piezoelectric ceramic transducers(PZTs),with a resonant frequency of 1 MHz, a thickness of 2 mm, and a diameter of 5 mm, were directly glued on the surface of the specimen to act as a source and a receiver,respectively.A silicone jacket with a 5e6 mm thickness was coated on the surface to isolate the specimen from the infiltration of confining oil,which was used as a source applying confining pressure in a stress vessel. During the test,an ultrasonic pulse with a maximum voltage of up to 100 V was used as the source. A P-waveform was received by the receiving sensor and then recorded by a waveform recording system with a dynamic resolution of 16 bits and a sampling rate of up to 100 MHz(Li et al., 2017). Waves of the receiver with different confining pressures are shown in Fig.3b.The arriving time of each waveform was picked up according to the location of the first motion. Then the traveling time could be determined by the time difference between the emission time of the ultrasonic pulse and the arriving time of the recorded waveforms.P-wave velocity can be calculated with the traveling time and the distance between the source and the receiver. During the test, the arriving time decreases significantly as the confining pressure changes from 0 to 22.5 MPa(Fig. 3b), indicating that a large increase of P-wave velocity is induced by increasing confining pressure(Li et al., 2017). Fig. 3. (a) Rock specimen for the experiment and (b) example of waveforms with respect to different confining pressures (Pc). Fig.4. The PFC2D model.In the numerical model of PFC2D,the black particle acts as a transmitter to emit a wave, which is received by the receiver (the red particle) to measure the P-wave velocity. The black lines surrounding the rock represent the loading plates. In the numerical model (Fig. 4), an assembly of particles is densely packed within a 125 mm50 mm rectangular space to simulate rock specimen. Four black lines surrounding the rock specimen act as the loading plates where the confining pressure is applied. The density of particles is 2500 kg/m3. To accurately reflect the experiment, the particle size should be relatively smaller compared to the dimensions of specimen (Potyondy and Cundall, 2004; Yang et al., 2006). Meanwhile, to consider the computational efficiency, the radius of the particles is randomly distributed from 0.4 mm to 0.664 mm. A total of 5920 particles are cemented by flat-joint contacts to simulate the rock specimen. A total of 15,273 contacts are generated in the initial specimen without cracks. The elastic parameters of particles and bonds including the effective modulus (Ec) and the ratio of normal to shear stiffness (kn/ks) are set such that the P-wave velocity of the numerical specimen matches that of the rock, as the P-wave velocity can reflect the dynamic elastic property of the specimen. The stiffness of particles is assumed to be equal to that of bonds. Section 4 shows that the response of P-wave velocity to the confining pressure is mainly controlled by the aspect ratio of crack. Sufficient trial-and-error tests were conducted, and the calibration results showed that 0.0015 is appropriate for a,and a total of 6501 unbonded contacts are used to simulate cracks(c6501/15,2730.426). The coefficientis set to 1. The effective modulus of both particles and bonds are set to 23.46 GPa, and the ratio of normal to shear stiffness is 1.5. To study the effect of pre-existing cracks on P-wave velocity, it is assumed that no new cracks are generated during the loading of confining pressure. Nevertheless, these strength parameters are high enough to ensure that no damage occurs. Certainly, before this work, the test results showed that the changes in strength parameters had no effect on the P-wave velocity. All the microparameters used for simulating the rock are listed in Table 1. A transmitter(the red particle in Fig.4)and a receiver(the black particle in Fig. 4) are used to measure the P-wave velocity in the model.To eliminate the influence of boundary conditions,both the transmitter and receiver are 5 mm away from the nearest boundary.All particles on the boundary are set with terminating impedance to absorb all incident dynamic energy.The wavelength needs to be 10 times greater than the particle size,for the purpose of reducing the energy dispersion caused by high frequencies(Holt et al.,2005).A pulse of 100 kHz excitation frequency is used to measure the P-wave velocity, which can also be calculated by the initial arriving time of the wave. To verify the numerical model, the P-wave velocity of the numerical specimen was measured under different confining pressures from 0 MPa to 22.5 MPa.It should be noted that the local damping coefficient of 0.5 is used in loading procedure,which ensures a quasi-static loading condition (Ding et al., 2014).Then the damping coefficient is set to 0 to measure the P-wave velocity. In Fig. 5a, it is shown that the numerical results are in accordance with those measured in the test.The P-wave velocity in both the test and the simulation is 2115 m/s when the confining pressure is 0 MPa; and the velocity is approximately 3500 m/s under the confining pressure of 22.5 MPa. Meanwhile, the responses of P-wave velocity with respect to the confining pressure show a good agreement between the numerical and testing results. Compared with previous studies(e.g.Hazzard and Young,2004),this method is likely to be more effective for simulating the velocity changes with increasing confining pressure.The results also suggest that the parameters used in the model in this context are suitable for the sandstone specimen. Table 1Micro-parameters used to simulate the rock. Fig. 5. Effect of cracks on the P-wave velocity for both the simulation and experiment: (a) P-wave velocity and crack density curves related to the confining pressure; and (b)Confining pressureestrain and secant modulusestrain curves. From Fig. 5, it is interesting that the confining pressure versus strain curve is nonlinear from the start of the test.This scenario can be described by the secant modulus,which is defined as the ratio of confining pressure increment to strain increment, as shown in Fig. 5. The figure also shows that the stressed rock has a higher secant modulus. This is because newly effective contacts are generated in the specimen when the cracks close under the confining pressure. More effective contacts in the specimen are benefit to vibration transmission. Thus, the specimen has a higher velocity under the confining pressure condition. Compared to the experimental results,the information of cracks can be easily obtained from the numerical simulation. Under different confining pressures, crack densities can be calculated by Eq. (6), and the distribution of cracks can also be clearly depicted.First, these open cracks are randomly distributed in the rock (see Fig. 6a), and thus there is no specific direction for these cracks(Fig.6c)as the specimen is isotropic.When the confining pressure increases,the crack density decreases sharply,which is induced by narrowing or closure of cracks, as shown in Fig. 6. The remaining open cracks are also randomly distributed in the rock at a confining pressure of 7 MPa(Fig.6c,d),indicating that the confining pressure can decrease the crack density significantly but it has no effect on the distribution of cracks in the isotropic specimen. Based on the model constructed in Section 3,cracks contained in a specimen are assumed to have the same aspect ratio.The length of each crack(L)is related to the size of corresponding particles by setting the value ofto 1. However, because the size of particles was calibrated when the specimen was built,the average length of cracks was also determined. This means that the crack size is assumed to be confirmed in this work, and the size of cracks is much smaller than that of specimen. The smaller aspect ratio means narrower cracks.Note that the following discussion is based on the assumptions of flat cracks(a<<1)and low concentration of cracks. In addition, the damage of these specimens under applied stress is not taken into account. In order to study the effects of crack number on P-wave velocity,the cracks contained in the initial rock specimens are assumed to have the same aspect ratio, which is set to 1.5103. Five rock specimens are prepared with different crack fractions,i.e.c0.1,0.2,0.3,0.4 and 0.5.All the cracks are randomly distributed in rocks without specific directions. The crack density of the specimen can be obtained by Eq. (6). The parameters of cracks in the five specimens are shown in Table 2,and the other parameters used in these rocks are the same as those of the model as described in Section 3. Curves of P-wave velocity, number of open cracks and secant modulus of rocks are shown in Fig.7aec,respectively.It seems that the crack number has a significant effect on the P-wave velocity(Fig.7a).The result shows that the rock containing fewer cracks has a higher P-wave velocity under unstressed condition. With increasing confining pressure, the velocities and secant moduli of rocks increase. This is because the closure of numerous cracks results in formation of newly effective contacts(Fig.7b).According to the curves of P-wave velocity versus the confining pressure(Fig.7a),the influence of confining pressure on the rock specimens with different numbers of cracks can be divided into three stages.In the first stage,for the rock with fewer cracks (e.g.c0.1), the P-wave velocity increases more slowly than for the others and the number of open cracks also decreases more slowly. The reason is that the cracks in all specimens have the same initial aspect ratio(a0.0015), and the average length of cracks determined by the size of particles is almost the same,thus the average width of crack is almost equal. But the specimen containing fewer cracks has a higher secant modulus(Fig.7c),indicating that it is more difficult to deform and to close the cracks under the same confining pressure.At this stage, the confining pressure mainly narrows the cracks rather than closes them in the specimen (c0.1), as shown in Fig.7d.In the second stage,with increase of confining pressure,all the rock specimens have almost the same P-wave velocity, which may result from the slight differences in the number of open cracks and in the secant modulus. Finally, when more than 99.5% of the cracks are closed, the number of effective contacts in these specimens is almost equal to that in the intact rock, thus the compressibility of these specimens can represent that of uncracked rock.Therefore,these specimens also have almost the same secant modulus and P-wave velocity, which match those of the intact specimen.In the third stage,although almost all of the pre-existing cracks have been closed in all specimens,the P-wave velocities still increase slightly. This may be due to the compression of pores.However, the number of closed cracks in these specimens is different, which accounts for the small difference in P-wave velocity. Fig. 6. The distribution (a, b) and orientation (c, f) of cracks in a rock. Table 2The parameters of cracks for the models with different crack fractions. It is assumed that all the cracks are closed in a specimen when more than 99.5% cracks are closed. The minimum confining pressure required to close all the cracks is defined as the closure pressure (Pclose), as shown in Fig. 7b. The result indicates that the closure pressure is independent of the crack number. Fig.7. The curves of P-wave velocity(a),number of open cracks(b),and secant modulus(c)of rocks,and the aspect ratio of cracks in the rock(c0.1)when the confining pressure is 10 MPa (d). Five numerical specimens are used to study the effect of the aspect ratio on P-wave velocity.The only difference among the five specimens is a, which is set as 0.0005, 0.001, 0.0015, 0.002 and 0.0025,respectively.The crack density is calculated by Eq.(6).The parameters of cracks in the five specimens are listed in Table 3. As the confining pressure increases, the P-wave velocity increases significantly(see Fig.8a).According to the curves of P-wave velocity versus the confining pressure,the process of increases in P-wave velocity can be divided into three stages. (1) In the first stage, all rock specimens have the same initial velocity (V0), which indicates that the aspect ratio does not affect the P-wave velocity of unstressed rock. The P-wave velocity increases almost linearly with the confining pressure as many cracks are closed. However, P-wave velocity grows faster in cracked rocks with smaller aspect ratios,which means that rock containing narrower cracks is more sensitive to the applied confining pressure. Approximately 75% cracks are closed in the first stage. Table 3The parameters of cracks for the models with different aspect ratios of cracks. (2) In the second stage, almost all of the cracks are closed. For the five specimens, the final P-wave velocities in this stage(V2) are the same. This is because the compressibility and elastic properties of rocks are consistent with those of uncracked specimen when the cracks have been closed.At this stage, the P-wave velocity and the number of closed cracks grow slowly with the increase of confining pressure.This can be explained by the increasing secant modulus with the increasing closed cracks under confining pressure (see Fig. 8c). In general, as the confining pressure increases, the closure of cracks accounts for the increase of elastic property,which in turn affects the closure of cracks. (3) In the third stage, all the rocks without open cracks have almost the same P-wave velocity. However, the P-wave velocities also increase at high confining pressure.This may be a result of a further compression of pores contained in the rock. However, the increase in P-wave velocities is much smaller than that induced by crack closure. Walsh(1965)studied the effect of cracks on the compressibility of rock,and proposed that the closure pressure required to close the penny-shaped crack is a function of aspect ratio: whereEsis the elastic modulus of the rock matrix,sis the Poisson’s ratio, and a0is the initial aspect ratio. A numerical specimen without cracks has been built, and the result of uniaxial test showed that the elastic modulus of the specimen is 27.12 GPa.The closure pressures of the five specimens are obtained based on the curve of closed cracks. Fig. 8d shows that the closure pressure is nearly linearly related to the aspect ratio; the slope of the fitting line is approximately 26.83 GPa, which is close to the elastic modulus of the rock without cracks,indicating that the simulation results match the theoretical results. Fig.8. The curves of P-wave velocities(a),percentages of closed cracks (b),secant moduli (c)versus confining pressures,and the relationship between closure pressure and crack shape (d). The effect of crack anisotropy on rock has been widely reported(e.g. Diederichs,1999; Ji et al., 2018), in which the crack tensor is employed to analyze the anisotropy. In these studies, once one contact is removed,a crack is generated.The direction of the crack is perpendicular to the contact. In this study, a random number,t,from 0 to 1, is chosen for each contact. Iftis smaller than, the contact is removed,and an open crack is generated.is a function of the angle of each crack to ensure that these cracks have a specific orientation (Ji et al., 2018): The parameter acis calculated as where Rijis the crack tensor, and can be calculated as whereniis theith component of the normal crack vector. To study the effect of crack orientation on P-wave velocity, the parameter acof the five rock specimens is set to 1,and0is set to 0,30, 45, 60and 90, respectively, where 0is defined as the orientation of the cracks parallel to the axial direction of the rock.The aspect ratio of each crack is 0.0015. The distributions of crack directions for the two specimens (00and 90) are shown in Fig. 9b, c. If the specimens have the same number of cracks,the difference in the five specimens is only the crack orientation. In this case,these specimens collected from the same outcrop could have different orientations. Also, the measured P-wave velocities of the five specimens can be regarded as the P-velocity of one rock in different measurement paths. Fig. 10 shows that P-wave velocity increases when the angle of cracks increases. The response of P-wave velocity to the crack angle is similar to that reported in previous studies (e.g. Vernik, 1993; Zhubayev et al., 2016). Thomsen(1986)’s anisotropic parameter, ε, is usually used to describe the velocity anisotropy, which can be calculated as Fig. 9. A schematic used to depict the crack orientations (a), and the distribution of open crack directions for two specimens (b, c). According to the calculated results,the more the cracks aligned along one direction, the greater the anisotropy of the rock (see Table 4). The P-wave velocity is less affected by the cracks when their orientations are closer to 90(Fig.10). This is because more contacts are distributed in the direction of wave propagation(Fig. 9a), when the rocks contain the same number of cracks and more cracks are parallel to the wave propagation directionSuch a microstructure of rock is beneficial for wave propagation. Fig.10. Influence of crack orientation on P-wave velocities. Five specimens with different crack orientations are compacted under various confining pressures. The velocities and crack numbers of the specimens are shown in Fig.11.It is noteworthy that these specimens (or stressed rock specimens) always contain the same number of cracks (Fig. 11b), because these specimens are loaded with the confining pressure, i.e. the confining pressure is equal in arbitrary direction, and the closure of cracks has no induced orientation. Thus, under confining pressure, the P-wave velocities of these specimens still could be regarded as that measured from one rock in different orientation paths.Anisotropic parameter ε of the rock could be calculated under different confining pressures. As the confining pressure increases, the closure of cracks results in the increase of P-wave velocities for all the specimens.Since the increases of P-wave velocity in these specimens are different, the anisotropy of P-wave velocity changes. According to the variations in P-wave velocity with confining pressures, the process of P-wave velocity can be divided into three stages. At the first stage, rocks with cracks in the direction 0show the fastest increase in P-wave velocity. The formation of many new effectivecontacts results from the closure of cracks which are mostly parallel to the direction of wave propagation, as shown in Fig.12.This result indicates that the response of P-wave velocity is sensitive to the measurement path in the anisotropic rock under confining pressure. When the confining pressure reaches 30 MPa,the P-wave velocities in all five specimens are close to the same value. That is because most of the cracks are closed, the remaining open cracks have no obvious specific orientation, and the anisotropic parameter is close to 0. At the second stage, the five specimens have the same P-wave velocity, which still increases as cracks are closed at this stage. At the third stage, the P-wave velocity increases slowly, perhaps resulting from the pore closures that are difficult to be compressed. In addition, the closure pressures of the five specimens are the same and the results indicate that the closure pressures are not affected by crack orientations. Table 4Measured Vp and Thomsen’s anisotropic parameter ε. Fig.11. Influence of crack orientation on P-wave velocities of stressed rocks with large c (c 0.3): (a) P-wave velocities, and (b) the number of open cracks. Fig.12. The distribution of effective contacts under different confining pressures. Fig.13 shows the effects of crack density on P-wave velocity in unstressed rock. All the cracks are opened in these unstressed rocks. The result shows that when the aspect ratio is unchanged,the crack density increases by the increase of crack number,and the P-wave velocity decreases significantly. However, when the crack number is constant,the P-wave velocity is independent of the crack density.The initial P-wave velocity is determined only by the crack number but not the aspect ratio. Actually,in a specimen,some micro-cracks can be connected to produce several cracks,resulting in the decrease of the micro-crack number. But the micro-cracks are assumed to be in a low concentration, thus these micro-cracks are not able to form fracture.Therefore,the micro-crack number actually can reflect the quantity of cracks randomly distributed in a specimen. When the size of micro-crack is confirmed, the micro-crack number is directly related to the total length of cracks in a specimen,and larger total length of cracks results in lower P-wave velocity.Besides,the aspect ratio only determines the average width of micro-cracks. The results indicate that for the unstressed rock,the micro-crack width has no influence on P-wave velocity. Fig.13. Effect of crack density on P-wave velocity in unstressed rocks. Additionally, crack orientation is a factor affecting the P-wave velocity.The alignment of cracks will influence the number of open cracks in the direction of wave propagation in the model.When the measurement path is vertical to the orientation of aligned cracks,P-wave velocity is less affected by the change in crack density caused by crack number. It is concluded that P-wave velocity is determined by the number and orientation of open micro-cracks and is independent of the average width of open micro-cracks. In other words, measurement of P-wave velocity of an unstressed rock can only help to evaluate the number and orientation of open micro-cracks. With increasing confining pressure,the deformation of crack is the major reason accounting for the decrease of crack density.Fig.14 shows the response of P-wave velocities to the crack density in isotropic rocks under confining pressures. The result indicates that the response of P-wave velocity to the confining pressure is closely related to the crack density. Fig.14 shows that the P-wave velocities do not always increase with the decrease of crack density.Part of the data show that the P-wave velocity remains unchanged as the crack density decreases, because the cracks are just narrowed, but not closed under the applied confining pressures.However,the mechanisms of this phenomenon caused by the crack number(Fig.14a)and the aspect ratio(Fig.14b)are different.When the aspect ratio is the same,the specimen containing fewer cracks has a higher secant modulus,which results in difficulty to close the cracks.When these specimens have the same number of cracks,the rock containing wider cracks needs a larger stress to close the cracks.It is worth noting that the curves almost coincide when the velocity begins to rise and the initial aspect ratio of cracks is the same (Fig. 14a). The result also indicates that the lowest P-wave velocity is confirmed by the number of open cracks(Fig.14a).Under confining pressure, the sensitivity of P-wave velocity to the crack density depends on the aspect ratio of cracks(Fig.14b).That means that not only the number but also the aspect ratio of cracks would affect the response of P-wave velocity under confining pressure.Therefore, it is not easy to back-calculate the change of crack density simply based on P-wave velocity under confining pressure.The characteristics of cracks(the number and aspect ratio)need to be considered.Determination of crack characteristics is helpful for predicting the relationships among the confining pressure, crack density and P-wave velocity. Some researchers have used wave velocities to predict crack density (e.g. Byun et al., 2015; Li et al.,2019), which is calculated by both the P- and S-wave velocities.Application of S-wave velocity simultaneously may be more conductive to understanding the characteristics of cracks in rocks,which needs further studies. Fig.14. Effect of crack density on P-wave velocity in rocks under confining pressures: (a) a 0.0015 and (b) c 0.3. In this context, a method is proposed to numerically study the relationship among the P-wave velocity, pre-existing cracks and confining pressure in rock. The pre-existing open micro-cracks have been successfully included in the numerical model. The proposed model is verified in comparison with the experimental results on a sandstone specimen. Furthermore, it is successful to identify the effect of microstructures on P-wave velocity by investigating the number, aspect ratio and orientation of cracks. Based on the numerical and experimental results, the following conclusions can be obtained: (1) P-wave velocity of isotropic rock is only controlled by the number of open cracks, and the closure pressure is merely governed by the aspect ratio. (2) When the cracks are aligned in one direction,the difference of crack numbers in measurement paths is the main reason accounting for the anisotropy of P-wave velocity. (3) The responses of P-wave velocity to the confining pressure are affected by the number and aspect ratio of cracks. The lowest P-wave velocity is determined by the number of open micro-cracks. The narrower the cracks are, the more sensitive the P-wave velocity is to the confining pressure. (4) It is insufficient to interpret the crack density only based on the P-wave velocity. The detailed characteristics of cracks(number,aspect ratio and orientation)need to be considered by an integrated measurement of P- and S-wave velocities. For simplicity,only a 2D model is considered in this context.For this,a 3D model may provide a more detailed investigation for the relationship between crack characteristics and seismic wave in the future. Declaration of Competing Interest The authors wish to confirm that there are no known conflicts of interest associated with this publication and there has been no significant financial support for this work that could have influenced its outcome. Acknowledgments The research was partially supported by the National Natural Science Foundation of China(Grant Nos.41872210 and 51674238),and the Open Research Fund of the State Key Laboratory of Geomechanics and Geotechnical Engineering,Institute of Rock and Soil Mechanics,Chinese Academy of Sciences(Grant No.Z017006).We would also like to acknowledge two anonymous reviewers for constructive comments and suggestions raised on the draft manuscript. List of symbols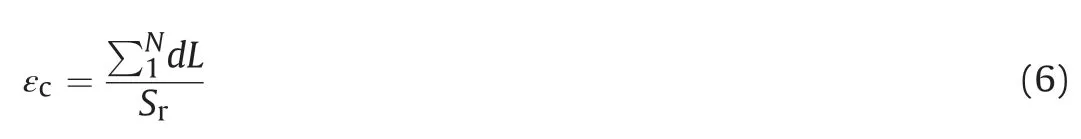


3. Experimental and model setup
3.1. Experimental setup
3.2. Numerical model
3.3. Model verification
4. Results
4.1. Effects of crack number on P-wave velocity
4.2. Effects of the aspect ratio on P-wave velocity
4.3. Effect of crack orientation on P-wave velocity

5. Discussion
5.1. Effect of crack density on P-wave velocity of unstressed rock
5.2. Effect of crack density on P-wave velocity of a stressed rock
6. Conclusions
 Journal of Rock Mechanics and Geotechnical Engineering2020年3期
- Journal of Rock Mechanics and Geotechnical Engineering的其它文章
- Crack initiation of granite under uniaxial compression tests: A comparison study
- Reliability analysis of slopes considering spatial variability of soil properties based on efficiently identified representative slip surfaces
- Critical state model for structured soil
- Coupled hydro-mechanical analysis of expansive soils: Parametric identification and calibration
- A modified soil water content measurement technique using actively heated fiber optic sensor
- Benchmark solutions of large-strain cavity contraction for deep tunnel convergence in geomaterials