
Mathematical modelling of COVID-19 in South Africa
2020-05-15 08:58:24AroonkumarBeesham
Aroonkumar Beesham
Department(s) and institution(s) Faculty of Natural Sciences, Mangosuthu University of Technology, P O Box 12363, Umlazi 4026, South Africa
The first case of coronavirus disease 2019 (COVID-19) in South Africa arose when a group of people returned from Milan, Italy to Durban, South Africa on 1 March 2020. One person from this group was confirmed with COVID-19 on 5 March 2020. Since then, the number has increased steadily as shown in Figure 1[1]. On 15 March,the President of South Africa declared a national disaster. Gradually,flights to and from South Africa were curtailed, and the public was urged to practice social distancing. Then, on 27 March 2020, a national lockdown commenced with various restrictions, lasting 21 days. Following Sookaromdee and Wiwanitkit[2], an attempt is made to build a mathematical model for the spread of COVID-19 in South Africa. Due to the large number of variables involved, and various uncertainties, we have adopted a very simple approach just to get a handle on the situation.
Up to the time of the lockdown, 27 March 2020, the increase was growing exponentially (Figure 2A). A good fit to the data is the equation y = axbecx, with a = 1.835 83, b = 0.349 009, c = 0.244 957(R2= 0.991 4). The restrictions since lockdown from 27 March 2020 have appeared to work very well, and since then, the increase has dropped to a linear fit (Figure 2B): y = ax + b, with a = 55.274 7,b = 1 088.69 (r = 0.004 6). What are the reasons for this drastic drop in the increase? All persons were to stay at home, except for people in key positions, such as the police, essential shops, petrol stations and banks. In addition, South Africans were prohibited from travelling, especially overseas, and no flights were allowed to come in from outside the country. Therefore, contact between susceptible and infected persons has been minimised.
It is interesting to speculate about what will happen in the future.Obviously this is a very difficult task, given the number of variables involved. One way is to join the two functions in a piece wise manner. If we try to find a “best fit” to all the data, we come up with Figure 2C, with the equation of the curve being the same as for that in Figure 2A, but with the parameters a = 257 562 × 10-10, b =8.138 68, c = -0.246 673 (R2= 0.989 1). What is most interesting will be how we respond after lockdown, and if the lockdown is extended.
On 13 April 2020, the total number of cases in South Africa stood at 2 272. In Figure 1, we have plotted the accumulated number of cases per day in a line graph. The total number of deaths stood at 27,and the total number of deaths over time is shown in a line graph in Figure 2D. The total number of recoveries on 13 April 2020 stood at 410. It should be noted that we have only tested at the rate of 1 411 persons per million of the population. Once testing is done more widely, it is expected that the numbers of infected people will rise.
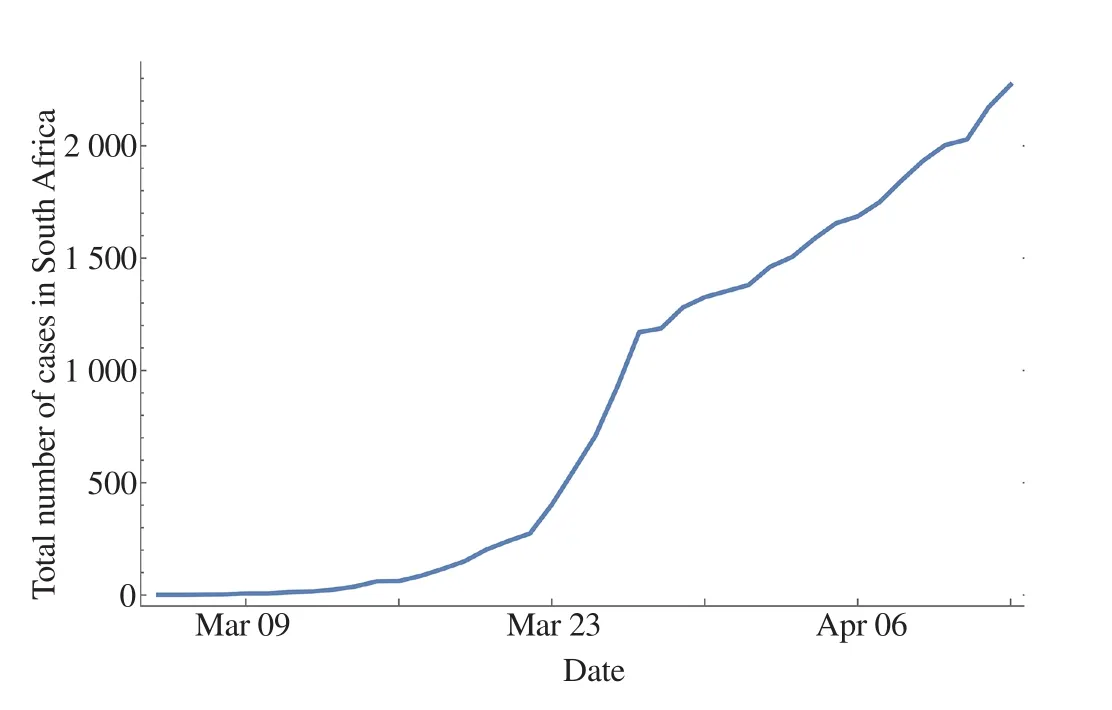
Figure 1. Accumulated COVID-19 cases in South Africa from 5 March 2020 to 13 April 2020.
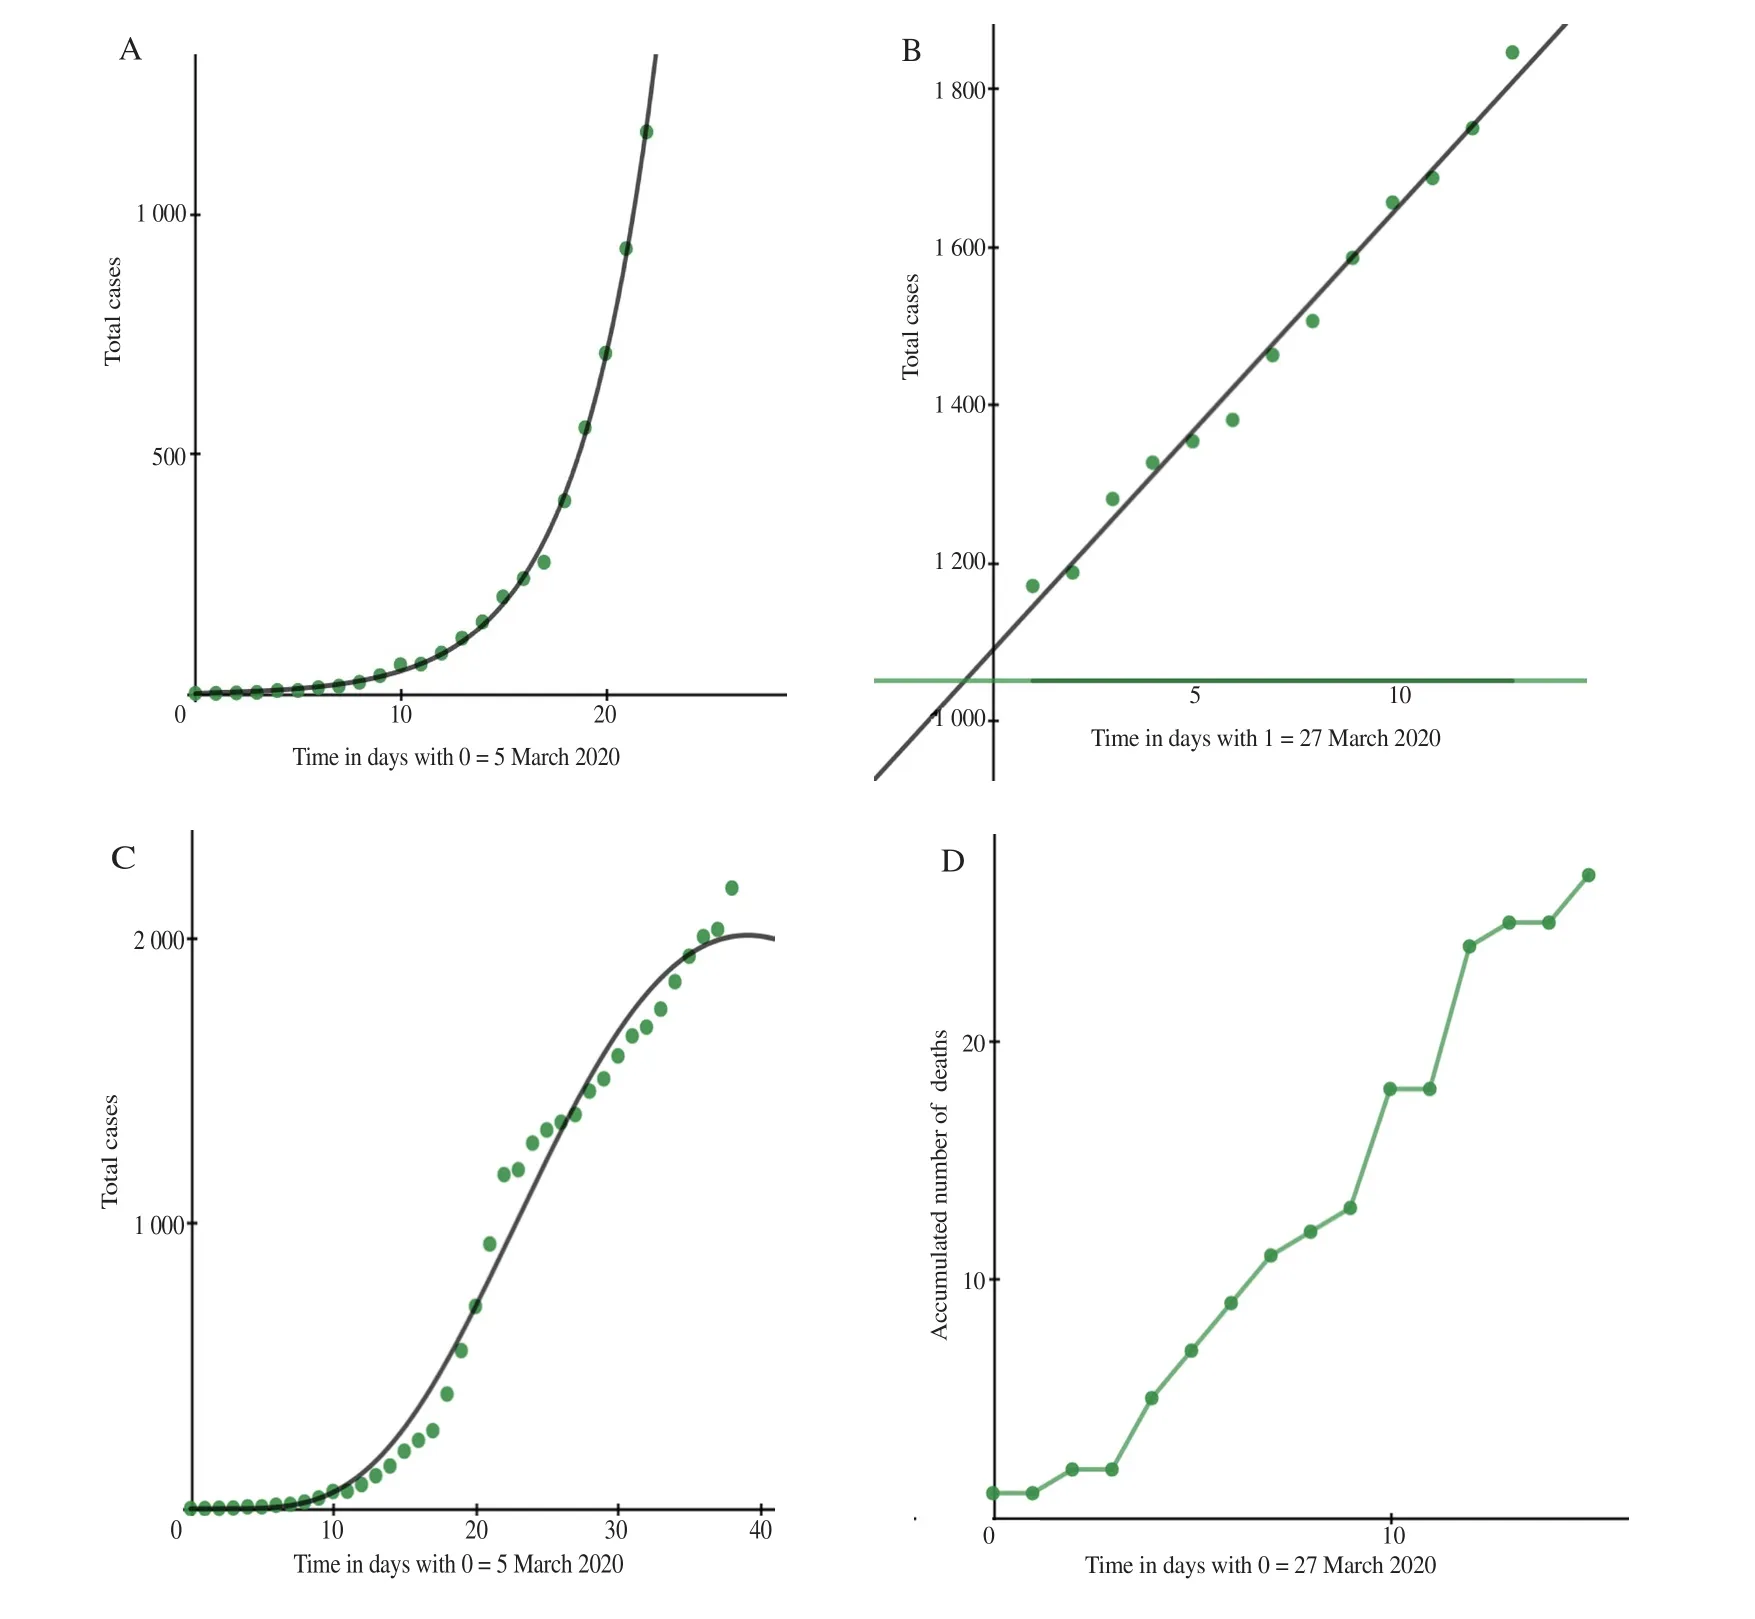
Figure 2. Accumulated COVID-19 cases in South Africa: (A) from 5 March 2020 to lockdown on 27 March 2020, (B) from lockdown on 27 March 2020 to 8 April 2020, and (C) from 5 March 2020 till 8 April 2020. (D) Accumulated deaths in South Africa 27 March 2020 (first death) to 13 April 2020.
Conflict of interest statement
The author declares that there are no conflicts of interest.
Acknowledgements
The author is grateful to Jacques Cloete, University of Zululand,South Africa for assistance with the graphs, and to an anonymous referee for useful comments which led to an improvement in the article.
Author' s contributions
A.B. conceptualized and designed the work, made data collection,data analysis and interpretation, also drafted the article, did critical revision of the article, and approved the final version to be published.
 Asian Pacific Journal of Tropical Medicine2020年5期
- Asian Pacific Journal of Tropical Medicine的其它文章
- Coronavirus disease 2019 (COVID-19) outbreak: Strengthening the treatment component in health care establishments to minimize case fatality
- Public health preparedness towards COVID-19 outbreak in Nigeria
- COVID-19 epidemic control approach in Italy
- Spatial distribution of cutaneous anthrax in western Iran from 2009 to 2016:Geographic information system mapping for predicting risk of anthrax outbreaks
- Lesson learned: Retrospective analysis of ‘missed out’ dengue NS1 positives among IgM negative population
- Outpatient prevention counseling for malaria in northwest Nigeria: A single-centre descriptive cross-sectional study