
Dynamic compression characteristics of layered rock mass of significant strength changes in adjacent layers
2020-04-17 13:48:40SenWenChunshunZhngYulinChngPingHu
Sen Wen ,Chunshun Zhng ,Yulin Chng ,Ping Hu
a Institute of Geotechnical and Rail Transport Engineering,Henan University,Kaifeng,475004,China
b Department of Civil Engineering,Monash University,Clayton,VIC,3800,Australia
c School of Civil Engineering,University of South China,Hengyang,421001,China
Keywords:Rock dynamics Split hopkinson pressure bar(SHPB)Layered composite rock specimen Dip angle of bedding plane Strain rate Numerical simulation
A B S T R A C T Layered rock mass of significant strength changes for adjacent layers is frequently observed in underground excavation,and dynamic loading is a prevalent scenario generated during excavation.In order to improve the driving efficiency and reduce engineering accidents,dynamic compression characteristics of this kind of rock mass should be understood.The dynamic properties of a layered composite rock mass are investigated through a series of rock tests and numerical simulations.The rock mass is artificially made of various proportions of sand,cement and water to control the distinct strength variations at various composite layers separated by parallel bedding planes.All rock specimens are prefabricated in a specially designed mould and then cut into 50 mm in diameter and 50 mm in height for split Hopkinson pressure bar(SHPB)dynamic compression testing.The test results reveal that increasing strain rate causes the increases of peak strength,σp,and the corresponding failure strain,εp,while the dynamic elastic modulus,Ed,remains almost unchanged.Interestingly,under the same strain rates,Ed of the composite rock specimen is found to decline first and then increase as the dip angle of bedding plane increases.The obtained rock failure patterns due to various dip angles lead to failure modes that could be classified into four categories from our dynamic tests.Also,a series of counterpart numerical simulations has been undertaken,showing that dynamic responses are in good agreement with those obtained from the SHPB tests.The numerical analysis enables us to look into the dynamic characteristics of the composite rock mass subjected to a broader range of strain rates and dip angles than these being tested.
1. Introduction
A rock mass generally consists of intact rock and separations or weak discontinuities,such as bedding planes,faults and joints.These separations or interfaces in rock masses are much weaker in strength than the intact rock material,so they can dominate the rock mass stability when loaded either statically or dynamically.Dynamic loading is a prevalent scenario generated by tunnelling,mining, rock blasting, seismic activity, etc., and the induced deformation and failure of the rock mass are of essential in understanding and controlling a rock mass fracture.
Many experimental studies on rock dynamics use split Hopkinson pressure bar(SHPB),also known as the Kolsky bar(Kolsky,1949,1963),to generate dynamic impact mostly on intact rocks(Cadoni,2010;Frew et al.,2010;Doan and Bill,2011;Hogan et al.,2012;Dai et al.,2013;Zhang and Zhao,2013;Liu et al.,2015a;Li et al.,2016a).Given the importance of weak plane to the dynamic properties of rocks,many studies focused on the dynamic properties of jointed and layered rocks.Among these studies,some efforts were put on investigating the propagation properties of stress waves in the joints and the dynamic responses of the joints using analytical methods.For example,Li et al.(2011)developed a fractal damage joint model based on fractal damage theory and established an analytical solution for the coefficients of the transmission and reflection of the stress waves across the joints.Also,Zhu and Zhao(2013)analytically studied an oblique incident wave propagation across the joints with the virtual wave source method.
On the other hand,some scholars studied the influences of joint stiffness,incident angle,wave type,and joint spacing on transmission coefficients.For instance,Li et al.(2015a)proposed an improved equivalent viscoelastic medium method to analyse the seismic wave propagation across layered rock masses and discussed the effects of the incident angle and the thickness of the layer on the wave propagation.Furthermore,Li et al.(2016b)analytically investigated the wave propagation properties in a joint under close and open states,which were then verified by SHPB tests.Chen et al.(2018a)established a one-dimensional(1D)contacted interface model based on joint matching coefficient.Through using this model,the reflection and transmission effects of the stress wave propagation along the joint and energy coefficients can be obtained.Nevertheless,the above researches mainly use theoretical analysis to explore the propagation characteristics and influence factors of different stress waves in joints.The relationship between dynamic strength,dynamic crack propagation and stress wave loading of jointed rock mass has not been studied.
Due to the development of SHPB testing and data acquisition techniques,researchers have designed different experiments to explorethe dynamic properties of joints.Forexample,Ju et al.(2007)used SHPB tests to investigate the influence of rough joint surface configuration on the stress wave propagation,where the joints in the rock specimens were generated in prior by three-point bending fracture tests.Then two separate parts of the fractured specimen were incorporated as an entire specimen used for the subsequent impact test.Chen et al.(2015,2016,2018b)adopted some notches to simulate different types of artificial rough joints.Then they used a modified SHPB apparatus to carried out a series of tests and revealed the relationship between the transmission coefficient and the contact situation of the joint surface and the effect of spatial geometry of the contact surface on wave propagation.Li et al.(2017)investigated the influences of joint contact area and spatial geometry of the joint surface on the dynamicproperties of rock joint bySHPB apparatus.In their tests,the specimen consisted of two rock cylinders.One top surface of one cylinder had some notches,while the other surfaces of the two cylinders were smooth and flat.It is noted that the above researchers used artificial joints in the test,with the main difference from the ways of joint production.However,the above works mainly focus on the influence of the joint characteristics on the wave propagation,rather than on the fracture modes and the dynamic peak intensity of the rock specimens.
In order to make the joints more convenient and to control the position and inclination of the joints when sampling,many scholars used rock-like materials to prepare the rock specimens in the impact test.For example,Jiang et al.(2016)carried out the impact tests,showing that the fabricated specimens from gypsum-like three-dimensional printing material can better simulate the real rock behaviours.Also,Zhao et al.(2008)adopted cement and mortar to make the rock specimens,and through a series of tests,they proposed a nonlinear dynamic model of fracture normal behaviour.Shu et al.(2018)made different joints using the rock-like materials.As can be seen,the rock-like materials have been widely used in rock impact tests to study the effects of loading rate,joint inclination and joint filling on dynamic rupture modes and dynamic peak intensities.The rock-like materials are suitable for conducting in-depth study on the fracture modes of rock specimens under different joint characteristics.
The study of the dynamic properties of bedding mainly focused on coal rock,for instance,Zhao et al.(2014,2016,2017),based on the impact tests and numerical simulations,explored different states of bedding on coal and rock in terms of the dynamic indirect tensile strengths,dynamic fracture toughness,and failure modes.Similarly, through some quasi-static and dynamic uniaxial compression tests,Liu et al.(2015b)studied the impacts of bedding orientation on the failure modes,fracture strengths and energy dissipation.More recently,Wang and Yang(2017)used an SHPB apparatus and followed the notched semi-circular bend(NSCB)method to investigate the influences of the impact velocity and bedding angle on coal’s dynamic fracture toughness and failure strains.Based on two-dimensional(2D)numerical modelling,Tan et al.(2018)considered the effect of bedding on rock’s dynamic properties and failure modes under coupled static-dynamic loads.The issue becomes more complicated if considering the heterogeneous nature of geomaterials(Ji et al.,2018,2019).Besides the coal,a series of SHPB dynamic tests has also been conducted on layered sandstones by Li et al.(2015b),where the influences of dip angle on dynamic tensile properties and failure modes were analysed.Yan and Feng(2012)investigated dynamic tensile strength properties of the rock interface between tuff and basalt by SHPB test and numerical simulation.Qiu et al.(2017)studied the influence of bedding angle on sandstone fracturing behaviour by SHPB test.
The above-mentioned studies on layered rock mass mainly focused on rock masses without significant strength variations in different rock layers.However,few studies were reported on the dynamic compression characteristics of layered rock mass of significant strength changes for adjacent layers.In this paper,we aim to investigate the dynamic compressive responses and corresponding failure modes of layered rock mass of high variations in layer strength.To well control the strength variation,the rock specimens are made of sand,cement and water to fabricate rocklike specimens for SHPB dynamic compression testing.
2. Experiment set-up
2.1. Selection of rock specimen material
A rock-like mass was made of most common engineering materials,i.e.sand,cement,and water.The strength variation of rock layers was achieved by controlling the proportions of cement,sand and water,and cure time when casting each layer.This treatment has become a common practise of producing physical models for rock testing(Stimpson,1970;Yong et al.,2006).
2.2. Fabrication of rock specimens
Two types of rock-like materials,i.e.materials A and B,were cast with cement,sand and water of different proportions to produce rocks of two different strengths.For example,material A contains the weight ratio of P42.5cement/sand/water=1:0.67:0.33,while the material B contains the weight ratio of P32.5cement/sand/water=1:1.5:0.45.The material A with P42.5cement is much harder than the material B with P32.5,as per cement standard.
The rock mass preparation procedure is instructed below:
(1)Manufacture of the mould for casting.A transparent synthetic glass,as shown in Fig.1,was used to manufacture the mould of layered rock mass.The mould has the dimensions of 30 cm(length)×30 cm(width)×16 cm(height).It consists of three specifications of synthetic glass plates,i.e.two plates A,two plates B and one plate C as marked in the figure.Adjustable bolts fix the five plates,and therefore the mould is convenient to be disassembled for re-usage.Additionally,scales are marked on the four lateral plates to control the depth when casting each layer.
(2)Casting.First to pour material A into the mould till 2 cm thickness,wait before final setting of this layer,and then pour the material B on the top of the material A till another 2 cm thickness.Repeat pouring materials A and B alternately,till the mould is fully poured.
(3)Concrete curing and core boring.The casted concrete block was cured according to the Chinese specification GB/T 50081-2002(2002),and then a series of cores was bored at different angles.Different boring orientations are illustrated in Fig.2,where the dip angles of bedding planes,α,are 0°,30°,60°and 90°.Note that a drilling mount was used to conveniently produce cores with α equal to 30°and 60°.

Fig.1.Sketch of the mould for casting.
(4)Preparation of specimens.Cut the bored cores into required dimensions for SHPB tests,as shown in Fig.3.Each rock specimen was labelled following the convention:dip angle,group No.in that dip angle,and specimen No.in that group.
Additionally,single material A or B,but not the interval casting of the both,was cast in the mould to make pure block A or B for material testing.Thus,three rock-like materials,i.e.A,B and layered A+B,were made for both static and dynamic tests.
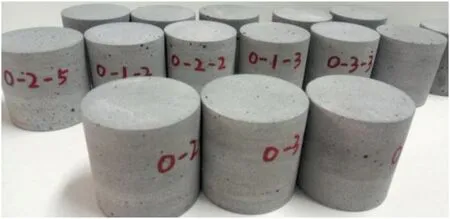
Fig.3.Specimens for dynamic test.
2.3. Material testing for blocks A and B
To verify whether the materials A and B are similar to rock,uniaxial compression tests were conducted on blocks A and B with the specimens in dimensions of 50 mm(diameter)×100 mm(height), and Brazilian split tests in dimensions of 50 mm(diameter)×30 mm(height).The obtained mechanical properties of the materials A,B and layered A+B were listed in Tables 1 and 2.We may also check the ratios of compressive to tensile strength,σc/σt,being 18 and 13,respectively,for the materials A and B;these ratios are within the typical range(i.e.10-20)of natural rocks(Deere and Miller,1966).Similarly,the Poisson’s ratios of the materials A and B are around 0.2,being within the range(i.e.0.11-0.46)of natural rocks(Deere and Miller,1966).The similarities between the rock-like material and real rock are therefore evident,and it is appropriate to use the materials A and B to simulate natural rocks.The significant variations in strength between materials A and B suggest that we can examine the layered rock mass of significant strength changes in stratigraphy.
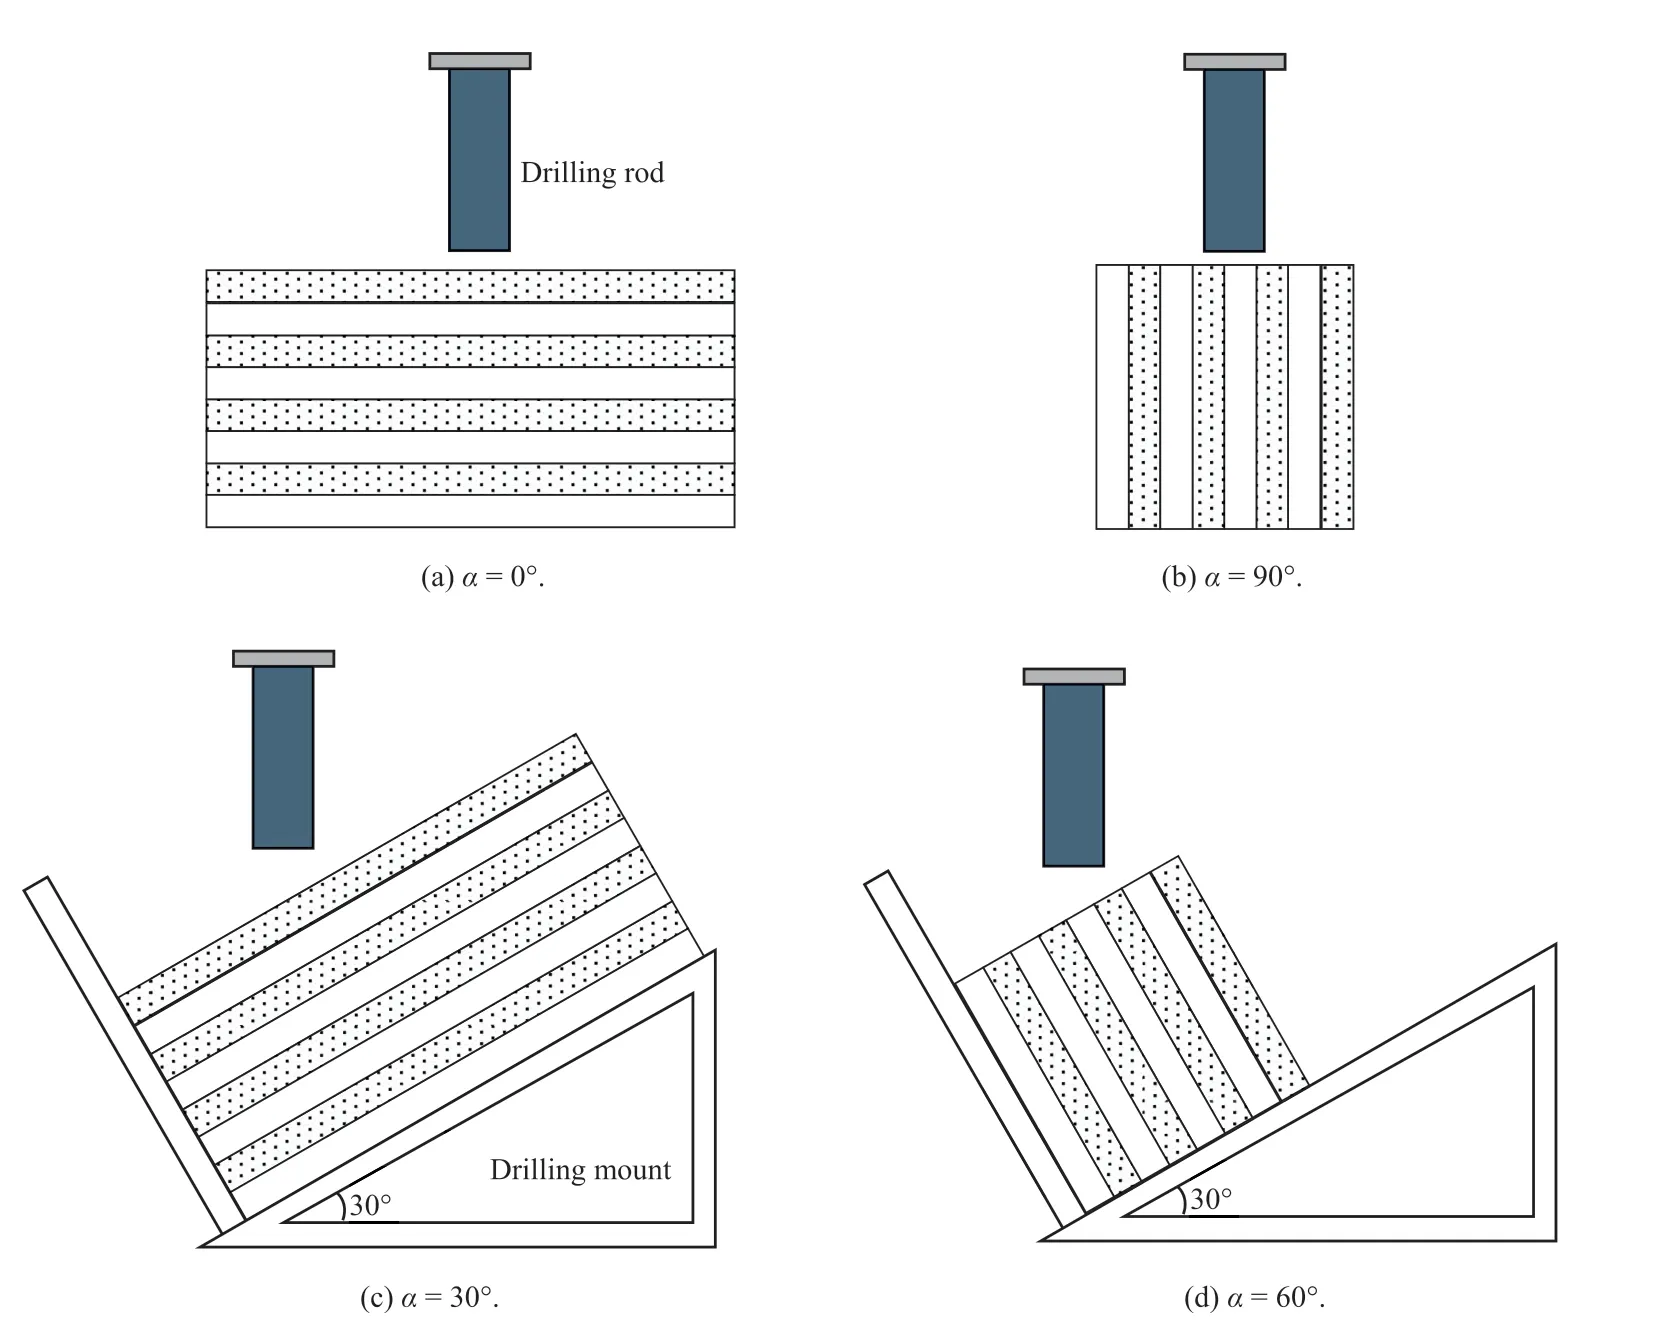
Fig.2.Sketches of drilling for specimens at different dip angles.

Table 1 Mechanical properties of materials A and B.

Table 2 Geometrical and mechanical properties of the mixed specimens.
2.4. SHPB testing system
To study the dynamic responses of the layered rock mass,we conducted the SHPB dynamic compression tests at Central South University(China)for the layered materials A+B in dimensions of 50 mm(diameter)×50 mm(height).As depicted in Fig.4,the SHPB system mainly consists of a striker,and 50 mm-diameter incident and transmission bars that are made of Cr alloy steel.The P-wave velocity, density, and elastic modulus of the alloy steel are 5400 m/s,7810 kg/m3and 240 GPa,respectively.Signals of the halfsine wave were produced by the improved cone-shaped strike,which is launched by a gas gun;thus the unaltered strain loading is guaranteed.A high-speed camera with 75,000 frames per second(fps) is installed to capture the rock dynamic failure process efficiently.
Fig.5 shows the dip angle of bedding plane,α,transmitted stress wave direction,and inclination angle of bedding plane to the transmitted wave direction,β.
3. Analysis of dynamic results
3.1. Equilibrium of dynamic stress
A specimen labelled 90-2-2 was selected to conduct the impact testing.As previously clarified,this is the specimen with vertical bedding planes,i.e.a dip angle of 90°as a cut in Fig.2b.Therefore,the incident wave was applied parallel to bedding planes of the specimen,resulting in transmitted and reflected waves which are also parallel to the bedding planes.Comparing the three waveinduced stress reactions in Fig.6,the difference between the incident and reflected reactions was almost equal to the transmitted reaction.This indicates that there is almost no energy loss at the interface,and therefore the energy conservation or equilibrium status is maintained.
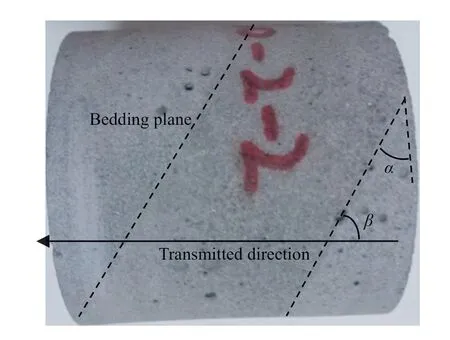
Fig.5.Relationship between α and β.
3.2. Influence of strain rate on dynamic compressive properties
A total of 60 mixed rock specimens for the dynamic tests were prepared,including 15 specimens for each dip angle of bedding plane,α,i.e.0°,30°,60°and 90°.The impact gas pressures were adjusted to generate different striking loads to the specimens,breaking the specimens at different strain rates.The results of the dynamic stress-strain curves under different strain rates and dip angles are presented in Fig.7.
Fig.7 indicates a certain similarity of the stress-strain curves of the specimens with various dip angles of bedding plane.Irrespective of the dip angle,the peak strengths and strains of all specimens increase with increasing loading rate.We may divide the curves into three sections,representing three different stages of characteristics:linearly elastic behaviour with a linear stressstrain curve, nonlinear elastoplastic behaviour before peak strength,and post-failure strain softening behaviour.
Also,for α of 0°and 30°,where the bedding planes were perpendicular(0°)or near-perpendicular(30°)to the incident wave,strains were found to snap back under relatively low strain rates(e.g.40.9 s-1and 55.3 s-1).This phenomenon was due to the release of stored energy(builtup from the impact load),causing the fractured rock blocks or pieces to return to their original status.This is called“elastic rebound”that occurs immediately after the solid rupture.From Fig.7,it can be observed that the elastic rebound or strain snapback did not apply to the bedding planes that were not perpendicular or near-perpendicular to the incident wave,i.e.α of 60°and 90°.Furthermore,even though for rock specimens with α of 0°and 30°,when increasing the strain rates(e.g.over 65.7 s-1),there appeared no rebound any longer.
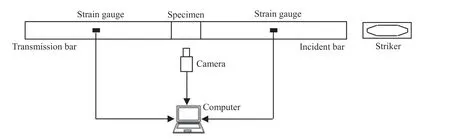
Fig.4.Schematic diagram of the SHPB system.
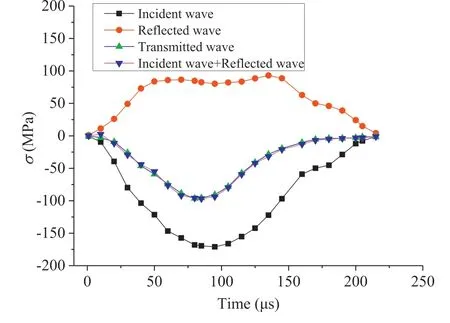
Fig.6.Dynamic equilibrium of the specimen 90-2-2.
From Fig.7,further quantitative comparisons can be made.For example,for the specimens of α=0°,when increasing the rate from 40.9 s-1to 96.1 s-1,the peak strength,σp,was found to increase by 75.4% ,i.e.from 72.6 MPa to 127.4 MPa.Similarly,when increasing the strain rate from 41.2 s-1to 101.2 s-1for the specimens of α=30°,the rate from 41.9 s-1to 85.2 s-1for α=60°,and the rate from 40.4 s-1to 105.2 s-1for α=90°,the peak strengths,σp,were found to increase by 54.6% ,75.4% and 74.4% ,respectively.That is to say,σpwas increased from 76.6 MPa to 118.5 MPa for the specimens of α=30°,from 53.4 MPa to 90.5 MPa for the specimens of α=60°,and from 73.6 MPa to 128.1 MPa for the specimens of α=90°.It is therefore evident that the strain rate indeed affects the rock strength significantly.
Rock strengths and strain rates(˙ε)were plotted in a semilogarithmic graph,as shown in Fig.8.A most straightforward linear regression was tried to fit both the relationship between the rock strength and strain rate.Although there appeared some scattered data,the overall linear regression is evident by the good coefficient of determination, R2. The slopes of the fitted linear equations range from 83.49 MPa for α=60°,108.78 MPa for α=30°,124.85 MPa for α=90°,to 133.86 MPa for α=0°.It appears that the change of the rock strength with strain rate is not monotonic compared to the change of the dip angle of bedding plane.Instead,there exists a critical dip angle,i.e.60°from our finding,where their strengths are least sensitive to the change of strain rate,as indicated by its slope,being the smallest among the four fitted linear equations.Also,the lowest peak strength for the case of α=60°is evident in Fig.7c when comparing with the other three figures in Fig.7.With the observations in Figs.7 and 8,it implies that under the impact loading in our tests,the interface strength that dominates the shear failure behaviour of the layered composite rock is minimum at α=60°.Such a shear failure pattern is consistent with an intact rock under static loading condition which generates a failure plane with the angle of 60°=45°+φ/2,where φ is the internal friction angle measured by the static test, typically being around 25°-35°.Nevertheless,the mechanism of the minimum dynamic interface strength occurring at 60°for the composite rock specimen requires substantial work to study further.
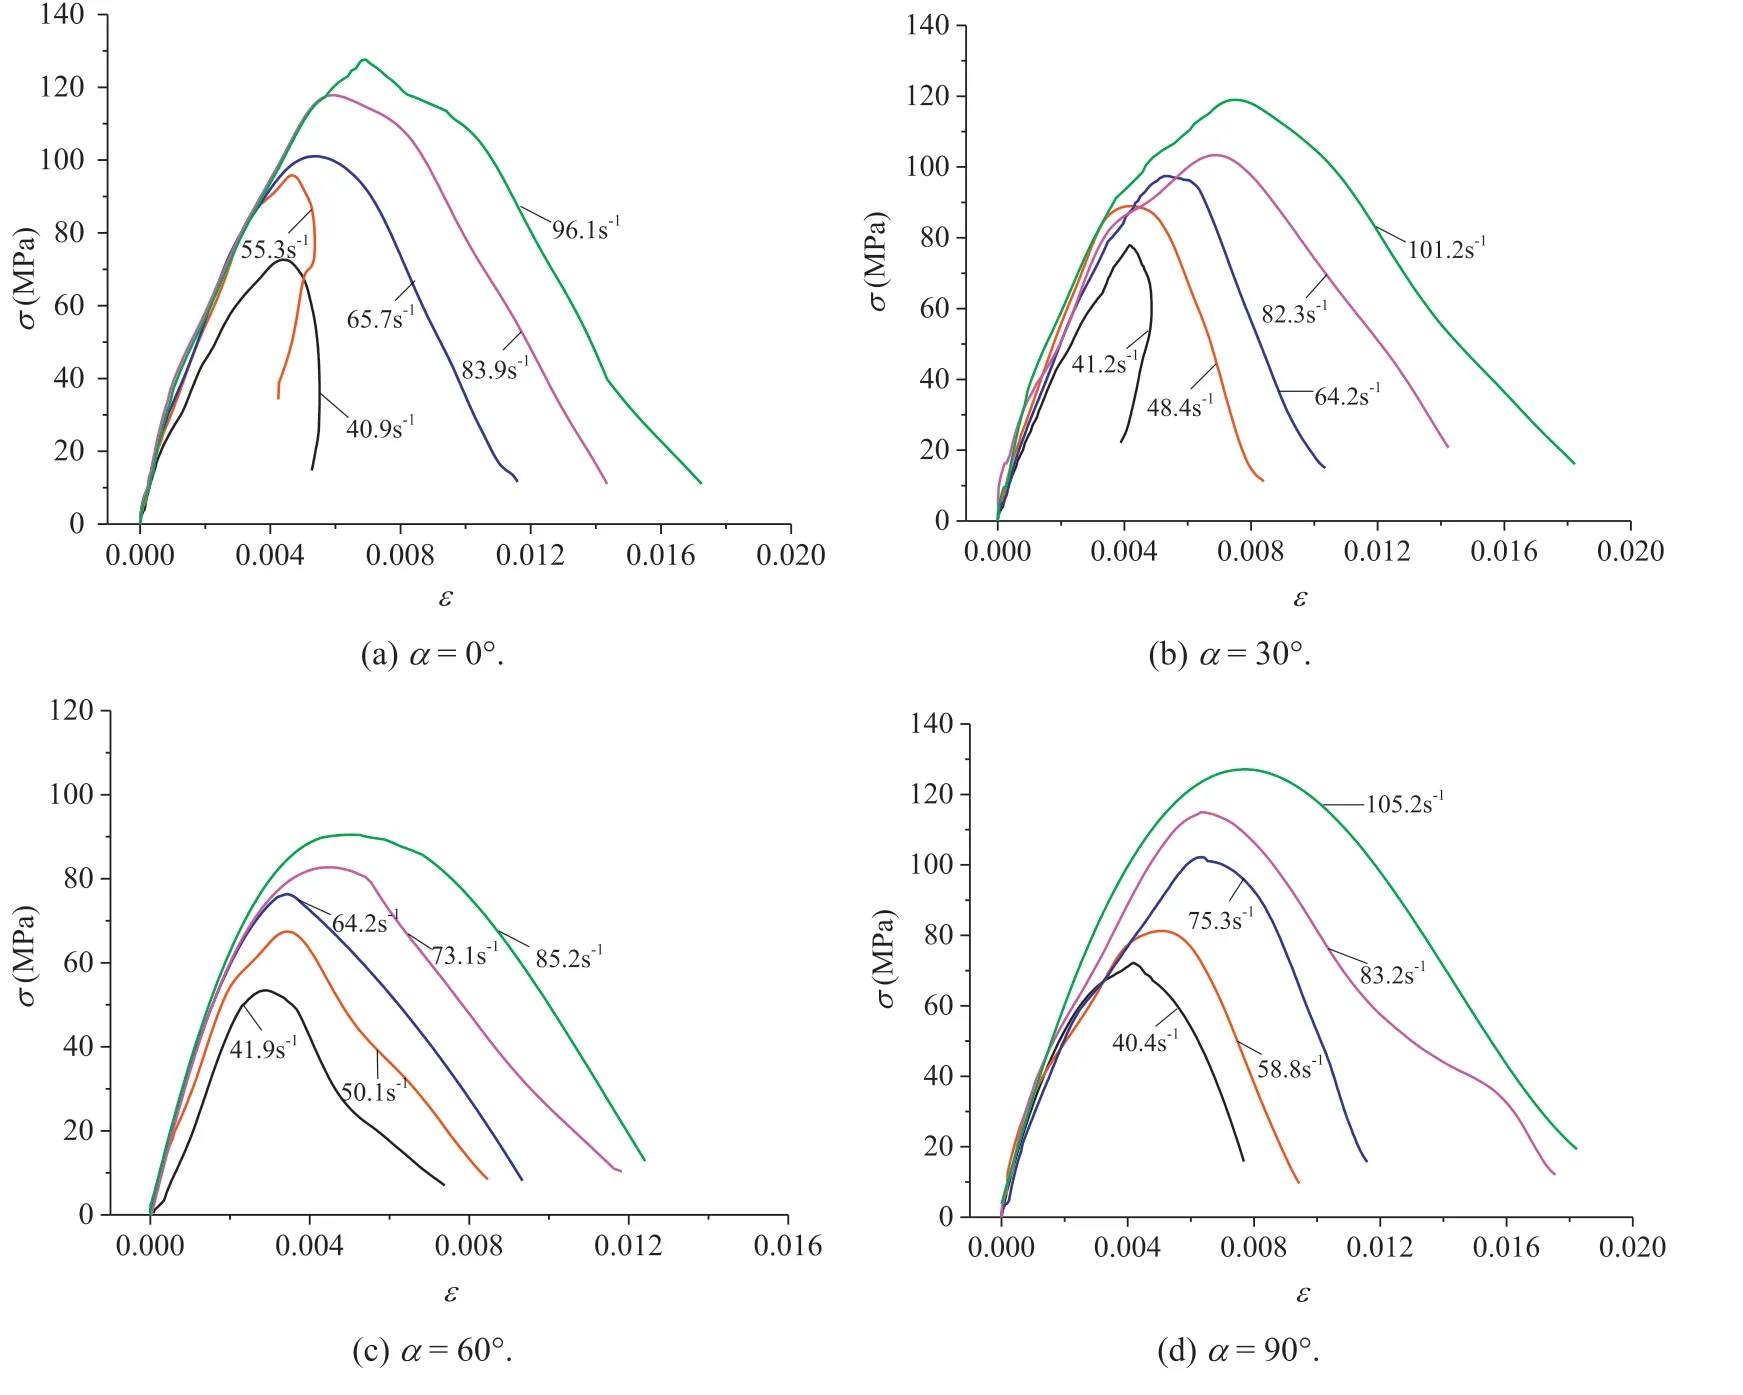
Fig.7.Dynamic stress(σ)vs.strain(ε)curves of mixed specimens.
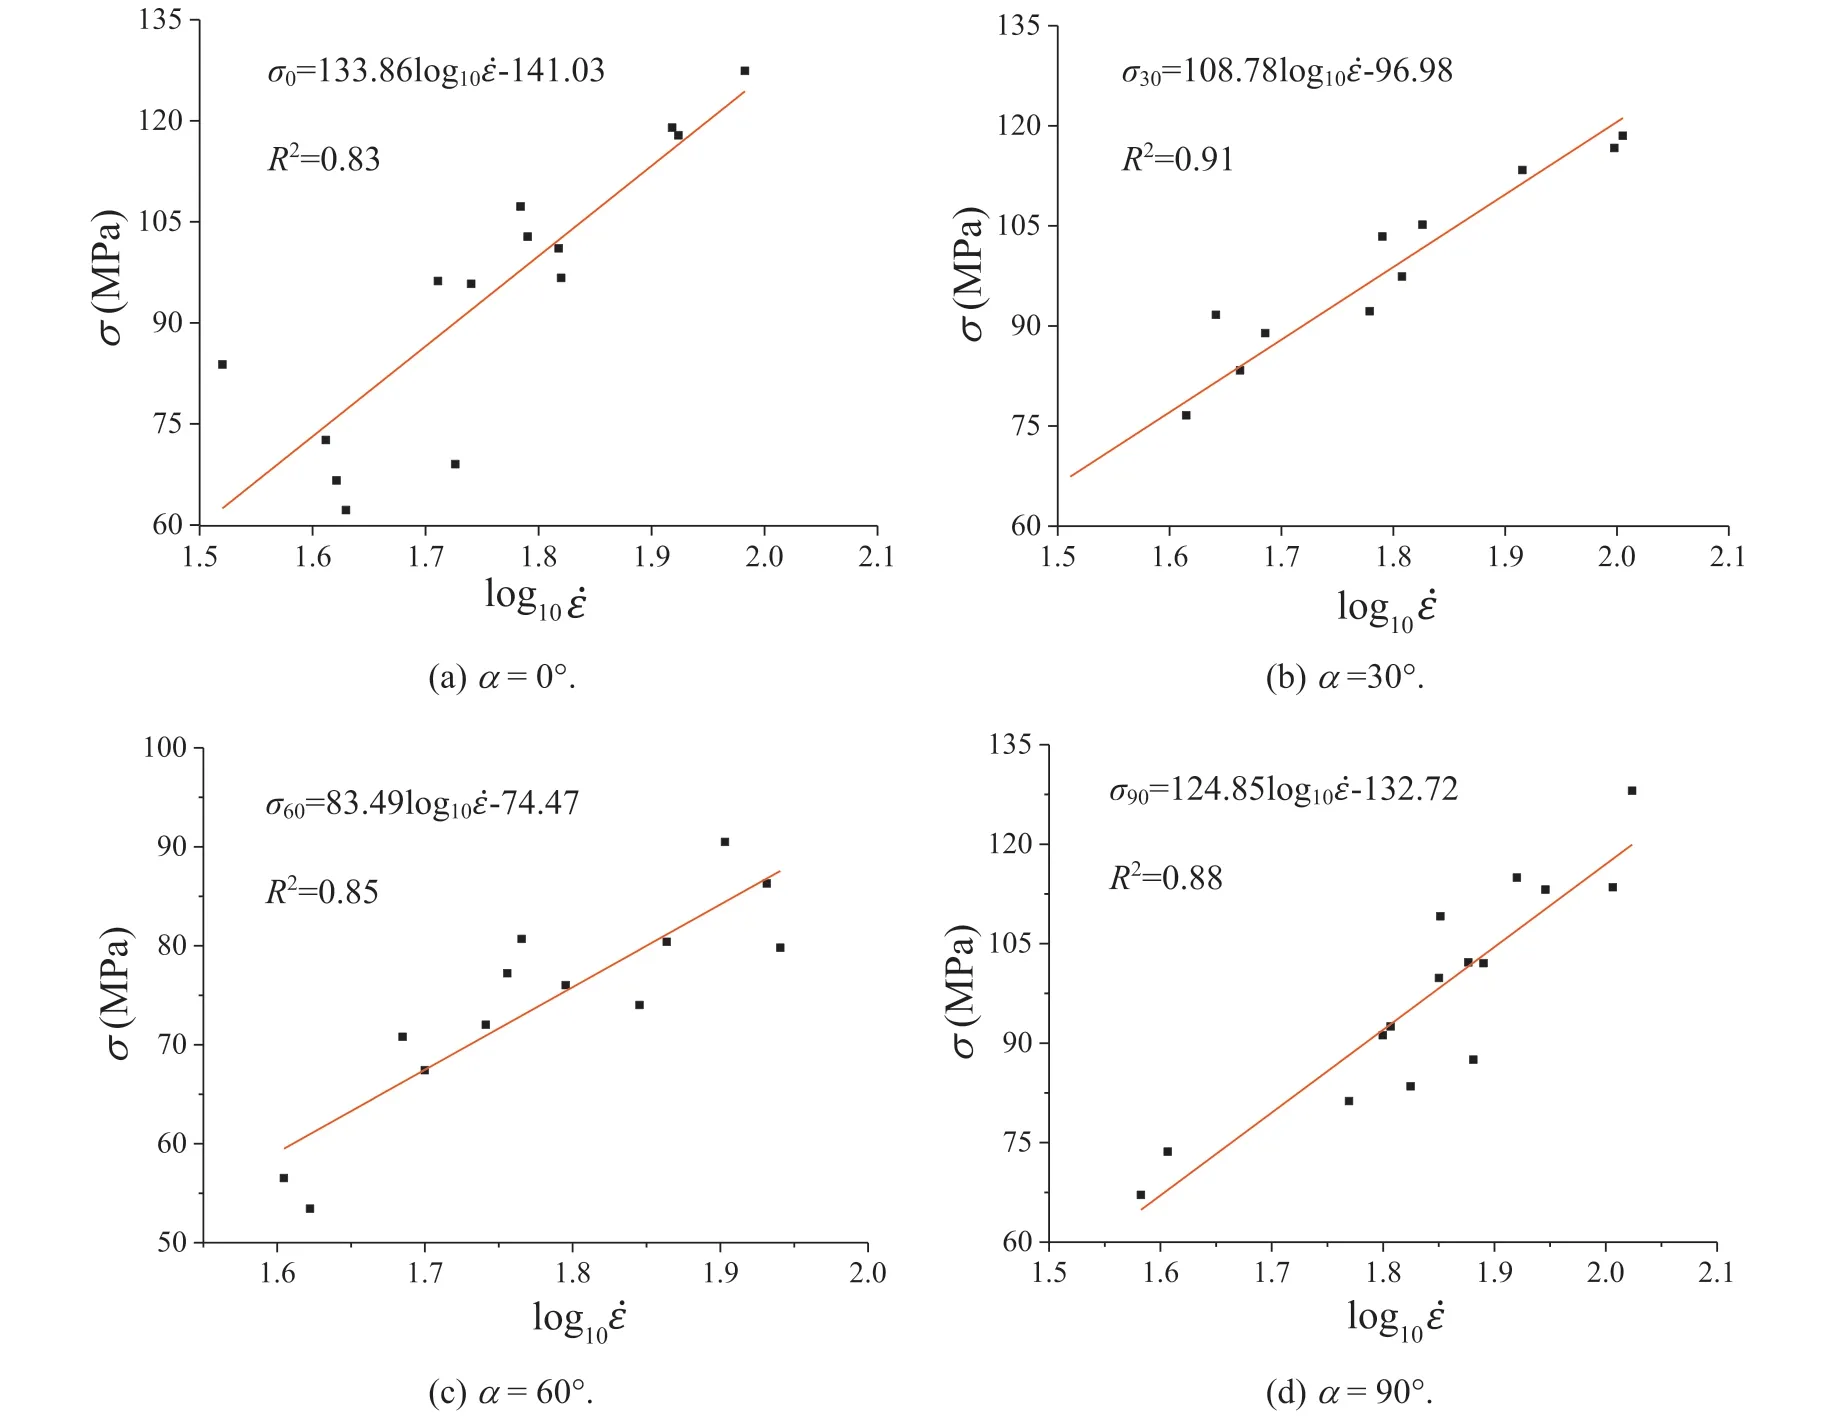
Fig.8.Relationship between σp and log10˙ε.
On the other hand,in Fig.9,the failure strain εp(at σp)was also found to increase almost linearly with the increase of strain rate,˙ε,irrespective of the dip angle of bedding plane.Nevertheless,the bedding plane indeed affects the amount of the strain increase.Obviously,for the dip angle of α=60°,εpwas the least compared with that for the other three dip angles,which was consistent with the change of strength,as mentioned above.Nevertheless,the increase of failure strain εpappeared to be almost the same to the strain increase for the other three dip angles,as indicated by their similar slopes in Fig.9.
Furthermore,the increase of εpcan be quantified in terms of the strain rate changing from minimum to maximum values (the increased range for each dip angle was listed in Section 3.2 when illustrating Fig.7).The quantitative comparison shows that for α of 0°,30°,60°and 90°,εpvalues were increased by 54.5% ,78.6% ,58.6% and 76.7% ,respectively.
Finally, the dynamic elastic moduli of specimens, Ed, were calculated by the slopes of linear stages in stress-strain curves and the relationships of Edand ˙ε are shown in Fig.10.The results indicate that there appeared some fluctuations on the curves with the increase of ˙ε.The maximum Edvalues were 25.5 GPa,24.8 GPa,20.9 GPa and 23.1 GPa,while the minimum Edvalues were 21.6 GPa,21.5 GPa,18.5 GPa and 21.1 GPa,for α of 0°,30°,60°and 90°,respectively.Therefore,through the quantitative comparison,the percentages of the increases in maximum and minimum Edvalues were 15.5% ,13.3% ,11.6% and 8.6% ,respectively.Such an effect is not as significant as the effects on rock peak strength and failure strain.
3.3. Influence of dip angle on dynamic compressive properties
To study the influence of dip angle,α,on dynamic compressive properties of the mixed specimens,it is necessary to compare the testing results of the strain rate at different α values.However,because of the material heterogeneity and errors of the testing system,the strain rate could not be maintained the same even under the same impact gas pressure,and a small range of negligible error was unavoidable;therefore,only an averaged strain rate could be taken.For example,testing data from the two groups A and B of different averaged strain rates were collected,i.e.63.82 s-1(averaging 65.74 s-1,64.24 s-1,62.24 s-1and 63.06 s-1)and 83.67 s-1(averaging 83.9 s-1,82.31 s-1,85.24 s-1and 83.23 s-1).
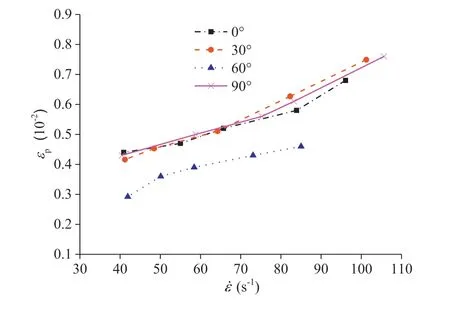
Fig.9.Relationship between εp and ˙ε.
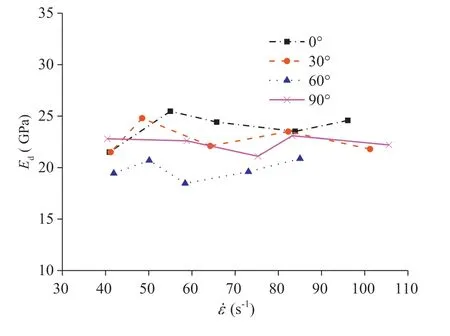
Fig.10.Relationship between Ed and ˙ε.
Figs.11-13 show the relationship curves of α with σp,εpand Ed,respectively,at the two strain rates of 63.82 s-1(group A)and 83.67 s-1(group B),respectively.Fig.11 indicates that the curves of groups A and B presented a similar trend,i.e.σpincreased first and then decreased with increase of α.The maximum and minimum values were found for α of 0°and 60°,respectively.The minimum strength was found for α=60°,which again was consistent with the findings in Fig.7 where the strengths for α=60°were the lowest,regardless of dip angles.
Quantitative comparison leads to that the percentage differences of the rock strength subjected to the two strain rates were 32.9% (for group A with 63.82 s-1)and 30.2% (for group B with 83.67 s-1).
Comparing Fig.11 with Fig.12,the minimum εpvalues were again found for specimens with α=60°,irrespective of the two loading or strain rates.As a comparison,εpvalues for the other three dip angles were quite close.
Unlike strength and strain,the dynamic elastic modulus,Ed,appears not so sensitive to the change of strain rate.As plotted in Fig.13,increasing the strain rate from 63.82 s-1(group A)to 83.67 s-1(group B)appeared to not cause the increase of Edfor all dip angles.Indeed,Edvalues for α of 30°and 90°were increased due to the increase of strain rate;while for α of 0°and 60°,their Edvalues were reduced.However,note that no matter increase or reduction in Ed,the amount of the change was slight,compared with the change of strength in Fig.11 and strain in Fig.12.Interestingly,once again,Edfor α=60°presented the lowest value,which was consistent with its lowest values in strength(Fig.11)and strain(Fig. 12). It is therefore evident that α = 60°may become problematic when excavating in layered composite rock masses,which requires careful analysis and treatment to stabilise or support during excavation.
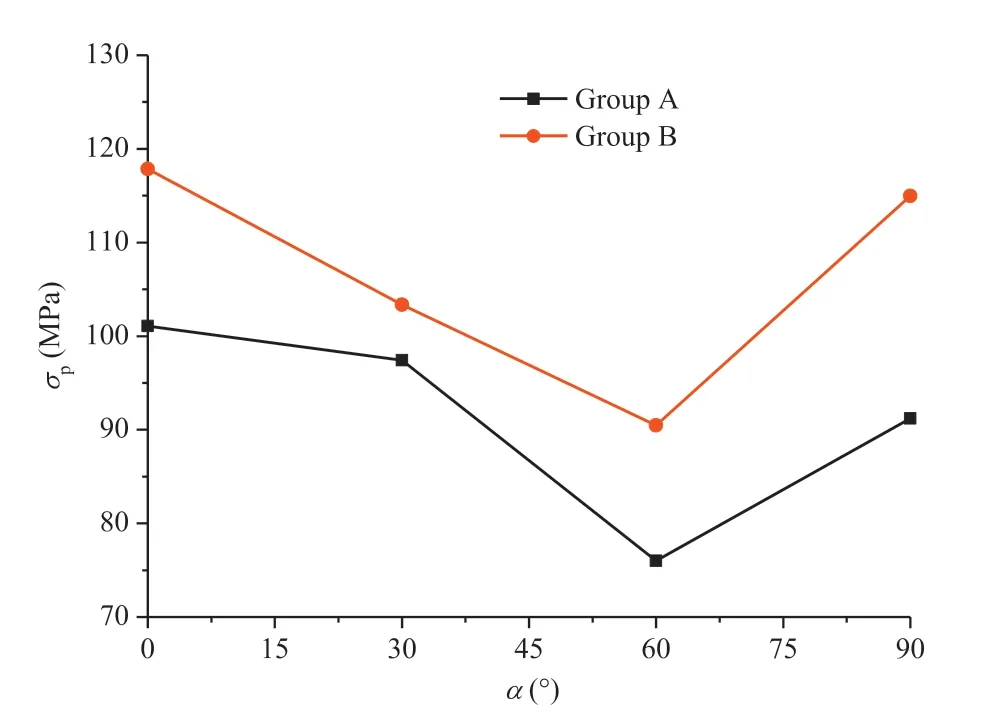
Fig.11.Relationship between σp and α.
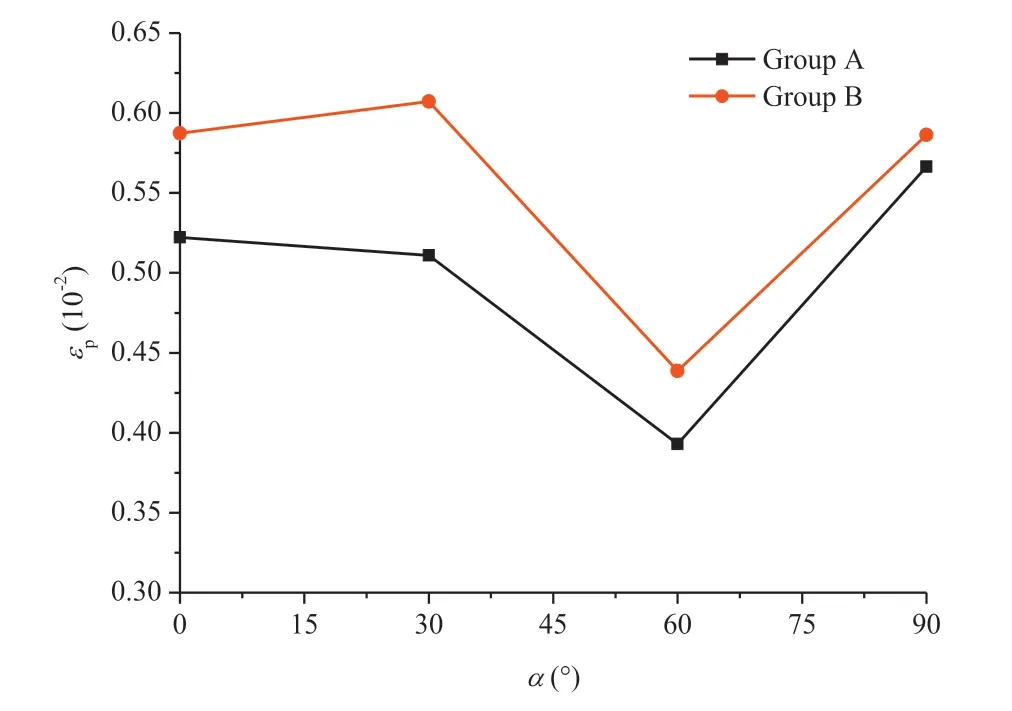
Fig.12.Relationship between εp and α.
3.4. Failure modes of the layered composite specimens
A high-speed camera was used to record the dynamic process of crack propagation in specimens of different dip angles.Types,numbers and locations of cracks have been investigated to determine the failure modes of the specimens.Fig.14 shows the observations of crack propagations at different α values when the impact gas pressure was set to 0.7 MPa.Their counterpart sketches of the main cracks were drawn below each test observation.The solid and dash lines,respectively,represent the locations of bedding planes and micrographic cracks,and the width of the solid lines denotes the width of the cracks.The features of the cracks for each dip angle are described below:
(1)Fig.14a indicates that the crack was first initialised by tension in the right and left layer A,splitting up both layers approximately from its centre horizontal level.This is firstly accompanied by one,and immediately by two shear-induced near-symmetric cracks crossing the middle layer B at acute angles to the wave transmitting direction.At the end of the dynamic loading,the existing cracks were widened significantly with a tensile stress-crack opening in both the right and left material A and shear stress-crack opening in the middle material B.
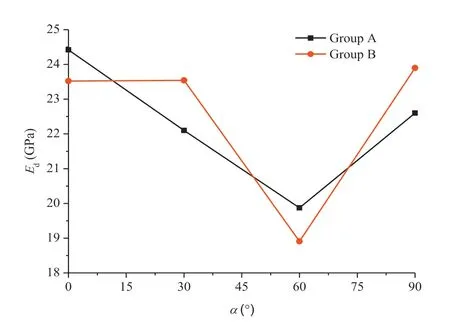
Fig.13.Relationship between Ed and α.
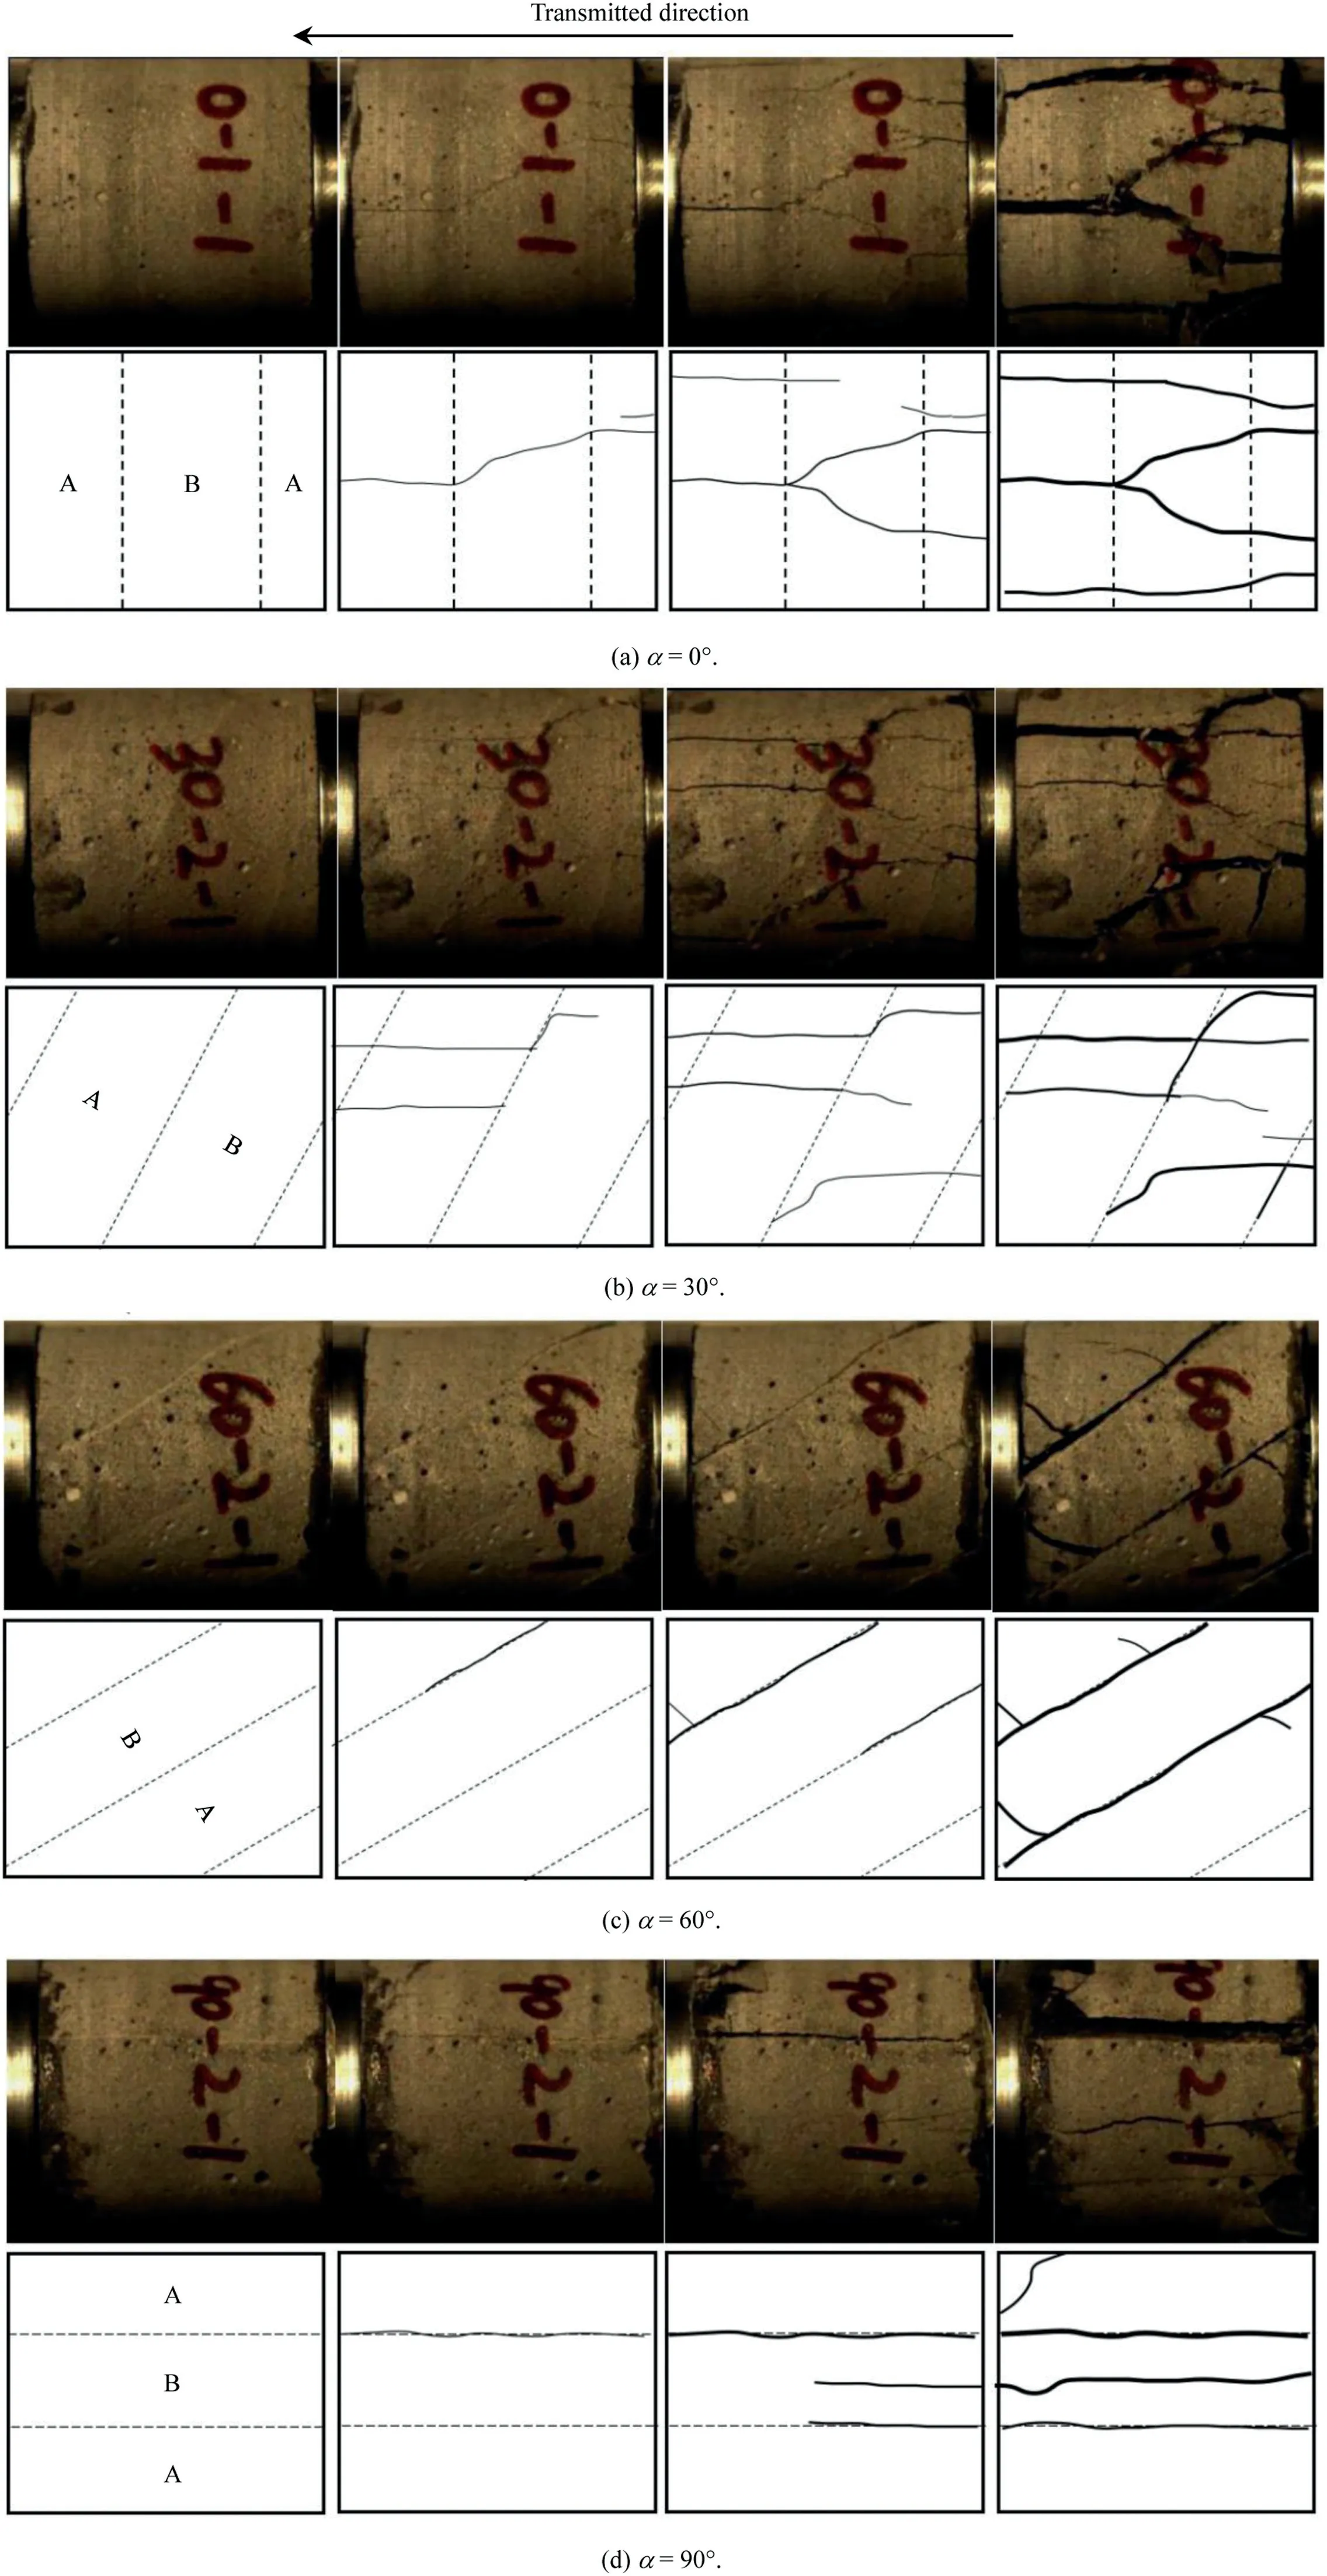
Fig.14.Process of dynamic failure for different specimens at the strain rates of(a)60.84 s-1,(b)64.24 s-1,(c)56.98 s-1,and(d)76.06 s-1.
(2)Fig.14b presents the process of dynamic failure when α=30°.At the beginning of loading,the cracks along the loading direction appeared first due to the tensile stress.Shear cracks initiated along the bedding plane when tensile cracks were traversing the bedding planes.Then,the cracks propagated continually,and the opening of shear-induced crack became more extensive with increasing number of cracks.In the end,tensile cracks traversing bedding plane penetrated the whole specimen,leading to severe fracture of the rock specimen.
From the above findings,a general conclusion might be drawn that the hard material A(UCS=58.94 MPa)appeared to be damaged by tensile failure, while the weak material B(UCS=35.28 MPa)by shear failure.Furthermore,bedding planes appeared to have less control effect on the development of the cracks;the significant factor still relies on the material strength when the dip angle is perpendicular or near-perpendicular to the wave transmitting direction.However,with increase of the dip angle of the bedding plane,the failure was dominated by the inclination of bedding plane,for example:
(3)Fig.14c describes the process of dynamic failure for α=60°.One shear crack along bedding plane appeared first and immediately followed by second and third ones along with the other two interfaces.The cracks propagated continually and through the whole specimen,expanding their opening along the bedding planes.Bedding planes,in this case,played a significant role in controlling the initialisation and propagation of the cracks.
(4)Similar to the case of α=60°,Fig.14d presents the dynamic failure process of the specimen of α=90°.During the loading process, a tensile stress-induced crack appeared first,breaking the specimen along the upper bedding plane,and a second tensile crack appeared at the lower bedding plane with the appearance of a tensile crack at the middle of the layer B.At the end of loading,the specimen was split up from the bedding layers.This again highlights the significance of the bedding plane in controlling the rock fracture pattern for the dip angles being parallel or near-parallel to the wave transmitting direction.
From the above observations(1)-(4),the failure modes of the layered composite specimens at different α values include four patterns:(1)tensile failure crossing bedding plane(Fig.14a),(2)tensileshear failure crossing bedding plane(Fig.14b),(3)shear failure along bedding plane(Fig.14c),and(4)tensile failure along bedding plane(Fig.14d).The dip angle of bedding plane(α)indeed plays a significant role in failure mode for bedding planes with α >30°,as seen in Fig.14c and d.However,if the dip angle,α,is not sufficiently large,i.e.less than 30°,the failure planes are mainly crossing but not along the bedding planes,as observed in Fig.14a and b.
4. Numerical simulations
Counterpart numerical simulations were conducted using PFC2D with the purpose of(1)reproducing the above testing findings,from which the model parameters could be calibrated,and(2)generating a full range of dip angles and strain rates to examine their influences on layered composite rocks.
4.1. Numerical model establishment
At present,many scholars have used 2D simulation to study the impact mechanical properties of rocks,such as Li et al.(2014,2018).To make sure that simulation is in accord with the test,the numerical model shown in Fig.15 was created following the profile of the test dimensions in Central South University.The diameters of bars and specimen are both 50 mm;the lengths of incident and transmission bars are 1.5 m and 0.75 m(in Fig.15a)(Li et al.,2014),respectively.The diameter of the striker is 50 mm(in Fig.15b).
To ensure high computational efficiency and accuracy,the particle diameter of the bar was set to 0.9-3 mm.The particles in the contact plane of specimen and bar were properly arrayed to reduce the dispersion effect of stress wave,and the diameter of the particles was set to 0.9 mm(in Fig.15c).Also,the viscous contact damping is used and local damping is set to zero,as per the suggestion by Itasca(2008):“A better approach for particles moving through space and impacting other particles is to set local damping to zero,and use either viscous contact damping,or a hysteretic damping contact model”.
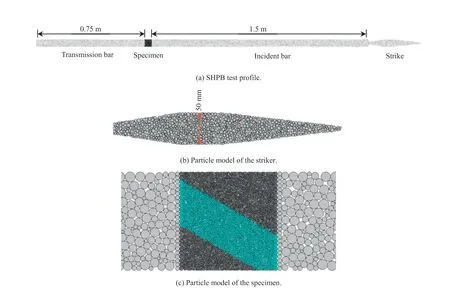
Fig.15.Establishment of numerical model.
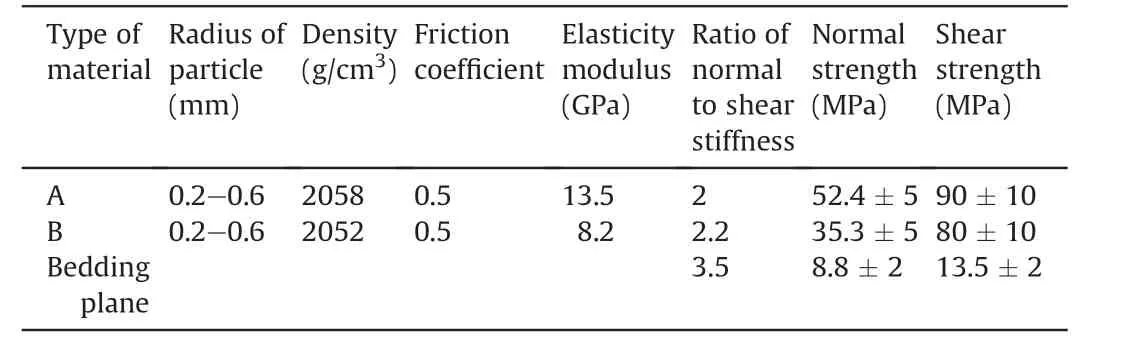
Table 3 Micro-parameters of materials A,B and bedding plane.
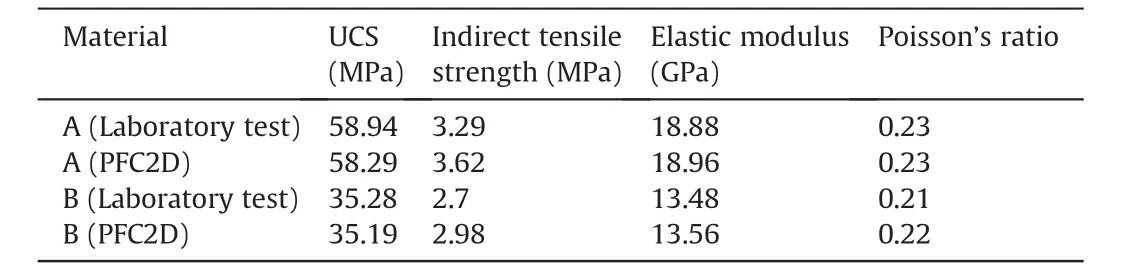
Table 4 Mechanical properties of materials A and B used in the laboratory test and PFC2D simulation.

Table 5 UCS values of mixed specimens used in the laboratory test and PFC2D simulation.
4.2. Parameter calibration and model verification
Appropriate micro-properties are vital factors that guarantee the computational reliability of PFC2D.Considering the bars elastically responded during testing,the contact bond strength is therefore assumed to be extremely large,e.g.10100MPa.According to mass conservation law,the density of particles is 7894.7 kg/m3by calculation.
Micro-parameters of mixed specimen mainly consist of three parts:micro-parameters of materials A,B and bedding plane.There were five steps to calibrate micro-parameters for this simulation:
(1)Calibrate the micro-parameters of materials A and B by laboratory uniaxial compression tests;
(2)Modify the micro-parameters by laboratory Brazil disc tests;
(3)Calibrate the micro-parameters of the bedding plane by laboratory tests on the layered composite specimens;
(4)Modify the micro-parameters of the bedding plane by comparing the simulation results of different dip angles to the results of laboratory tests;and
(5)Modify the micro-parameters by dynamic impact tests.
The calibrated micro-parameters are listed in Table 3.Tables 4 and 5 list the comparisons between the laboratory test and PFC2D simulation for materials A,B and mixed specimens.The results indicate that the calibrated micro-parameters appropriately reflected the tested specimen properties.
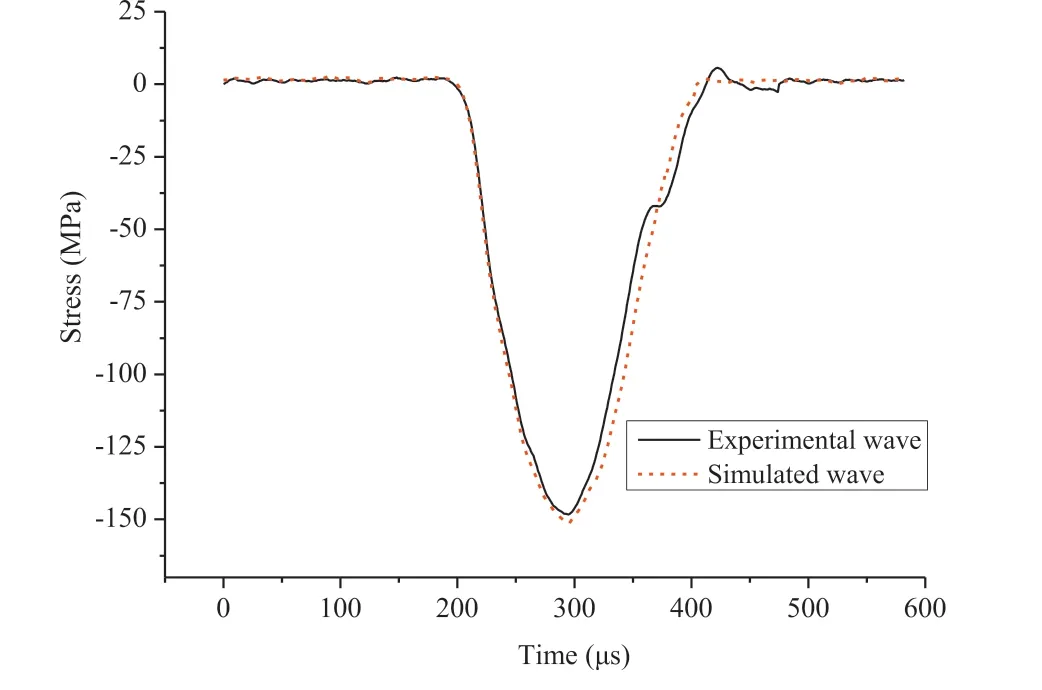
Fig.16.Comparison of incident waves obtained by laboratory test and numerical simulation.
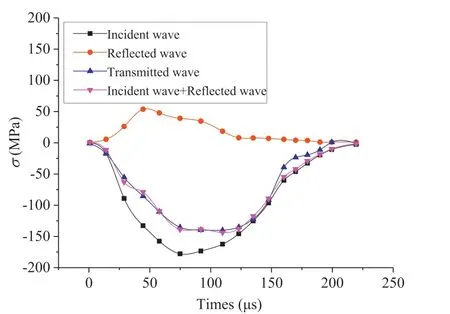
Fig.17.Verification of stress equilibrium.
Fig.16 shows a comparison of the incident waves obtained by the experiment and simulation.They are measured under the same impact velocity of 10 m/s.We find that the simulated wave is almost identical to experimental one.
Also,Kuhlemeyer and Lysmer(1973)pointed out that through finite element simulation,wave propagation can be accurately simulated when the wavelength is at least greater than 10 particles.The rationality of the above conclusion has been verified by Zhang et al.(2016)using the PFC method.It can be seen from Fig.16 that the half-wavelength propagation time in the incident rod is about 200 μs,and the wave propagation speed in the rod is about 5400 m/s,thus the wavelength reaches the metre level.While the maximum particle size in the simulation is 3 mm,the wavelength is much larger than 10 times the particle size and the simulation accuracy can be therefore guaranteed.
Furthermore,the above-calibrated model parameters lead to the equilibrium status as plotted in Fig.17,where the superposition of incident and reflected waves nearly fully coincides with the transmitted wave.
Numerical results of stress-strain relationship under two different strain rates for two dip angles of bedding plane were obtained and compared with their experimental counterparts,as plotted in Fig.18.Good agreement from the comparisons is noticed,indicating the correctness or accuracy of the numerical modelling against laboratory tests.The superior performance of the numerical simulation is further validated by comparing the numerically obtained failure modes for various dip angles of bedding plane against the experimental observations,as shown in Fig.19(the black symbols for the tensile cracks while the red symbols for the shear cracks).

Fig.18.Comparison of stress-strain curves obtained from laboratory test and numerical simulation.
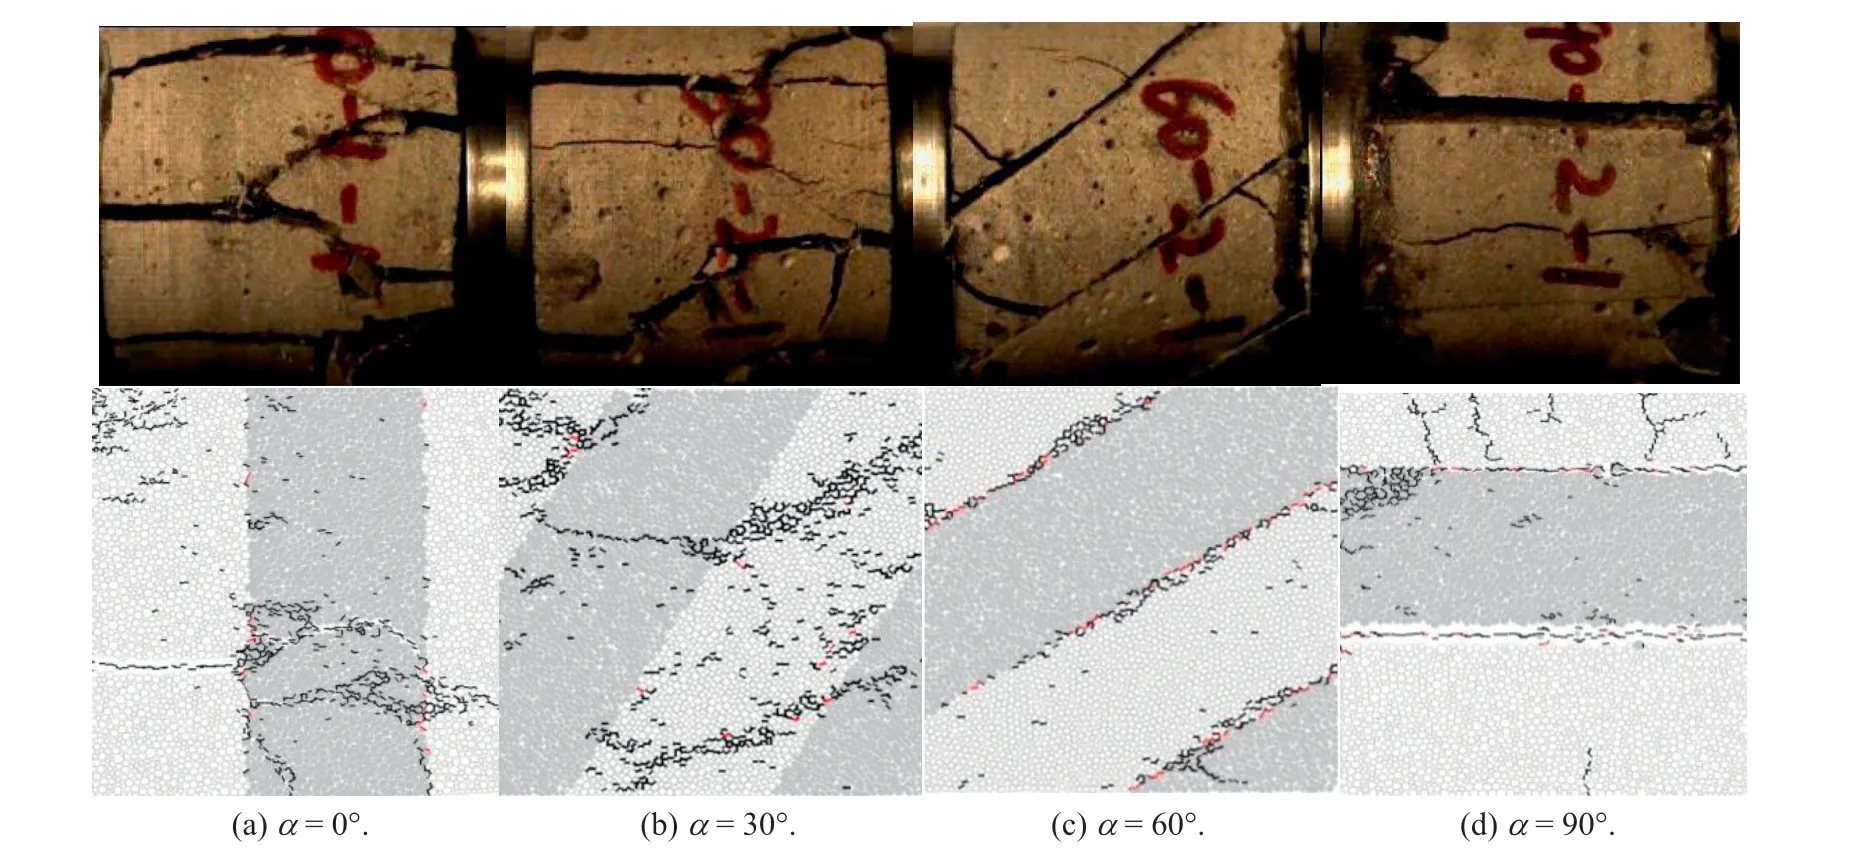
Fig.19.Comparison of failure mode between laboratory test and numerical simulation at the strain rates of(a)56.8 s-1,(b)65.3 s-1,(c)65.6 s-1,and(d)62.8 s-1.
The comparisons of the incident waves,stress-strain curves and failure modes from the laboratory tests and numerical simulations confirm that the numerical simulations enable us to accurately simulate the dynamic failure properties of the layered composite rock specimens.Therefore,in the next section,the ranges of the investigated dip angle and strain rate would be reasonably extended to provide a complete picture of the dynamic features of the layered composite rock.
4.3. Numerical results
4.3.1. Influence of dip angle on dynamic compressive properties of simulated composite rocks
With the numerical modelling,the influence of dip angle of bedding plane,α,on σp,εpand Edcan be investigated by more choice of the angle,i.e.0°,15°,30°,45°,60°,75°and 90°.Similarly,the strain rates can be assigned with more choice as well,i.e.150 s-1for group I,200 s-1for group II,250 s-1for group III,and 300 s-1for group IV.
Similar to but more than the results in Fig.11,our numerical results confirm that the higher the strain rate,the larger the rock strength under the four strain rates;consistently,the minimum strength was also found for the dip angle equal to 60°.Thanks to the numerical simulation with a broader range of dip angles,the rock strength curves in Fig.20a were much smoother than those in Fig.11 containing only four test data for each curve.Therefore,not only providing similar features,Fig.20a enables to demonstrate a full and much better view of the rock strength changing with the dip angle under various strain rates.
Similarly,better views of εpand Edchanging withα and strain rate are presented in Fig.20b and c.Numerical results are also found to be consistent with their experimental counterparts in Figs.12 and 13.For example,the lower the strain rate,the smaller the εp;for any strain rate,the lowest εpwas found at α=60°;and the influences of strain rate and dip angle on Edare not as evident as those on rock strength and strain.All these numerical findings confirm and extend the experimental observations,providing a complete picture on dynamic properties of the layered composite rocks.
4.3.2. Failure modes of the simulated layered composite specimens

Fig.20.Influences of α on σp,εp and Ed(Groups I-IV correspond to strain rates of 150 s-1,200 s-1,250 s-1,and 300 s-1,respectively).
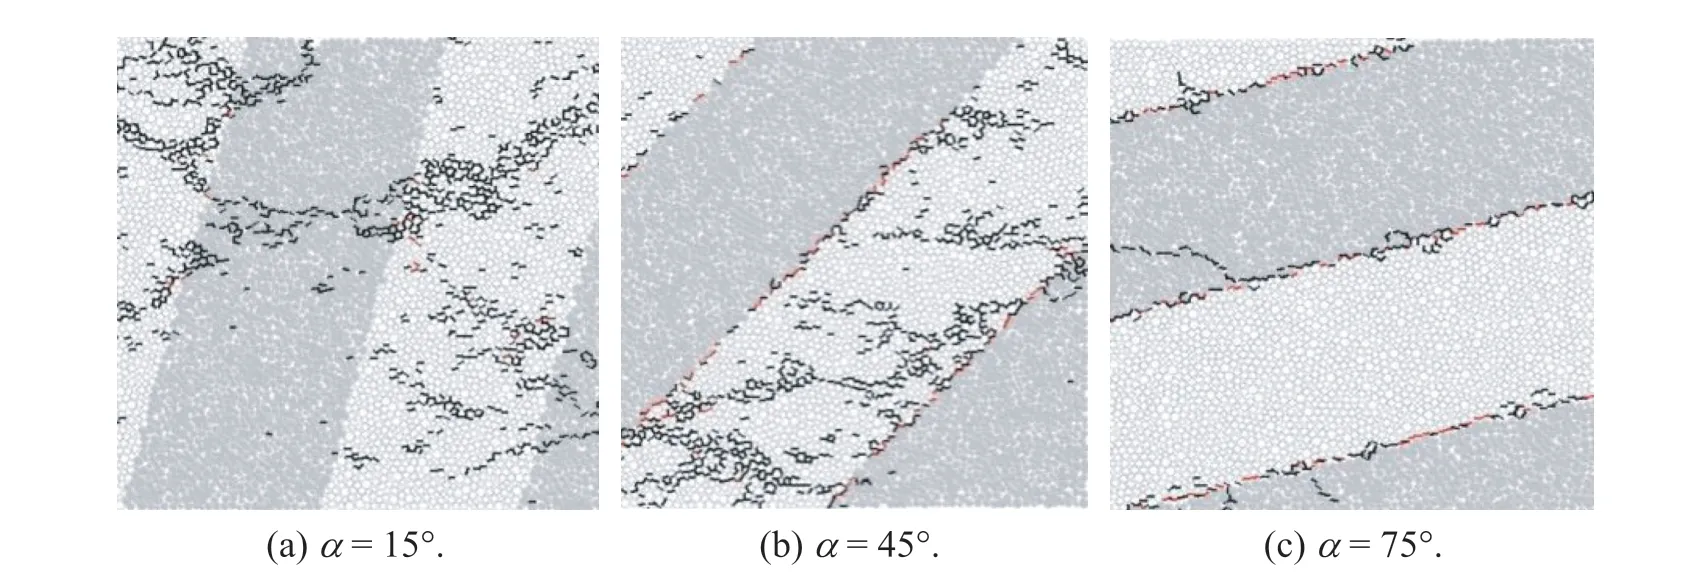
Fig.21.Failure modes of rock specimens at different α values under the strain rates of(a)59.2 s-1,(b)60.8 s-1,and(c)65.6 s-1.
With our numerical modelling,the failure modes at different α values that were missed in our experiments could be analysed,i.e.α=15°,45°,and 75°.Their crack patterns are presented in Fig.21 where our previously defined failure pattern(2)for α=15°,failure pattern(3)for α=45°,and failure pattern(4)for α=75°were evident.Once again,through our numerical simulation,the four generalised failure patterns are confirmed.
5. Conclusions
The paper aims to investigate the dynamic properties of a layered composite rock mass of high variations in stratigraphy strength.The investigation was conducted using a series of laboratory tests and numerical simulations. Fundamental rock properties such as strength,strain and dynamic modulus were studied under various influence factors such as strain rate and dip angle of bedding plane.From our investigations,the following conclusions can be drawn:
(1)Rock strength increases with the increase of strain rate,presenting approximately a linearly increasing relationship when plotting the results in a semi-logarithmic graph.Failure strain corresponding to the rock strength is also found to be almost linearly increased with the increase of strain rate.However,the dynamic modulus changes chaotically and slightly under the tested strain rate between 45 s-1and 105 s-1.
(2)Increasing dip angle of bedding plane leads to the nonmonotonic changes of the rock strength,failure strain and dynamic modulus;nevertheless,all their lowest values are for the rocks with α=60°,indicating that the minimum interface shear strength is along that dip angle under the impact loading.
(3)Four cracking failure modes under dynamic loading condition are concluded: (1) tensile failure crossing bedding plane(Fig.14a),(2)tensile-shear failure crossing bedding plane(Fig.14b),(3)shearfailurealongbeddingplane(Fig.14c),and(4)tensile failure along bedding plane(Fig.14d).The dip angle of beddingplanewasfoundtocontrolthefailuremodeforbedding planes parallel or near-parallel to the dynamic wave transmitting direction;otherwise,if the bedding planes are perpendicular or near-perpendicular to the wave direction,the failure mode of the composite rock is determined by rock strength.
(4)Our numerical simulations using PFC2D modelling not only reproduce and confirm the experimental observations but also extend to provide a complete image(including more full ranges of strain rates and dip angles)about the dynamic properties of the layered composite rocks.
Declaration of Competing Interest
The authors wish to confirm that there are no known conflicts of interests associated with this publication and there has been no significant financial support for this work that could have influenced its outcome.
Acknowledgments
This study was supported by the National Natural Science Foundation of China(Grant No.51608174)and the Programmes for Science and Technology Development of Henan Province,China(Grant No.192102310014).
 Journal of Rock Mechanics and Geotechnical Engineering2020年2期
- Journal of Rock Mechanics and Geotechnical Engineering的其它文章
- Mountain tunnel under earthquake force:A review of possible causes of damages and restoration methods
- Determination of full-scale pore size distribution of Gaomiaozi bentonite and its permeability prediction
- Sugarcane press mud modification of expansive soil stabilized at optimum lime content:Strength,mineralogy and microstructural investigation
- Centrifuge model test and numerical interpretation of seismic responses of a partially submerged deposit slope
- Reliability analysis of earth dams using direct coupling
- Anisotropic surface roughness and shear behaviors of rough-walled plaster joints under constant normal load and constant normal stiffness conditions