
Weighted-averaging-based classification of laser-induced breakdown spectroscopy measurements using most informative spectral lines
2020-01-10 07:40:46EktaSRIVASTAVAHyeminJANGSunghoSHINJangheeCHOISunghoJEONGandEuiseokHWANG
Plasma Science and Technology 2020年1期
Ekta SRIVASTAVA, Hyemin JANG, Sungho SHIN, Janghee CHOI,Sungho JEONG and Euiseok HWANG
1 School of Mechanical Engineering, Gwangju Institute of Science and Technology (GIST), 123 Cheomdangwagi-ro, Buk-gu, Gwangju 61005, Republic of Korea
2 LG CNS, LG Sciencepark E13, 71, Magokjungang 8-ro, Gangseo-gu, Seoul 07795, Republic of Korea
3 Smart Manufacturing Technology Group, Korea Institute of Industrial Technology, 89 Yangdaegiro-gil,Seobuk-gu, Cheonan-si, Chungcheongnam-do 31056, Republic of Korea
Abstract In this study,efficient spectral line selection and weighted-averaging-based processing schemes are proposed for the classification of laser-induced breakdown spectroscopy(LIBS)measurements.For fast on-line classification,a set of representative spectral lines are selected and processed relying on the information metric, instead of the time consuming full spectrum based analysis. The most informative spectral line sets are investigated by the joint mutual information estimation (MIE)evaluated with the Gaussian kernel density, where dominant intensity peaks associated with the concentrated components are not necessarily most valuable for classification. In order to further distinguish the characteristic patterns of the LIBS measured spectrum, two-dimensional spectral images are synthesized through column-wise concatenation of the peaks along with their neighbors.For fast classification while preserving the effect of distinctive peak patterns,column-wise Gaussian weighted averaging is applied to the synthesized images, yielding a favorable trade-off between classification performance and computational complexity. To explore the applicability of the proposed schemes,two applications of alloy classification and skin cancer detection are investigated with the multi-class and binary support vector machines classifiers,respectively.The MIE measures associated with selected spectral lines in both applications show a strong correlation to the actual classification or detection accuracy, which enables to find out meaningful combinations of spectral lines.In addition,the peak patterns of the selected lines and their Gaussian weighted averaging with neighbors of the selected peaks efficiently distinguish different classes of LIBS measured spectrum.
Keywords: laser-induced breakdown spectroscopy, mutual information, weighted averaging,alloy classification, skin cancer detection(Some figures may appear in colour only in the online journal)
1. Introduction
Laser-induced breakdown spectroscopy (LIBS) is an atomic spectroscopy technique [1] which has undergone rapid development as an analytical technique over the past decade because of its several merits[2,3].LIBS measurement has been applied in a variety of fields,such as medical[4,5],environmental[6,7],food [8, 9], agricultural [10], and engineering applications [11].
As one of the many of the LIBS applications, metal sorting has gained considerable importance in recent years because of its commercial value [12-14]. LIBS has potential to provide accurate qualitative and quantitative analyses of subject matter[15-17].However,LIBS technique may suffer from performance degradation by undesired photonic effects such as the self-absorption [18], matrix effect [19, 20], and shot-to-shot fluctuations [21]. In order to mitigate such nonlinear effect,several algorithmic approaches are proposed like self-absorption corrected normalization [22, 23] and quantitative methods for compensation of matrix effects [24, 25].
Alternatively, LIBS is also being explored as a surgical tool for elemental analysis of ablated tissues [26-28]. LIBS can provide real-time feedback regarding the elements in an ablated sample [29], called biomarkers, which facilitates identification of malignant lesions from tissue samples[5, 30, 31]. However, the disadvantages of LIBS (for example, shot-to-shot fluctuation of the LIBS signals and the inhomogeneity of the sample and ablation crater sizes)persist for biological LIBS measurements[2].Furthermore,the highdimensional spectrum may be redundant for elemental analysis because typical spectral emissions are sparsely represented,showing only a small number of peaks on the order of magnitude weaker background. Some of the peaks may be noisy and contain no information needed for the quantitative analysis or classification. In regards to fast/online real-time identification of samples,spectral line selection based on PCA results and prior information about constituent elements of each group has been studied to validate the claim that few informative spectral lines can perform well instead of the whole spectrum for analytical tasks like classification [25].Thus, the selection of a small subset of useful spectral lines that are highly correlated to the analysis can be helpful for improving the sorting speed and performance [32, 33].
In this study, the root means square (rms) normalization scheme is employed for reducing shot-to-shot fluctuation in alloy samples and the spectral line sets of most influential combinations are extracted by the joint mutual information estimate (MIE) [25]. In addition, the section of characteristic spectral lines for cancer detection is also evaluated using joint MIE.Two-dimensional(2D)spectral images and a weightedaveraging-based (WA) spectral line processing schemes are also proposed in this paper for fast on-line classification while taking into account the characteristic peak patterns. These schemes are implemented for two classification applications using LIBS measurements. For the alloy analysis, classification using a multi-class support vector machine (SVM) classifier is performed for sixteen alloys of three different bases.For skin cancer detection, samples from real skin tissue of melanoma-implanted mice are analyzed under various experimental conditions that affect the classification accuracy and classification with a binary SVM classifier is evaluated.Evaluation results in both applications show that the MIE measures associated with selected spectral lines show a strong correlation to the actual classification or detection performance, and Gaussian weighted averaging with neighbors of the selected peaks efficiently distinguishes different classes of LIBS measured spectrum.
The rest of the paper is organized as follows. Section 2 describes the LIBS experimental setup and characteristics of its measurements along with the background. Section 3 explains the procedure for most informative spectral line selection scheme.Section 4 elaborates the proposed Gaussian weighted averaging approach. Then, section 5 shows evaluation results of proposed schemes for two LIBS-based classification applications. Finally, we present our conclusions in section 6.
2. Background
2.1. LIBS experimental setup
2.1.1. Alloy samples. The proposed scheme was evaluated for three different alloy bases: Al, Cu, and Fe. For Al base alloys,two different NIST[34]Standard Reference Materials(SRMs/CRMs) were used: Al-232/02 and Al-134/05. For the Cu base group,seven kinds of alloy were used:Cu-1107,Cu-1110, Cu-1111, Cu-1112, Cu-1113, Cu-1114 [32], and the Brammer Standard BS110B [35]. Seven alloys were also included in the Fe-base group: Fe-C1137, Fe-1138, Fe-1139,Fe-C1145, Fe-C1173, Fe-C1291, and Fe-C2424. The compositions of the candidate samples listed in table 1 show that, apart from the major content of their bases being Al, Cu, and Fe, there were also variations of the minor content,i.e.Cr,Ni,Si,Zn,Mn,C,Mo,and Mg.As same-base alloys share core elements and other minor elements, their classification is difficult compared to that for different-base alloys.
A commercial LIBS system(RT250-EC,Applied Spectra Inc.,USA)was used for LIBS measurement of alloy samples(CRM measurement), where a second harmonic Q-switched Nd-YAG laser (top hat profile) of 532 nm wavelength with a pulse width of 5 ns was used to ablate the sample (illustrated in figure 1). The pulse energy was 3.64 mJ with 20.6 J cm?2fluence. Laser spot diameter was fixed as 150 μm. 5×objective lens (LMH-5X-532, 0.13 NA, Thorlabs, USA) was used in this experiment and the laser spot diameter at sample surface was adjusted by varying the distance between the two lenses of the beam expander. The actual spot diameter at sample surface was verified from the diameter of ablation crater produced on silicon wafer at threshold ablation energy.The profile of ablation craters was measured with a scanning confocal microscope. LIBS spectra were collected from ten different locations on each sample and each measurement spot was ablated by 11 shots.Excluding the first shot at each spot as a cleaning pulse.A total of 100 spectra were included in the evaluation for each alloy sample.Plasma emission was collected using two plano-convex collection lens (LA4148,f = 50.2 mm, Thorlabs, USA) placed at 45° and was transmitted to the six-channel CCD spectrometer via an optical fiber bundle (range 187-1045 nm, 12 288 points,0.068 nm resolution)with a gate-width of 1.05 ms and a gate delay of 0.2 μs for which signal to background ratio became maximum, by controlling a delay generator in commercial system. Since actual resolution and spectral range were different for each channel, here spectral resolution was about0.1 nm [25]. Figure 2 shows a typical single-shot spectra for Al-134/05, Cu-1107 and Fe-1137.
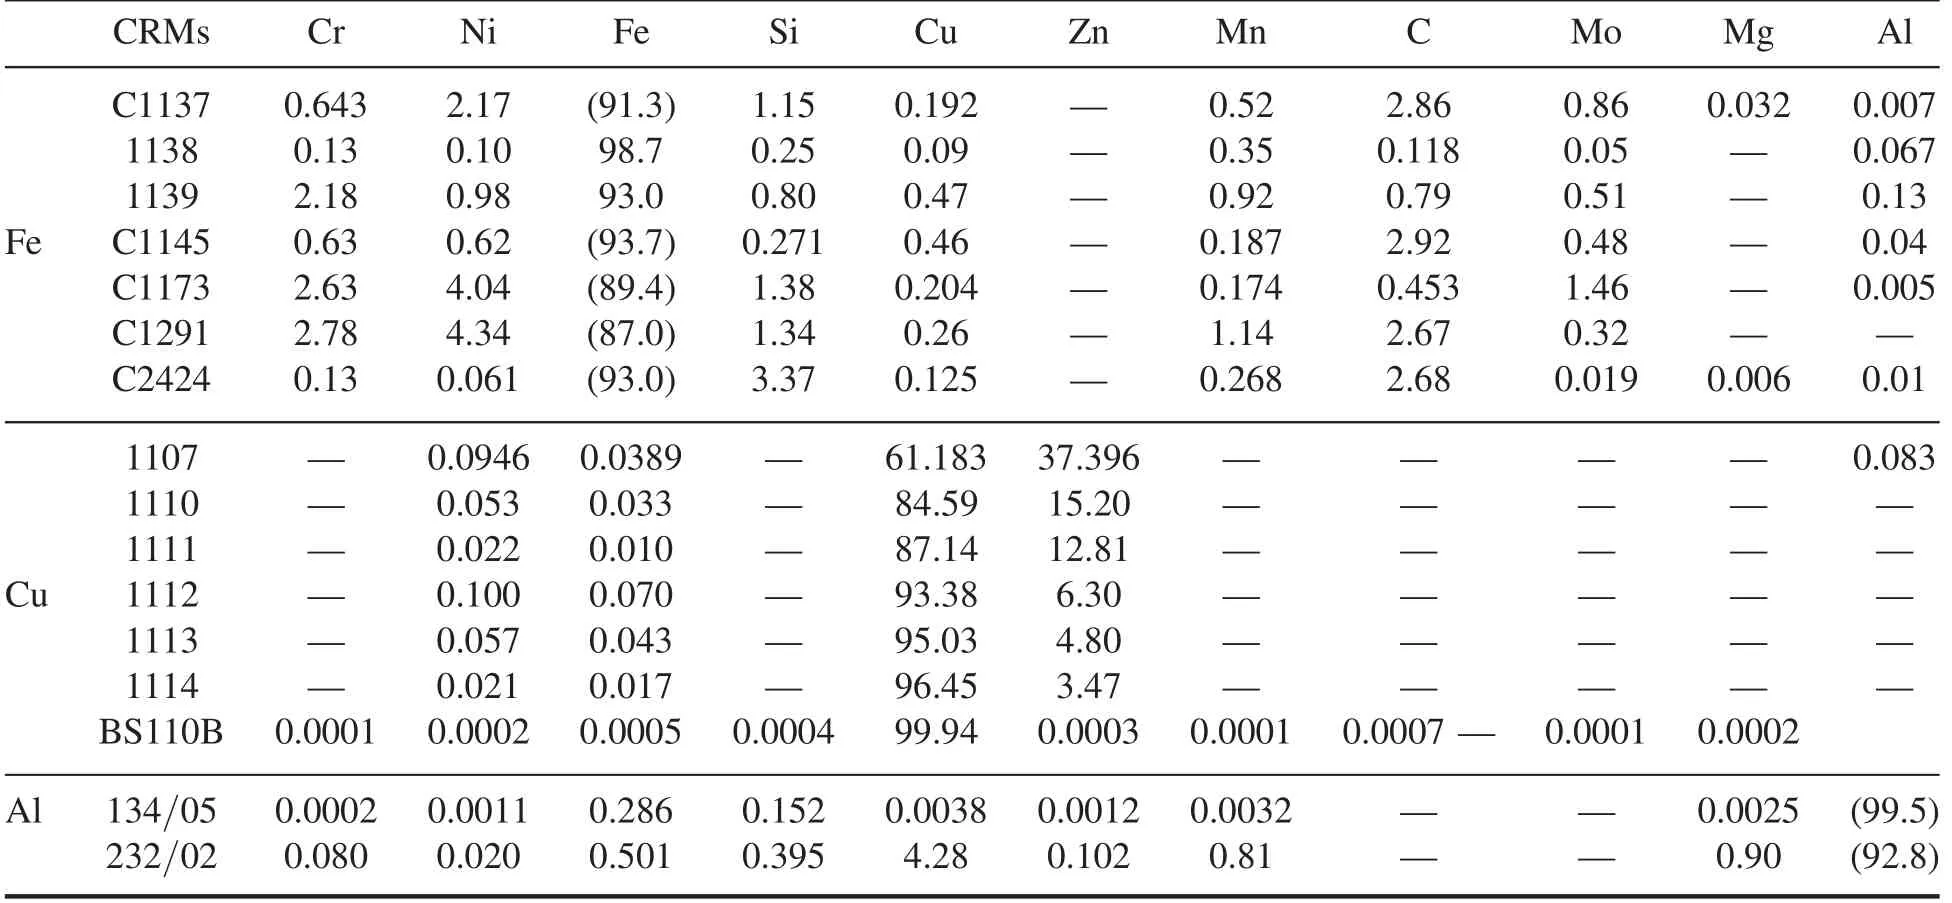
Table 1.Certified concentrations (%) of major and minor components in Fe, Cu, and Al alloys.
2.1.2. Skin tissue samples. For melanoma analysis,melanoma lesions were induced on the back of three hairless mice. 12 skin tissues including both melanoma and dermis were excised and ultimately one excised tissue sample for each was used for LIBS measurement. The details of melanoma development and LIBS sample preparation have been reported previously [2, 36]. All procedures were approved by the Animal Care and Use Committee of the Gwangju Institute of Science and Technology and performed in accordance with National Institute of Health (NIH)guidelines (GIST-05).
For the LIBS measurement of melanoma tissue samples, a diode-pumped ytterbium femtosecond (fs) laser (λ = 1030 nm;τ = 500 fs; s-Pulse HP, Amplitude systems) was used with argon as a buffer gas (15 l min?1). The pulse energy was set to 34.8 μJ [36]. An fs laser is more advantageous in generating LIBS plasma from biosamples due to its high intensity. An intensified charge coupled device (ICCD; PI-MAX3, Princeton Instruments, USA) was used to detect the plasma emission(grating = 1200 grooves mm?1,resolution ~0.1 nm,gain = 10).The gate width of the ICCD spectrometer was set to 50 ns with different values of gate delay. Given that the spectral width that can be covered by the ICCD was only about 100 nm, the measurement was repeated while changing the measurement regime over the entire wavelength region,which produced three spectral regions(250-350,350-450,730-830 nm,labeled Bands 1-3, respectively) that had meaningful emission signals. A total of 100 shots for melanoma and dermis samples were obtained for each band.Over these wavelength ranges,the Mg,CN band,Ca,and K signals could be detected. Figure 3 shows a single shot spectra from melanoma and dermis for all three bands with 0 and 20 ns gate delay.
2.2. Spectrum variability and normalization
The influence of emission signal fluctuations and the effect of number factors on the laser beam stability(laser pulse energy,repetition rate, delay time, number of laser shots etc) contribute to the variability of LIBS measurements [37-39]. The improvement of signal and the correction of these effects lead to pre-processing of the captured spectrum; hence normalization schemes have been studied [40-42]. Representative schemes like min-max normalization [43], normalization to matrix line considering matrix [44-46], normalization to the total spectral intensity and normalization to the internal standard peak have been studied for quantitative analysis with LIBS captures [47, 48].
Finding an internal standard consistent for a broad range of samples can be challenging. Thus, the rms normalization instead of the internal standard normalization was employed herein for the mitigation of undesired degradation in alloys of three different bases. Mutual information measures, which will be discussed later, can work as an indicator for normalized performance. The rms normalization is a method of adjusting raw data by dividing the full range of the spectrum by the rms intensity defined as the square root of the arithmetic mean of the squares of the values:
where xil,denotes the emission intensity at the wavelength index of l, 1 ≤ l ≤L of the ith shot. The obtained rms is equal to the scaled Euclidean norm mentioned in the background and this concept is similar with total energy.Thus,the superiority of the rms normalization, such as the normalization by the total spectral intensity, is caused by the maintenance of the raw spectra pattern, instead of other normalization methods. Moreover, the rms normalization effectively reduces the spectrum fluctuation like normalization with the total spectral intensity [40].
2.3. Spectral line selection
Although LIBS spectra are high-dimensional, only a small portion of spectral lines may contain most of the information for quantitative analysis or classification.Appropriate spectral line selection is an important task to enable an accurate and fast analysis with LIBS. Many recent studies on spectral line selection in LIBS actively examined various spectral line selection methods to efficiently extract the information related to analysis [32, 33, 49, 50]. The two representative types of spectral line selection methods are the following: (1) spectral line or range selection for each component of interest based on the National Institute of Standards and Technology(NIST), (2) informative feature extraction based on multivariate data analysis (MVDA) such as principal component analysis (PCA) [25].
On the other hand, for some applications, spectral line selection is done by experimental identification. The biomarkers can be experimentally identified through visual examination of the obtained spectra and the dominant peaks of those biomarkers are considered as set of selected informative spectral lines.
3. Joint mutual information estimation (MIE) based spectral line selection
Most of the information for quantitative analysis or classification in LIBS-captured spectrum focus on a small subset of spectral lines associated with the concentrated components of interest.Therefore,finding the most informative spectral lines is crucial for efficient spectrum processing for classification.However, exhaustively evaluating the classification accuracy for all combinations is infeasible given the large number of spectral lines,even for a finite number of peaks.Instead,joint mutual information is estimated based on Gaussian kernel[51] to measure the information for classification of the spectral lines.The mutual information is a relative measure so is less affected by the variations of LIBS configuration,remaining invariant to the measurement interruptions, as compared to other intensity based measures. The MIE of the individual spectral line, Xl, and the class, Y is given as follows:
where △lis the step for discretization andis the step for Gaussian assumption approximated at with d = 2 and σ as the average marginal standard deviation. Note that the most informative spectral lines are not necessarily the large individual information measured in equation (2), which are caused by the dependency on the spectral lines. Thus, joint mutual information must be separately evaluated as follows:
For three spectral lines,
where
Similarly, more spectral lines can be jointly evaluated for the joint mutual information measure, while the number of arguments is also limited on account of the complexity.For a larger number of selections, an additional approximation is needed for computational feasibility, as shown below:
where
and
The approximation in equation (9) becomes less accurate as the number of jointly selected spectral lines increases by dropping some conditions, whereas the inequality still holds since additional conditioning reduces mutual information.
4. Weighted-averaging-based spectral line processing
4.1. 2D spectral image
As noted previously, use of high dimensional LIBS spectra for analysis is computationally expensive and may generate defects in the obtained information [52]. The characteristic lines indicate the unique properties of each target and are crucial for acquisition of distinguishing information. Thus,characteristic spectral lines were selected based on joint MIE discussed in section 3 to reduce the number of lines with minor or no information loss. However, this line number is generally too small and the amount of information provided by the selected lines may be insufficient for reliable classification. Therefore, in this study, customized two-dimensional(2D) images synthesized from the spectrum were employed for efficient classification, where not only the selected lines,but also selected peak patterns corresponding to those lines were column-wise concatenated. These images were synthesized based on the selected spectral lines and their neighbors.Hence, a distinguishing feature space was created for classification. It is important to note that spectral image formation reduces the spectral dimensionality while conserving the distinguishing information.
2D spectral images corresponding to LIBS spectra are given in figure 4 for Al,Cu,and Fe sample measurements.As apparent from the rightmost column, the 2D images for the different bases are well distinguished; this is beneficial for both inter- and intra-class classification. From the steps in figure 4, it is evident that consequential reduction in the dimension of the leftmost column is achieved; the full spectrum is reduced to selected peaks × neighbors and the equivalent spectral image is obtained.
4.2. Weighted average (WA) using Gaussian weight
Because of the uncertainty in the raw spectrum,instead of the intensity data of that spectrum, the Lorentzian curve fitted area can be used for classification [53]. In this study, however, the weighted average measure was introduced as an alternative, so as to smoothen the peak response while enhancing the amount of differentiating information.Once the 2D image was synthesized using the selected peaks and their neighbors, their weighted average was taken to reduce the dimension. The weights were obtained by discretizing the Gaussian curve obtained for a range of standard deviation σ values and a fixed mean, which was later normalized so that the sum was 1[54,55].The genie-aided optimum range of σ was selected to achieve the minimum information loss along with accurate classification [56]. A single spectrum can be described as being composed of L random variables on n observations(or spectra),X1,X2,…,Xn;withxil,being the lth intensity measure of spectrum i.Thus,forxil,,if m peaks of L are selected along with their neighbors on either side, the following equation applies:Consequently, for a spectral line and its neighbor, the weighted average is obtained for K different σ values and the results are concatenated.The weights obtained for m selected peaks and their neighbors with respect to the different σ values are given as
A weighted-average spectral image obtained through weighted averaging of peaks and their neighbors is depicted in figure 5. The differentiating characteristics of the spectral image are well preserved in its weighted average equivalent because of the similarities in the shapes of the peaks and their neighbors, to the Gaussian curve discretized to procure the weights. It is clearly apparent that the weighted averaging in columns two and three of the figure yields concise andcompact representation of the abstracted information from the raw measurement data.
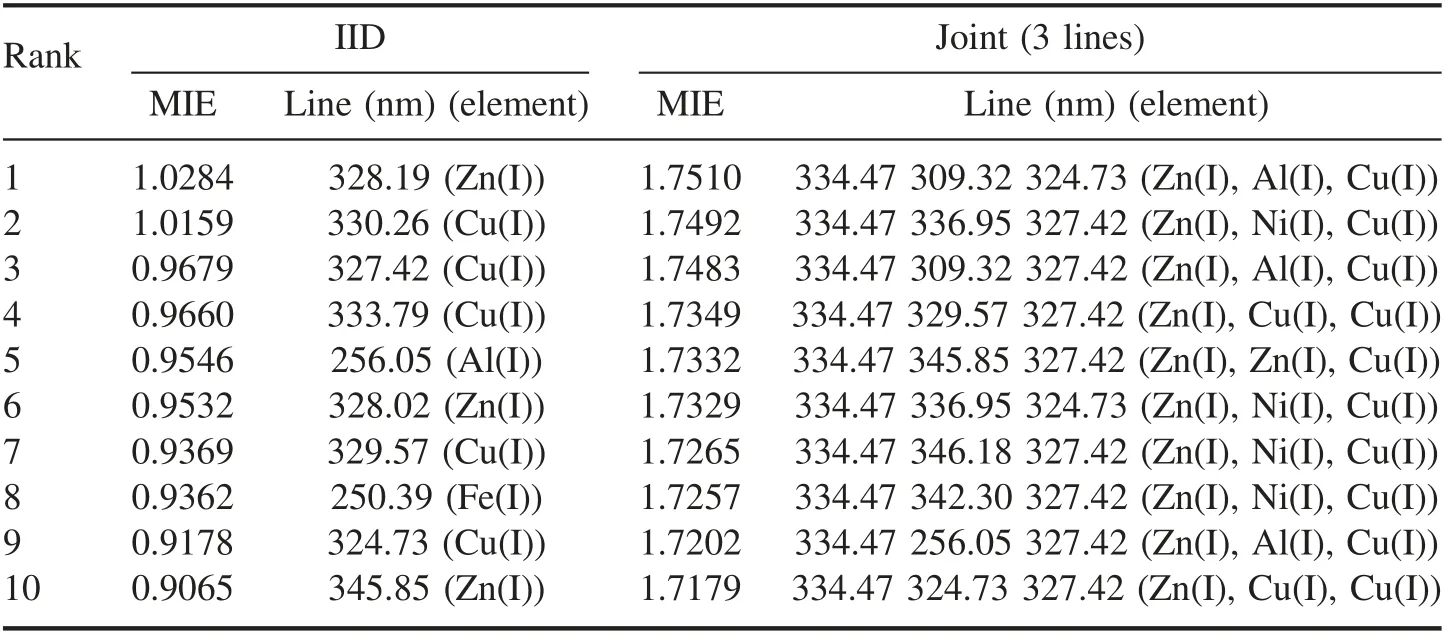
Table 2.Ranked spectral line sets by MIE for alloy samples.
5. Results and discussion
5.1. Evaluation of the spectral line selection
5.1.1. Alloys samples. Figure 6 plots the rms of the raw intensity, introduced in section 1, of each shot for the 1600 captured spectra, where a large variation was observed considering each base of alloy. By the rms normalization,all the raw spectra were divided by the rms intensity,such that the rms normalized spectrum will have one as its rms.For the internal standard normalization, the spectral line of Fe was used as the internal standard because the Fe component is more consistent than the others, shown in table 1. To demonstrate the performance of the normalization scheme with respect to the reduction of high shot-to-shot variance,the intra-class variance is investigated with the distance between the different classes of same base alloys. Figure 7 shows the intra-class variance of Cu-1107 and Cu-BS110B over 320-340 nm band with the highest peak intensity and the largest variance. As shown in the figure 7, the spectrum normalized by the rms reduced the variance within the classes and increased the difference between Cu-1107 and Cu-BS110B, thus, rms normalization was preferred in this investigation.
Alternatively,spectral lines selected by jointly evaluating independent and identically distributed(IID)assumed MIE in equation (2) and average relative distance were also investigated for the raw and normalized spectra as shown in figure 8. For most of the peaks showing a large information measure, the rms normalization outperformed the raw estimate, whereas the maximum intensity estimates were degraded, showing that the classification information was lost. Internal standard estimates were degraded or improved compared to the raw estimate and did not outperform the rms normalization. Furthermore, the improved information measure indicated that rms normalization can mitigate the undesired effects of emission signal fluctuations for an accurate inter- and intra-base alloy classification.
From the high-dimensional LIBS spectrum, most informative spectral line sets for alloy classification are extracted by three steps: (1) select the candidate peaks by the simple threshold (2) select informative peaks based on IID-MIE; (3)select the set of most informative peaks based on joint MIE.A total of 250 peaks were first selected and 45 peaks were selected based on IID-MIE with the average relative distance between each class as illustrated in figure 9. The set of the most influential combinations among the candidate peaks was extracted by examining the joint MIE based on the Gaussian kernel.Table 2 shows the ranked spectral lines by IID mutual information, and the most informative set of three spectral lines. Elements associated with the respective spectral lines have also been mentioned in the table. Note that the informative set with respect to the larger joint MIE was not always composed of high ranks in the IID analysis.When we add a peak one by one for the set and choose the complementary line that contains more information, the new information that previous lines do not have is preferred.Also,most informative lines selected using mutual information may or may not comprise of persistent resonant lines for an element. Cases where these are present simply substantiate the relevance of the information contained in them through MIE based measure.
5.1.2. Skin tissue samples. Three different wavelength bands, 250-350 (Band 1), 350-450 (Band 2), and 730-830 nm (Band 3) were used for analysis. As the experimental conditions varied during recording of these samples,the measurements were further divided into those for two different gate delays(0 and 20 ns).In the view of the fact that spectrum for all the three bands varies widely, the line selection mechanism was applied separately for each band.Steps defined in line selection for alloys sample in section 5.1.1 remained the same. A total of 68, 133 and 51 peaks were first selected and 27, 47 and 14 peaks were selected based on IID-MIE with the average relative distance between the classes for Band 1, Band 2 and Band 3 respectively(illustrated in figure 10). Set of lines with highest IID-MIE showing high classification accuracy were different for each band (discussed in the next section). Table 3 shows the ranked spectral lines by IID mutual information,and the most informative set of three spectral lines corresponding to each band. Elements associated with the selected spectral line are the same as that of experimentally identified biomarkers justifying the efficacy of MIE based selection approach [2].Note that similar to what was observed in case of alloys samples, informative set with respect to the larger joint MIE was not always composed of high ranks in the IID analysis.
5.2. Weighted averaging based classification

Table 3.Ranked spectral line sets by MIE for skin tissue samples.
5.2.1. Alloys samples. Of 12 288 spectral lines constituting the full spectrum for the alloy classification experiment, sets of three most informative lines and its information metric were evaluated in the previous section. For all the 3 line sets obtained, to incorporate the peak neighbors, four lines on either side of each peak were selected. Again, the number of peaks on the neighboring side was heuristically selected.Then, each spectrum was narrowed down to a total of 27(=3 × 9) spectral lines. Corresponding to each spectral image, five respective weighted averages for five different σ values were considered, yielding vectors of 1 × 3, which were concatenated to form a 5 × 3 2D image for each spectrum.The normalized Gaussian weights for the chosen σ range are almost coincident with the shapes of the selected peaks and their neighbors. Joint MIE was then again evaluated for these weighted averaged set of most informative spectral lines and set with highest information metric was selected for further analysis. To visualize the distinguishing factors of the synthesized image,the root mean square normalized mean intensities of the selected spectral lines for the three different alloy bases are shown in figure 11.It is apparent that the intensities of the selected spectral lines vary widely depending upon the alloy base. For instance, the normalized intensities of the peaks vary for respective alloys.This variation proves that image synthesis can enhance the differences among the alloy classes as it covers the variation because of addition of neighboring peaks. Using the entire spectrum implicates that correlation among the spectral lines is high which degrades the classification accuracy. On the other hand, using just 3 most informative weighted averaged spectral lines lower the correlation and improve the accuracy.
Figure 12 depicts the IID and joint MIE evaluated for selected 45 peaks with SVM based classification accuracy.The joint MIE was increased by adding the peak one by one.The larger the joint MIE of the set, the higher the classification accuracy. The sets containing 334.47 nm,324.73 nm with the highest IID MIE shows the higher classification accuracy. The classification results were compared to the full spectrum-bases test and the dominant peaks based test to ensure that the selected set was actually more highly correlated in classifying alloys.The classification losses were recorded for different feature spaces constructed based on prior information and information metric. The classification accuracies were evaluated using 10 fold cross validation with randomly assigned 90% training and 10%testing using an SVM; this was repeated 100 times. The resulting classification accuracy of the most informative weighted averaged spectral lines with rms normalization was 97.81%, which was better than using only 3 MIE based selected lines giving 93.19%accuracy and also outperforming the result with 12 288 full points showing 94.87% and dominant peaks showing 91.69%in the table 4.The proposed weighted average scheme was shown to perform well for inter-and intra-base classification of alloys.The trade-off that occurs between the loss and complexity for only 3 weighted average peaks for multiple standard deviations compared to use of all spectral lines is due to the dimensionality reduction.In the context of inter-base alloy classification, the loss is significantly lower when the alloy composition is varied.

Table 4.Classification result of 1600 samples based on WA and MIE.
5.2.2. Skin tissue sample. Since the lines selection mechanism was applied separately on all three bands, classification analysis was also done separately. For the sets of three spectral lines selected using MIE evaluation, ten spectral lines on either side were selected; thus, the customized spectral images for the skin sample were 21 × 3 images for Bands 1-3. Once the spectral image was created for each band, the weighted average corresponding to σ{1, 3, …, 19} was created, yielding a 10 × 3 image for each band corresponding to 10 σ values.Information metric was obtained using joint MIE for these weighted averaged spectral lines and set of line with highest MIE score was selected for each band for further classification analysis.The melanoma and dermis spectra changed with the gate delay;thus, the loss rate also varied depending on the gate delay.
The standardized mean distance square measure (ζ) is expressed as where μmand σmare the mean and standard deviations of the melanoma samples,respectively, and μdand σdare the mean and standard deviations of the dermis samples, respectively.Comparison of ζRand ζW, which were calculated for a raw sample and for a sample with a weighted average spectral line, respectively, (figure 13) shows that considerably greater differences between the two classes were obtained for the weighted averaged case. This indicates that the weighted average processing scheme is suitable for use in classification applications.
Figure 14 shows the measurement behavior with respect to increased σ.For the initial σ values,the distance between classes(in this case,the melanoma and dermis)tended to increase.This corresponded to improved classification accuracy as most of the deviations around the neighbors are covered. With increased σ,the distance either remained constant or decreased. This is because a broadened σ spans a wider variation of the neighborhood, which does not contain any differentiating information. Principal component analysis (PCA) of the raw spectral lines and weighted averaged lines,as shown in figure 15,provided further evidence that the proposed scheme achieves better distinction between the two classes than the raw data, as the first principal component covered more variation in the weighted averaged line case.To demonstrate the efficacy of the lines selection mechanism based on joint MIE, classification accuracy was compared for each stage of line selection in figure 16.Weighted averaging of the set of lines selected using information metric outperforms the previously selected line sets in terms of classification accuracy with the expected increase in the MIE score. Finally, the bar graph in figure 17 summarizes the classification losses for all bands and the different delays when (i) all spectral lines, (ii) the experimentally selected spectral lines, (iii) set of three lines selected using joint mutual information measure, and (iv) the weighted average of set of three lines selected using MIE (for different σ values for the weights) were used. As illustrated, the spectral lines corresponding to the higher MIE score contain most of the information,and the Gaussian averaging with additional sides of the peaks provides potential improvement in accuracy with reduced complexity. Considering Band 1, for a 0 ns gate delay, it can be observed that classification loss improves significantly from 7.5% to 2% while reducing the dimension of the feature used from 1024 raw spectral lines(all peaks)to 3 weighted averaged spectral lines for 10 standard deviations of weights (WA with range of sigma). Furthermore, for a delay of 20 ns, the loss improves from 12%to 7.5%while using just 3 weighted average spectral lines for range of sigma. Similar patterns can be observed for the rest of the bands and associated delays.
6. Conclusion
The proposed spectral line selection and processing schemes for LIBS systems enable fast and reliable classifications by using only a few but most informative spectral lines,compared to the conventional schemes either using the full spectral range or dominant peaks associated with the concentrated components.The sets of the most influential combinations of spectral lines are extracted by examining the joint mutual information estimate(MIE), which shows improved classification accuracy through the SVM tests. The 2D spectral images and the weighted averaging feature scheme for LIBS-based classification presented here provides a favorable trade-off between complexity and performance. For the case of alloys, the classification loss was found to improve for both intra- and inter-base classifications. Compared to the analysis of the entire spectrum, consideration of selected crucial lines captured less-vulnerable information,which could be further augmented by incorporating the lines neighboring the selected lines. Use of the weighted averaging scheme further reduced the dimensions of the training and test data with only marginal performance degradation.Similarly,in the case of skin cancer detection,the distinguishing factors were further improved through the use of weighted averaging of most informative spectral lines selected using joint MIE, as the distance between the two classes was further increased.Overall,the proposed schemes are highly efficient for LIBS-based classification in terms of both accuracy and computational cost.The simplified features can be easily applied for broader applications of machine learning based classifications over the large dimensional measurements like LIBS. The weighted averaging method can be further refined by considering other peak shapes than Gaussian, depending on the target applications,as subtle difference can be effective when they are combined with the measure like MIE, and have a potential to improve classification accuracy. For additional improvement,transfer learning approach can be employed for simultaneously updating the model as well by tracking the changes in LIBS measurements over time.
Acknowledgments
This study was supported by the R&D Center for Valuable Recycling (Global-Top R&D Program) of the Ministry of Environment (Project No. 2016002250003).
ORCID iDs
 Plasma Science and Technology2020年1期
- Plasma Science and Technology的其它文章
- Experimental study of current loss of a single-hole post-hole convolute on the QG I generator
- Development of a data acquisition and control system for the International Thermonuclear Experimental Reactor neutron flux monitor
- Effect of the amount of trapped particulate matter on diesel particulate filter regeneration performance using nonthermal plasma assisted by exhaust waste heat
- The effect of atmospheric pressure glow discharge plasma treatment on the dyeing properties of silk fabric
- Spectral characteristic of laser-induced plasma in soil
- Numerical simulation of atmospheric pulsemodulated radio-frequency glow discharge ignition characteristics assisted by a pulsed discharge