
Phosphoglucose isomerase gene expression as a prognostic biomarker of gastric cancer
2019-11-08 01:49:42HanChenHuangXianZiWenHuaXueRunShengChenJiaFuJiLeiXu
Han-Chen Huang ,Xian-Zi Wen,Hua Xue,Run-Sheng Chen,Jia-Fu Ji,Lei Xu
1Key Laboratory of RNA Biology,Institute of Biophysics,Chinese Academy of Sciences,Beijing 100101,China;2University of Chinese Academy of Sciences,Beijing 100049,China;3Key Laboratory of Carcinogenesis and Translational Research(Ministry of Education/Beijing),Division of Gastrointestinal Cancer Translational Research Laboratory,Peking University Cancer Hospital &Institute,Beijing 100142,China;4Guangdong Geneway Decoding Bio-Tech Co.Ltd,Foshan 528316,China;5Centre for Cognitive Machines and Computational Health(CMaCH),School of Electronic Information and Electrical Engineering,Shanghai Jiao Tong University,Shanghai 200240,China;6Department of Computer Science and Engineering,The Chinese University of Hong Kong,Hong Kong 999077,China
Abstract Objective:Tumor heterogeneity renders identification of suitable biomarkers of gastric cancer(GC)challenging.Here,we aimed to identify prognostic genes of GC using computational analysis.Methods:We first used microarray technology to profile gene expression of GC and paired nontumor tissues from 198 patients.Based on these profiles and patients’clinical information,we next identified prognostic genes using novel computational approaches.Phosphoglucose isomerase,also known as glucose-6-phosphate isomerase(GPI),which ranked first among 27 candidate genes,was further investigated by a new analytical tool namely enviro-geno-pheno-state(E-GPS)analysis.Suitability of GPI as a prognostic marker,and its relationship with physiological processes such as metabolism,epithelial-mesenchymal transition(EMT),as well as drug sensitivity were evaluated using both our own and independent public datasets.Results:We found that higher expression of GPI in GC correlated with prolonged survival of patients.Particularly,a combination of CDH2 and GPI expression effectively stratified the outcomes of patients with TNM stage II/III.Down-regulation of GPI in tumor tissues correlated well with depressed glucose metabolism and fatty acid synthesis,as well as enhanced fatty acid oxidation and creatine metabolism,indicating that GPI represents a suitable marker for increased probability of EMT in GC cells.Conclusions:Our findings strongly suggest that GPI acts as a novel biomarker candidate for GC prognosis,allowing greatly enhanced clinical management of GC patients.The potential metabolic rewiring correlated with GPI also provides new insights into studying the relationship between cancer metabolism and patient survival.
Keywords:Gastric cancer;gene expression profile;prognostic biomarker;phosphoglucose isomerase;tumor metabolism
Introduction
Among all cases of cancer worldwide,gastric cancer(GC)ranks fifth in incidence,and third in cancer-related mortality(GLOBOCAN,2012)(1).Despite recent improvements in treatment,patients with stage III and IV GC exhibit 5-year overall survival(OS)rates of 9.2%-19.8% and 4.0%,respectively(National Cancer Institute,2014).With advances in high throughput technology,gene expression profiling has been widely adopted to identify molecular factors associated with progression,recurrence and metastasis of GC(2,3).However,biomarkers currently used in clinical management of GC patients are limited in prognostics and therapeutics,due to their insufficient sensitivity and specificity.Thus,exploring novel effective biomarkers is critical for improved clinical management of GC patients(4).
Previous studies using gene expression microarray to identify GC-related biomarkers,mostly focused on analyzing tumor tissues,rather than use large-scale data from tumors and paired adjacent nontumor tissues(2,3).Recent analysis on pan-cancer data demonstrated that nontumor tissues are complementary for improved cancer prognosis.These comparative studies also showed that cancer microenvironments play pivotal roles in cancer patient survival by influencing the adjacent cell metabolism or thein situimmunization(5).Reprogrammed metabolism is no longer considered a mere consequence of oncogenic transformation,but a critical hallmark of cancer(6,7).By summarizing the primary tumor-related metabolic processes,several systematic studies provide proof that metabolic genes are highly suitable markers for both clinical prognosis and therapy(8,9).
Glucose-6-phosphate isomerase(GPI)is a housekeeping cytosolic enzyme that catalyzes the interconversion between glucose-6-phosphate(G6P)and fructose-6-phosphate(F6P),a process that plays a pivotal role in glycolytic and gluconeogenic pathways.In contrast to normal cells which metabolize glucose mainly via oxidative phosphorylation(OXPHOS)under aerobic conditions,cancer cells favor glycolytic pathway(10,11).GPIgene expression is induced by transcription factors c-Myc and HIF-1(12,13),and has been shown to be overexpressed in many types of cancer(14).GPI has been proposed to be the autocrine motility factor(AMF),a secretory protein,which may act as a cytokine(15).Though completeGPIknockdown(GPI-KO)failed to prevent tumor growthinvivo,asGPI-KO cells can still grow by reprogramming their bioenergetics metabolism to OXPHOS,cell growth was shown to slow down and turn extremely sensitive to inhibitors of the respiratory chain complex(16).This dramatic metabolic plasticity was also observed in other cancer cell lines(14).
Here,we performed gene expression profiling of GC tumor and paired adjacent nontumor tissues from 198 GC patients.A genome-scale screening of GC prognostic genes was implemented via Fisher’s discriminant analysis(FDA)based phenotype-targeted test(FDA-based PT-test)and integrative hypothesis testing(IHT)analysis,resulting in 27 potential prognostic genes,which were highly correlated with cancer metabolism.GPI,as the top ranked gene,was specifically evaluated for its ability as a prognostic marker.Its relationships with metabolism,EMT,and drug sensitivity were revealed.Particularly,results from Envirogeno-pheno-state(E-GPS)analysis(17)indicated thatGPIexpression effectively stratified the outcomes ofCDH2-negative patients with tumor node metastasis(TNM)stage II/III.Collectively,our study suggestsGPIas a promising biomarker for GC prognosis,and the analytical frameworks used in this study can provide a useful tool for cancer studies.
Materials and methods
Gene expression profile and clinical data from Peking University Cancer Hospital
A total of 198 patients with GC included in this study were surgically treated at Peking University Cancer Hospital between 2007 and 2010,and were followed up to March 2016.This investigation was performed after approval by the Ethics Committee of Peking University Cancer Hospital.General informed consent was obtained from each patient.After radical gastrectomy,resected specimens were processed routinely for microscopic pathological assessment,and tissues were sampled and snap-frozen in liquid nitrogen.Fresh human tissues were stored at-80 °C.To ensure the quality of tissues,routine histological evaluation was performed for each sample.The gene expression profile of these tumors and paired noncancerous tissues were performed using the Agilent human mRNA &lncRNA Array V4.0 platform.All the 198 microarrays passed the quality control and were thus processed with quantile normalization and log-2 transformation.We further performed the prognostic biomarker study based on these normalized expression values of the 20,205 mRNAs.
GC stage was classified according to the 2010 TNM classification recommended by the American Joint Committee on Cancer(AJCC 7th edition).T and N classification were assessed based on the final pathological results and M classification was determined by surgical findings.Early GC(EGC)was defined as a tumor that was confined to the mucosa or submucosa regardless of lymph node(LN)involvement.Advanced GC(AGC)was defined as a tumor that invaded the muscle proper or beyond.OS was calculated from the date of the initial surgery to the time of decease caused by the tumor or the date of the last follow-up.Progression-free survival(PFS)was calculated from the date of the initial surgery to the time of GC progression.None of the patients received chemotherapy or radiation therapy prior to surgery.A summary of clinical information is shown inSupplementary Table S1.The gene expression data together with clinical information of the 198 GC patients constituted our own dataset,which was named after the Peking University Health Science Center(PUHSC).
Screening of prognostic genes from tumor and paired nontumor expression profiles
Most existing methods for tumor-nontumor paired data analysis treat the gene expression of adjacent nontumor tissues as normal backgrounds that vary between individuals.Thus,traditional analytical frameworks for biomarker screening use fold-changes of the tumor over nontumor to measure the relative expression of targeted genes(18).Consequently,only those genes with significant difference in expression values between tumor and nontumor tissues,i.e.differentially expressed genes,are screened out for further prognostic analysis.This has been limited in several respects.First,as the resection margin,adjacent nontumor tissues differ from the pure normal tissues,hence the relative difference in gene expression between tumor and nontumor may not truly reflect the real“somatic”aberrations.Second,the expression pattern of transcripts in tumor tissues is dynamic.That is to say,genes are selectively expressed in specific time and space.Therefore,only considering the differentially expressed genes may have failed to capture important information associated with carcinogensin vivo.Here,we performed PT-test to discover genes that differentiate good or poor survival outcomes using FDA.Furthermore,based on the results of FDA-based PT-test for each gene,an IHT was performed to select the prognostic biomarkers of GC.
The preliminary screening of prognostic genes was implemented based on tumor-nontumor paired GC profiles of 198 Chinese patients.Details on patients and samples,RNA extraction and microarray processing were expanded inSupplementary materials.
FDA-based PT-test
For each gene,the expression value in tumor and nontumor tissue of each patient was treated as a 2D sample.Each sample point was labeled as“good”or“poor”according to the outcome of patients.Based on Fisher’s linear discriminant,all samples were projected onto a unitlength normal vector of the classification boundary,resulting in a set of 1D values.These values were adjusted to FDA-scores by subtracting the average of the mean centers of two classes.Based on the FDA-score,a weighted combination of the gene expression in tumor and paired nontumor,we obtained the P-value of two-samplet-test,and the predictive classification accuracy of outcomes.To obtain stable classification results,we calculated the average testing accuracy of FDA-based PT-test for each mRNA by 100 Monte-Carlo cross-validations,with 70% samples for training and 30% for testing.The average testing accuracy was calculated by the mean value of all the 100 testing accuracies.For the classification accuracy,balanced accuracy(definition refers to the contingency table inFigure 1B)was selected to avoid the bias of imbalanced datasets.
Integrative hypothesis test
For a model-based test(e.g.,Student’st-test),the P-value measures the difference between the models(e.g.,means)of two populations,while the classification rate or accuracy measures how well the discriminant boundary separates the two populations.Since these two measures are complementary to each other,it is important to coordinate them with an integrated approach.Moreover,though it is known that the 5-year OS is a gold standard as an endpoint in clinical trials(19),3-year PFS,as a potential surrogate of 5-year OS,has also received much attention recently(20).Hence we adopted the IHT(21)that incorporates both 5-year OS and 3-year PFS to evaluate each gene based on both P-value and classification accuracy.We used the FDA-based PT-test to select candidate mRNAs into a twin-set with one comprising of top-50 mRNAs with smallest Student’s P-values and the other comprising of top-50 mRNAs with highest classification accuracies.We obtained one such twin-set of mRNAs for 3-year PFS and another one for 5-year OS.Finally,the consensus of the four subsets,which was obtained by Venn Diagram as illustrated inFigure 1D,produced a hierarchy of candidate genes as biomarkers.Genes on the higher level received bigger consensus than those within lower levels and thus were more robust.
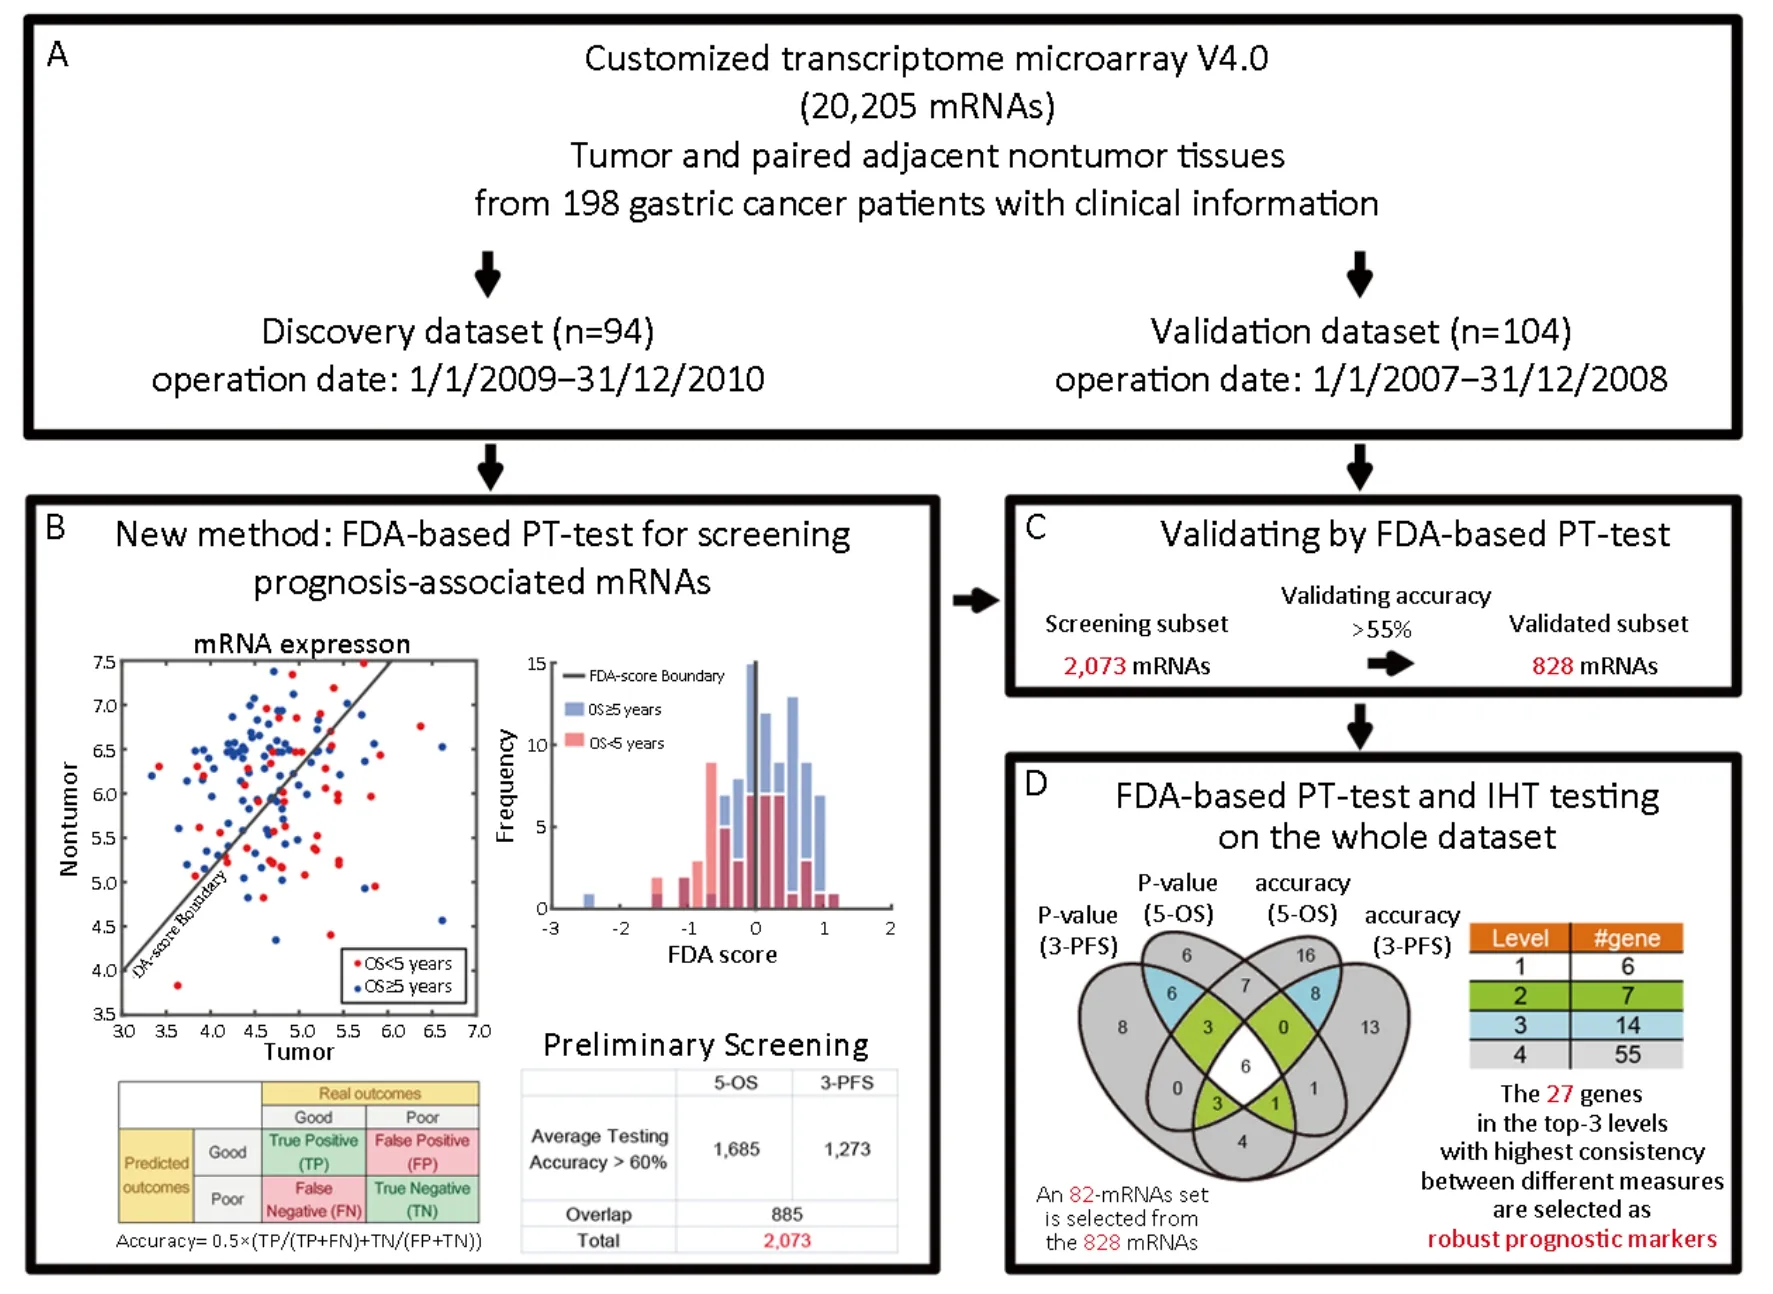
Figure 1 A flowchart of prognostic markers screening.(A)Introduction of the dataset based on tumor and paired adjacent nontumor tissues from 198 patients;(B)Preliminary screening by Fisher’s discriminant analysis(FDA)based phenotype-targeted test(FDA-based PT-test)for each transcript on the discovery dataset.The scatter plot(left panel)represents the expression of gene X in tumor tissues(X-axis)and paired nontumor tissues(Y-axis).The FDA-scores in the histogram(right panel)are generated by projecting 2D expression into 1D value via FDA;(C)Validation of the genes from preliminary screening;(D)A subset of 828 validated genes is further analyzed by FDA-based PTtest and integrative hypothesis testing(IHT).Top-82 markers were located in different levels of Venn diagram,in which six genes were in the first level(white),seven in the second level(green)and fourteen in the third level(blue).The table on the right shows the corresponding numbers of mRNAs in each level of the hierarchy.OS,overall survival;PFS,progression-free survival.
E-GPS approach
We used a recently proposed E-GPS approach(17)to identify the role of a biomarker in a certain condition or environment.The E-GPS method is performed in the joint domainDegφof enviro-measuree(e.g.,clinicopathological features such as TNM staging and Lauren classification,or well-known biomarkers proposed by previous studies),geno-measureg(e.g.,gene features such as mutation and expression of targeted biomarkers),and pheno-measureφ(e.g.,occurrence of disease-related events such as metastasis and death of patients).In such a joint domain,each sample is represented by a triple-measured element(e,g,φ).A collection of adjacent samples may share a common system status namely“state”s.In prognostic studies,three types of states are defined and can be learned from given sample sets:1)g-state,short for“good”state,wherein an element has a high enough probability of good outcome;2)p-state,short for“poor”state,wherein an element has a high enough probability of poor outcome;and 3)c-state,short for“confusing”state,wherein patients with good outcomes are considerably mixed with those with poor outcomes.
In the current study,in order to investigate the prognostic feature ofGPI,we incorporated this newly discovered biomarker with previously well-studied biomarker,CDH2,and assigned the former as genomeasure and the latter as enviro-measure.Therefore,the E-GPS analysis was performed based on the joint expression ofGPIandCDH2.Without loss of generality,we considered the support vector machine(SVM)-based model to classify patients into different states,as illustrated inSupplementary materials.
Results
Identification of candidate prognostic biomarkers of GC
In order to identify prognostic genes of GC,we performed FDA-based PT-test and IHT.As shown inFigure 1,2,we discovered 27 genes with top performance in either P-value or classification accuracy for both 5-year OS and 3-year PFS.We classified these genes as robust prognostic genes(Supplementary Table S2).As shown inFigure 2B,the FDAbased PT-test efficiently distinguished outcomes by using information from both tumor and nontumor.Our screening results showed that mRNA expressions of six genes includingGPI,PLA2G2A,COASY,FXN,EIF3BandIGFBP2were located at the highest level,and their four indices all ranked as top-50 on a whole-genome scale.The Kaplan-Meier(KM)plots(Figure 2C&Supplementary Figure S1)showed that the outcome of patients could be well distinguished by these six genes.
We found these candidate genes have close relationships with metabolism.For example,GPIis a glucose metabolic gene involved in an early step of glycolysis.PLA2G2AandIGFBP2are involved in lipid metabolism and have been already reported as prognostic markers for GC(22-24).In order to obtain an overview of the biological features of the 27 prognostic markers,we performed enrichment analysis using the gene set enrichment analysis(GSEA),Kyoto Encyclopedia of Genes and Genomes(KEGG)and Gene Ontology(GO)enrichment.As shown inSupplementary Table S3,all 27 genes were closely linked to processes such as cell cycle,AMPK,p53 signaling pathway,or metabolism.GO enrichments based on tumor and nontumor tissues showed that 18 of the 27 genes obtained more enrichments with metabolic gene sets in nontumor tissues compared to tumor tissues,which was consistent with results obtained previously(5).
Considering that these genes are related to metabolic processes,we next analyzed the enrichment patterns of different metabolic pathways.Based on the GSEA toward metabolic gene signatures collected by a previous study(9),we found that our targeted genes were significantly enriched in processes related to OXPHOS,fatty acid oxidation(FAO),creatine metabolism(CM)and so on,in both tumor and nontumor tissues(Figure 2D).
Stratifying role of GPI for prognosis of CDH2-negative patients
In order to investigate the prognostic features ofGPI,we next performed E-GPS analysis to observe how the prognostic classification of patients can be improved by usingGPIand the well-known GC biomarker,CDH2,an important signature of the occurrence of EMT process(25).
As shown inFigure 3A,patients with higher expression ofCDH2had poorer survival compared with that of theCDH2-low patients.The separation by the 90th percentile ofCDH2expression yielded a prognostic differentiation between the two subgroups of patients(Figure 3B,log-rank P=7.4e-02).However,the outcome of patients with lowCDH2expression was still confused and thus needed a better subdividing(Figure 3A).To this end,we next performed SVM-based E-GPS analysis based on mRNA expression levels of bothGPIandCDH2.As a result,the patients were classified into three states(Figure 3C),allowing us to stratify the outcome of patients significantly(Figure 3D,E).Moreover,outcomes of patients with high-CDH2or low-CDH2expression were further stratified into different levels by E-GPS analysis,as shown inFigure 3F,G.
We further found that TNM stages provided complementary information to differentiate the prognosis of patients more precisely to certain E-GPS state.For example,TNM stages differentiated the mixed outcomes withinS3,generating more differentiable subgroups(Figure 3H),allowing us to construct a molecular-diagnostic hybrid classification tree for GC prognosis(Figure 3I).
As a counterpart of the stratification ofS1,S2,andS3by TNM stage(Supplementary Figure S2A-C),we also investigated how well the E-GPS marker differentiated the outcome of patients with each TNM stage(Supplementary Figure S2D-G).Comparing TNM I and IV,the prognosis prediction of TNM II and III were significantly improved.
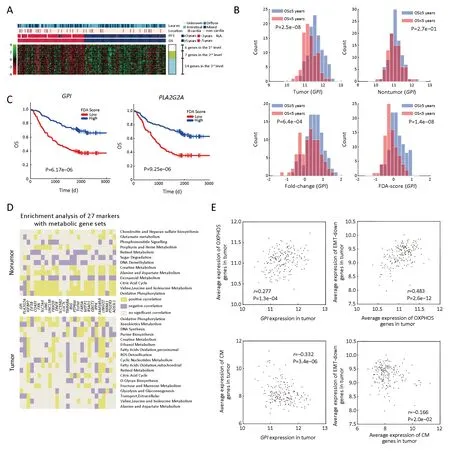
Figure 2 Prognostic features and metabolic enrichment analyses of 27 gene markers.(A)Heat map of Fisher’s discriminant analysis(FDA)scores of 27 genes;(B)Histograms of different 1D-representation of glucose-6-phosphate isomerase(GPI),including expression in tumor(top left),nontumor(top right),relative expression of tumor vs.nontumor(bottom left),and FDA-score(bottom right)of GPI expression in tumor and paired nontumor.P-values are generated by t-test between good-[overall survival(OS)≥5 years.]and poor-surivival(OS<5 years.)groups(P);(C)Kaplan-Meier(KM)plots based on FDA-score of GPI(P=6.17e-06)and PLA2G2A(P=9.25e-06);(D)Summarizing of gene set enrichment analysis(GSEA)of 27 genes focusing on metabolism pathways in tumor(lower part)and nontumor(upper part);(E)2D scatter plot of the expression composed by GPI &oxidative phosphorylation(OXPHOS)(top left)(r=0.277,P=1.3e-04),GPI &creatine metabolism(CM)(bottom left)(r=-0.332,P=3.4e-06),OXPHOS &“EMT-down genes”(top right)(r=0.483,P=2.6e-12),and CM &“EMT-down genes”(bottom right)(r=-0.166,P=2.0e-02).EMT-down genes,genes down-regulated in EMT process.
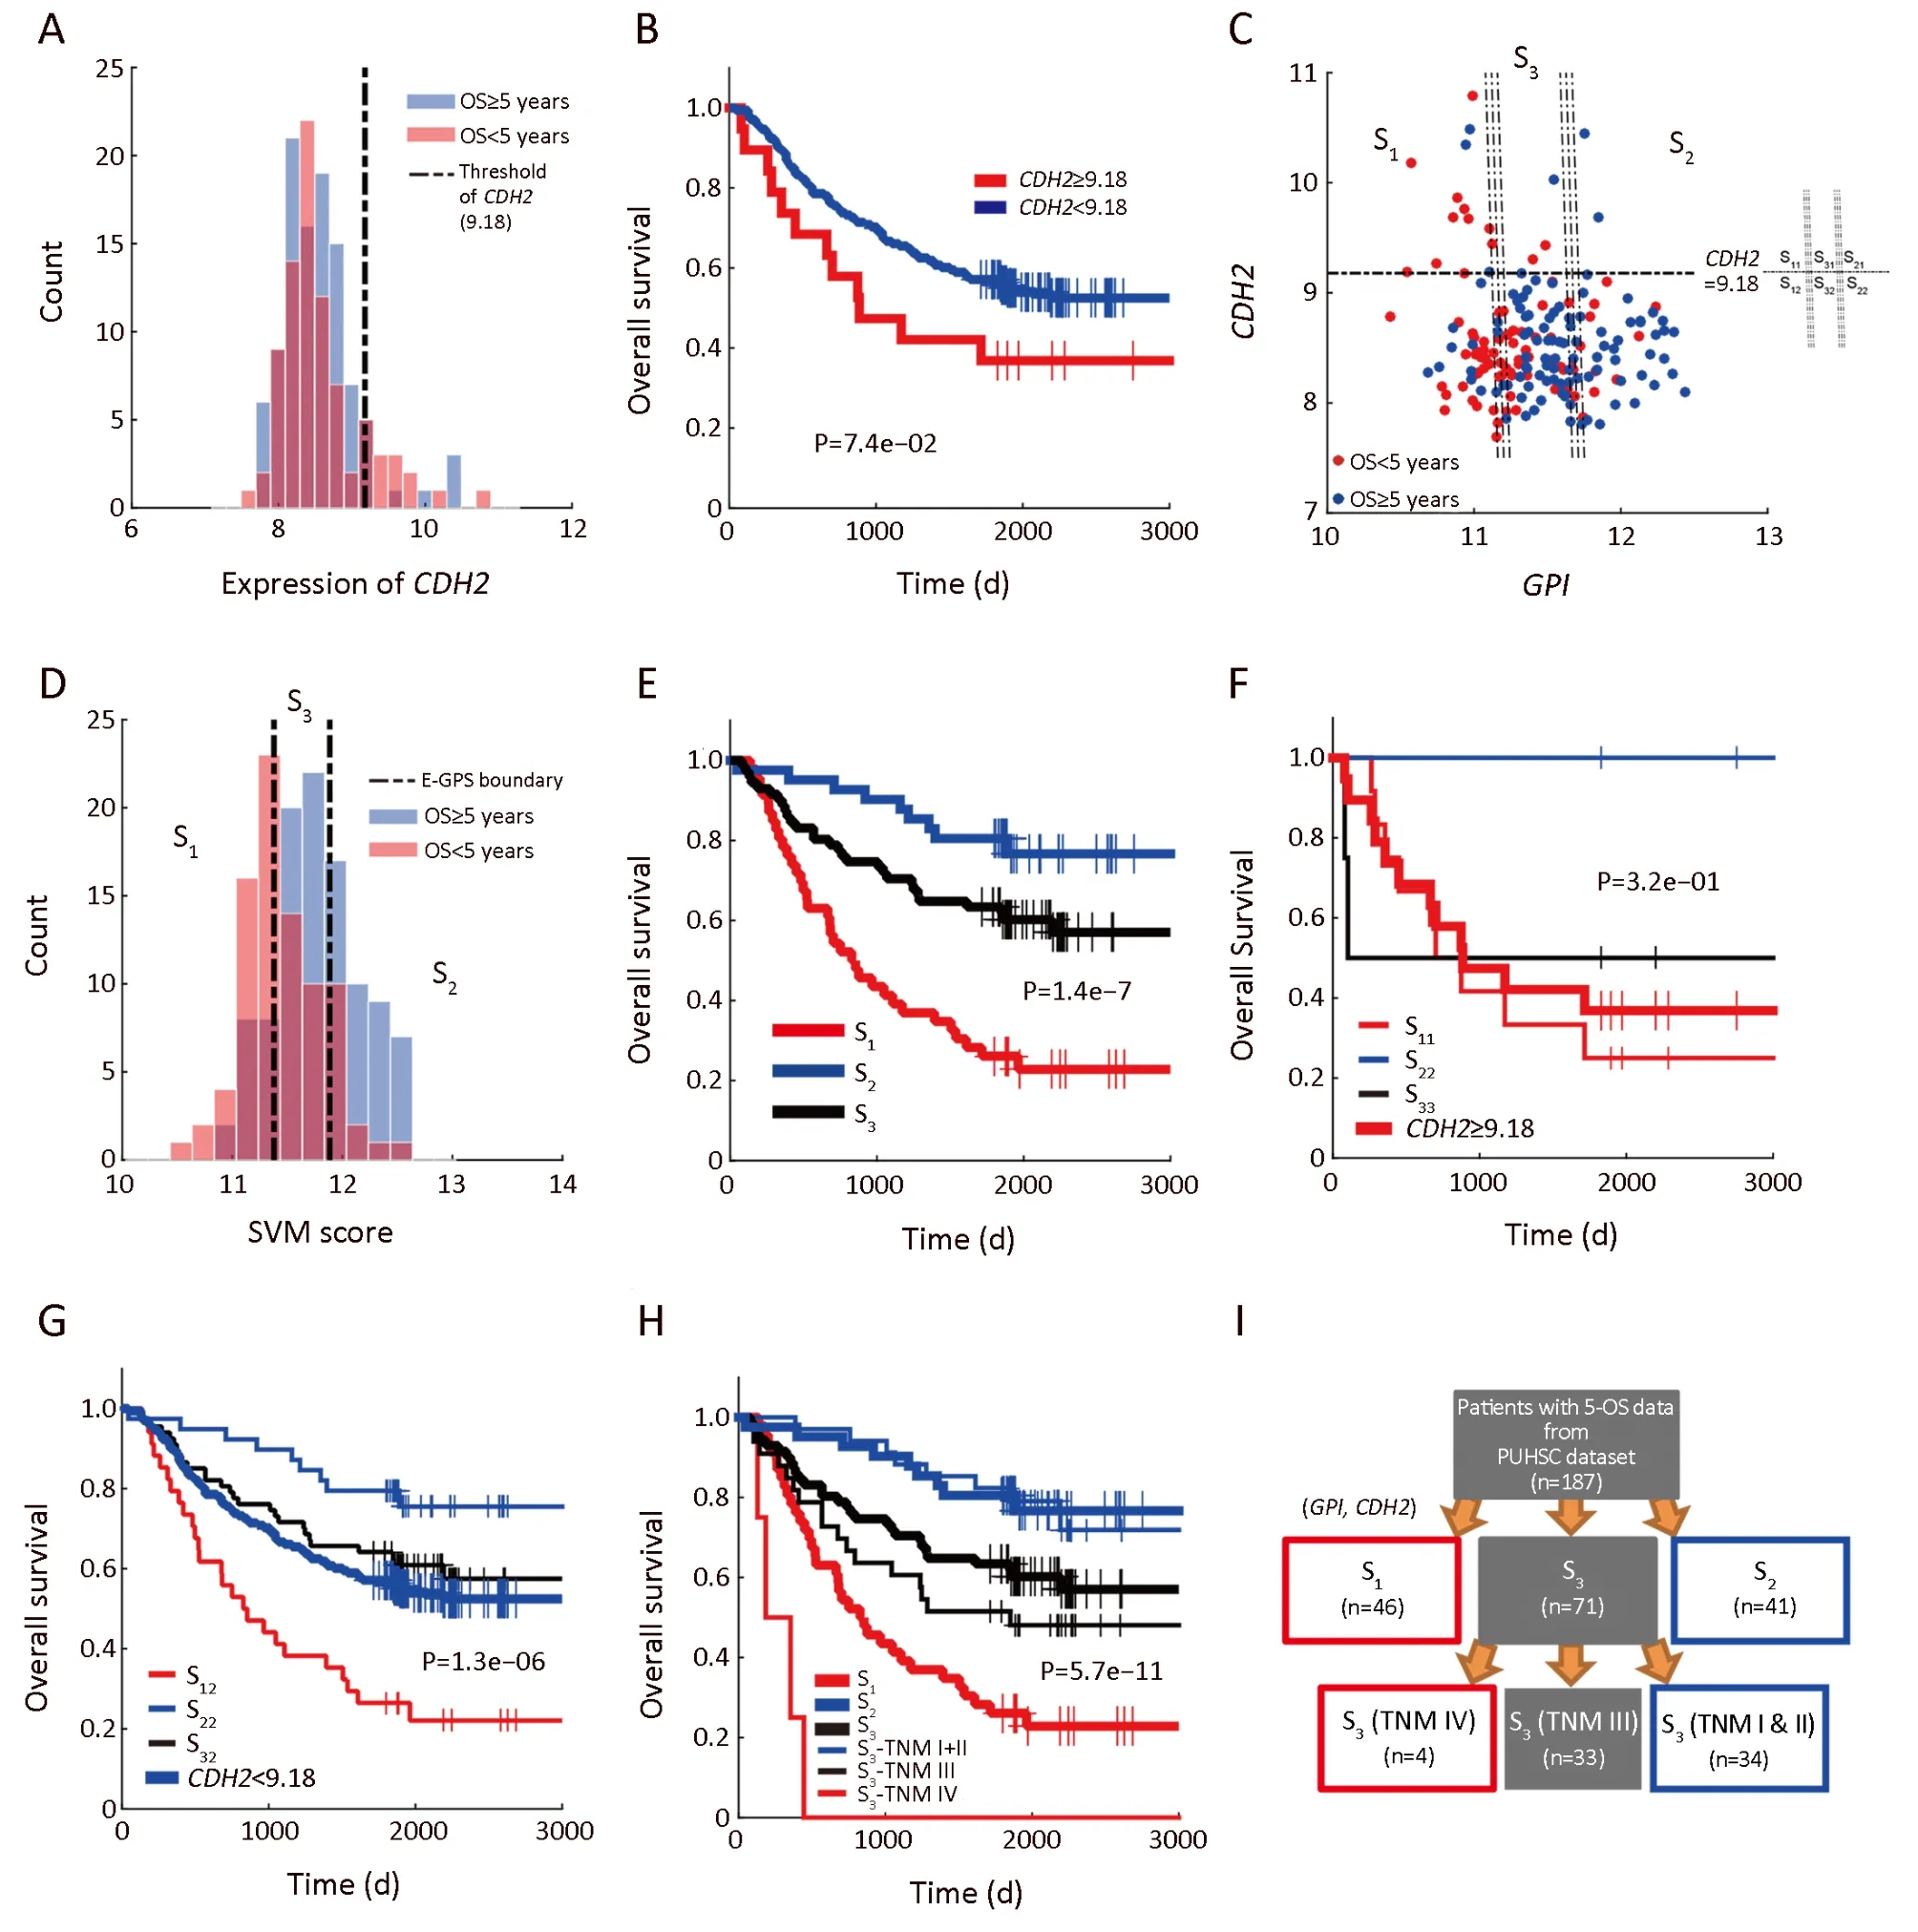
Figure 3 Enviro-geno-pheno-state(E-GPS)analysis of GPI,CDH2.(A)Histogram of CDH2 expression in tumor tissues;(B)Kaplan-Meier(KM)plots of CDH2-high(≥9.18)and CDH2-low(<9.18)group,showing that the expression of CDH2 alone could not distinguish the prognosis of patients(P=7.4e-02);(C)E-GPS states defined by GPI,CDH2.Patients are stratified into three groups according to the joint expression of the two genes.Each group corresponds to one of the E-GPS states S1,S2,and S3.Patients of CDH2-high group are separated into S11,S21,and S31by GPI expression level.Similarly,patients of CDH2-low group are separated into S12,S22and S32;(D)Histogram of SVM-scores and the corresponding states S1,S2and S3,generated by E-GPS analysis of GPI,CDH2;(E)KM plot of patients grouped by S1,S2and S3states(P=1.4e-7);(F)KM plot of CDH2-high patients grouped by S11,S21and S31substates(P=3.2e-01);(G)KM plot of CDH2-low patients grouped by S12,S22and S32substates(P=1.3e-06);(H)KM plot of patients grouped by S1,S2and S3states with the help of TNM staging(P=5.7e-11);(I)Molecular-diagnostic hybrid tree obtained by E-GPS analysis.Patients in the red boxes have relatively poor survival;patients in the blue boxes have good survival;patients in the gray blocks have confused survival.GPI,glucose-6-phosphate isomerase;OS,overall survival;SVM,support vector machine;PUHSC,Peking University Health Science Center.
Next,we performed analyses focusing on theCDH2-low patients with stage II/III,due to two main reasons:first,the sample size of this part of patients(144 of 198)is larger,ensuring a higher reliability of E-GPS analysis;second,the outcomes of them were more confused comparing with the rest of the patients.Using univariate E-GPS analysis based onGPIexpression,CDH2-low patients with stage II/III were classified into three groups with significantly different levels of outcome(Figure 4A,B),leading to a reconstruction of molecular-diagnostic hybrid classification tree(Figure 4C).To validate this prognostic classification,we performed a combined analysis using independent data from public source(2,26,27).We extractedCDH2-lower patients with TNM II and III stages,and performed univariate E-GPS analyses usingGPIbased on Singaporean dataset(Figure 4D),Korean dataset(Figure 4E)and The Cancer Genome Atlas(TCGA)mRNA-sequencing data of GC(Figure 4F),respectively.The results from all the three validation datasets were consistent with that of our own dataset.
In addition,an immunohistochemistry(IHC)experiment for GPI was performed on 50 paired GC patients,which were randomly selected from the 198 patients.Among the 50 patients,32 wereCDH2-lower and with TNM II/III stages.The prognostic effectiveness of GPI was also observed in protein level(Supplementary Figure S3),however,further research based on larger sample size is required.Moreover,we checked GC cell line data(n=37)from Cancer Cell Line Encyclopedia(CCLE,https://portals.broadinstitute.org/ccle),and found marginally significant differential expression ofGPIin the mRNA level(P=0.06)between the group ofCDH2-high(mRNA expression ofCDH2>0)andCDH2-low(mRNA expression ofCDH2<0)cell lines,which is consistent with the result shown by the scatter plot ofFigure 3C.
Decreased GPI expression in GC tissues is an indicator of rewiring of metabolism associated with poor outcome of patients
In order to investigate the features of the mRNA expression ofGPIas a metabolic indicator,we examined the relationship ofGPIand several pathways of metabolism processes.GC patients exhibiting higher expression levels of OXPHOS in tumor tissues also displayed increased expression levels of glycolysis andGPI,which coordinated with the enhanced biosynthesis of glycogen(r=0.35,P=5.7e-06),fatty acid(r=0.32,P=6.2e-06)and DNA(r=0.48,P=4.4e-12).In addition,our results also showed that the mRNA expression level ofGPIwas negatively correlated with several catabolic pathways,such as mitochondrial FAO(r=-0.11,P=1.2e-01)and peroxisomal FAO(r=-0.19,P=1.1e-02).
Furthermore,we focused on the relationship betweenGPI,its related metabolic pathways,and EMT process.We selected a group of genes that are down-regulated in EMT(shortly DR in EMT)as epithelial markers,similar to those in a previous study(3).As shown inFigure 2E,OXPHOS were positively correlated withGPIas well as the epithelial markers.Similar correlation was also found between fatty acid synthesis(FAS)andGPI(r=0.32,P=6.2e-06)in tumor tissues.On the other hand,the positive correlation between glycogen degradation and the up-regulated genes in EMT(shortly UR in EMT)was detected(r=0.65,P=1.7e-23).These results suggested that tumors exhibiting upregulated glycogen degradation as well as down-regulated glucose metabolism and lower FAS levels are compromised in cell growth;however,such tumor cells are potentially undergoing metastasis in a EMT-like manner.In addition,we found that the activation of CM was negatively correlated with the expression levels of DR genes(Figure 2E).
Furthermore,we found that mRNA expression levels of OXPHOS and FAS in tumor tissues were correlated with prolonged survival,whereas FAO and CM were associated with poor prognosis of GC patients.However,we further observed that the prognostic feature of the single pathways was heterogenic in different datasets,suggesting that we need an integrated signal to combine these pathways for prognosis.Hence,we first screened out theGPI-related metabolic pathways that were more stable for prognosis,and then combined these pathways to obtain an integrated signal.As a result,we chose OXPHOS,FAO,FAS,and CM according to their causal effects on prognosis.In most cases(≥75%),each of the four pathways maintained similar prognostic property across four different datasets(Singaporean,Korean,TCGA,and our dataset).
Next,we assigned OXPHOS and FAS as the positive signals for patients’survival,while FAO and CM as negative signals,based on their metabolic and prognostic features.The relative difference between the positive and negative signals(OXPHOS+FAS-FAO-CM)was used as an integrated signal,the expression of which was also positively correlated withGPIexpression.
As shown inFigure 5A,B,we found that expression levels of the integrated signal correlated well with prognosis of GC patients.This result was further validated by the combined analysis on three independent public datasets with E-GPS method(Figure 5C).
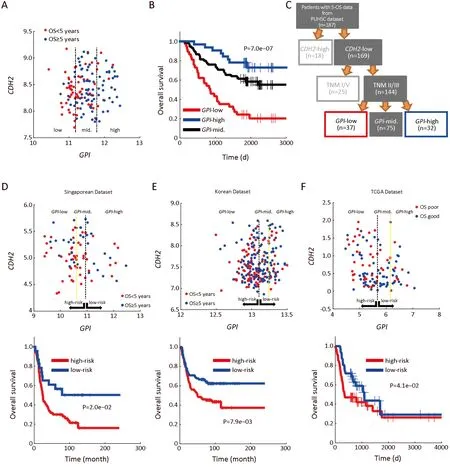
Figure 4 Enviro-geno-pheno-state(E-GPS)analysis of CDH2-negative patients with TNM II/III stages based on GPI.(A)GPI-CDH2 expression plot of CDH2-negative patients with TNM II/III stages.The two parallel lines in the scatter plots classify the GPI expression in tumor tissues into three levels,which are obtained from a univariate E-GPS analysis(Supplementary materials);(B)Kaplan-Meier(KM)plot of patients with each E-GPS state(P=7.0e-07);(C)An adjusted molecular-diagnostic hybrid classification tree.Patients in the red boxes have relatively poor survival;patients in the blue boxes have good survival;patients in the gray blocks have confused survival;(D-F)GPICDH2 expression plot(upper)and KM plot(lower)of CDH2-negative patients with TNM II/III stages from the Singaporean dataset(P=2.0e-02),Korean dataset(P=7.9e-03)and TCGA dataset(P=4.1e-02),respectively.GPI,glucose-6-phosphate isomerase;PUHSC,Peking University Health Science Center.
The relationship between metabolic pathways and prognosis was also analyzed in nontumor tissues.The higher level of OXPHOS,as well as the relative difference between FAS and FAO in nontumor tissue were related to prolonged survival.Higher levels of CM in nontumor also exhibited positive correlation with good survival outcomes,which is opposite to the case of CM in tumor tissues.Hence,we further integrated these pathways using the formula of(OXPHOStumor+OXPHOSnontumor)/2+(FAStumor-FAOtumor+FASnontumor-FAOnontumor)/2-(CMtumor-CMnontumor),in which the molecular information generated by corresponding nontumor tissue was included.The integrated signal was analyzed by E-GPS analysis in both our own dataset and GSE29272(28).As shown inFigure 5D,E,the integrated signal still could separate outcome of patient with GC effectively.
Pharmacogenomic analyses showed GPI indicating drug sensitivity
We performed pharmacogenomic analysis based on the public data obtained from a recent large-scale study(29),which claimed that all 27 GC cell lines as drug-resistant against more than 900 drugs tested.Here,we compared the drug sensitivity of different cell lines using the half maximal inhibitory concentration(IC50)(drug concentration that reduces viability by 50%)value.We examined 217 drugs that were previously tested on more than 70% of the cell lines,and found that the IC50values of 150 drugs were negatively correlated with mRNA expression levels ofGPIin cell lines,suggesting that GC cells with higher expression ofGPImight be more sensitive to certain drugs used during chemotherapy.
For example,5-fluorouracil(5-FU),recommended as one of the first-line agents for the treatment toward advanced GC(30),was tested on 22 GC cell lines.As shown inFigure 6A,the linear regression revealed thatGPIexpression and IC50of 5-FU were negatively correlated.Moreover,we found thatGPImRNA expression significantly differed between IC50-high(≥4)group and IC50-low(<4)group,suggesting that cell lines with lowerGPIexpression exhibit higher drug resistance(Figure 6B).In addition,we checked the two first-line drugs commonly used for GC patients,Cisplatin and Docetaxel,and found little correlation betweenGPIand IC50of those drugs(r=0.08,P=7.1e-02 for Cisplatin andr=-0.11,P=6.1e-02 for Docetaxel).
Discussion
In this study,we identified the mRNA expression ofGPIas a promising indicator for GC prognosis.The close relationships betweenGPIand EMT as well as metabolic processes were revealed by computational analysis.We also proposed an integrative signal to combine the levels of activeness of four metabolic pathways including OXPHOS,FAS,FAO and CM,which were significantly correlated withGPI.
We found that lower level of OXPHOS in tumor tissues is positively correlated with poorer survival outcome,which is not only consistent with the previous study(13),but also validated by independent cohorts from public database.It is now widely accepted that the downregulation of OXPHOS in cancer cells can be explained by the hypothesis of mitochondrial dysfunction under metabolic stress,corresponding to the significantly enhanced glycolysis even under aerobic condition in cancer cells,also known as Warburg effect(31):the growth of tumor is initiated by irreversible damage to respiration and persists due to increased anaerobic metabolism.However,we found that the prognostic effect of glycolytic signal in GC is contradictory.
Notably,our study revealed that the expression ofGPIis positively correlated not only with glycolysis,but also with OXPHOS expression,indicating that the competition between OXPHOS and glycolysis is not a contradictory phenomenon in cancer cells,but an adaptation to provide sufficient ATP for tumor cell survival(10).Furthermore,we found that the expression of both OXPHOS and glycolysis in tumor tissues are negatively correlated to EMT.A plausible explanation for our finding is provided by a previous study,where the loss of glucose uptake was observed in mammary epithelial cells that were detached from extracellular matrix(32).
We also found that in addition to glucose-related pathways,various types of metabolic pathways were also correlated to EMT.For instance,CM is positively correlated with EMT process.While we found a negative correlation with CM andGPIexpression,implying a possible metabolic rewiring.
Recently,a study on extracellular metabolic energetic of colon cancer found that upregulation of CKB,a key factor involved in CM progression,facilitates energy storage in colon cancer cells,while also promotes their survival during intrahepatic hypoxia after liver metastasis(33),resulting in poor prognosis for colon cancer patients.
Fatty acid metabolism plays significant roles in proliferation and survival of cancer cells(34).Thede novoFAS contributes to membrane synthesis for cell growth and proliferation.In contrast,FAO(also known as β-oxidation)provides extra ATPs for cancer cells,subsequently promotes cell survival on loss of attachment(LOA),thus acting as ATP rescuer when glucose uptake and catabolism are inhibited by LOA(35).Our study showed that patients with higher relative activation of FAS to FAO have prolonged survival.This phenomenon coincided with a previous study reporting that consumption of NADPH decreased together with the downregulation of FAS under the stress of energy(36).In contrast,the upregulation of FAO facilitated the generation of NADPH.As a consequence,cell death is inhibited,suggesting the switch from FAS to FAO in tumor tissues may promote the survival of cancer cell(36).
Conclusions
Using new computational approaches,our study identifiedGPIas a promising biomarker for reliable prognosis of GC.We also anticipate that IHT,E-GPS analysis,and prognostic analysis by causal inference will serve as promising tools to discover suitable biomarkers.
Acknowledgements
This study was supported by grants from the Ministry of Science and Technology of the People’s Republic of China(No.SS2014AA020603),Beijing Municipal Administration of Hospitals Clinical Medicine Development of Special Funding Support(No.ZYLX201701),Beijing Municipal Science and Technology Commission(No.D1311 00005313010),the National Natural Science Foundation of China(No.31520103905),the National High Technology Research and Development Program(“863”Program)of China(No.2015AA020108),and the Zhi-Yuan chair professorship start-up grant WF220103010 from Shanghai Jiao Tong University.
Footnote
Conflicts of Interest:The authors have no conflicts of interest to declare.
 Chinese Journal of Cancer Research2019年5期
- Chinese Journal of Cancer Research的其它文章
- A study on service capacity of primary medical and health institutions for cervical cancer screening in urban and rural areas in China
- Medical expenditures for colorectal cancer diagnosis and treatment:A 10-year high-level-hospital-based multicenter retrospective survey in China,2002-2011
- Surgical outcomes of hand-assisted laparoscopic liver resection vs.open liver resection:A retrospective propensity scorematched cohort study
- Texture analysis on gadoxetic acid enhanced-MRI for predicting Ki-67 status in hepatocellular carcinoma:A prospective study
- Machine-learning-assisted prediction of surgical outcomes in patients undergoing gastrectomy
- Prognostic significance of lymphovascular infiltration in overall survival of gastric cancer patients after surgery with curative intent