
Primary investigation of statistical correlation between changes in ice volume and area of glaciers
2019-03-14 01:50:02PuYuWangZhongQinLiChunHaiXuPingZhouWenBinWangShuangJinHongLiangLi
PuYu Wang,ZhongQin Li,ChunHai Xu,Ping Zhou,WenBin Wang,Shuang Jin,HongLiang Li
1.State Key Laboratory of Cryosphere Science/Tianshan Glaciological Station,Northwest Institute of Eco-Environment and Resources,Chinese Academy of Sciences,Lanzhou,Gansu 730000,China
2.College of Geography and Environment Science,Northwest Normal University,Lanzhou,Gansu 730000,China
ABSTRACT This study makes an attempt to investigate through statistical analysis the correlation between changes in ice volume and area of glaciers.Using data from nine sample glaciers in the Tian Shan,the results show that a linear relation exists between changes in ice volume and area,with a correlation coefficient of 0.700.However,the accuracy estimation is difficult due to the limited number of samples.The correlation was not improved after adding eleven glacier samples in other mountains.Two reference glaciers are then analyzed in more detail.The linear correlation coefficient is higher than 0.800 when using the observed changes in ice volume and area during different periods on Urumqi Glacier No.1,which suggests that the linear relation is valid for one glacier for different periods if its shape does not change noticeably and also for other glaciers of the same shape during the same period.The relation between changes in ice volume and area of Qingbingtan Glacier No.72 is different during different periods due to change in the shape of the glacier tongue and the influence of the debris cover.Moreover,errors in glacier-change monitoring and-volume estimation have an important influence on the correlation results.Therefore,further study needs to focus not only on the distinction between glacier types and between different periods but also on the accuracy of volume estimation.
Keywords:volume change;area change;thickness;statistical correlation;glaciers
1 Introduction
Glacier-volume change not only is one of the main factors of sea-level change but also has important influence on regional water resources and ecological environment and the social economy;therefore,ice loss of glaciers caused by climatic warming since the middle of the 20th century has become a hot issue worldwide(Yao et al.,2012;IPCC,2013;Farinotti et al.,2015).However,compared with the glacier-area change,icevolume change is much more complicated to obtain because it needs to be derived indirectly through calculation based on changes in ice thickness or glacier-surface elevation.Field measurements of glacier thickness or surface elevation are time-consuming and laborious and can only be carried out on a limited number of glaciers.Furthermore,DEM(digital elevation model)data from remote sensing does not have enough resolution for most mountain glaciers.Therefore,it is valuable to establish the relation between changes in ice volume and area for estimation of ice-volume change from observed glacier-area change.
Previous modeling studies on glacier-volume change are mainly based on two methods.On the one hand,dynamic models are developed to study the relationship between geometric parameters of a glacier based on physical mechanisms.Farinotti et al.(2009),for example,presented a method to estimate total ice volume of the alpine glaciers from analysis of glaciermass turnover and ice-flow mechanics.Because the input of detailed physical parameters of glacier-surface and subglacial topography are needed,however,only a few individual glaciers observed systematically could be suitable for employing the dynamic models to investigate the glacial geometric parameters.On the other hand,the volume-area relationship formula has been established through statistical analysis of ice-volume calculation based on glacier thickness and area measurements(Bahr et al.,1997;Liu et al.,2003;Shi,2008).The form of the relation between glacier volume(V)and area(S)in statistical studies is V= β ·Sγ,where β and γ are two empirical constants,mainly related to the glacier's morphological characteristics.The statistical relation requires numerous measurements of glacier thickness with high accuracy,which is usually difficult to carry out.Furthermore,the empirical relation gives only ice volume rather than ice-volume change.
Bahr et al.(2009)introduced a method combining the statistical relation of glacier volume to area and the physical mechanism.In this method,change of the accumulation-area ratio(AAR)is used to consider the response mechanism of glaciers to climate change.It is needed,firstly to calculate the AAR0,the value of AAR when the glacier would be at the equilibrium or stable state,and the corresponding mass balance according to the morphological characteristics.Then,the present AAR should be calculated from the measured mass balance.Because the statistical formula relating glacier volume and area is used,and several approximation assumptions must be made in calculating AAR0and AAR,the uncertainty of the final result is hard to determine.In addition,these methods can be used only for glaciers with mass balance data.
In China,an empirical formula relating glacier volume and area has been established based on ice-thickness data of 27 glaciers in the 1980s(Liu et al.,2003;Shi,2008),but correlation between changes in ice volume and area of the glacier basically has not been developed,although some related studies have been done.For example,Li et al.(2012)discussed dynamic modeling on ice thickness for several glaciers;and Yao and Shi(1988)analyzed changes in ice volume,area,and terminus position of Urumqi Glacier No.1.
Because statistical correlation between changes in ice volume and area of glaciers can be established,this approach is more effective for glacier-volumechange assessment on a large scale.Wang et al.(2017a)recently made a preliminary attempt at doing this,based on sample glaciers in the Tian Shan,and thought that differences in glacier type and topographic characteristics may have important influences.In this paper,we would like to further investigate the correlation between changes in ice volume and area of glaciers in China,with emphasis on detailed analysis of two reference glaciers,to reveal the influences of glacier morphologic type and surface characteristics,as well as different stages of glacier change.
2 Study area
Glaciers in the Tian Shan are one of the most important water resources in China.According to the Second Chinese Glacier Inventory(Liu et al.,2015),there are 7,934 glaciers distributed in the Chinese Tian Shan,with a total area of 7,179.77 km2and an ice volume of 707.95±45.05 km3,which account for 16.33%,13.87%,and 15.75%of the total glacier number,area,and volume in China.Therefore,we initially selected nine glaciers in the Tian Shan to investigate the correlation between changes in ice volume and area,and then added eleven glaciers on other mountains.As the basic sample glaciers,locations of the nine glaciers in the Tian Shan are shown in Figure 1;and their basic information is listed in Table 1.The other mountain glaciers are only cited briefly elsewhere in the related section.
3 Data and methods
Three methods are used to estimate glacier-volume change,including(1)glacier-surface-elevation change based on topographic maps,GPS survey data,and DEM derived from remote-sensing data;(2)glacier-thickness change based on GPR(ground-penetrating radar)survey,radio-echo sounding system,and the Chinese Glacier Inventory I and II(Shi,2008;Liu et al.,2015);and(3)glaciological mass balance.The glacier area is usually obtained by comparison with various data sources,including GPS survey data,satellite images,and topographic maps in different periods.The data and method used for calculating volume change and area change of the selected nine glaciers are shown in Table 1.The linear-regression method was used to investigate the relation between changes in volume and area.
4 Results and analyses
4.1 The correlation between changes in ice vol‐ume and area of glaciers in the Tian Shan
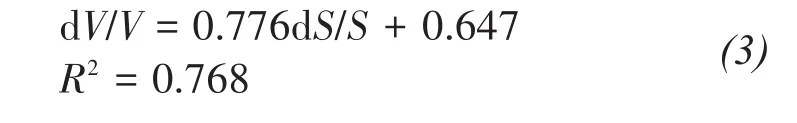
Using the calculation results of ice-volume and area changes of nine glaciers,the correlation between the ice-volume-change ratio(dV/V)and the area-change ratio(dS/S)is obtained from the linear regression by the following formula(Figure 2a and Formula(1)):
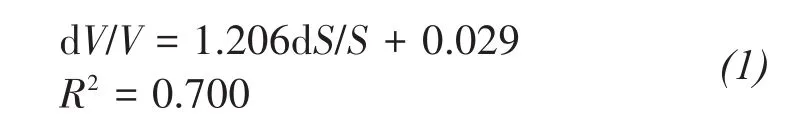
Here,dV/V and dS/S are taken as the annual averages.In the regression,ice volume and area changes of Urumqi Glacier No.1 during six different periods are used as six samples;and so a total of fourteen samples are used to obtain the Formula(1).
Because the samples are rather few,it is hard to conduct an analysis.Therefore,we tried to add some glaciers from other mountains in China to perform the regression analysis further.All the added glaciers have been observed for mass balance to different degrees,including Yanglonghe Glacier No.1 and Yanglonghe Glacier No.5 in the central Qilian Shan,Shuiguan River Glacier No.4 and Ningchanhe Glacier No.3 in the eastern Qilian Shan,Laohugou Glacier No.12 in the western Qilian Shan,Hailuogou Glacier in the Gongga Mountains,Gurenhekou Glacier,Kangwure Glacier,Naimonanyi Glacier(the Northern Branch)in the south of the Tibet Plateau,and Qiangtang Glacier No.1 and Zhadang Glacier in the middle of the Tibet Plateau.The ice-volume and area change have been studied for all these added glaciers(Huang et al.,1996;Li et al.,2010a,b,c;Ma et al.,2010;Shangguan et al.,2010;Zhang et al.,2010,2012;Liu et al.,2012;Tian et al.,2014;Zhu et al.,2014a,b;Zhu,2015).
After adding the eleven glaciers,the regression result is as follows(Figure 2b and Formula(2)):
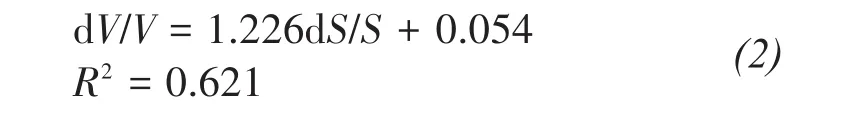
The correlation coefficient of Formula(2)is lower than previous ones.This finding is probably related to three causes.One is that mass-balance observation was carried out only within a small area near the terminus on most glaciers,although the area and volume change mainly appeared in the lower part of glaciers.Second,there are large differences in climatic condition,morphotype,and size of the glaciers.Third,the data period varies from the 1980s to recent years.Therefore,it is necessary to investigate not only different glaciers but also the same glacier in different periods.
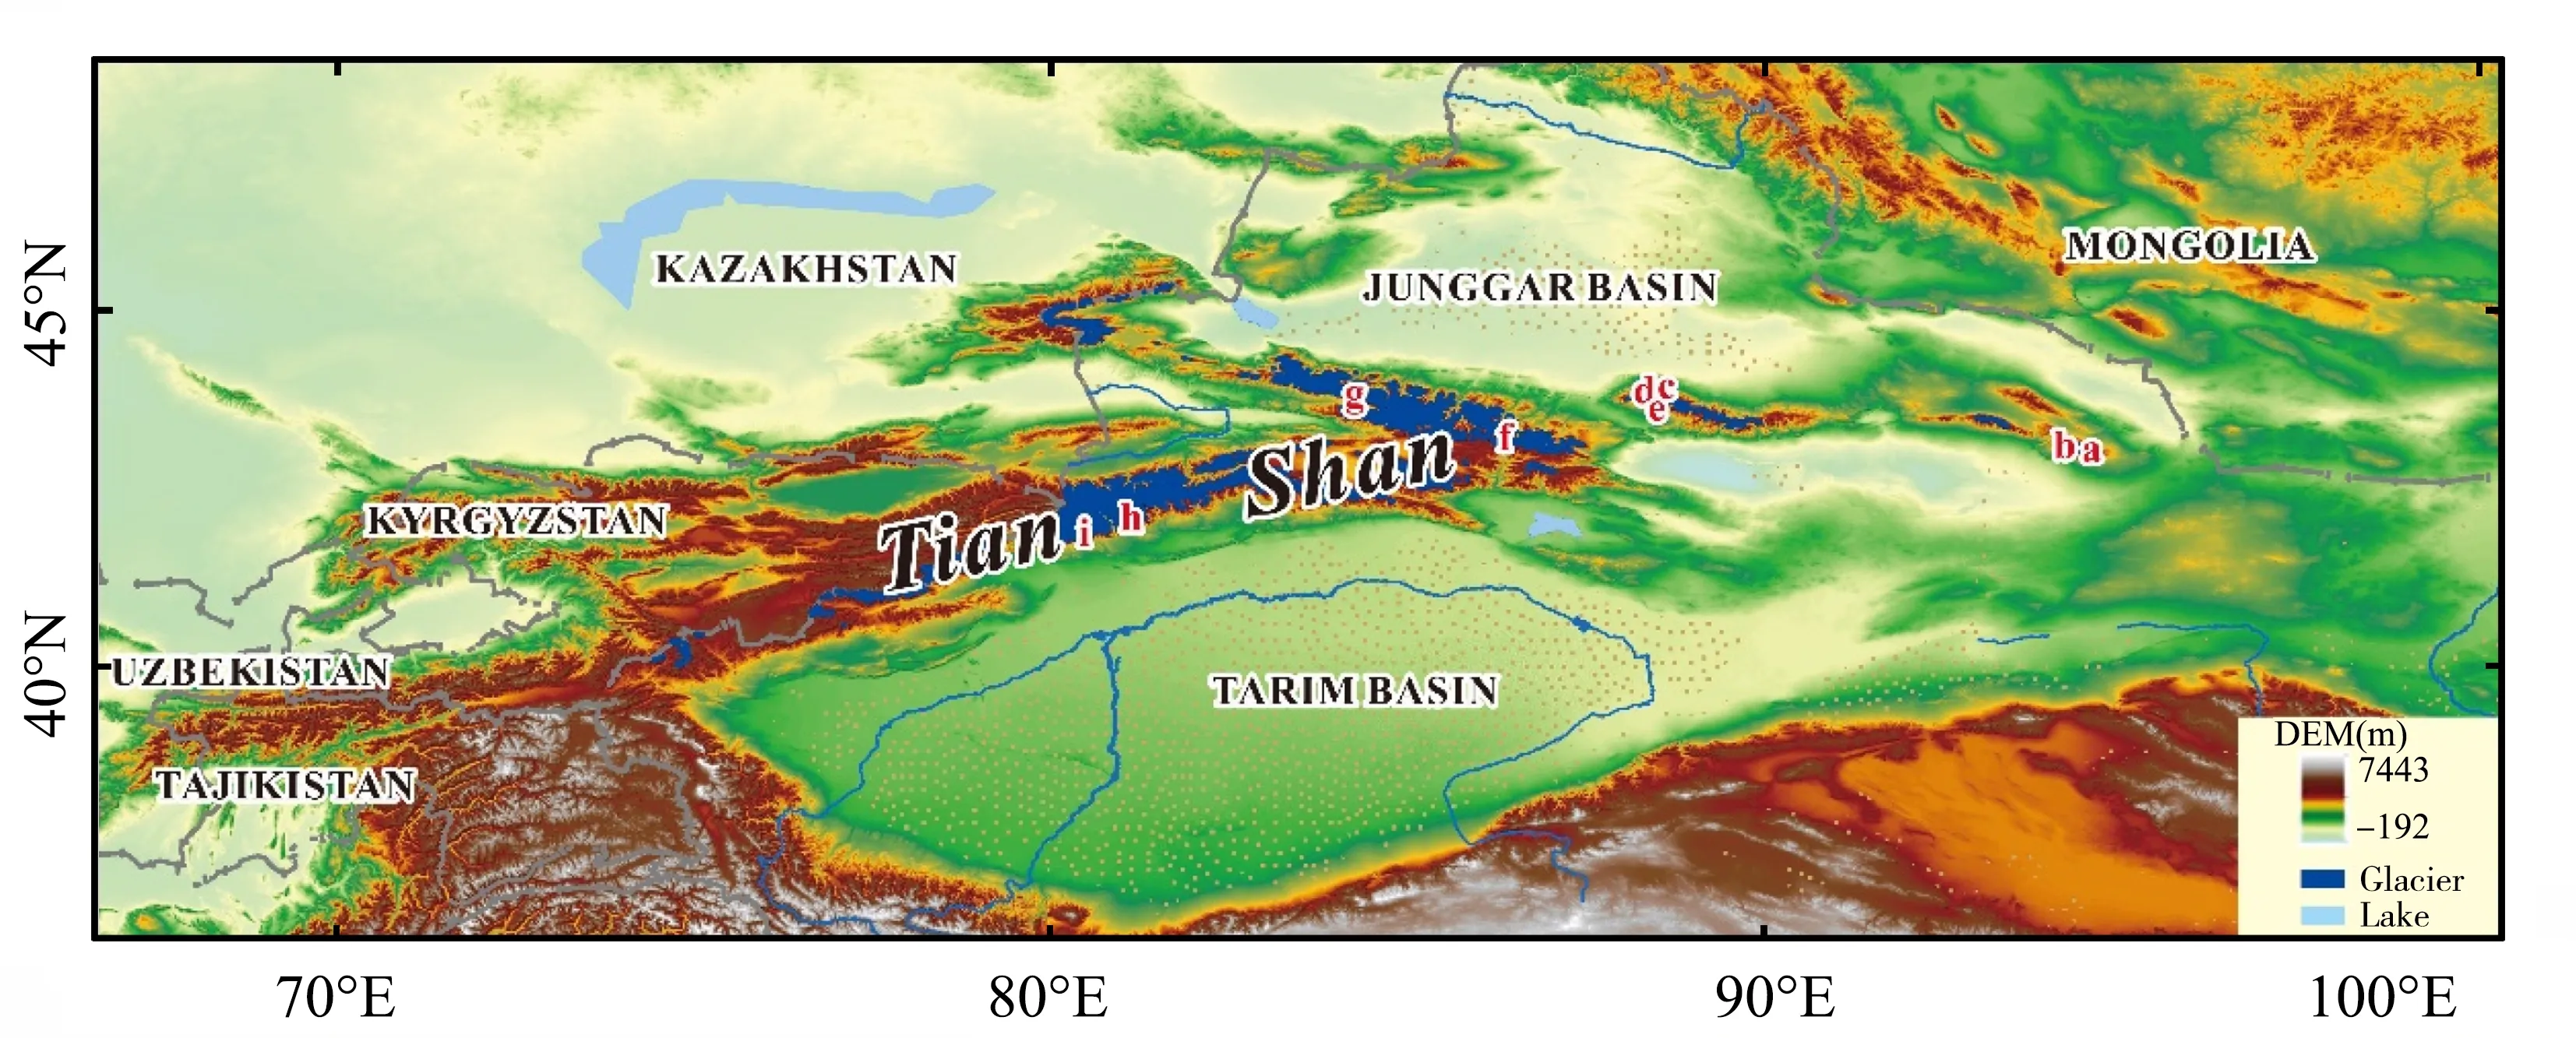
Figure 1 The geographical surroundings of the study area and the location of nine glaciers monitored in the Chinese Tian Shan:(a)Miao'ergou Ice Cap,(b)Yushugou Glacier No.6,(c)Sigonghe Glacier No.4,(d)Fan-Shaped Diffluence Glacier,(e)Heigou Glacier No.8,(f)Urumqi Glacier No.1,(g)Haxilegen Glacier No.51,(h)Keqikar Glacier,and(i)Qingbingtan Glacier No.72
4.2 The relation between changes in ice volume and area of Urumqi Glacier No.1
Urumqi Glacier No.1 is a northeast-facing valley glacier with two branches at the headwaters of the Urumqi River,as shown in Figure 3.It is a continuously monitored glacier,with the longest glaciological and climatological record in China.The glacier area decreased by 0.31 km2from 1962 to 2012,and the thinning was approximately 0.34 m/a from 1981 to 2012(Wang et al.,2016a).According to different years of glacier-area measurement,the ice volume and its change of Urumqi Glacier No.1 can be calculated for different periods from the glacier area and mass balance.Then,the glacier-volume-change ratio(dV/V)and the area-change ratio(dS/S)can be calculated.If the glacier areas surveyed in 2001 and 2006 are considered,for example,the ice-volume change is the accumulated mass balance from 2001 to 2006.Then,the annual averages of ice-volume and area-change ratios can be obtained.
The area-and volume-change ratios and their annual averages are listed in Table 2.The results calculated before 1982 are not included because the survey data from the 1960s to the 1970s are sparse,and the reliability is poor for the calculation of ice-volume change.There is an abnormality that the calculated area change is large during 1992-1994,while the volume change is very small,which is probably related to the separation of the East Branch and West Branch in 1993.Therefore,the figures from this period were excluded from the correlation analysis.
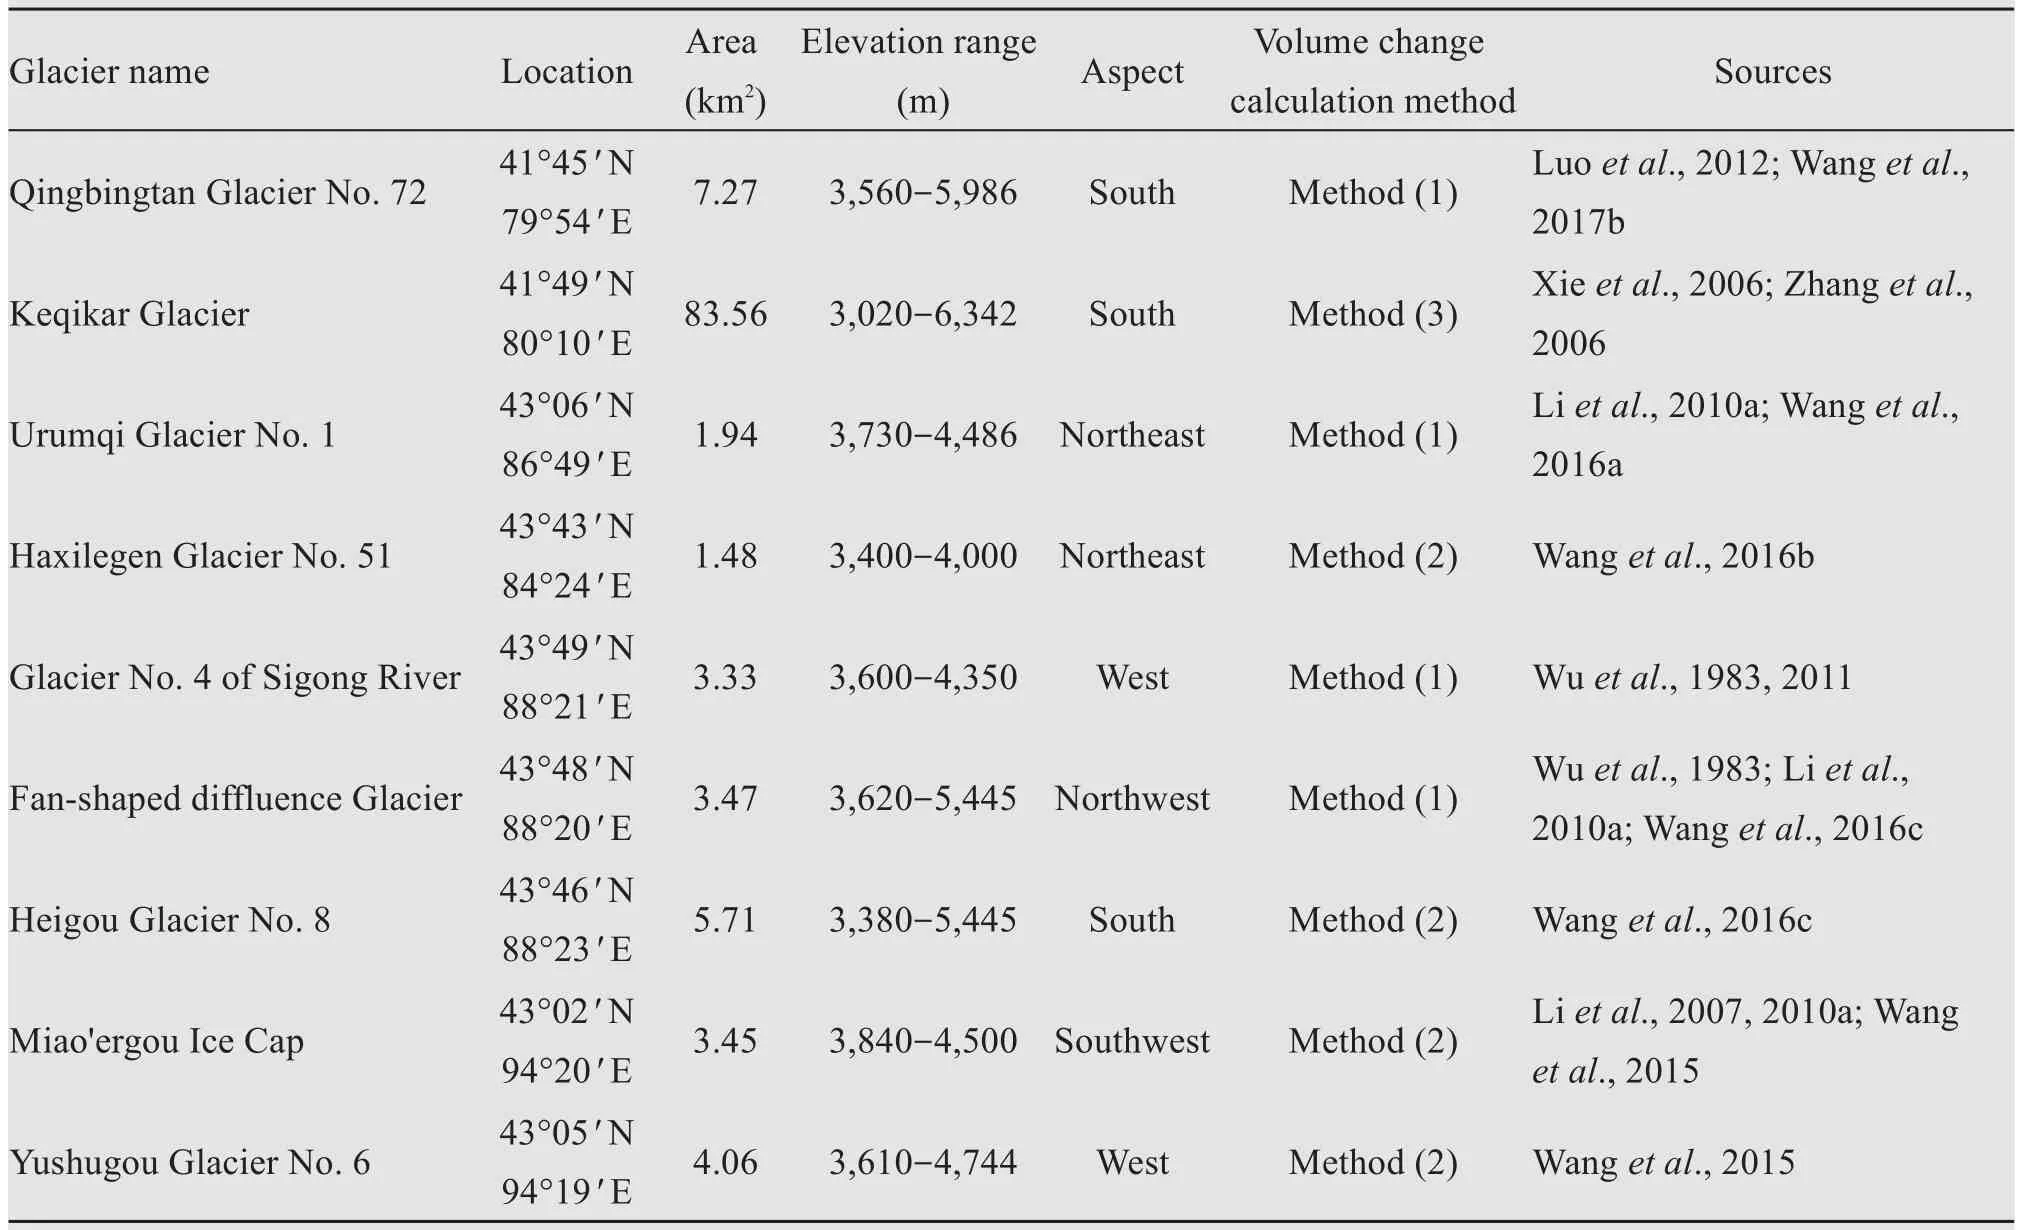
Table 1 Data and methods used for calculating changes of ice volume and area for the nine selected glaciers
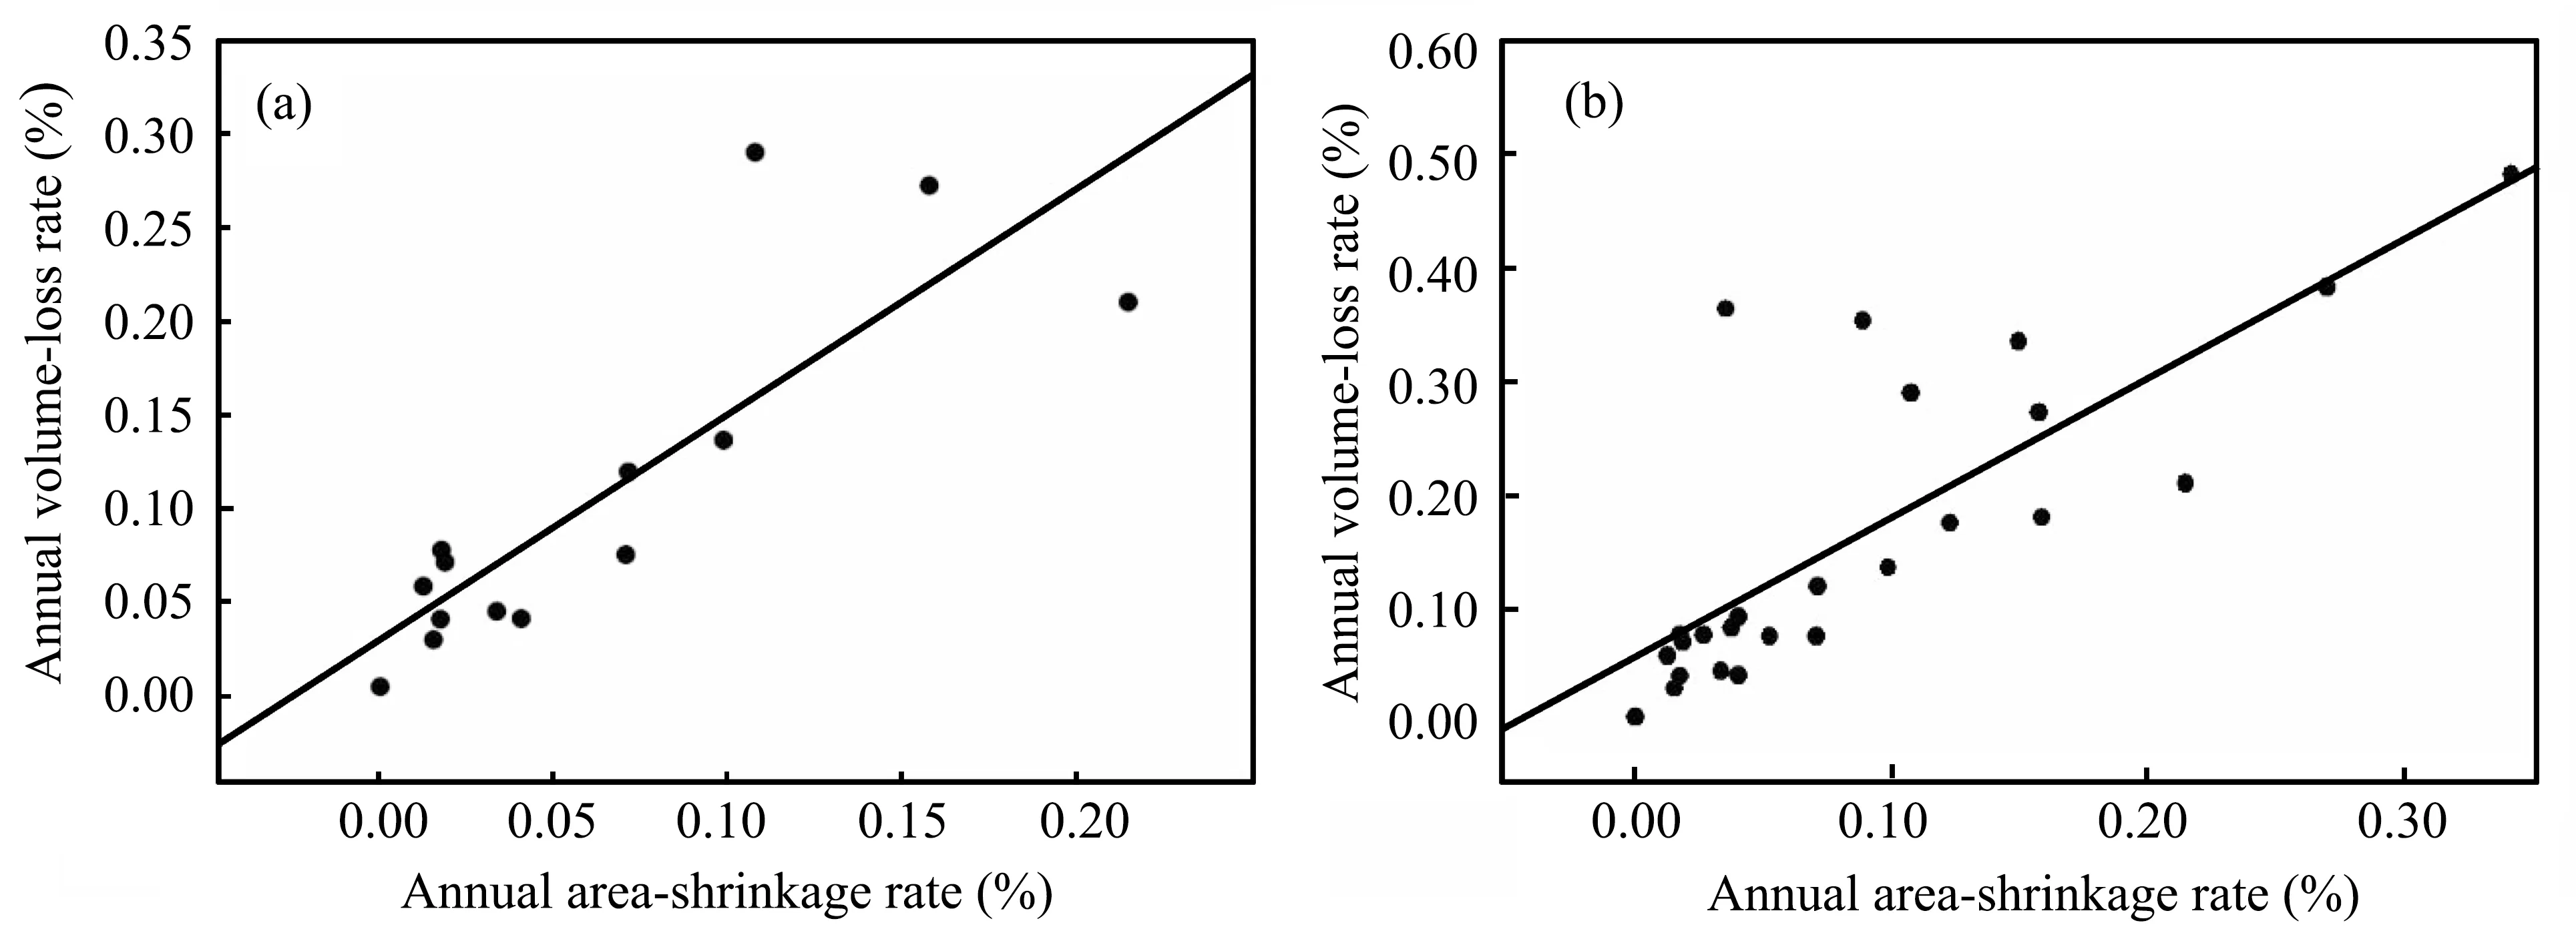
Figure 2 The relation between glacier-volume change and-area change obtained by(a)nine monitored glaciers;(b)twenty investigated glaciers in western China
The correlation analysis between the annual average ice-loss rate and the area-shrinkage rate(Table 2 and Figure 4)gives a regression formula as follows:
It is well known that there is a lag time between mass-balance change and glacier-terminus change due to glacier movement and dynamic process.The lag time is dependent mainly on glacier size,movement speed,and net mass balance at the terminus(Paterson,1994).For Urumqi Glacier No.1,the lag time is approximately two years from Wang et al.(2016a);and hence,each sampling period should be longer than two years.Among our data samples,all time periods are more than two years except for 2000-2001;and it can be seen from Table 2 that the volume-change ratio is obviously lower in this year.The correlation coefficient increases to 0.805 if the 2001-2002 data are deleted.These results indicate that the relation between ice-volume change and area change in reasonable periods can be well described in term of a linear model for an individual glacier when its geometric morphology does not change much.
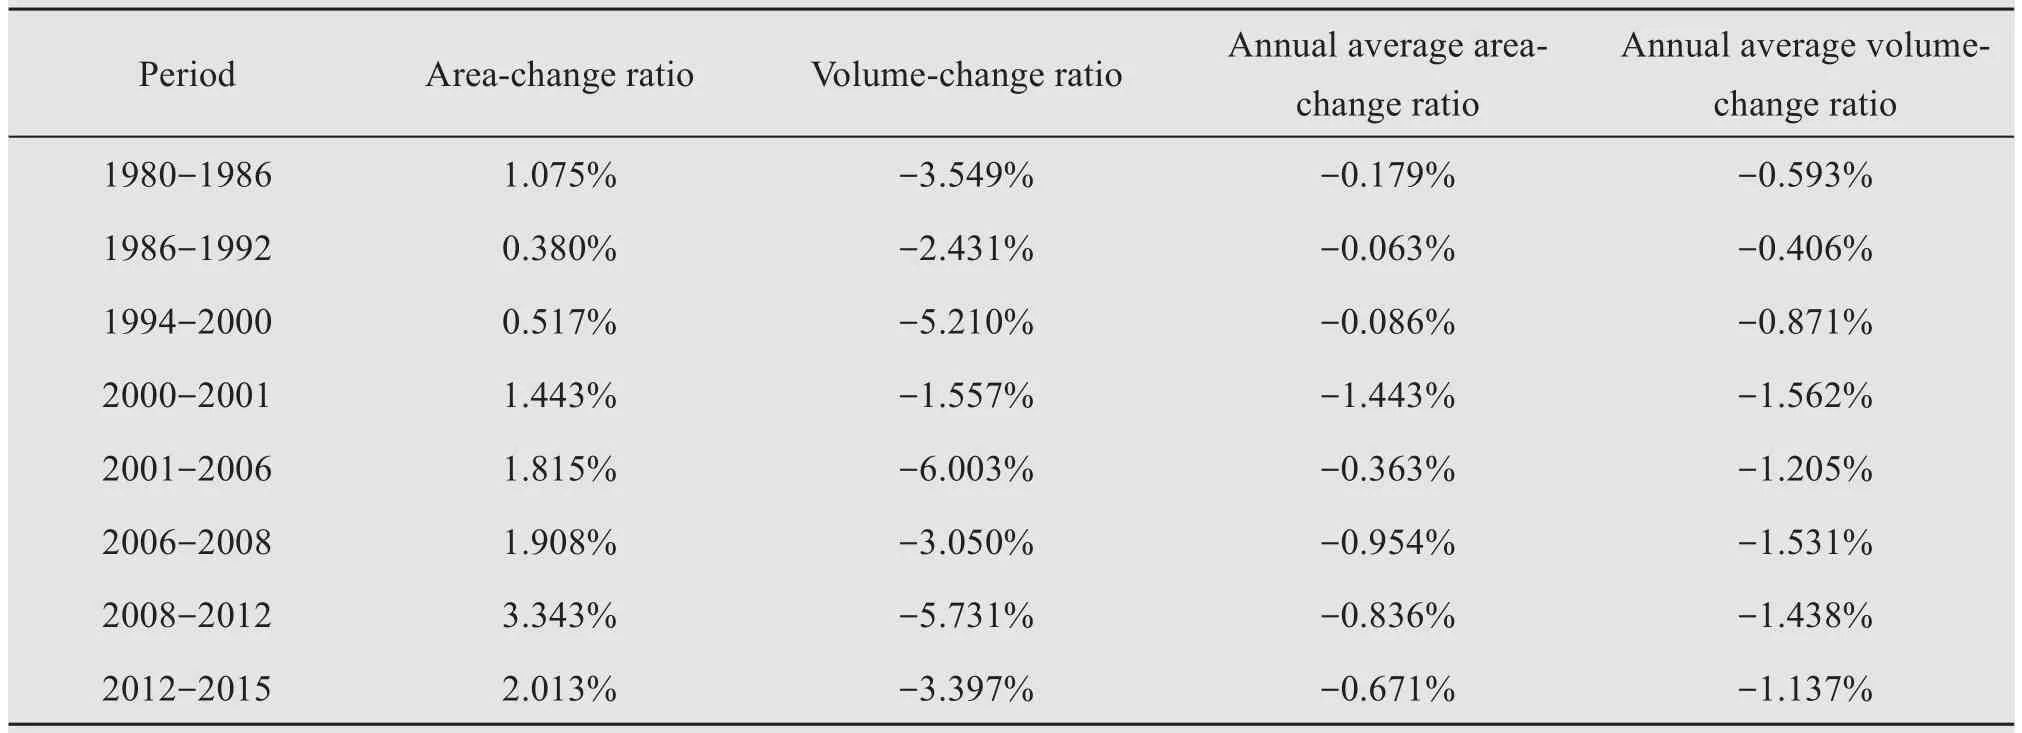
Table 2 Area-and volume-change ratios and their annual averages in the different periods since 1980 for Urumqi Glacier No.1
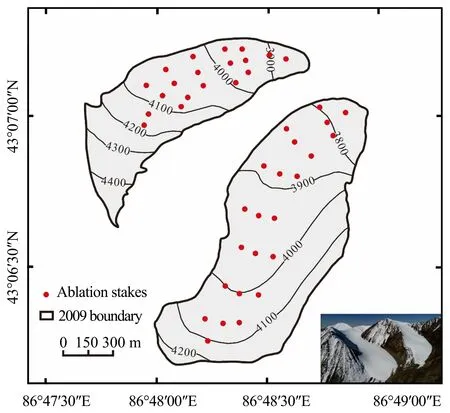
Figure 3 The surface elevation of Urumqi Glacier No.1.The figure in the lower right corner was photographed by an unmanned aerial vehicle on April 25,2018
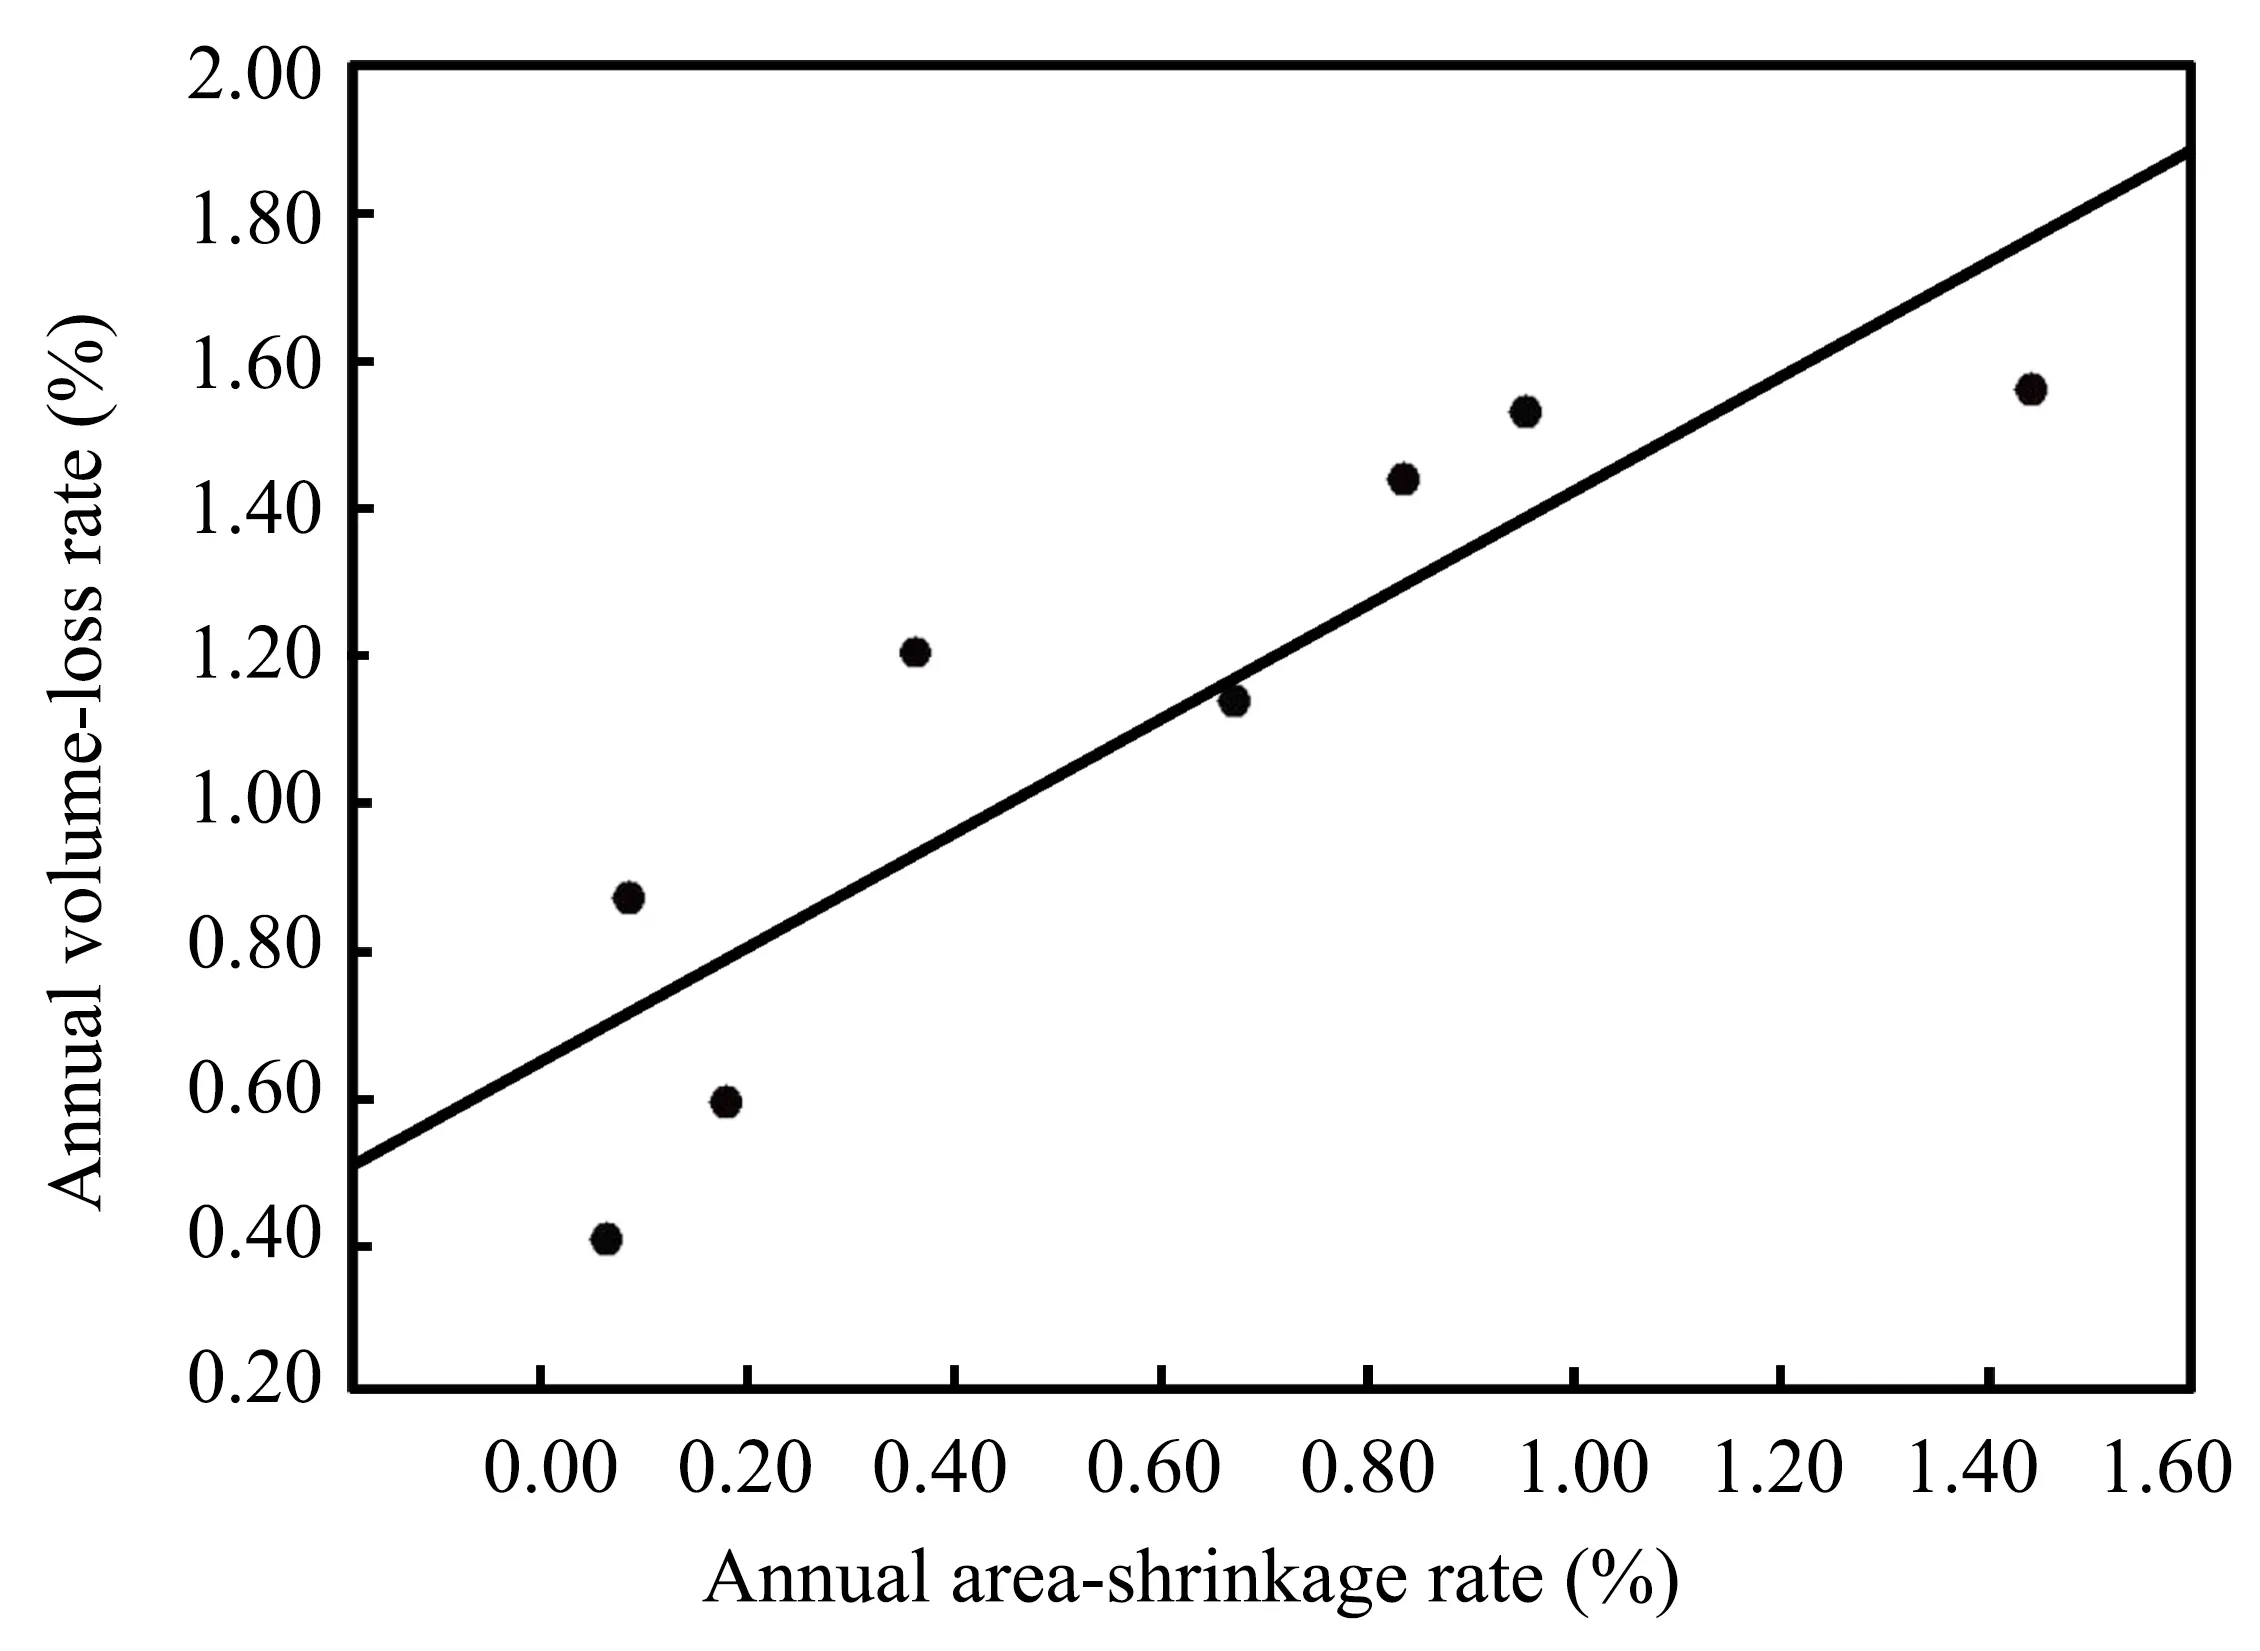
Figure 4 The correlation between volume loss and area shrinkage for Urumqi Glacier No.1
4.3 The relation between changes in ice volume and area of Qingbingtan Glacier No.72
Although systematic observation has been carried out for Qingbingtan Glacier No.72(Figure 5),detailed thickness measurement was taken in the ablation area only once.The glacier area was measured only three times using remote sensing,and so it is hard to obtain sufficient data samples to do a statistical analysis of volume and area change.Nevertheless,the difference in volume and area change between these periods can be discussed.
According to a glacier topographic map in 1964,SRTM in 2000,GPS data in 2008,and High Mountain Asia 8-meter DEMs Derived from Along-track Optical Imagery V001 in 2015,the glacier area and volume change and their annual change rate in 1964-2000,2000-2008,and 2008-2015 can be calculated,as shown in Table 3.
It can be seen from Table 3 that the area-change rate in 1964-2000 is slightly more than in 2000-2008,but the volume-change rate is less than half of that in 2000-2008,meaning more thinning and stronger melting occurred in the later period.Both glacierarea and volume-change rates in 2000-2008 are larger than in 2008-2015,indicating that area shrinkage and ice loss have been decreasing in recent years.The area-change rate in 2008-2015 is about two-thirds of that in 2000-2008,but the volume change rate is about 85%of that in 2000-2008—showing that slowdown of area shrinkage is more intensive than that of ice loss after 2008,which is related to the decrease in glacier melting due to inhibition by the debris cover(Wang et al.,2017b).
Table 3 gives the ratio between volume change and area change,which could be regarded as thickness change and makes sense;if there is a linear relation between volume change and area change,the ratio should change less.However,the ratio has a large variation for the three different periods,explaining that the relation between volume change and area change is different during the different periods.From Table 3,we can see that the ratio between volume change and area change becomes larger and larger,meaning that volume change is more and more determined by thickness change.When the glacier terminus is stable,volume change is basically caused by thickness change.
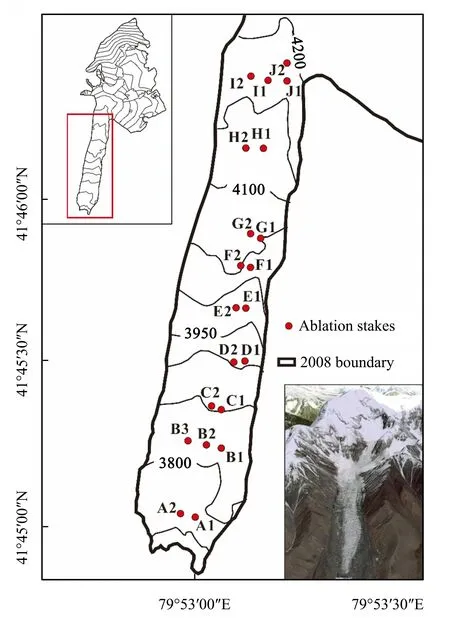
Figure 5 Topographic map of Qingbingtan Glacier No.72 and the surveyed area.The figure in the lower right corner is the satellite image from Google Earth
5 Discussion
5.1 Influence of glacier-type and surface-mor‐phology differences
5.1.1 The difference in the relation between ice volume and area of various types of glaciers
Because the relation between different geometric parameters is different for various glaciers,using one formula to describe the relation between changes in ice volume and area certainly will cause large errors.However,it is impossible and would be meaningless to establish a formula for each individual glacier.According to morphology,mountain glaciers are mainly classified as valley glaciers,cirque glaciers,ice caps,and hanging glaciers.Generally,hanging glaciers are numerous but so small in size that the ice volume within a drainage basin or a region is mostly determined by valley and cirque glaciers and ice caps.Therefore,it is reasonable to establish the relation between changes in ice volume and area for these three type glaciers for effective estimation of ice-volume change in the watershed or on a regional scale.
For valley glaciers,such as Urumqi Glacier No.1,a good linear correlation exists between changes in ice volume and area,as shown above by analysis.For ice caps and cirque glaciers,representative glaciers need to be chosen for systematic observation;and then correlation analysis can be done based on sufficient observation data.If the linear relation also exists for ice caps and cirque glaciers,the constants in its correlation formula must be different from that for valley glaciers because ice-volume change of the ice cap and cirque glaciers is mainly determined by icethickness change.
5.1.2 Influence ofthe difference in surface characteristics on glacier change
Various glacier-surface characteristics can lead to difference in the glacier accumulation and ablation process and then results in different relations between changes in ice volume and area.The mass balance of avalanche-feeding glaciers with complex surface topography is more complicated than that of glaciers with regular shape and smooth surface.In addition,debris cover is another important factor influencing glacier mass balance,such as shown by Qingbingtan Glacier No.72.
The accumulation area of Qingbingtan Glacier No.72 is irregular.The western part of the accumulation area between approximately 4,300 and 6,000 m is extremely steep,leading to the occurrence of snow/ice collapse.Because the solid precipitation at the high elevations can be rapidly transferred down to the lower elevations,such as the basin at 4,200-4,300 m,the equilibrium-line altitude is relatively stable(Wang et al.,2017b).
Many previous studies have pointed out that thicker debris cover is just like a protective carapace,which isolates the underlying ice and reduces the glacier's melting significantly.Commonly,debris cover of a few centimeters thick has an effect of accelerating glacier's melting;but it will restrain glacier melting when its thickness exceeds a certain value(Bolch et al.,2012;Pieczonka et al.,2013;Pieczonka and Bolch,2015;Pratap et al.,2015).For Qingbingtan Glacier No.72,the critical thickness of debris cover is about 4 cm;and the debris cover is generally thicker than the critical value.Therefore,the debris on this glacier has an alleviating ablation effect overall.
Combining glacier changes in recent decades and future change scenes,the glacier change can be divided three phases.The first phase is from the late 20th century to early this century,during which the narrow tongue experienced serious melting and retreated rapidly,with the terminus retreat distance of approximately 1,800 m from 1964 to 2008.The second phase began in early this century.Since then,the glacier-tongue-area shrinkage and its terminus retreat began to retard gradually due to an alleviating ablation effect of debris cover,but the glacier thinning has been still obvious.The third phase is the future decades.With the debris belt merging and further expansion,the lower part of the glacier tongue will be covered completely.The terminus retreat will slow down continuously until reaching the stable state,and the ice-volume loss will be caused mainly by glacier thinning.Therefore,for the glacier with complex morphology and debris cover,the relation between changes in ice volume and area should be different during the different phases.
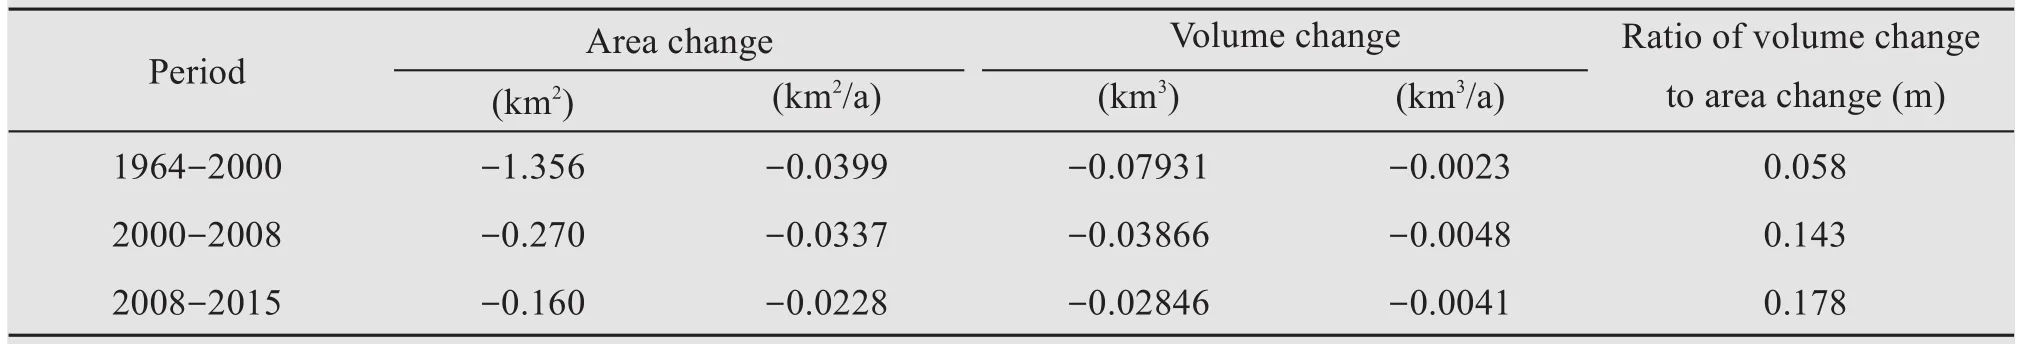
Table 3 Area and volume change of Qingbingtan Glacier No.72 for the different periods
5.2 Accuracy of the ice-volume-change estimation
5.2.1 Difference in the estimation method
To study the relation between changes in ice volume and area of glaciers,the accurate area data and volumechange estimation are the precondition.The glacier-area change is relatively easy to obtain by field survey and remote sensing,and especially the rapid development of high-resolution remote sensing can provide the higher accuracy of glacier-area data.But ice-volume change is very difficult to obtain.Some methods can be used to estimate ice-volume change,including the glacier-surfaceelevation change estimated by a digital elevation model(DEM)obtained from remote sensing,the mass balance observation,the ice-thickness change from repeat thickness measurements,and hydrological methods,etc..Because accuracy is not same for different methods,it is hard to estimate the final accuracy when we put the icevolume changes obtained from various methods together for statistical analysis.
5.2.2 Difference in the study period
The time difference in data acquisition for glacierarea-change and ice-volume-change estimation includes two aspects.One is the time length.It is only several years for some glaciers,but several decades for others.Another difference is that some periods are in recent years,and some are decades ago.Both differences must influence the statistical relation between changes in ice volume and area.
As mentioned above,there is a delay response of the glacier terminus to the mass balance change;and the lag time is different for the various types and sizes of glaciers.The lag time is several years for the smallsize valley glacier such as Urumqi Glacier No.1.Considered from this aspect,the longer collection period of the data is better.However,analysis of the Qingbingtan Glacier No.72 shows that the relation of changes in ice volume and area is different in the different phases;and the shorter data period seems better.Therefore,further consideration is needed on how to balance the time length and to do an analysis within a period.
5.2.3 Difference in the data spatial coverage
The data spatial coverage is different for the various glaciers.Some ice-volume-change estimation is based on large-area-observation data on glaciers(e.g.,Urumqi Glacier No.1).Some estimates are from observations limited to the ablation area,such as Qingbingtan Glacier No.72.Many are from data confined to only a small area near the glacier terminus.And some are even roughly from short observation at several points.Although DEM can cover the whole glacier,the resolution cannot be satisfactory generally for mountain glaciers,except for large-size glaciers with relatively smooth surfaces.
6 Conclusion and outlook
Glacier-volume change not only is one of the main contributors to sea-level change but also has crucial impacts on regional water resources,the ecological environment,and the social economy.However,it is difficult to carry out in situ measurements or to model for regional glacier-volume changes.Based on the ice-volume-estimation results of nine glaciers in the Tian Shan and eleven glaciers on other mountains in China,this study makes an attempt to investigate the relation of changes in the ice volume and area of glaciers.The results show that a linear relation exists between changes in the ice volume and the area of glaciers,but the correlation coefficient is not high.The probable reason is that,on the one hand,there are errors in the observation data and volume estimation;and on the other hand,the glacier-response process to climate change is not the same for various glaciers due to differences in the glacier type,size,and surface characteristics in different regions and periods.
Two reference glaciers were then selected as samples to be analyzed in more detail.The observation data of Urumqi Glacier No.1 is most abundant in China.The linear relationship between changes in ice volume and area is good,with the coefficient of 0.8.This finding suggests that the relation between changes in ice volume and area is the same in different periods for an individual glacier if its morphological type remains visibly unchanged and also for the same type of glaciers in the same period.
The Qingbingtan Glacier No.72 in the Tomor region is a valley glacier with complex morphology and debris cover.The equilibrium-line altitude has been relatively stable in past decades,and the debris cover has an overall alleviating ablation effect.Due to special topographic and debris-cover effects,the relationship between changes in the ice volume and the area is different at different periods.
Further study needs to focus not only on acquiring accurate ice-volume changes but also on classification research according to glacier types and surface characteristics in different regions and periods.
Acknowledgments:
This research was funded by the National Natural Science Foundation of China(41771077),the Funds for Creative Research Groups of China(41421061),the Strategic Priority Research Program of Chinese Academy of Sciences(XDA20020102),and the Youth Innovation Promotion Association of CAS.
 Sciences in Cold and Arid Regions2019年1期
- Sciences in Cold and Arid Regions的其它文章
- Increase in medium-size rainfall events will enhance the C-sequestration capacity of biological soil crusts
- How changes of groundwater level affect the desert riparian forest ecosystem in the Ejina Oasis,Northwest China
- Accumulation and geochemical evidence for the Little Ice Age episode in eastern Antarctica
- Vulnerability and adaptation of an oasis social–ecological system affected by glacier change in an arid region of northwestern China
- The analysis of heat and water fluxes in frozen silty soil
- The changing process and trend of ground temperature around tower foundations of Qinghai-Tibet Power Transmission line