
Seasonal and spatial variations in rare earth elements and yttrium of dissolved load in the middle, lower reaches and estuary of the Minjiang River, southeastern China*
2018-07-11 01:58:12ZHUXuxu朱旭旭GAOAiguo高愛國LINJianjie林建杰JIANXing簡星YANGYufeng楊玉峰ZHANGYanpo張延頗HOUYuting侯昱廷GONGSongbai龔松柏
ZHU Xuxu (朱旭旭) GAO Aiguo (高愛國) LIN Jianjie (林建杰)JIAN Xing (簡星) YANG Yufeng (楊玉峰) ZHANG Yanpo (張延頗)HOU Yuting (侯昱廷) GONG Songbai (龔松柏)
1College of Ocean and Earth Sciences,Xiamen University,Xiamen 361102,China
2State Key Laboratory of Marine Environmental Sciences,Xiamen 361102,China
3Marine and Fisheries Technology Center of Fuzhou,Fuzhou 350026,China
A bstractWith the aim of elucidating the spatial and seasonal behaviors of rare earth elements (REEs),we investigated the dissolved REE concentrations of surface water collected during four seasons from middle, lower reaches and estuary of the Minjiang River, southeastern China. The results display that the REE abundances in Minjiang River, ranging from 3.3-785.9 ng/L, were higher than those of many of the major global rivers. The total REE concentrations (∑REE) were seasonally variable, averaging in 5 937.30,863.79, 825.65 and 1 065.75 ng/L during second highest flow (SHF), normal flow (NF), low flow (LF) and high flow (HF) season, respectively. TheR ( L/M)andR (H/M)ratios reveal the spatial and temporal variations of REE patterns, and particularly vary apparently in the maximum turbidity zone and estuary. REE patterns of dissolved loads are characterized by progressing weaker LREEs-enrichment and stronger HREEsenrichment downstream from middle reaches to estuary during all four seasons. Comparing with NF and LF seasons, in which REE patterns are relatively flat, samples of SHF season have more LREE-enriched and HREE-depleted patterns that close to parent rocks, while samples of HF season are more LREEs-depleted and HREE-enriched. REE fractionations from the middle to lower reaches are stronger in the SHF and HF seasons than those in NF and LF seasons. Generally, spatial and seasonal variations in REE abundance and pattern are presumably due to several factors, such as chemical weathering, mixture with rainfall and groundwater, estuarine mixing, runoff, biological production and mountain river characters, such as strong hydrodynamic forces and steep slopes. The highest Gd/Gd*always occurs at north ports during all four seasons, where most of the large hospitals are located. This suggests Gd anomalies are depended on the density of modern medical facilities. Y/Ho ratios fluctuate and positively correlate to salinity in estuary,probably because of the geochemical behavior differences between Y and Ho.
Keyword:rare earth elements (REEs); Minjiang River; estuarine mixing process; dissolved load; online pre-concentration system
1 INTRODUCTION
REEs have been widely used as effective tracers of chemical oceanography and paleoceanography, such as estuarine mixing (Hoyle et al., 1984; Elderfi eld et al., 1990), oceanic water mass mixing and circulation(Raso et al., 2013; Rousseau et al., 2013;Zheng et al., 2016), anthropogenic pollutions (Nozaki et al., 1997; Hathorne et al., 2012), redox potential of natural waters (Elderfi eld and Greaves, 1982;Lawrence and Kamber, 2006) and diagenetic process(Jian et al., 2013; Zhang et al., 2014). Furthermore,REE tracers are useful to describe the geochemical processes when the traditional hydrochemical methods, such as major ions and stable isotopes, are unreliable (Tweed et al., 2006). Since 1980s, a great number of studies have focused on the REE background values and patterns of water in rivers,estuaries and oceans (Goldstein and Jacobsen, 1988;Qu et al., 1993; Sholkovitz, 1995; Wang and Liu,2008; He et al., 2010).
Early works suggest that the REE abundance in dissolved loads of river can be controlled by parent rock types, water-particle interaction, stabilization and coagulation by organic colloids, coprecipitation of ferric hydroxides, water-sediment interface exchange, planktonic absorption and anthropogenic impacts (Elderfi eld and Greaves, 1982; Elderfi eld et al., 1990; Xu and Han, 2009), and waters in estuary show removal, dissolution and fractionation of REE(Goldstein and Jacobsen, 1988; Lawrence and Kamber, 2006; Osborne et al., 2015). Several authors have reported seasonal variations of REE abundances and patterns in natural waters, and the fluctuations in REE abundances and patterns could be significant(Shiller, 2002; Bagard et al., 2011; M?ller et al.,2014). However, the seasonal variations of REE patterns and related geochemical implications remain open questions. Data of water in different seasons could reflect the temporarily unusual conditions of catchment areas (Shiller, 1997). Therefore, more works are needed to have a better understanding of the temporal geochemical variations of water in different seasons.
Small mountainous rivers have much greater sediment and dissolved solids discharge yields and soil erosion rates than big rivers, and act as significant roles in global marine geochemistry circulation(Milliman and Farnsworth, 2011). Minjiang River is the biggest mountainous river of southeastern China,and it is characterized by large elevation gradient and strong hydrodynamic force. The runoff volumes and precipitations showed clear seasonal changes in Minjiang River basin (Liu et al., 2001). Minjiang River Basin is warm and humid with strong chemical weathering conditions. Furthermore, the mountainous river is considered as highly responsive to temporal variations of REEs abundances and patterns. Hence,Minjiang River is an ideal area for the researches of seasonal variations of estuarine rare earth elements geochemical behaviors. Although there have been plenty of geochemical researches focused on Minjiang river, such as stable isotopes deuterium and oxygen-18, magnetic susceptibility, uranium-lead dating of detrital zircons, nutrients (Xu and Chen,2010; Ye et al., 2011; Zhang et al., 2013), REE data and corresponding variations remain poorly known.
The aim of this study is to: (1) defi ne the REEs concentrations and patterns of the Minjiang River, (2)explore the Specific spatial and seasonal variations of REEs concentrations and patterns and the related REEs behaviors and (3) achieve better understandings of temporal variability of REEs abundances and patterns in mountainous rivers. An online preconcentration system coupled with ICP-MS was used for fi rst-time measurements of REE concentrations of Minjiang River samples, which were collected during four seasons.
2 NATURAL SETTING
The Minjiang river basin is located in Fujian Province, southeastern China, reaching from 25°23′N to 28°16′N and from 116°23′E to 119°35′E. As the largest mountain river on the southeast coast of China,the Minjiang River is 2 872 km long and covers an area of 60 992 km2. The Minjiang River originates in the Wuyi Mountains located on the border of Fujian and Jiangxi Provinces. It flows through these provinces and fi nally into the East China Sea. The Minjiang river basin is moist and warm, and has four distinct seasons with a subtropical humid monsoon climate. The average annual air temperature of the entire basin is 16 to 20°C. The Minjiang drainage area is located in a high precipitation region with an annual total rainfall of 1 700 mm. Up to 70%-80% of the rainfall occurs from April to September. The river runoff changes seasonally, being highest in summer,followed by spring and autumn, and the lowest in winter. The runoff during summer (May to August)accounts for 50% of the annual total.
The middle reaches of the Minjiang river basin have a large elevation gradient (>0.5‰) and a relatively narrow river channel. As a result, the flow in the middle reaches is torrential. The river channel becomes wider in the lower reaches of the river, and the flow slows down. The Minjiang River is divided into branches, known as north and south ports. The Dazhang Brook, which is the largest tributary of the Minjiang River, flows into the river through the south ports. The river water from the north and south ports joins at Mawei, flows through Langqi Island, and then into the East China Sea. The Minjiang estuary is a typical macro-tidal estuary with a regular semidiurnal tide. The inf l uence of the tide decreases upstream and the tide is a reversing tidal current. The tidal impact also changes over time as a result of the seasonal difference in runoff and the flood-ebb fluctuation.Therefore, the maximum turbidity zone moves, which is usually determined by the salinity.

Fig.1 Position of the study area in the Minjiang river basin (a) and the sampling locations (b)The defi nitions of the subareas are presented in Table 1.
Paleozoic granitoids and Early Mesozoic granites are exposed in the upper-middle sections of the river basin (Xu and Chen, 2010). The lower parts of the river basin lie in the Fuzhou basin, where Yanshanian granite, Jurassic volcanic rocks, and Quaternary sediments are widely distributed. The Jiangxi, Fujian,and the Inner Mongolian Provinces are three of the areas with the richest rare earth element (REE)deposits in China. There are abundant REE deposits located on the upper and middle sections of the Minjiang river basin.
3 MATERIAL AND METHOD
3.1 Sampling and analytical methods
The sampling locations, which include river endmember, estuarine mixing zone and sea end-member,are geographically divided into six subareas (Fig.1,Table 1). One hundred and twelve surface waters were collected from middle and lower reaches and estuary of Minjiang River during four seasons from August 2014 to May 2015. Samples were collected using Nalgene low-density polyethylene (LDPE)containers, and were immediately fi ltered through 0.45 μm Millipore acetate cellulose membranes. The fi rst 100 mL fi ltered solution was discarded to clean the fi lter and membrane, and the rest was stored in pre-cleaned LDPE bottles. Collected samples were acidized to pH<2 using 12 N nitric acid within 12 h of collection in laboratory, and preserved in low temperature.
The REE concentrations were measured using the online preconcentration system (ESI seaFAST S2)coupled with an ICP-MS (Perkin Elmer Nexion 300D) at the Key Laboratory ofinspection and Quarantine Technique, Fuzhou, China. The seaFAST system uses PA-1 mixed resin (Hitachi, Japan) with ethylenediaminetriacetic acid and iminodiacetic acidfunctional groups. The water samples were loaded by the FAST auto-sampler and injected into the mixedresin column. The REEs of the samples were then chelated on the pretreatment column, while the alkali and alkaline earth elements were washed out. Next,the REEs were eluted into nitric acid, which was then directly injected into the ICP-MS. The above processes allow the separation and preconcentration of REEs, and also reduce the background level. In our determination of REEs (Zhu et al., 2017, in press), the procedure blanks and detection limits were 0.002-0.083 ng/L and 0.007-0.250 ng/L, respectively. The precision was generally <3% (1 s) for most of the REEs, except Ce (3.56%). Certified reference materials (CRMs) of NRCC, including SLEW-3,CASS-4, and NASS-6, were measured to assess the accuracy of the method. The results show that the data measured by this method were in good agreement with values from literature. The recoveries of REEs were 96.0%-107.4% when measuring the Minjiang surface water samples. Overall, this method showed good performance in measuring the REEs in natural waters. Salinity and temperature was measured in situ using salinometer YSI EC300, pH was measured with a pH meter, phosphate was measured using the Seal auto-analyzer 3, sulfate was measured with an ion chromatograph, suspended substance (SS) was measured by gravimetric method, and real-time runoffvolume was supplied by the Shuikou Hydropower Station (Table 2).
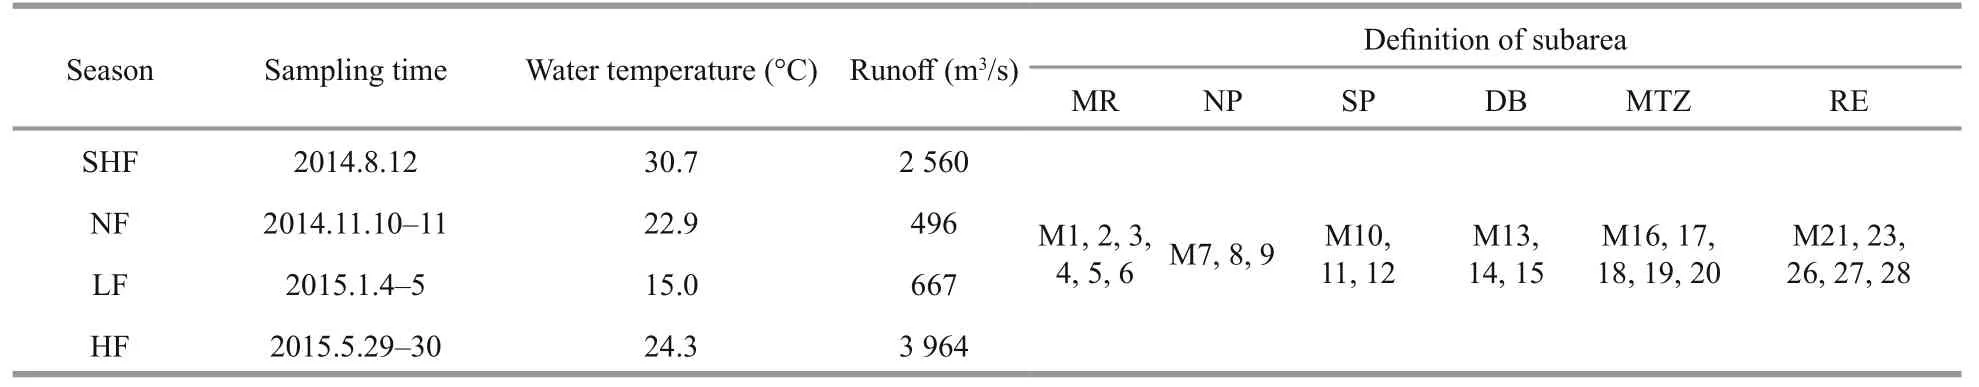
Table 1 Sampling time, physical indicators, and defi nition of subareas
3.2 Data analysis
All measured REE concentrations were normalized using their average concentrations in North American shale (NASC) (Haskin et al., 1968). Light elements(LREEs), medium elements (MREEs), and heavy elements (HREEs) of REEs were defi ned as La-Nd,Sm-Dy, and Ho-Lu+Y, respectively. Noack et al.(2014) consider LREE/MREE and HREE/MREE ratios to be useful indexes of succinct and unbiased characteristics of REE patterns.R(L/M)andR(H/M)are calculated as follows:

LaN, PrN, NdN, SmN, TbN, DyN, TmN, YbN, and LuNindicate their (La, Pr, Nd, and so on) NASC normalized REE concentration. Ce, Eu, and Gd were excluded from the calculation as they can exhibit different oxidation states (Duvert et al., 2015). The anomalies of Ce, Eu, and Gd were defi ned as follows (Lawrence and Kamber, 2006):

where values >1 indicate positive anomalies and values <1 negative anomalies.
4 RESULT
4.1 Measured and NASC-normalized REE concentration patterns
The total REE concentrations (∑REE) were seasonally variable. The ∑REE values, in descending order, were SHF (1 013.20-24 029.62 ng/L, with an average of 5 937.30 ng/L), HF (109.03-2 487.88 ng/L,average 1 065.75 ng/L), NF (329.84-1 925.80 ng/L,average 863.79 ng/L), and LF (174.65-2 073.26 ng/L,average 825.65 ng/L). The ∑REE of the SHF season was 5-6 times that of the other seasons (Table 2).
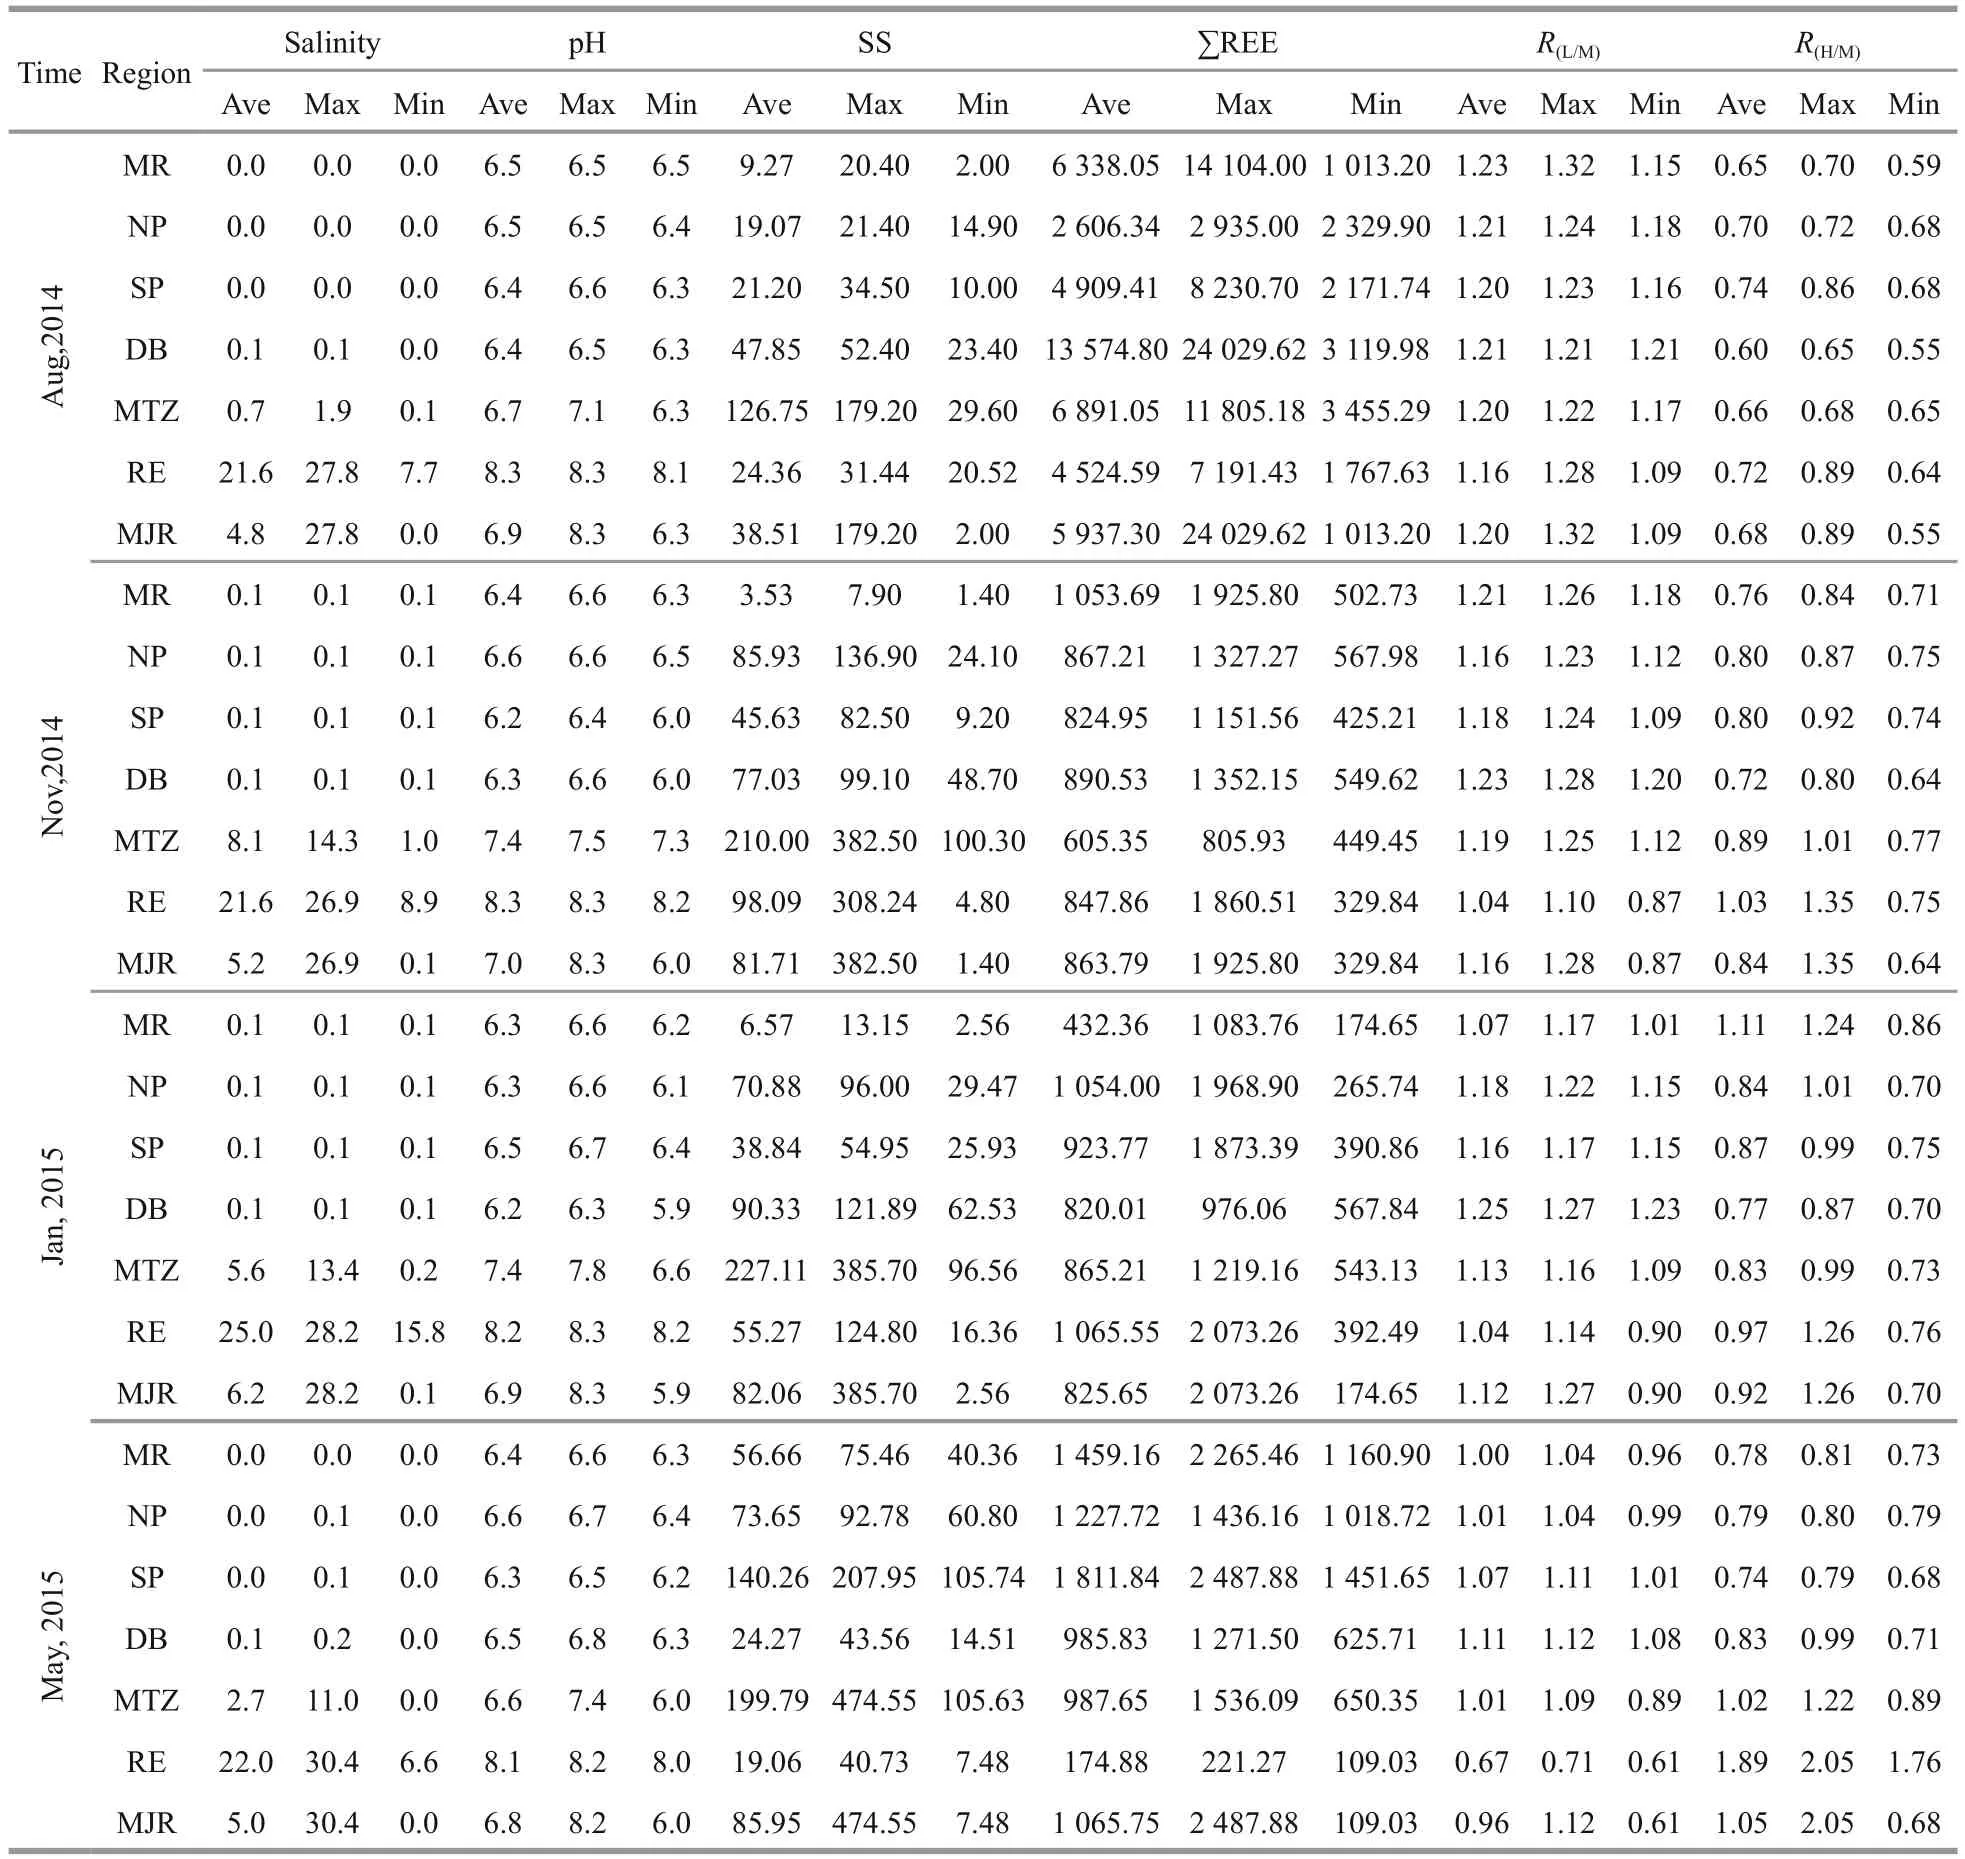
Table 2 Physical and chemical indexes, rare earth elements concentrations and NASC normalized ratios of rare earth elements in surface waters of the Minjiang river basin
The REE trends of the middle reaches (MR) and Dazhang Brook (DB) mainly decreased with a slight decline from LREEs to HREEs (Fig.2). In contrast, the samples collected from South port (SP), North port(NP), and the Maximum turbidity zone (MTZ) had a more flat pattern, and the REE trends of the estuary(RE) mainly increased. In general, there was a trend of progressively weaker LREEs-enrichment and stronger HREEs-enrichment downstream from MR to RE. The REE pattern observed at the different sampling positions of MR, SP, and NP were similar, whereas the pattern varied significantly at MTZ and RE.
4.2 NASC-normalized REE concentration ratios
Normalized ratios were used to further quantify the visual interpretations in Fig.2. The values in the NF(0.87<<1.28; 0.64<<1.35) and LF (0.90<<1.27; 0.70<<1.26) seasons were similar.Both had a flatter REE pattern than the other seasons.Samples from the SHF season (1.09<<1.32;0.55<<0.89) had more positiveR(L/M)ratios and more negativeratios, indicating stronger LREE-enrichment relative to MREEs, and depleted HREE relative to MREEs. Conversely, the samples collected during the HF season (0.61<<1.12;0.68<<2.05) depicted lowerratios and higherratios, and more depleted LREEs and HREE-enrichment. The seasonal variations(SHF>LF≈NF>HF) occurred in most of the subareas(like MR, DB, NP, and SP) of study region, and especially in the estuary.

Fig.2 Evolution of the REE patterns of surface water samples from the middle reaches to the estuarya. MR; b. lower reaches (NP and SP); c. MTZ; d. RE; e. DB. The legend for the map is the same as in Fig.1. We distinguish data of different seasons by colors.Blue square, pink triangle, orange rhombus and green circle represent SHF, NF, LF and HF season, respectively.
The surface waters of the MR and DB had the highestR( L/M)and lowestR(H/M)ratios during the four seasons (Table 2). The REE patterns in these subareas mostly displayed slight LREE-enrichment and HREEsdepletion. S amples from NP and SP had slightly lowerand slightly higherR(H/M)ratios compared with MR and DB. The spatial difference of REE normalized ratios (higherR(L/M)in NP and SP than that in MR and DB) varied seasonally. For example, the differences were smaller in SHF and HF than those in the other seasons, which suggest relatively weak REE fractionation. MTZ and RE had the largest ranges of normalized ratios, with RE presenting the lowestR(L/M)and highestR(H/M)ratios (Table 2). TheR(L/M)ratios declined andR(H/M)ratios increased from the middle and lower reaches, from MTZ to RE in sequence. This trend was most striking in the HF season, but was not evident in the SHF season.
4.3 Ce, Eu, Gd anomalies and Y/Ho ratios
The Ce/Ce*values of Minjiang River were 0.87-1.16, 0.78-1.02, 0.86-0.98 and 0.57-0.73 in SHF, NF,LF and HF season. The Ce/Ce*show similar values in middle, lower reaches and MTZ of Minjiang River in all seasons. Eu/Eu*varied slightly in the study area in all four seasons, and the average values of study area were 0.82, 0.75, 0.82 and 0.82 in SHF, NF, LF and HF season. Those average Eu/Eu*were very close to each other. Besides, Eu/Eu*of DB were slightly lower than those of the other subareas. The highest Gd/Gd*values of the four seasons occurred at NP, which was the most densely populated zone in the study area. Y/Ho ratios ranged from 26.69 to 32.29, 27.50 to 41.11,24.82 to 38.39, and 19.88 to 33.91 during the SHF,NF, LF, and HF seasons, respectively. Y/Ho ratios remained relative stable in the river end-member;whereas, they rose clearly in MTZ and RE.

Fig.3 Distribution of REEs concentrations and SS versus salinity in the Minjiang estuary during (a) SHF, (b)NF, (c) LF and (d) HF seasonThe stations discussed here included stations of MTZ and RE(M17-M28).
5 DISCUSSION
5.1 Characteristics of REE concentrations in Minjiang River
5.1.1REE abundances of Minjiang River
∑REE of the study area was higher than that of many of the major global rivers (Table 4), most likely because of the high rare earth background content.China has the world’s largest rare earth element reserves (Zhou et al., 2012). Furthermore, Minjiang River originates on the border of the Fujian and Jiangxi provinces, which are the main rare earth deposits of China (Yin et al., 2013). In addition, the upstream of the Minjiang River flows through Sanming and Longyan cities, where the main rare earth deposits of Fujian Province are located. Previous research has also reported high dissolved REE concentrations in other areas abundant in REE minerals (Meng and Ji, 2007; Jin et al., 2010).Furthermore, granitoid weathering crust, which is REE-enriched, is spread widely throughout the Fujian and Guangdong Provinces. The weathering-leaching process of granite always results in the enrichment of REE, especially in warm and moist basins (Wang et al., 1989), such as the Fujian and Guangdong provinces. Wu et al. (2003) reported that the river waters flowing through the Fogang granitoid weathering crust in Baisha, Guangdong Province,have high REE concentrations (710-15 000 ng/L),and attributed this to the climate and the inf l uence of granitoid weathering crust. In addition, we used 0.45 μm fi lter member in this study, the REEs concentrations are likely to be higher than that fi ltered through 0.22 μm fi lter member (Sholkovitz et al., 1995).
5.1.2Spatial changes of REE abundances
There was no clear correlation between salinity,pH, and REE abundance according to the water samples from the whole Minjiang river basin (Table 2). However, the correlations between REE concentrations and salinity in Minjiang estuary,including MTZ and RE, were different. We found that REE concentrations decreased across the salinity gradient in the estuary with the maxima in the midsalinity zone (S=3-10) (Fig.3). Such features have been reported in some of the early estuarine research,including the Connecticut and Tamar Rivers(Elderfi eld et al., 1990), Chao Phraya River (Nozaki et al., 2000), and Elimbah Creek (Lawrence and Kamber, 2006). This suggests that REEs may be desorbed from river suspended sediment or supplied by the remineralization of underlying sediment(Nozaki et al., 2000). Moreover, we found that the REE maximum concentrations in the mid-salinity zone were accompanied by high SS values. We performed correlation analysis based on the water samples collected from the MTZ from different tidal periods during the same sampling cruises in winter and summer. The results (unpublished data) show that the REE concentration was significantly positively correlated with pH (P=0.000 2 and 0.001 8), salinity(P=0.000 1 and 0.034), SS (0.001 2 and 0.045), and phosphate (P=0.001 8 and 0.000 1) during summer and winter (Fig.4). Therefore, we conclude that these features were caused by the increased water-particle exchange and desorbed REEs from the suspended sediments.

Fig.4 Correlations of REE concentrations with (a) salinity and SS during LF, (b) salinity and SS during HF (c) pH during LF, (d) pH during HF, (e) phosphate during LF and (f) phosphate during HF
The correlation between salinity and REE concentrations in the whole basin, and in the Minjiang estuary was different. This may have been caused because the REE concentrations were controlled by different factors in different subareas, such as pH,salinity, and phosphate in the estuary and bed rock,and chemical weathering in the middle and lower reaches. Including the data from the middle and lower reaches in the correlation analysis, with low salinity(0-0.1) and stable pH values (approximately 6.0-6.5),may have resulted in a weak relationship between the pH, salinity, and REE concentrations.
5.1.3Seasonal changes of REE abundances
The ∑REE concentration was highest in SHF, HF,NF, and LF, in descending order, and the average REE concentration of SHF was five to six times that of the other seasons. Duvert et al. (2015) reported that the higher REE concentrations during the dry season compared with the wet season were attributed to enhanced evapotranspiration in the dry season,coupled with dilution of rainwater or recharged water in the wet season. Conversely, Zhou et al. (2012)considered the reason for the higher REE concentrations during the wet season to be the inf l ux of micro-particles and colloids, carried by rainstorms,into the surface current. Although we agree with these conclusions, we also suggest that the difference in the seasonal change and the related reasons explained above may have been partly due to the low sampling frequency (dry and wet seasons) that override the short-term variations of REE behavior and their inf l uencing factors (Duvert et al., 2015).
Besides the two reasons above, we also regard chemical weathering, which is strongly controlled by runoff and temperature (White and Blum, 1995; Oliva et al., 2003), to be an important inf l uencing factor of REE abundance, especially in the warm, moist, and high runoff Minjiang river basin. Oliva et al. (2003)reported that the element concentration, which is released from chemical weathering, increased across the temperature gradient, with a steeper slope during high runoff than at low runoff, due to the much increased contact surface and time between water and the parent rock. Tweed et al. (2006) also suggested that the REE concentration reflects mineral dissolution during water-rock interaction. We summarize these interpretations of seasonal change in the REE abundance as follows: (1) strong chemical weathering,and high micro-particle content and colloids during the SHF (high runoff and temperature) and HF seasons(high runoff and moderate temperature) favored water-particle and water-rock interactions, and hence resulted in high REE concentrations. The SHF season had the highest REE concentrations due to the highest temperature (Table 1); (2) although the chemical weathering intensity and water-particle interactions during the HF season were strong, the high rainfall diluted the REE abundance. Furthermore, we infer that the domain factors inf l uencing REE concentrations, such as climate, topography, geologic setting, soil taxonomy, hydrology, and vegetation,were distinctive in different areas. The Specific relationship between temperature and REE behavior requires further research.
5.2 Spatial variations of REE patterns
The observed tendency of progressing from weaker LREE-enrichment and stronger HREE-enrichment from the middle reaches to the estuary during the four seasons may have been caused by the coeffcient of mountain river characteristics, such as strong hydrodynamic forces and steep slopes, and also caused by the increasing anthropogenic impact at the lower reaches and the estuary, and the inf l uence of the seawater end-member.
5.2.1Inf l uence of mountain river characters
As a typical mountain river, the Minjiang River is characterized by strong hydrodynamic forces and steep slopes. Furthermore, the retention time of river water in the middle reaches is much shorter than that in the lower reaches and the estuary, where the gradient is smaller and the flow slows down. We can therefore infer that the REE fractionation of the sampled water in the lower reaches and estuary would be stronger than that in the middle reaches.
5.2.2Anthropogenic impact
The anthropogenic impact on the REE pattern was notable in the study area. Comparing the samples collected from M13 and M14 with M15, which were all from DB and had the same geological, hydrological,and environmental background, we found thatR(L/M)deceased andR(H/M)increased from M13 and M14 to M15 during all four seasons (Fig.6a). This may have been because M15, as the most intensive human activity region in DB, is located close to an urban area and sewage where the colloidal particles and phosphate complexes may cause the enrichment of MREEs (Elderfi eld et al., 1990; Sholkovitz, 1995).Moreover, the affnity with anions, which can form a stable anion complex compound with REEs, such as phosphate and sulfate, increased from La to Lu.Therefore, HREEs were preferentially forming the anion complex compound. LREEs were also preferentially adsorbed onto colloidal particle surfaces (Han and Liu, 2007), and the increased sulfate, phosphate complexes, and colloidal particles would have resulted in the removal of LREEs from the water. In this study, the phosphate and sulfate values were much higher at M15 compared with M13 and M14 during all four seasons (Fig.6b), which supports our interpretation.
5.2.3REE behaviors during estuarine mixing

Fig.5 Spatial variations of R(L/M)and R(H/M)in the Minjiang river basin during the (a) SHF, (b) NF, (c) LF, and (d) HF seasons

Fig.6 Variations ofand(a) and variations of phosphate and sulfate concentrations between different locations(b), including M13, M14 and M15, at Dazhang BrookThe arrows point to M15 in Fig 6a. “phos” and “sulfate” in Fig.6b is abbreviated for phosphate and sulfate, respectively.
The REE patterns varied in the estuary, which was due to estuarine mixing (Lawrence and Kamber,2006). Estuarine mixing led to flocculation of dissolved organic matter in colloidal form (Hoyle et al., 1984;Duncan and Shaw, 2003; Tang and Johannesson,2005) and inorganic REE-oxyhydroxide complexes(Davranche et al., 2004), and further arouse the removal of LREEs. Furthermore, the preferential release of HREEs occurred at the freshwater-seawater interface in the estuary (Sholkovitz, 1995; Osborne et al., 2015). Another interpretation is that the volumes of seawater, which were characterized by remarkable HREEs enrichment (Goldstein et al., 1988; Davranche et al., 2004), increased in the direction of lower reaches to the river mouth and resulted in the REE pattern distribution in the estuary.
5.3 Seasonal variations of REE pattern
5.3.1REE patterns of four seasons
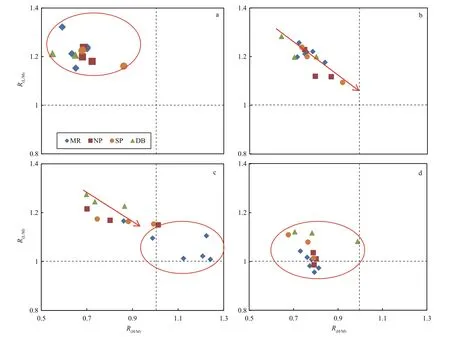
Fig.7 Spatial variations of REE patterns in the middle and lower reaches during the (a) SHF, (b) NF, (c) LF, and (d) HF seasons
The REE patterns varied seasonally (Fig.5a-d).The REE patterns of the NF and LF seasons were similar, which can be attributed to the similarity in temperature and runoff volume. Compared with the NF and LF seasons, the REE patterns in the HF season were more LREE-depleted and HREE-enriched because of the impact of large amounts of rainfall,which is considered a strong source of HREE-enrichment (Li et al., 2001; Hagedorn et al., 2011).Hagedorn et al. (2011) reported the relative low REE concentration and HREE-enrichment in rain compared with river water. It can be speculated that the feature of rain is due to the lower pH values, which generally range from 5.0 to 5.5, compared with river water. As have been reported by the experiments of Verplanck et al. (2004), HREEs are removed from the water compared to LREE when the pH of water increases to the range of 5.1-6.0. According to the above, we suppose that rain, which has lower pH, is likely to be more HREEs-enriched compared with river water,since REEs in rain and river water are mainly come from the water-particle exchange. However, the further researches are needed for the unclear understanding of on REEs concentrations and patterns of rain. In contrast, the REE patterns of the SHF season showed stronger LREE-enrichment and HREE-depletion, similar to the REE pattern of the parent rocks. The REE pattern of the SHF season could be explained by the high temperature and consequent strong chemical weathering. The strong chemical weathering resulted in the high abundance of rare earth elements, and overpowered the contributions of rainfall and human sewage in changing the REE patterns of the sampled water.
5.3.2Effects of hydrodynamic force and biological production
The REE fractionations from the middle to the lower reaches were stronger in the SHF and HF seasons than those in the NF and LF seasons (Fig.7a,d). This was partly due to the shorter retention time of the SHF and HF seasons than that of the other seasons because of the stronger water power. With the shorter retention time, the degree of REE fractionation in the channel during the SHF and HF seasons was lower.Furthermore, the river water was mainly controlled by surface runoff because of the abundant flow,whereas it was less inf l uenced by environment factors and human impact. This may have led to greater similarity of the river water in the SHF and HF seasons compared with the other seasons.
The samples from the estuary in the HF season displayed significantly more HREE-enrichment patterns than the other seasons (Fig.7c). This was probably due to high temperature and strong biological production. Blooming hydrophytes and plankton in the HF season produced large amounts of organic colloid matter and inorganic ions, resulting in the preferential complexation of LREEs, and the removal of LREEs and preservation of HREEs in the river water (Elderfi eld et al., 1990; Han and Liu, 2007).Because of the strongest biological production during the HF season, the degree of HREE-enrichment was the highest among the four seasons. Furthermore,abundant flow in the HF season may have caused the resuspension of surface sediment and the dissolution of HREEs. In the high salinity waters of the estuary,HREEs dissolved preferentially into the water (Han and Liu, 2007), which could have led to more HREE-enriched patterns.
5.3.3Abnormal data caused by rainfalls during sample collection
Samples collected from the middle reaches in the LF season showed low REE concentrations and strong HREE-enrichment that was clearly different from the samples from the other seasons (Table 2,Fig.7b). However, this feature did not occur in the adjacent locations during the LF season. Because the operation of the preconcentration and measurement system is stable, we ruled out the possibility of systemic error and considered the HREE-enrichment data to be outlier values. Considering the number of days of constant rainfall in the middle reaches and the days of continuous sunshine in NP and SP during the sampling period in the LF season, we conclude that the reason for the outlier values was the mixing of surface water samples with low REE concentrations and HREE-enriched rainfall (see Section 5.3.1). This was expected that the contribution of rainfall during low runoff season, such as LF season, is expected to be high.
5.4 Factors controlling Ce, Eu, Gd and Y/Ho anomalies
5.4.1Ce anomalies
The water samples in the study area had slightly negative Ce anomalies or no obvious Ce anomalies(Table 3), indicating the oxidizing condition of the surface waters. Surface waters typically display negative Ce anomalies due to the precipitation of dissolved Ce3+as particulate Ce4+in the oxidizing condition (Leybourne and Johannesson, 2008).Lawrence et al. (2006) suggested that Ce fractionation occurred in the open sea, whereas not in the estuary.The Ce/Ce*values in the HF season were slightly lower than those during the other seasons. Further research is needed to understand the reasons for this.
5.4.2Eu anomalies
The water samples in the study area had slightly negative Eu anomalies or no obvious anomalies, the average Eu/Eu*of SHF, NF, LF and HF were 0.75-0.82, which were close to the Eu/Eu*(0.88) of the Fujian granite (Wu, 1983). That is because the characteristic of Eu/Eu*of surface waters of Minjiang River Basin was most likely derived from the Fujian granite, the parent rock of the Minjiang river basin.Earlier studies have suggested that the Eu anomaly is strongly lithology dependent (Tricca et al., 1999;M?ller et al., 2004). There were positive Eu/Eu*values in the estuary during the HF season, which could be explained by the rising temperature and enhanced water power. Because of the high temperature and water power, the amount of plankton and sediment resuspension increased. Xu and Han(2009) reported that the positive Eu anomaly may have occurred because of the increased dissolution from suspended particles.
5.4.3Gd anomalies
Positive Gd/Gd*values occurred in the densely populated zones of the study area, which was consistent with previous research (Xu and Han, 2009).Bau and Dulski (1996) suggested that the positive Gd anomalies originated from anthropogenic impacts,and always occurred in densely populated areas. It has also been reported that positive Gd anomalies may result from the medical use of Gd-(DTPA)2,which is a Gd-containing organic compound.Furthermore, Gd anomalies are depended not only on population but also on the density of modern medical facilities (Nozaki et al., 2000). These fi ndings agree with our results where the highest Gd/Gd*values always occurred at NP, where most of the large hospitals are located.
5.4.4Y/Ho ratios
The positive Y/Ho values have been attributed topreferential Ho sorption on iron oxyhydroxides or particles (Duvert et al., 2015), and the special geochemical behavior of Y (Lawrence and Kamber,2006). Results showed that Y/Ho ratios changed slightly in the river-endmember, while they increased significantly in the estuary. In contrast, the variations of the Ho/Er ratio were relative small (Fig.2, Fig.8a,b). Moreover, we found an obviously positive correlation (P<0.002) between Y/Ho ratios and salinity in the estuary (Fig.8a, b). This suggests that there was fractionation of Y from Ho, and no fractionation between Ho and Er. Furthermore, the Y/Ho anomalies may have been driven by the changes in Y, but not in Ho. Theoretical results suggest that Y, different from Ho, has no f-electrons, and has a lower surface stability relative to Ho (Bau et al., 1995, 1996). Therefore,when the coagulation and flocculation of organic Fe oxyhydroxides occured in the estuary, Y was preferentially remained in solution; when the riverine particles were destabilized by salt in the estuary, Y was preferentially released from these particles. Both of those reasons increase the Y/Ho ratio (Lawrence and Kamber, 2006). Although the data of Fig.8c are scattered, we considered them the result of combined analysis of all samples of the four seasons.
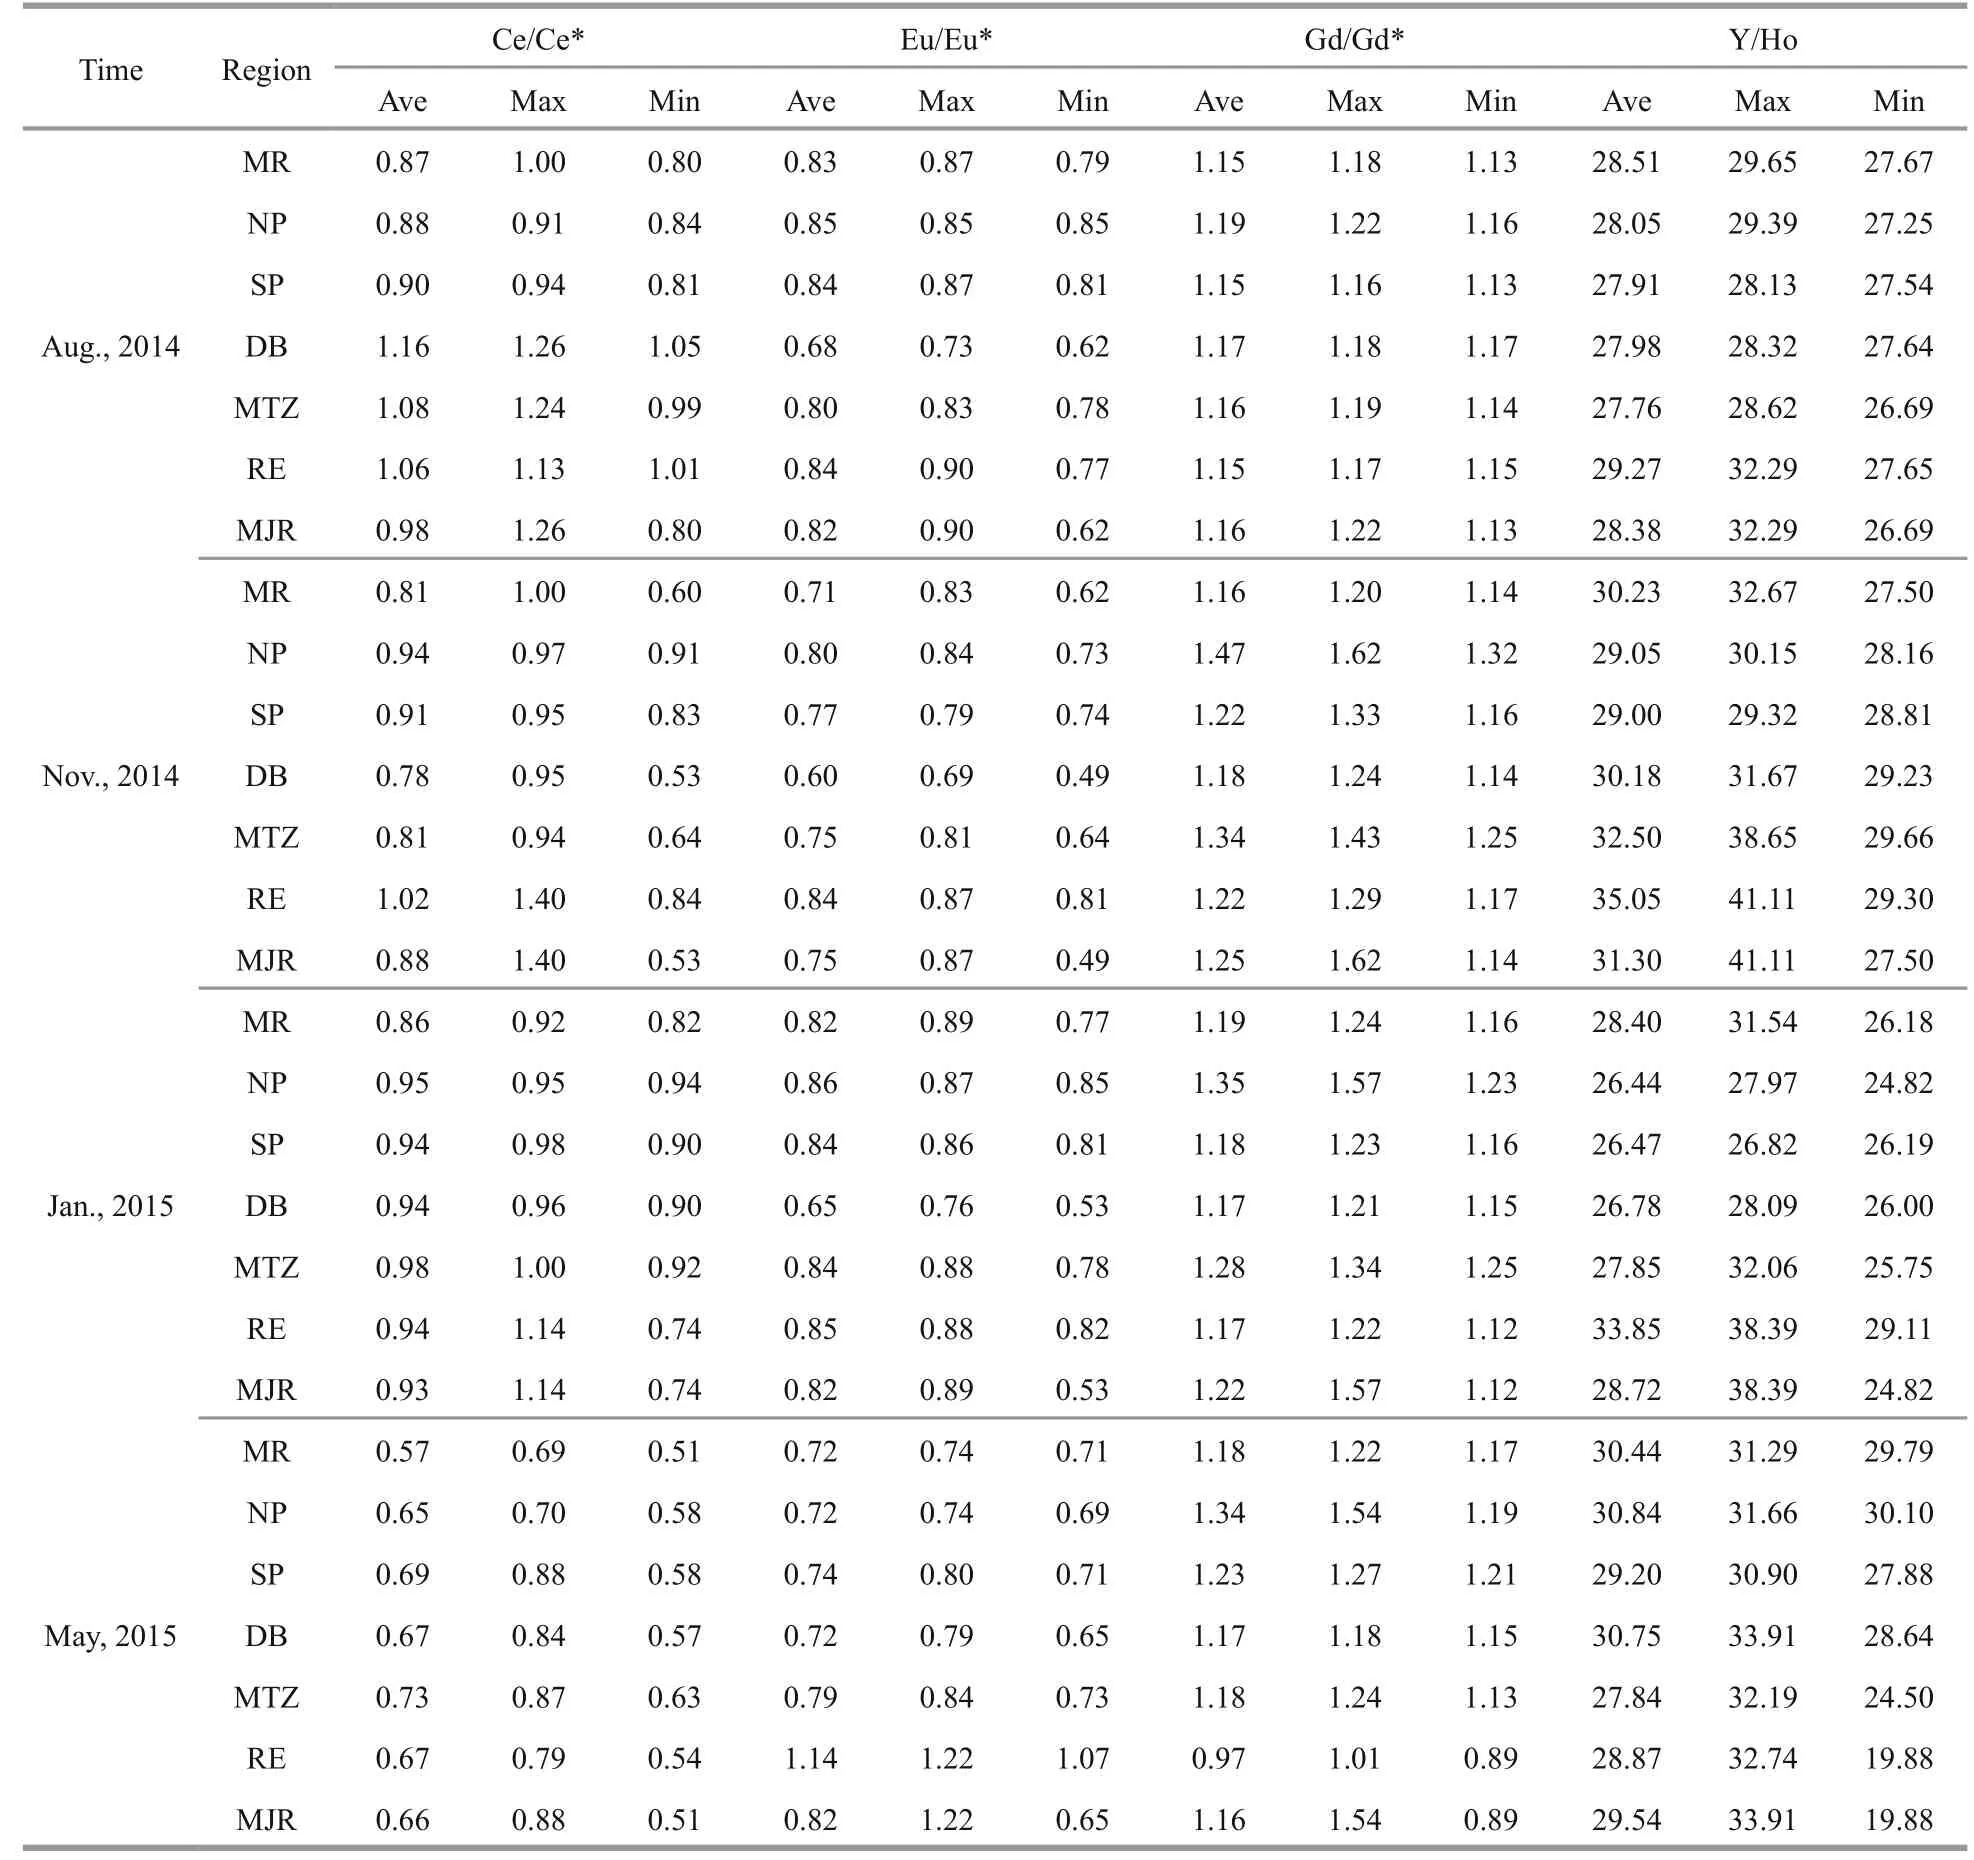
Table 3 Ce, Eu and Gd anomalies and Y/Ho ratios of the Minjiang River basin
6 CONCLUSION
In this study, we present the REEs behaviors inMinjiang River during different seasons. The general conclusions are:
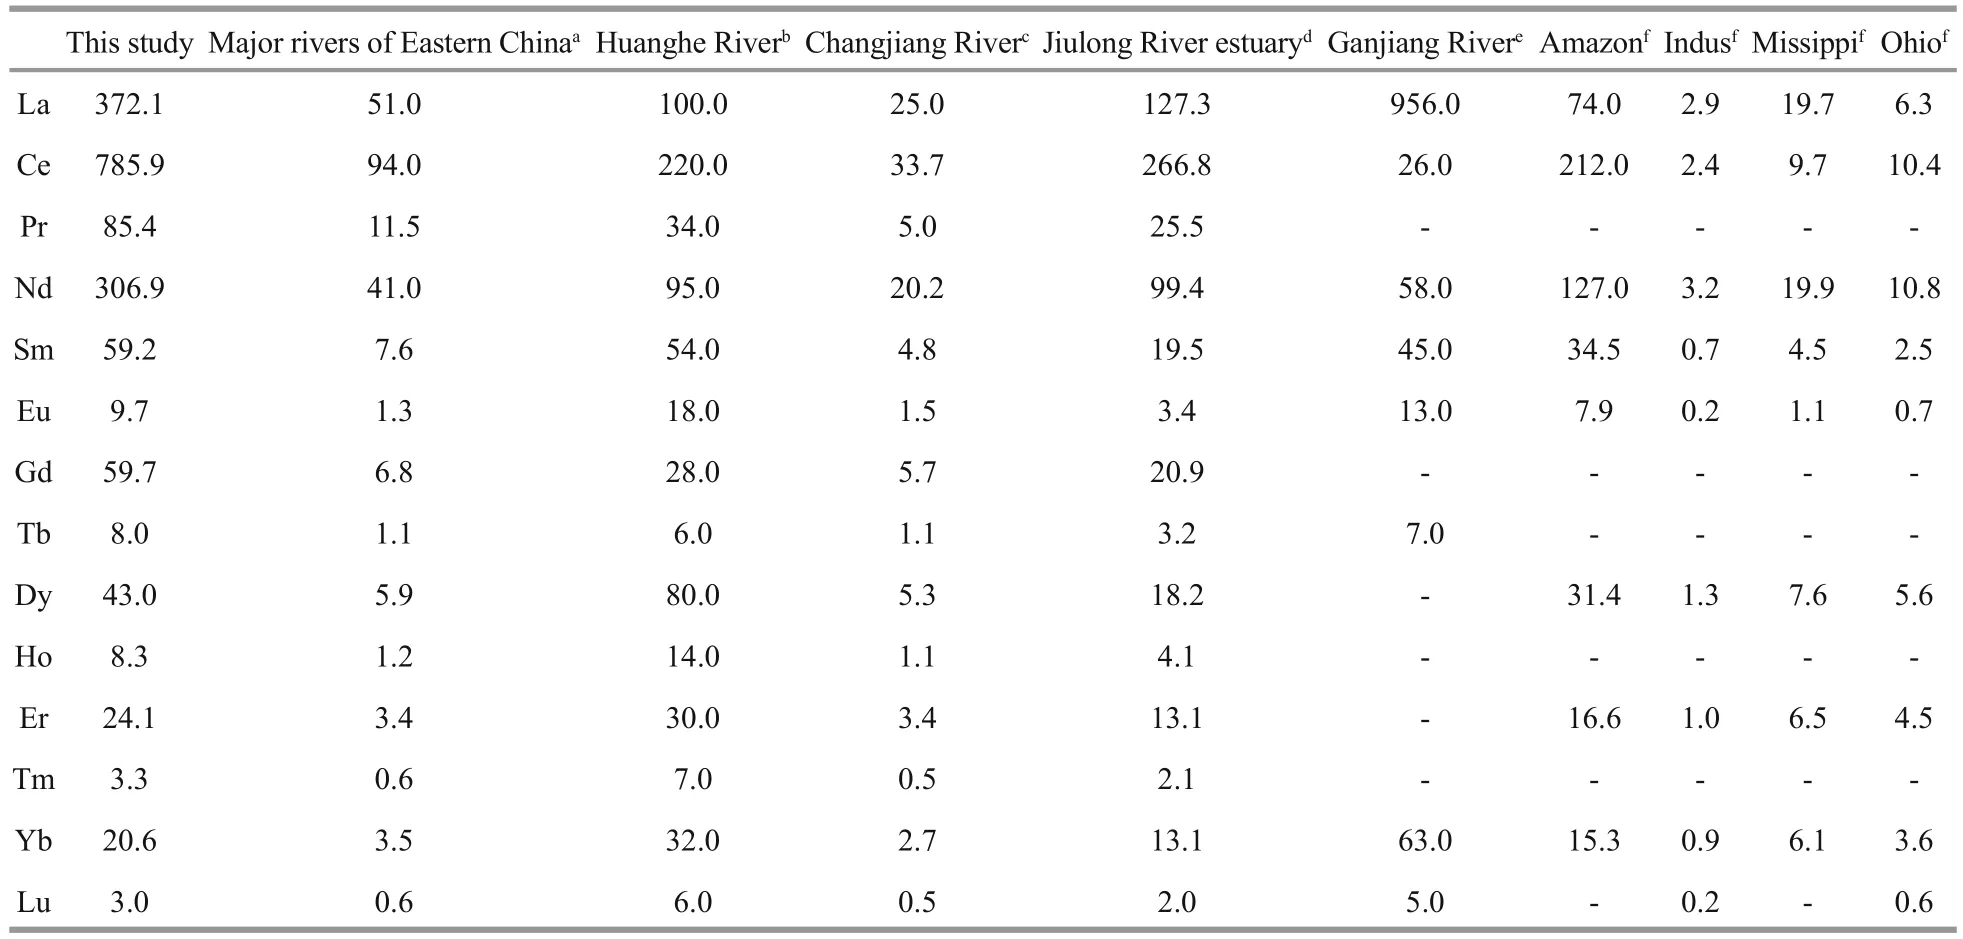
Table 4 Concentrations of dissolved REEs in major global rivers
(1) The dissolved ∑REE of Minjiang River Basin were higher than many of the major global rivers,because Minjiang River originates on the border of the Fujian and Jiangxi provinces, which are the main rare earth deposits of China. Seasonal changes of REE abundances (SHF>HF>NF≈LF) is due to several factors, such as the chemical weathering, dilution of rainfalls, and water-particle interactions. The domain factors inf l uencing REE concentrations are distinctive in different areas.
(2) REE pattern show clear spatial trends of progressing weaker LREEs enrichment and stronger HREEs enrichment downstream from middle reaches to estuary during all four seasons, which is attributed to anthropogenic impacts, estuarine mixture process and the mountain river characters, such as strong hydrodynamic forces and steep slopes.
(3) REE patterns of sample waters in HF season were more LREEs-depleted and HREEs-enriched than those in the other seasons, mainly because of rainfall. REE patterns of SHF season are close to parent rocks, because high REE abundances in SHF season overpower the inf l uence of rainfall and swage on REE pattern. The REE fractionations from the middle to the lower reaches in the SHF and HF seasons were stronger than NF and LF seasons, due to the seasonal variations of hydrodynamic.

Fig.8 (a) Y/Ho and (b) Ho/Er ratios in the Minjiang River basin, and (c) correlation of Y/Ho versus salinity in the maximum turbidity zone and estuary
(4) Almost all of water samples in research area have slightly negative Ce and Eu anomalies, which may derive from the oxidation state of surface waters and the character of parent rock, respectively. Gd anomalies are depended not only on population but also on density of modern medical facilities. The positive Y/Ho may attribute to the special geochemical behaviors of Y and the preferentially Ho sorption on iron oxyhydroxides or particles.
7 ACKNOWLEDGMENT
We thank Engineer WU Wenxi and WANG Danhong in the Key Laboratory ofinspection and Quarantine Technique in Fujian Province, China, for their help in the REE measurements.
猜你喜歡
公民與法治(2022年5期)2022-07-29 00:48:08
閱讀(低年級)(2021年2期)2021-04-08 14:52:01
新疆藝術(shù)(2021年1期)2021-03-08 06:59:42
海峽姐妹(2020年10期)2020-10-28 08:08:20
中國漫畫(2018年3期)2018-12-05 03:50:20
中國漫畫(2018年1期)2018-12-05 03:25:06
Communications in Theoretical Physics(2018年4期)2018-05-02 01:51:33
青年歌聲(2017年9期)2017-03-15 03:33:18
連環(huán)畫報(2015年12期)2016-01-14 07:24:32
花木盆景·盆景賞石(2010年10期)2010-11-04 04:00:58
 Journal of Oceanology and Limnology2018年3期
- Journal of Oceanology and Limnology的其它文章
- Editorial Statement
- The post-larval and juvenile fi sh assemblage in the Sukhothai Floodplain, Thailand*
- Effects of probiotic on microf l oral structure of live feed used in larval breeding of turbotScophthalmus maximus*
- Comparison ofintestinal microbiota and activities of digestive and immune-related enzymes of sea cucumberApostichopus japonicusin two habitats*
- Otolith shape analysis for stock discrimination of twoCollichthysgenus croaker (Pieces: Sciaenidae,) from the northern Chinese coast*
- The impact of spatial autocorrelation on CPUE standardization between two different fi sheries*