
Drivers of coastal bacterioplankton community diversity and structure along a nutrient gradient in the East China Sea*
2018-05-07 06:07:20HEJiaying何佳穎WANGKai王凱XIONGJinbo熊金波GUOAnnan郭安南ZHANGDemin張德民FEIYuejun費岳軍YEXiansen葉仙森
HE Jiaying (何佳穎) WANG Kai (王凱) XIONG Jinbo (熊金波) GUO Annan (郭安南) ZHANG Demin (張德民) FEI Yuejun (費岳軍) YE Xiansen (葉仙森)
1 School of Marine Sciences, Ningbo University, Ningbo 315211, China
2 Collaborative Innovation Center for Zhejiang Marine High-efficiency and Healthy Aquaculture, Ningbo 315200, China
3 Marine Environmental Monitoring Center of Ningbo, State Oceanic Administration (SOA), Ningbo 315211, China
1 INTRODUCTION
Anthropogenic activities, i.e., aquaculture, sewage treatment, and agriculture (Nogales et al., 2007,2011), have intensively accelerated nutrient emissions to coastal ecosystems on a global scale in recent decades (Howarth et al., 2011; Xiong et al., 2014). A global comprehensive report has suggested that most ocean ecosystems are anthropogenically impacted to different degrees, and more than one-third of oceans suff er intermediate to high anthropogenic impacts(Halpern et al., 2008). Some well-studied coastal areas, such as the Baltic Sea (Herlemann et al., 2011),the Neuse River Estuary (Paerl, 2006), and the East China Sea (Xiong et al., 2014; Wang et al., 2015a),have been affected by eutrophication for decades.Evaluating the influence of environmental changes on the biosphere is crucial but very challenging (Hansen et al., 2012). Investigating microorganism assembly processes is an effective way to understand the influence of contemporary environmental disturbances on the coastal biosphere (Herlemann et al., 2011).Microorganisms have short generation times and exhibit large fluctuations in community composition and metabolism and, thus, respond to environmental changes rapidly (Thompson et al., 2011). Variations in bacterial community composition (BCC) can be applied to evaluate the ecological effects of phytoplankton blooms (Buchan et al., 2014; Chen et al., 2016) and pollution disturbances, such as excess nutrients (Hu et al., 2014; Xiong et al., 2014),petroleum (Abed et al., 2015), and heavy metals(Wang et al., 2015b).
Local environmental conditions are vital in shaping the biogeographic pattern of microorganisms(Herlemann et al., 2011; Hu et al., 2014). Interactions between bacterioplankton and phytoplankton/zooplankton are complex (Cole, 1982; Verreydt et al.,2012; Buchan et al., 2014). Briefly, phytoplankton and zooplankton populations can have a serious impact on BCC through complex trophic interactions(Daufresne et al., 2008; Verreydt et al., 2012) and selective grazing (Verreydt et al., 2012). Additionally,abiotic variables are also important for BCC variation,e.g., temperature, nutrient concentrations (Gilbert et al., 2009; El-Swais et al., 2014), salinity, and Chl-a(Langenheder and Ragnarsson, 2007) significantly affect BCC. Furthermore, several studies have reported that microbial biogeography is also dominated by distance effects (Hanson et al., 2012;Xiong et al., 2014). A recent meta-analysis demonstrated that both environmental (contemporary selection) and distance effects (dispersal-related processes) shape microbial biogeography (Hanson et al., 2012). Apparently, the relative contribution of environmental and distance effects on BCC variation depends on the scale of the study area (Martiny et al.,2011). Distance effects have a greater impact on large scales, whereas, environmental effects do so at smaller scales (Herlemann et al., 2011; Hanson et al., 2012).However, the relative contribution of these two major processes at an intermediate scale is still unclear(Xiong et al., 2014).
The coastal waters adjacent to Zhejiang and Shanghai, northern Zhejiang, East China Sea, two of China′s most economically developed provinces,have been polluted by anthropogenic activities, such as fisheries, aquaculture, and industry, for decades (Li et al., 2014; Xiong et al., 2014). Controlling for BCC variation, multiple coast-off shore environmental gradients, have been reported at a regional scale in this coastal area (Wang et al., 2015a). Additionally,coastal anthropogenic activities may, to some extent,contribute to the coast-off shore environmental gradients (Li and Daler, 2004). On smaller scales,when distance effects on microbial biogeography decrease (Herlemann et al., 2011; Hanson et al.,2012), we can focus more on the anthropogenic environmental effects on BCC. We sampled along a coast-off shore gradient at a relatively small spatialscale in the coastal East China Sea and used 16S rRNA gene pyrosequencing to (i) explore bacterioplankton community diversity and structural dynamics, (ii) determine the dominant drivers shaping these bacterial communities, and (iii) screen for indicator bacterial taxa associated with the dominant drivers.
2 MATERIAL AND METHOD
2.1 Sampling sites and environmental variable analysis
Surface water samples were collected on 25thOctober, 2012 from five sites along a transect (from 29°22′43′N, 122°1′30′E to 29°22′58′N,122°34′48′E) perpendicular to the coast (land-sea)(Fig.1). Five replicates were taken from the surface(top 50 cm) within a 50 m×50 m area at each site using custom-made buckets, for a total of 25 samples.To calculate the pairwise geographic distance between samples, the global positioning system (GPS)coordinates for each sampling point were input into the NOAA website (http://www.nhc.noaa.gov/gccalc/shtml). Environmental parameters were measured as described below. Dissolved oxygen (DO) and pH were measured in the sampling buckets using a probe(YSI550A; Instrumart, USA). Microbial biomass was collected on board. The water samples were prefiltered through a sterilized 100 μm pore nylon net,followed by 45 mm diameter and 0.2 μm pore polycarbonate filters (Millipore, USA) until the water would not pass through the filter anymore. The volume of the filtrate was approximately 500–1 000 mL, depending on the SS content in the samples. The filters were stored in sterilized tubes and placed in dry ice during sampling. These were taken to the laboratory within 4 h of the sampling being completed. The remaining environmental parameters were measured at the laboratory. We measured salinity using a handheld salinometer (MASTER-S28M;ATAGO, Japan) and total organic carbon (TOC) using an automated C/N analyzer (multi N/C 3100; Analytik Jena, Germany). Chemical oxygen demand (COD,alkaline potassium permanganate method), total nitrogen (TN), nitrate (zinc-chrome reduction method), ammonium (indophenol method), nitrite(naphthylethylenediamine method), total phosphorus(TP, persulfate oxidation method), phosphate(phosphorus-molybdenum method), and suspended solids (SS, gravimetric method) were measured according to standard methods (General Administration of Quality Supervision, Inspection and Quarantine of the People’s Republic of China(AQSIQ) and Standardization Administration of the People′s Republic of China, 2007). The dissolved inorganic nitrogen (DIN) content was calculated as the sum of nitrate, nitrite, and ammonium.Chlorophyll-a(Chl-a) was measured using the hotethanol extraction method.

Fig.1 Sampling site locations in this study
2.2 DNA extraction, bacterial 16S rRNA gene amplification, and pyrosequencing
Microbial DNA was extracted using a Power Soil?DNA Isolation Kit (MO BIO, USA) following the manufacturer′s instructions. Purified DNA extracts were quantified using a Quant-ItTMPico Green Kit(Invitrogen, USA).
The V4 and V5 regions of the bacterial 16S rRNA gene were amplified using the following primer sets:F515, GTGCCAGCMGCCGCGG, with the Roche 454 ′A′ pyrosequencing adapter and a unique 11 bp barcode sequence; and R907, CCGTCAATTCMTTTRAGTTT, with the Roche 454 ′B′ sequencing adapter at the 5′-end of each primer. Each sample was amplified in triplicate in a 30-μL reaction mixture containing 15 μL Phusion Master Mix (2×), 3 μL forward primer (6 μmol/L final concentration), 10 μL genomic DNA (1 ng/μL), and 2 μL MO BIO PCR water. The amplification conditions were as follows:30 cycles of denaturation at 94°C for 30 s, annealing at 54°C for 30 s, and extension at 72°C for 30 s; with a final extension of 10 min at 72°C. The triplicate PCR products were pooled together and purified with a PCR fragment purification kit (TaKaRa, Japan). The purified PCR products were quantified using a Quant-ItTMPico Green kit (Invitrogen). An equimolar amount of the PCR products for each sample were combined and run on a Roche 454 FLX platform (Roche, USA),producing reads from the forward direction (F515 with barcode). The sequence data were deposited in the NCBI Sequence Read Archive (http://www.ncbi.nlm.nih.gov) and are available under the accession number SRR3914038.
2.3 Data analysis
The sequences were quality controlled and analyzed in QIIME 1.7.0 workflow (Caporaso et al.,2010b). The sequences were grouped into each sample according to the barcodes and were quality controlled using the split_libraries.py script with default settings. The remaining sequences were chimera detected in UCHIME (Edgar et al., 2011)against the Greengenes database (12.10, http://qiime.org/home_static/dataFiles.html). One replicate of site C was discarded because of its shallow sequencing depth. After the removal of chimeras, the bacterial sequences were clustered into operational taxonomic units (OTUs, 97% sequence similarity) using the pick_de_novo_otus.py script with the UCLUST method (Edgar, 2010). The most abundant sequence for a given OTU was selected as the representative sequence and was aligned in PyNAST (Caporaso et al., 2010a). Each phylotype was taxonomically assigned against the Greengenes database (12.10)(DeSantis et al., 2006).ArchaeaandChloroplastsequences not assigned to bacteria, and singletons were removed. A total of 148 198 clean reads, ranging from 3 100 to 9 643 per sample (mean 6 175),remained. These yielded 5 806 OTUs across the samples, 98.7% of which were classified at the phylum level. To normalize the sequencing depth for each sample, we used a randomly selected subset of 3 100 sequences for further analysis. Additionally, we filteredChloroplastsequences from the unrarefied dataset that included both bacterial andChloroplastsequences. TheChloroplastdataset contained 87 103 clean reads, ranging from 437 to 7 751 per sample(mean 3 629); yielding 666 OTUs across the samples.We used a randomly selected subset of 430 sequences to normalize the sequencing depth for downstream analysis.
The Shannon-Wiener index, phylogenetic diversity(PD) whole tree (Kuczynski et al., 2012), and observed species count were calculated in QIIME to estimate bacterial α-diversity. One-way analysis of variance (ANOVA) of alpha-diversity, Spearman′s correlations between three alpha-diversity indices and the environmental variables, and geographic Cartesian coordinates were tested in SPSS v 13.0 (Nie et al.,1970). A multivariate regression tree (MRT; De′ath,2002) was built to determine import factors from the environmental variables and geographic Cartesian coordinates that can legitimately split the diversity;the diversity indices were normalized to the same mean before performing the MRT analysis. The differences in the phylogenetic structure of bacterial communities among samples were visualized by principal coordinate analysis (PCoA) based on the weighted UniFrac distance. Analysis of similarity(ANOSIM) was performed in PRIMER v 5 (Clarke and Gorley, 2001) to test the significance of differences in BCC between sites. Mantel tests were used to identify variables (all environmental variables and geographic distance) that significantly correlated with BCC variation. To verify if spatial distance correlated with community variation, we built a distance-decay model for the phylogenetic similarity of the bacterial communities. Distance-based multivariate analysis for a linear model using forward selection (DistLM)was used to determine which of the environmental parameters and geographic Cartesian coordinates most influenced BCC. To determine which microbe assemblage correlated with Chl-alevels, we calculated Pearson’s correlations between the Chl-aconcentration and the relativeChloroplastandSynechococcaceaesequence abundances in the rarefied dataset (7 480 sequences per sample)including both bacterial andChloroplastsequences.To explore the relative importance of the phytoplankton populations, physicochemical factors, and spatial variables for BCC variation, three sets including theChloroplastsequences (Chloroplastabundances at the order level), the physicochemical factors, and the spatial variables derived from principal coordinates of neighbor matrices (PCNM, Griffith and Peres-Neto, 2006) were analyzed by variation partitioning analysis (VPA) using partially constrained analysis of principal coordinates (pCAP) (Verreydt et al., 2012)based on the weighted UniFrac distance. All of the variables within the three variation partitioning model datasets were screened by forward selection in DISTLM v 5 (Anderson, 2004). Families with average relative abundance>1% in at least one of the five sites and associated with at least one of the three environmental parameters (Chl-a, DIN, and phosphate levels) (Pearson’s correlation,P<0.05) were screened as either phytoplankton bloom-related or nutrient indicative families. The Pearson’s correlations between the three factors and the screened families were visualized in a heat map using the R package‘pheatmap’ based on ‘ward’ distance. Data analysis was carried out in R (http://www.r-project.org) unless otherwise indicated.
3 RESULT
3.1 Coastal surface water environmental characteristics
The TN, nitrate, ammonium, nitrite, TP, phosphate,COD, and TOC concentrations decreased linearly from near- to off shore. According to the specification for the marine monitoring of China-Part 4: seawater analysis (GB 17378.4-2007, General Administration of Quality Supervision, Inspection and Quarantine of the People’s Republic of China (AQSIQ) and Standardization Administration of the People′s Republic of China, 2007), the DIN levels in the coastal sites (A, B, and C) were below the fourth class water standard (DIN, >0.5 mg/L, Table 1), and in off shore sites (D and E), the DIN levels were second class water standards (DIN, 0.2–0.3 mg/L, Table 1).Additionally, the phosphate levels in coastal sites (A and B) were third class water standards (phosphate,0.030–0.045 mg/L), and the phosphate levels in site C and off shore sites (D and E) were second class water standard (phosphate, 0.015–0.030 mg/L). Salinity and pH increased along the transect (Table 1),suggesting that there is freshwater discharge from river runoff , which is an abundant source of nutrients for the coastal environment. Additionally, coastal anthropogenic activities, such as aquaculture, sewage treatment, and agriculture, may also increase the nutrient gradient (Nogales et al., 2007, 2011).However, SS concentrations varied between sites with an obvious trend. The Chl-alevels were higher in off shore sites, where algal blooms were observed,than at the coastal ones (Table 1). Overall, the DO concentrations were higher in coastal than in off shore sites.

Table 1 Biogeochemical parameters of marine surface water samples from the five sites
3.2 Variation in bacterial diversity among sites
One-way ANOVA revealed that the bacterial alphadiversity estimates were greater in the coastal than in the off shore sites, with peak values at site A and the lowest values at site D (Table 2). Most variables were significantly correlated with the three alpha-diversity indices, except for SS, DO, TOC, and longitude; Chlashowed the strongest correlation with alphadiversity (Table S2). This pattern was confirmed with the multivariate regression trees (MRT, Fig.S1),which represented the relationship between bacterial alpha-diversity and the measured variables in a tree with three splits based on Chl-a, COD, and TP (Fig.S1). The entire tree explained 78.2% of the variation in bacterial alpha-diversity. Normalized diversity estimates are mainly split by Chl-a, which explained 51.4% (first split), 19.1% (second split), and 7.8%(third split) of the variation in bacterial diversity.Similarly, nitrate, salinity, ammonium, and pH were also top ranking factors, explaining 45.4%, 45.4%,44.1%, and 37.5% of the bacterial diversity variation,respectively (data not shown).
The dominant phyla (classes in the case ofProteobacteria) wereGammaproteobacteria(28.0%on average),Alphaproteobacteria(20.7%),Actinobacteria(15.3%),Bacteroidetes(8.7%),Betaproteobacteria(6.8%),Cyanobacteria(4.9%),Firmicutes(4.5%), SAR406 (2.1%),Delaproteobacteria(2.0%),Planctomycetes(1.4%),ZB3 (1.1%), andChloroflexi(0.9%), which accounted for 97.6% of the total bacterial sequences (Fig.2). Therelative abundances ofGammaproteobacteria(P=0.013) andPlanctomycetes(P=0.017) were generally higher in coastal than in off shore sites,whereas,Actinobacteria(P<0.001),Bacteroidetes(P=0.001), and SAR406 (P<0.001) exhibited the opposite trend. The remaining dominant phyla and classes did not differ between sites (P>0.05).

Table 2 One-way analysis of variance (ANOVA) of bacterial alpha-diversity (3 100 sequences per sample)across sites
The BCCs were clustered into coastal (sites A, B,and C) and off shore (sites D and E) groups as shown in the PCoA plot (Fig.3). The ANOSIM confirmed this pattern, which indicates that the BCC at sites A,B, and C was similar, and those at sites D and E were distinct from the other sites (Table S3).

Fig.2 Relative abundances of the dominant (>1%) bacterial taxonomic divisions in water samples across sampling sites ( n=5, 4 for site C)
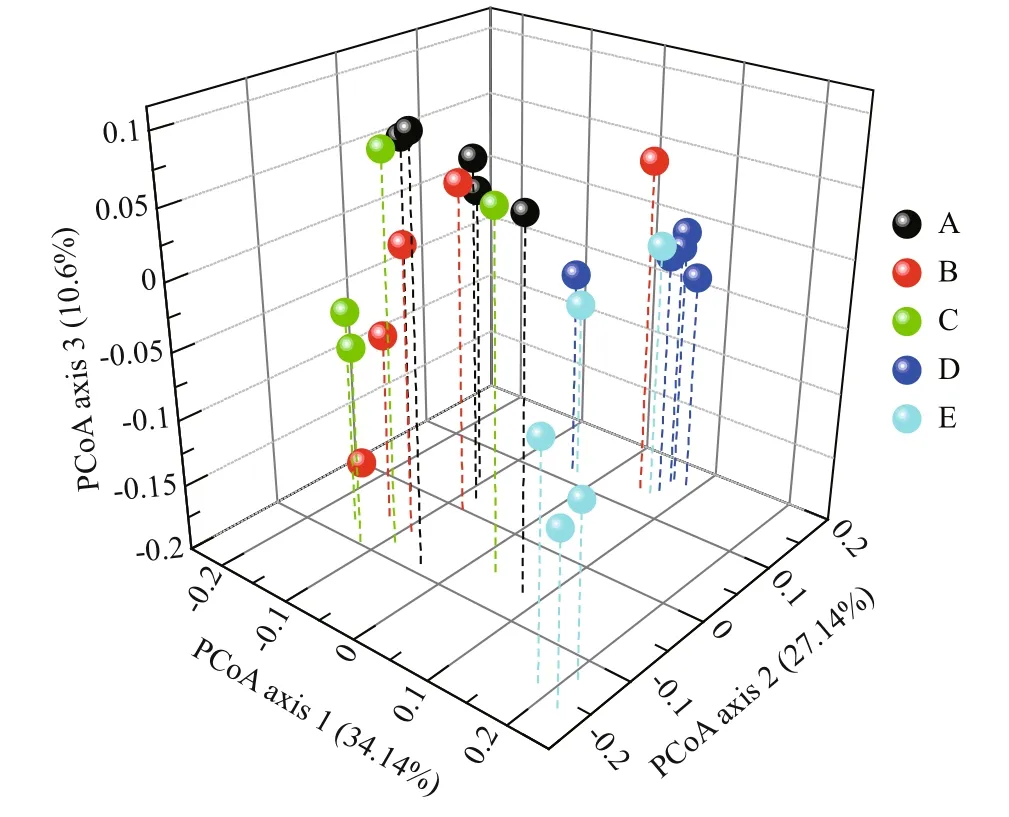
Fig.3 Principal coordinate analysis (PCoA) plot derived from weighted UniFrac distances
3.3 Bacterioplankton community variation partitioning
Except for SS and TOC, the environmental variables we measured were significantly correlated with BCC variation (Mantel test, Table S1).Additionally, geographic distance was also a key factor (Mantel test,R=0.387;P<0.001) in shaping BCC variation. The distance-decay model was negatively correlated (Pearson’s correlation,R=-0.387;P<0.001) between pairwise similarities of BCCs and geographic distance (Fig.4).
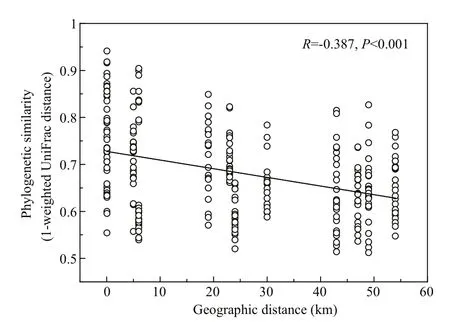
Fig.4 Pearson’s correlations between the phylogenetic similarity of bacterioplankton communities(1-weighted UniFrac distance) and geographic distance
According to the DistLM results, Chl-aexplained most of the variation in BCC (25.2%, Table 3). We usedChloroplastandSynechococcaceaefamily(which accounted for 94.8% of theCyanobacteriasequences) sequences to provide a glimpse of autotrophic eukaryotes (Wang et al., 2015a) and to present autotrophic prokaryotes, respectively.Pearson’s correlation analysis revealed that the Chl-alevels were positively correlated with the relativeChloroplastsequence abundances (R=0.663,P<0.001, Fig.S3) but not withSynechococcaceaesequences (R=-0.101,P=0.638). This suggests that the increase in phytoplankton biomass at the off shore sites was mainly driven by autotrophic eukaryotes rather than phototrophic prokaryotes. Nitrate was the second most important factor explaining BCC variation, both in marginal (22.9%) and conditional(15.1%) tests (Table 3). Nitrate and phosphate were significantly correlated with BCC variation in Mantel tests (Table S1) and were the only remaining factors after forward selection in the variation partitioning model for BCCs (Fig.S4), which represented the physicochemical dataset (Fig.S4).
After forward selection, six variables (unclassifiedChloroplast,Stramenopiles, andChlorophyta,representing theChloroplastsequences, nitrate and phosphate as the physicochemical factors, and one PCNM variable as the spatial variable) remained for the variation partitioning analysis; all of the other variables were discarded because of autocorrelations with the selected variables. Cumulatively, these variables explained 61.2% of the variation in BCC(Fig.S4); the phytoplankton populations explained 12.3% of the variation, which is more than the physicochemical factors (5.6%) or the spatialvariables (8.5%) did (Fig.S4). Moreover, the BCC was not affected by either the pure physicochemical factors (P=0.223) or spatial variables (P=0.662).Additionally, the shared-fraction of the phytoplankton populations and physicochemical factors was relatively high (20.0%) when compared with the other fractions (Fig.S4).
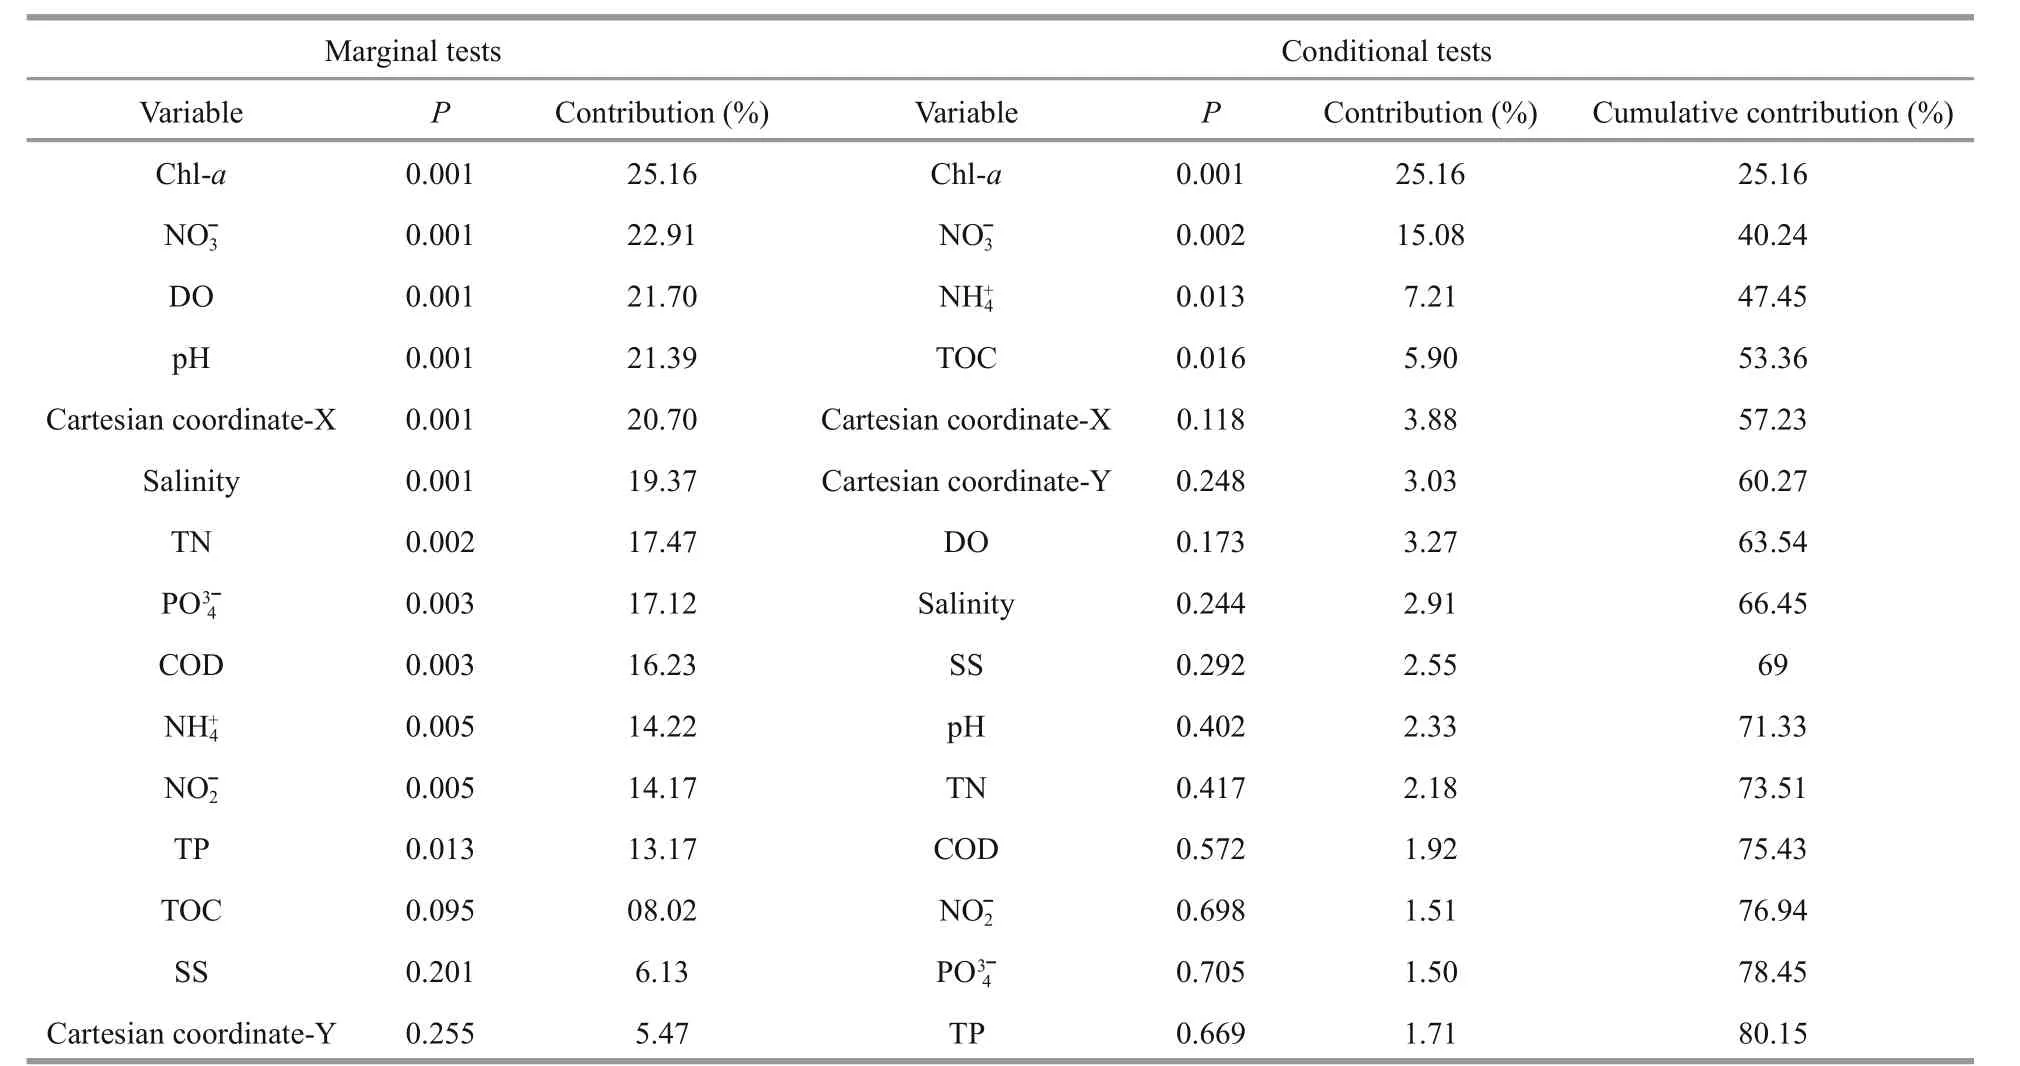
Table 3 Forward selection of bacterioplankton community variability against the environmental parameters and Cartesian coordinates, transformed from latitude and longitude, with 999 permutations
3.4 Phytoplankton bloom and nutrient enrichment indicators
Overall, we found 12 bacterial families with>1%relative abundance in at least one of the five sites,which correlated with Chl-a, DIN, and phosphate.These families were primarily affiliated withGammaproteobacteriaandAlphaproteobacteria.TwoAlphaproteobacteriafamilies,RhodobacteraceaeandSphingomonadaceae, positively and negatively correlated with nutrients and Chl-a, respectively(Fig.5). In contrast, OCS155,Hyphomicrobiaceae,Flavobacteriaceae, A714017,Halomonadaceae, and two unclassifiedGammaproteobacteriafamilies(affiliated with the ordersOceanospirillalesandThiohalorhabdales) exhibited the opposite trend(Fig.5). Furthermore,Pseudoalteromonadaceae,Cryomorphaceae, andSynechococcaceaewere only positively, negatively, and negatively correlated with nutrients, respectively (Fig.5).
4 DISCUSSION
4.1 Bacterial alpha-diversity
Bacterial alpha-diversity increased at nutrient enriched sites and decreased at sites with increased phytoplankton abundances. Chl-ais commonly used as an index of phytoplankton biomass (Buchan et al.,2014). We found that phytoplankton blooms were the most influential in decreasing bacterial diversity(Cole, 1982; Teeling et al., 2012) (Table S2, Fig.S1).Bacterial alpha-diversity (Table S2, Fig.S1) was highest at site A (Table 2), where nutrient enrichment was likely caused by coastal anthropogenic activity.Nutrient enrichment increased diversity, which is consistent with patterns found in other anthropogenically impacted environments (Nogales et al. 2007, 2011). Additionally, phytoplankton populations consume inorganic matter at off shore sites (Behrenfeld et al., 2005, 2006), which could increase the gradient in nutrient availability away from the coast. The mixing of marine and freshwater species can also result in higher bacterial alpha-diversity in coastal sites (Wang et al., 2015a), which was exemplified by the dominance ofBetaproteobacteriaat these sites in this study (Fig.2)(Barberán and Casamayor, 2010; Nogales et al.,2011). Overall, higher bacterial alpha-diversity in coastal vs. off shore sites was mainly a result of the combined effects of phytoplankton populations and nutrient gradients.

Fig.5 Heatmap of Pearson’s correlations of the relationships between Chl- a, DIN, phosphate, and selected indicator families
4.2 Relationships between BCC, phytoplankton populations, and nutrients
The BCC clustered into coastal and off shore groups(Fig.3, Table S3). This may be because phytoplankton abundances increase off shore (Table 1), which can affect the local trophic structure (Cole, 1982; Ducklow et al., 1993). Similarly, coastal anthropogenic activities,which consistently adds nutrients to coastal areas(Table 1; Li and Daler, 2004) also influence the local ecology (Halpern et al., 2008). Additionally, terrigenous fresh water runoff can accelerate mass eff ects,enhancing the similarity of BCC between coastal sites.
According to DistLM (Table 3) and VPA (Fig.S4),phytoplankton populations had the most influence in shaping BCC along this near- to off shore gradient.This is consistent with a common viewpoint that interactions between bacteria and phytoplankton during phytoplankton bloom events are complex(Cole, 1982; Verreydt et al., 2012; Buchan et al.,2014). Both bacterial and phytoplankton metabolism may modify the environment to either inhibit or stimulate each other’s growth. Aquatic bacteria (e.g.,Azotobacter) contribute nutrients to stimulate phytoplankton growth (Cole, 1982; Buchan et al.,2014); others, however (e.g., nitrobacteria), compete with phytoplankton for essential inorganic nutrients(Behrenfeld et al., 2005, 2006). Conversely, through photosynthesis, phytoplankton assimilate CO2and inorganic matter, such as nitrogen and phosphorus(Behrenfeld et al., 2005, 2006), and supply organic matter, approximately one-half of the carbon fixed by marine autotrophs is directly processed by bacteria(Cole, 1982; Ducklow et al., 1993). The close relationships between phytoplankton populations and physicochemical factors (Table S4) may partly explain their large, joint effect in shaping BCC(20.0%, Fig.S4). In the VPA model, only nitrate and phosphate were selected in the physiochemical dataset(Fig.S4), suggesting that coastal nutrient enrichment is instrumental in shaping BCC along this near- to off shore gradient; the Mantel tests (Table S1) and the DistLM (Table 3) results also support this finding.
Furthermore, phytoplankton populations aside,physicochemical variables alone explained 25.7% of the BCC variation, much more than the variation explained by the spatial factor (16.0%, Fig.S4).Distance effects contribute less than environmental conditions at this intermediate scale, which had been found in a recent meta-analysis (Hanson et al., 2012).However, this is contrary to previous findings in sediment from the same study area (environmental variables: 5.5%, spatial variables: 8.2%; Xiong et al.,2014). Nonetheless, because water flow accelerates the dispersal rate (Adams et al., 2014), planktonic bacteria can disperse faster than sediment bacteria.Additionally, environmental variables were significantly auto-correlated with the spatial factor;14.0% of BCC variation was explained by their combined effect (Fig.5), which agrees with previous studies (Hanson et al., 2012; Wang et al., 2015a).
Although salinity is the main factor that determines the global biogeography of microorganisms (Lozupone and Knight, 2007), in this study, salinity was excluded in the forward selection because of its high co-linearity with nitrate (Pearson’s correlation,R=0.967,P<0.001;Table S4) and phosphate (Pearson′s correlation,R=0.933,P<0.001). Unexplained variation in the BCCs may be related to the following unmeasured variables: (i) other abiotic parameters such as water temperature, (ii) biotic factors, such as zooplankton community, which influence BCC through selective grazing (Verreydt et al., 2012), and (iii) the stochastic process, leading to varied β-diversity of the microbial community (Chase, 2007).
4.3 Bacterial assemblage indicators associated with phytoplankton blooms and nutrient enrichment
Because of the high linear relationships within Chl-a, DIN, and phosphate, most screened families also correlated with all of these variables (Fig.5). The geographic distributions of these families follow complex processes.
Several screened families are considered phytoplankton increase-related prokaryotes. Some members ofHyphomicrobiaceaeare phototrophic,using bacteriochlorophyll A/B for photosynthesis(Bryant and Frigaard, 2006), which explains their positive correlation with Chl-a(Fig.5). The OCSS155 family accounted for most of theActinobacteriain this study (86.1%, average relative abundances, data not shown), which is consistent with findings in other areas (Cram et al., 2015, Chow et al., 2013). Typically,OCS155 dominated in off shore sites, where phytoplankton abundances increased (Fig.S2), which may be explained by the correlation between this family and diatoms (Nelson et al., 2014). TheBacteroidetesfamily,Flavobacteriaceae, was positively correlated with Chl-a, which may be related to their role in decomposing organic matter derived from algal blooms (Teeling et al., 2012). We found thatCryomorphaceae, which participates in phytoplankton biomass decomposition (Alonso et al.,2007), correlated with nutrients but not Chl-a(Fig.5).Additionally, the relative abundances ofCryomorphaceaepeaked at site E, where the Chl-alevels were the second highest (Table 1). This may be because the phytoplankton bloom at site E was decaying when samples were taken, and this family was taking part in decomposition. In future studies,the relationships between bacteria and organic matter during phytoplankton bloom and decay should be taken into account.
The geographic distribution ofRhodobacteraceaeis influenced by nutrient levels. The metabolic and ecological diversity of this family is high (Pujalte et al., 2014), some members participate in denitrification(Baumann et al., 1996; Foesel et al., 2011) and others in nitrification (Baumann et al., 1996). It is possible that members of this family are positively correlated with DIN levels are participating in N metabolic processes at coastal sites (Huang et al., 2015).
The distributions of these 12 families may be shaped by variables other than Chl-a, DIN, and phosphate.Synechococcus, a genus of theSynechococcaceaefamily, is more abundant in nutrient-rich than in oligotrophic areas (Partensky et al., 1999), contrary to our findings (Fig.5). Moreover,the inorganic phosphate up-take capability ofSynechococcusis less than that of small eukaryotes(Lomas et al., 2014), thus the negative correlation(Pearson’s correlation:R=-0.686,P=0.029) betweenSynechococcaceaeandChloroplastmay be the result of phosphate up-take competition. Members of theHalomonadaceaeare either halotolerant or halophilic(León et al., 2014), explaining their higher relative abundances in off shore sites (Fig.S2), where salinity was lower than in coastal sites (Table 1). A few members of theSphingomonadaceaecause human infections (Glaeser and K?mpfer, 2014), and theFlavobacteriaceaefamily contain important fish and human pathogens (McBride, 2014). Both of these families, which dominated in the coastal sites (Table 1), were positively correlated with nutrients (Fig.5)possibly because of coastal anthropogenic activity,such as fisheries. Previous reports on the ecological functions of theThiohalorhabdalesorder and family A714017 (SAR406),Pseudoalteromondaceae, do not explain why their relative abundances were higher at different sites in this area (Fig.S2).
The geographic distributions of these 12 indicator families are mainly determined by phytoplankton blooms and increased nutrients, as well as other nonremovable factors.
5 CONCLUSION
The variation in BCC in surface water along a near- to off shore gradient in the coastal East China Sea is jointly affected by phytoplankton populations,local physicochemical factors, and distance, wherein phytoplankton populations contribute the most to BCC variation, but the effects of nutrient enrichment cannot be ignored. We identified a series of bacterial families, whose relative abundances were related to Chl-a/nutrient levels, making them potential indicator species for phytoplankton blooms and nutrient enrichment in this marine ecosystem. This study provides insights into the impact of environmental disturbances on the coastal ecosystem from a microbial perspective, which could be a promising method to evaluate the quality of the marine environment. However, the patterns of BCCs and indicator families observed must be verified before they can be applied in environmental management.Moreover, this study is only based on one transect at one time point. Future studies should include a meshtype sampling regime on a seasonal scale to provide extensive insight into the successional patterns of bacterioplankton in this coastal area.
Abed R M M, Al-Kindi S, Al-Kharusi S. 2015. Diversity of bacterial communities along a petroleum contamination gradient in desert soils.Microb.Ecol.,69(1): 95-105.
Adams H E, Crump B C, Kling G W. 2014. Metacommunity dynamics of bacteria in an arctic lake: the impact of species sorting and mass effects on bacterial production and biogeography.Front.Microbiol.,5: 82.
Alonso C, Warnecke F, Amann R, Pernthaler J. 2007. High local and global diversity of Flavobacteria in marine plankton.Environ.Mivrobiol.,9(5): 1 253-1 266.
Anderson M J. 2004. DISTLM v.5: A FORTRAN Computer Program to Calculate A Distance-Based Multivariate Analysis for A Linear Model. Department of Statistics,University of Auckland, New Zealand. 10p.
Barberán A, Casamayor E O. 2010. Global phylogenetic community structure and β-diversity patterns in surface bacterioplankton metacommunities.Aquat.Microb.Ecol.,59(1): 1-10.
Baumann B, Snozzi M, Zehnder A J B, Van Meer J R D. 1996.Dynamics of denitrification activity ofParacoccus denitrificansin continuous culture during aerobicanaerobic changes.J.Bacteriol.,178(15): 4 367-4 374.
Behrenfeld M J, Boss E, Siegel D A, Shea D M. 2005. Carbonbased ocean productivity and phytoplankton physiology from space.GlobalBiogeochem.Cycles,19(1): GB1006.
Behrenfeld M J, O′Malley R T, Siegel D A, McClain C R,Sarmiento J L, Feldman G C, Milligan A J, Falkowski P G, Letelier R M, Boss E S. 2006. Climate-driven trends in contemporary ocean productivity.Nature,444(7120):752-755.
Bryant D A, Frigaard N U. 2006. Prokaryotic photosynthesis and phototrophy illuminated.TrendsMicribiol.,14(11):488-496.
Buchan A, LeCleir G R, Gulvik C A, González J M. 2014.Master recyclers: features and functions of bacteria associated with phytoplankton blooms.Nat.Rev.Microbiol.,12(10): 686-698.
Caporaso J G, Bittinger K, Bushman F D, DeSantis T Z,Andersen G L, Knight R. 2010a. PyNAST: a flexible tool for aligning sequences to a template alignment.Bioinformatics,26(2): 266-267.
Caporaso J G, Kuczynski J, Stombaugh J, Bittinger K,Bushman F D, Costello E K, Fierer N, Pe?a A G, Goodrich J K, Gordon J I, Huttley G A, Kelley S T, Knights D,Koenig J E, Ley R E, Lozupone C A, McDonald D,Muegge B D, Pirrung M, Reeder J, Sevinsky J R,Turnbaugh P J, Walters W A, Widmann J, Yatsunenko T,Zaneveld J, Knight R. 2010b. QIIME allows analysis of high-throughput community sequencing data.Nat.Methods,7(5): 335-336.
Chase J M. 2007. Drought mediates the importance of stochastic community assembly.Proc.Natl.Acad.Sci.USA.,104(44): 17 430-17 434.
Chen H P, Zhang H J, Xiong J B, Zhu J L, Zhu X Y, Zhou X Y,Zhang D M. 2016. Successional trajectories of bacterioplankton community over the complete cycle of a sudden phytoplankton bloom in the Xiangshan Bay, East China Sea.Environ.Pollut.,219: 750-759, https://doi.org/10.1016/j.envpol.2016.07.035.
Chow C E T, Sachdeva R, Cram J A, Steele J A, Needham D M, Patel A, Parada A E, Fuhrman J A. 2013. Temporal variability and coherence of euphotic zone bacterial communities over a decade in the Southern California Bight.ISMEJ.,7(12): 2 259-2 273.
Clarke K R, Gorley R N. Primer V5 (Plymouth routines in multivariate ecological research): user manual/tutorial[M]. Primer-E, 2001.
Cole J J. 1982. Interactions between bacteria and algae in aquatic ecosystems.Annu.Rev.Ecol.Evol.Syst.,13: 291-314.
Cram J A, Chow C E T, Sachdeva R, Needham D M, Parada A E, Steele J A, Fuhrman J A. 2015. Seasonal and interannual variability of the marine bacterioplankton community throughout the water column over ten years.ISMEJ.,9(3): 563-580.
Daufresne T, Lacroix G, Benhaim D, Loreau M. 2008.Coexistence of algae and bacteria: a test of the carbon hypothesis.Aquat.Microb.Ecol.,53(3): 323-332.
De’ath G. 2002. Multivariate regression trees: a new technique for modeling species-environment relationships.Ecology,83(4): 1 105-1 117.
DeSantis T Z, Hugenholtz P, Larsen N, Rojas M, Brodie E L,Keller K, Huber T, Dalevi D, Hu P, Andersen G L. 2006.Greengenes, a chimera-checked 16S rRNA gene database and workbench compatible with ARB.Aquat.Environ.Microbiol.,72(7): 5 069-5 072.
Ducklow H W, Kirchman D L, Quinby H L, Carlson C A, Dam H G. 1993. Stocks and dynamics of bacterioplankton carbon during the spring bloom in the eastern north Atlantic Ocean.DeepSeaRes.,PartIITop.Studies Oceanogr.,40(1-2): 245-263.
Edgar R C, Haas B J, Clemente J C, Quince C, Knight R. 2011.UCHIME improves sensitivity and speed of chimera detection.Bioinformatics,27(16): 2 194-2 200.
Edgar R C. 2010. Search and clustering orders of magnitude faster than BLAST.Bioinformatics,26(19): 2 460-2 461.
El-Swais H, Dunn K A, Bielawski J P, Li W K W, Walsh D A.2014. Seasonal assemblages and short-lived blooms in coastal north-west Atlantic Ocean bacterioplankton.Environ.Microbiol.,17(10): 3 642-3 661.
Foesel B U, Drake H L, Schramm A. 2011.Defluviimonas denitrificansgen. nov., sp. nov., andPararhodobacter aggregansgen. nov., sp. nov., non-phototrophicRhodobacteraceaefrom the biofilter of a marine aquaculture.Syst.Appl.Microbiol.,34(7): 498-502.
General Administration of Quality Supervision, Inspection and Quarantine of the People’s Republic of China (AQSIQ),Standardization Administration of the People’s Republic of China. GB 17378.4-2007 The specification for marine monitoring of China-Part 4: seawater analysis. China Standard Press, Beijing. 2007. (in Chinese)
Gilbert J A, Field D, Swift P, Newbold L, Oliver A, Smyth T,Somerfield P J, Huse S, Joint I. 2009. The seasonal structure of microbial communities in the Western English Channel.Environ.Microbiol.,11(12): 3 132-3 139.
Glaeser S P, K?mpfer P. 2014. The familysphingomonadaceae.In: Rosenberg E, DeLong E F, Lory S, Stackebrandt E,Thompson F eds. The Prokaryotes. Springer, Berlin Heidelberg. p.641-707.
Griffith D A, Peres-Neto P R. 2006. Spatial modeling in ecology: the flexibility of eigenfunction spatial analyses.Ecology,87(10): 2 603-2 613.
Halpern B S, Walbridge S, Selkoe K A, Kappel C V, Micheli F,D′Agrosa C, Bruno J F, Casey K S, Ebert C, Fox H E,Fujita R, Heinemann D, Lenihan H S, Madin E M P, Perry M T, Selig E R, Spalding M, Steneck R, Watson R. 2008.A global map of human impact on marine ecosystems.Science,319(5865): 948-952.
Hansen M M, Olivieri I, Waller D M, Nielsen E E. 2012.Monitoring adaptive genetic responses to environmental change.Mol.Ecol.,21(6): 1 311-1 312.
Hanson C A, Fuhrman J A, Horner-Devine M C, Martiny J B H. 2012. Beyond biogeographic patterns: processes shaping the microbial landscape.Nat.Rev.Microbiol.,10(7): 497-506.
Herlemann D P R, Labrenz M, Jürgens K, Bertilsson S, Waniek J J, Andersson A F. 2011. Transitions in bacterial communities along the 2000 km salinity gradient of the Baltic Sea.ISMEJ.,5(10): 1 571-1 579.
Howarth R, Chan F, Conley D J, Garnier J, Doney S C, Marino R, Billen G. 2011. Coupled biogeochemical cycles:eutrophication and hypoxia in temperate estuaries and coastal marine ecosystems.Front.Ecol.Environ.,9(1):18-26.
Hu A Y, Yang X Y, Chen N W, Hou L Y, Ma Y, Yu C P. 2014.Response of bacterial communities to environmental changes in a mesoscale subtropical watershed, Southeast China.Sci.Total.Environ.,472: 746-756.
Huang W, Li B, Zhang C, Zhang Z Y, Lei Z F, Lu B, Zhou B B.2015. effect of algae growth on aerobic granulation and nutrients removal from synthetic wastewater by using sequencing batch reactors.Bioresour.Technol.,175: 187-192.
Kuczynski J, Stombaugh J, Walters W A, González A,Caporaso J G, Knight R. 2012. Using QIIME to analyze 16S rRNA gene sequences from microbial communities.Curr.Protoc.Bioinformatics., https://doi.org/10.1002/0471250953.bi1007s36.
Langenheder S, Ragnarsson H. 2007. The role of environmental and spatial factors for the composition of aquatic bacterial communities.Ecology,88(9): 2 154-2 161.
León M J, Sánchez-Porro C, de la Haba R R, Llamas I, Ventosa A. 2014.Larseniasalinagen. nov., sp. nov., a new member of the family Halomonadaceae based on multilocus sequence analysis.Syst.Appl.Microbiol.,37(7): 480-487.
Li D J, Daler D. 2004. Ocean pollution from land-based sources: East China Sea, China.AMBIO.,33(1): 107-113.
Li H M, Tang H J, Shi X Y, Zhang C S, Wang X L. 2014.Increased nutrient loads from the Changjiang (Yangtze)River have led to increased harmful algal blooms.Harmful Algae,39: 92-101.
Lomas M W, Bonachela J A, Levin S A, Martiny A C. 2014.Impact of ocean phytoplankton diversity on phosphate uptake.Proc.Natl.Acad.Sci.U.S.A.,111(49): 17 540-17 545.
Lozupone C A, Knight R. 2007. Global patterns in bacterial diversity.Proc.Natl.Acad.Sci.U.S.A.,104(27): 11 436-11 440.
Martiny J B, Eisen J A, Penn K, Allison S D, Horner-Devine M C. 2011. Drivers of bacterial β-diversity depend on spatial scale.Proc.Natl.Acad.Sci.U.S.A.,108(19): 7 850-7 854.
McBride M J. 2014. The familyflavobacteriaceae.In:Rosenberg E, DeLong E F, Lory S, Stackebrandt E,Thompson F eds. The Prokaryotes. Springer, Berlin Heidelberg. p.643-676.
Nelson C E, Carison C A, Ewart C S, Halewood E R. 2014.Community differentiation and population enrichment of Sargasso Sea bacterioplankton in the euphotic zone of a mesoscale mode-water eddy.Environ.Microbiol.,16(3):871-887.
Nie N H, Bent D H, Hull C H. SPSS: 1970. Statistical Package for the Social Sciences [M]. New York: McGraw-Hill.
Nogales B, Aguiló-Ferretjans M M, Martín-Cardona C,Lalucat J, Bosch R. 2007. Bacterial diversity, composition and dynamics in and around recreational coastal areas.Environ.Microbiol.,9(8): 1 913-1 929.
Nogales B, Lanfranconi M P, Pi?a-Villalonga J M, Bosch R.2011. Anthropogenic perturbations in marine microbial communities.FEMSMicrobiol.Rev.,35(2): 275-298.
Paerl H W. 2006. Assessing and managing nutrient-enhanced eutrophication in estuarine and coastal waters: interactive effects of human and climatic perturbations.Ecol.Eng.,26(1): 40-54.
Partensky F, Blanchot J, Vaulot D. 1999. differential distribution and ecology ofProchlorococcusandSynechococcusin oceanic waters: a review.Bulletinde l'InstitutOcéanographique,19(19): 457-476.
Pujalte M J, Lucena T, Ruvir M A, Arahal D R, Macián M.2014. The familyRhodobacteraceae.In: Rosenberg E,DeLong E F, Lory S, Stackebrandt E, Thompson F eds.The Prokaryotes. Springer-Verlag, Berlin Heidelberg.p.439-512.
Teeling H, Fuchs B M, Becher D, Klockow C, Gardebrecht A,Bennke C M, Kassabgy M, Huang S, Mann A J, Waldmann J, Weber M, Klindworth A, Otto A, Lange J, Bernhardt J,Reinsch C, Hecker M, Peplies J, Bockelmann F D, Callies U, Gerdts G, Wichels A, Wiltshire K H, Glockner F O,Schweder T, Amann R. 2012. Substrate-controlled succession of marine bacterioplankton populations induced by a phytoplankton bloom.Science,336(6081):608-611.
Thompson F L, Bruce T, Gonzalez A, Cardoso A, Clementino M, Costagliola M, Hozbor C, Otero E, Piccini C, Peressutti S, Schmieder R, Edwards R, Smith M, Takiyama L R,Vieira R, Paranhos R, Artigas L F. 2011. Coastal bacterioplankton community diversity along a latitudinal gradient in Latin America by means of V6 tag pyrosequencing.Arch.Microbiol.,193(2): 105-114.
Verreydt D, De Meester L, Decaestecker E, Villena M J, Van Der Gucht K, Vannormelingen P, Vyverman W, Declerck S A. 2012. Dispersal-mediated trophic interactions can generate apparent patterns of dispersal limitation in aquatic metacommunities.Ecol.Lett.,15(3): 218-226.
Wang K, Ye X S, Chen H P, Zhao Q F, Hu C J, He J Y, Qian Y X, Xiong J B, Zhu J L, Zhang D M. 2015a. Bacterial biogeography in the coastal waters of northern Zhejiang,East China Sea is highly controlled by spatially structured environmental gradients.Environ.Microbiol.,17(10):3 898-3 913.
Wang K, Zhang D M, Xiong J B, Chen X X, Zheng J L, Hu C J, Yang Y N, Zhu J L. 2015b. Response of bacterioplankton communities to cadmium exposure in coastal water microcosms with high temporal variability.Appl.Environ Microb.,81(1): 231-240.
Xiong J B, Ye X S, Wang K, Chen H P, Hu C J, Zhu J L, Zhang D M. 2014. Biogeography of the sediment bacterial community responds to a nitrogen pollution gradient in the East China Sea.Appl.Environ.Microbiol.,80(6):1 919-1 925.
猜你喜歡
湖北理工學(xué)院學(xué)報(人文社會科學(xué)版)(2020年4期)2020-07-24 02:52:58
智富時代(2019年2期)2019-04-18 07:44:42
祝您健康·文摘版(2018年3期)2018-04-06 18:11:18
初中生(2017年31期)2017-12-26 01:20:32
意林繪閱讀(2016年2期)2016-03-09 07:23:24
金色年華(2016年2期)2016-02-28 01:38:42
高中生學(xué)習(xí)·高三版(2015年2期)2016-01-04 22:41:24
情感讀本·道德篇(2015年12期)2016-01-04 15:09:15
Chinese Journal of Chemical Engineering(2012年1期)2012-03-22 10:09:50
中國邊疆民族研究(2011年0期)2011-02-16 08:03:40
 Journal of Oceanology and Limnology2018年2期
- Journal of Oceanology and Limnology的其它文章
- Editorial Statement
- Hydroacoustic estimates of fish biomass and spatial distributions in shallow lakes*
- A comparison between benthic gillnet and bottom trawl for assessing fish assemblages in a shallow eutrophic lake near the Changjiang River estuary*
- Morphological beak differences of loliginid squid, Uroteuthis chinensis and Uroteuthis edulis, in the northern South China Sea*
- Muelleria pseudogibbula, a new species from a newly recorded genus (Bacillariophyceae) in China*
- Planaxidae (Mollusca, Gastropoda) from the South China Sea*