
Effects of freeze-thaw cycles on soil N2O concentration and flux in the permafrost regions of the Qinghai-Tibetan Plateau
2018-04-08 00:52:12ShengYunChenQianZhaoWenJieLiuZhaoZhangShuoLiHongLinLiZhongNanNieLingXiZhouShiChangKang
ShengYun Chen , Qian Zhao , WenJie Liu , Zhao Zhang , Shuo Li , HongLin Li ,ZhongNan Nie , LingXi Zhou , ShiChang Kang
1. Qilian Shan Station of Glaciology and Ecologic Environment, State Key Laboratory of Cryospheric Science, Northwest Institute of Eco-Environment and Resources, Chinese Academy of Sciences, Lanzhou, Gansu 730000, China
2. Institute of Tropical Agriculture and Forestry, Hainan University, Haikou, Hainan 570228, China
3. State Key Laboratory of Plateau Ecology and Agriculture, Qinghai University, Xining, Qinghai 810016, China
4. Department of Economic Development, Jobs, Transport and Resources, Private Bag 105, Hamilton VIC 3300, Australia
5. Chinese Academy of Meteorological Sciences, Beijing 100081, China
6. University of Chinese Academy of Sciences, Beijing 100049, China
1 Introduction
Nitrous oxide (N2O) is a major greenhouse gas and contributes about 6% of global warming (Wrageet al., 2004). N2O also participates in the photochemical reaction that results in the destruction of stratospheric ozone (Crutzen, 1981). Soils are a major source of N2O, contributing about 70% of the total N2O emitted from terrestrial ecosystems to the atmosphere (Flückigeret al., 1999). The emission of N2O from soils in temperate zones during freezing-thawing periods accounts for 50%-70% of the total annual flux (Kurganova and Lopes De Gerenyu, 2010). N2O from soils is produced predominantly by the microbi-al processes of nitrification and denitrification (Neillet al., 2005); and its N2O concentration and flux are affected by a complex interplay of soil water-heat conditions and biochemical properties, such as soil moisture and temperature (Flückigeret al., 1999; Kurganova and Lopes De Gerenyu, 2010), soil organic matter content, pH, and enzyme activities (Shi and Huang, 1999; Duet al., 2008), as well as the composition and activity of microbial communities (Schimel and Clein, 1996). Consequently, detailed knowledge of soil's physical, chemical, and biological properties is crucial to understanding soil N2O concentration and flux.
Soil freeze-thaw cycles (FTCs) involve the repeated freezing and thawing caused by diurnal or seasonal thermal changes; they occur in the topsoil down to a depth that depends on many factors (Wu and Shen, 2010; Chenet al., 2016). FTCs are common in temperate, high-latitude, and high-altitude regions(Groganet al., 2004). Permafrost, a major component of the cryosphere, is a product of persistent cold conditions' affecting certain land-atmosphere situations;it is widespread in middle to high latitudes and highaltitude regions. Permafrost covers approximately 1.20×10⁶km2(Nanet al., 2005), about 70.6% of the Qinghai-Tibetan Plateau (QTP) (Zhouet al., 2000).This area of mountain permafrost is the largest in the Northern Hemisphere. It has been predicted that the global average surface temperature will increase by at least 1.5 °C by the end of the 21st century (IPCC,2013), and the permafrost is one of the areas in the world most sensitive to climate change (Guglielimin and Dramis, 1999). Climate warming will cause permafrost degradation, which will be manifested mainly in an increase in ground temperature and the active layer thickness (ALT). Indeed, this effect has been observed during recent decades (Osterkamp, 2005;Smithet al., 2005; Overduin and Kane, 2006; Isaksenet al., 2007; Christiansenet al., 2010; Romanovskyet al., 2010; Wu and Zhang, 2010; Wuet al., 2012). The most direct consequence of climate change is a shift in FTCs in the soil's active layer, which has unique water-heat conditions because the permafrost prevents water penetration. Thus, there are freeze-thaw processes in the soil's active layer that are more complex than those observed in seasonally frozen soil(Zhaoet al., 2000).
Numerous studies have shown that FTCs have striking and profound influences on soil N2O concentration and flux by changing soil water-heat conditions and consequently affecting soil biochemical properties (Lipsonet al., 1999; Lipson and Schmidt,2004; Sjursenet al., 2005; Koponenet al., 2006;Holstet al., 2008; Yanget al., 2010). However, most of these studies were conducted during the growing season (Wanget al., 2003; Du, 2006; Duet al., 2008)or simulated by models (Liet al., 1992, 2004; Ri and Prentice, 2008). There is a lack ofin situand systematic research on how soil N2O emissions are affected by FTCs via the changes of soil water-heat conditions and biochemical properties influenced during FTC processes. The objectives of this study were (1)to identify the FTC characteristics in the active layer in permafrost regions; (2) to elucidate the effects of freeze-thaw variation on soil biochemical properties;and (3) to discover if soil moisture and temperature are the major factors affecting soil N2O concentration and flux in FTCs. It is expected that the results will help us understand the internal coupling processes associated with alpine ecosystem degradation because of FTCs' change as climate warming progresses.
2 Materials and methods
2.1 Site description
The monitoring site was situated in the alpine-ecosystem observation area of the small Suli watershed (ID:SLP2; 98°16'14"E, 38°21'17"N, altitude 4,014 m)(Figure 1). It is one of eight monitoring sites in the region. SLP2 is a continental arid-desert-climate region;average annual temperature and precipitation are about -6.0 °C and 476 mm, respectively (Liuet al.,2012a). The vegetation was typical alpine meadow,with approximately 40% vegetation coverage. Dominant plant species wereKobresia pygmaeaandK. humilis. The soil type of SLP2 was cold calcic, with serious erosion caused by FTCs. The permafrost type was high-altitude mountain permafrost, with an ALT of about 2.3 m (Chenet al., 2012). The completely frozen period during the year can last 6 months, from November to the following April.
2.2 Field observation and sample collection
Seven samplings were conducted from July 31,2011 to July 30, 2012; July 31, September 30, October 6, and December 26 in 2011; and April 26, April 30, and July 30 in 2012. Three quadrats (50cm×50cm)were randomly chosen, aboveground biomass harvested, and soil samples collected to analyze biochemical properties (quantities and activities of soil microorganisms, pH, oxidation-reduction potential and nutrient contents). Five soil cores 0-20 cm deep (4.8 cm in diameter) were collected from each quadrat in an X-shaped pattern and dissected into 0-10 cm and 10-20 cm. The five subsamples for each depth were first mixed, then divided into two parts: one was placed in a cold box and subsequently used for analyzing soilenzyme activities and microbial activities; and the other was air-dried under natural conditions and then used to test the other variables. Additional soil samples (depth of 0-20 cm) used for the quantification of the soil-microorganism population were collected using a soil auger (diameter 3.8 cm), with six subsamples collected from each quadrat; they were stored in a refrigerator and transported under frozen conditions.
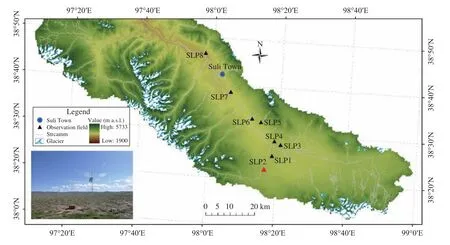
Figure 1 Spatial distribution of observation sites in the alpine ecosystem, including the SLP2 site in the upper reaches of the Shule River Basin
Soil-gas samples were collected at depths of 0 to 20 cm (five layers from 0-10 cm and 10-20 cm; three replicates in every layer) using a self-developed soilgas collector (Patent No.: ZL201120073304.2); the soil-gas collector has a direct connection between the surface valve and soil layers of 0-10 cm and 10-20 cm. Samples of gases' emission fluxes were acquired by the static-chamber method (Liuet al., 2012a). The gas samples were obtained at around 15:00 p.m. during each data-collection period.
Air temperature (AT) measured at 1.5 m above the ground, as well as soil temperature (ST), moisture(SM), and soil salinity (SS) at depths of 0 cm, 10 cm,and 20 cm were automatically collected using a CR1000 control system (CSI, USA) connected to an HMP155A Temperature/RH probe (Vaisala, Finland)and a Hydra probe II soil sensor (Stevens, USA) that took records every ten minutes from July 31, 2011 to July 30, 2012.
2.3 Laboratory analysis
Division of freeze-thaw days. We divide soil freeze-thaw days on the basis of diurnal FTCs(DFTCs): when the minimum temperature >0 °C in a day in a layer, we count this day as a thawed day for this layer; when the maximum temperature ≤0 °C in a day in a layer, we count this day as a frozen day for this layer; and when the minimum temperature ≤0 °C,and the maximum temperature >0 °C in a day in a layer, we count this day as a freeze-thaw day for this layer (Liuet al., 2012a).
Soil chemical properties. Soil oxidation-reduction potential (ORP) was determined using a 501-ORP composite electrode (PHBJ-260 type) with a soil:water ratio of 1:5. Soil organic carbon (SOC) and total nitrogen (TN) were measured using Walkley-Black and micro-Kjeldahl procedures, respectively (ISSCAS, 1978; Nelson and Sommers, 1982). Soil polyphenol oxidase (SPO) and soil catalase (SC) were determined by iodimetry and potassium permanganate titration, respectively (Guanet al., 1986). Soil urease(SU), soil sucrase (SSu), and soil alkaline phosphatase (SAP) were measured by colorimetry with phenol and sodium hypochlorite, by 3,5-dinitrosali-cylic acid colorimetry, and by disodium phenyl phosphate, respectively (Guanet al., 1986).
Quantities and activities of soil microorganisms(QASM). Soil microbial biomass carbon (SMBC) was determined by chloroform fumigation and extraction,first with 0.5 mol/L potassium sulfate and then by dichromate oxidation using the Walkley-Black procedure. Soil microbial biomass nitrogen (SMBN) was determined by chloroform fumigation and extraction,first with 0.5 mol/L potassium sulfate and then by colorimetry (Dinget al., 2005). Soil culturable bacteria(SCB), culturable fungi (SCF), and culturable actinomycetes (SCA) were quantified using the spread-plate method (Chenet al., 2012).
Gas samples were analyzed by a 7890A gas-chromatography system (Agilent Technologies, USA).The chromatographic column was a HayeSep Q(80-100 mesh), and its working temperature was 60 °C. Soil N2O concentration was detected using an electron-capture detector (ECD) at 350 °C. The standard-mixture gases of CO2(402.97 mL/m3), CH4(2.2457 mL/m3), and N2O (0.3240 mL/m3) were used for several rounds of calibration (supplied by the Chinese Academy of Meteorological Sciences, China Meteorological Administration). The gases were stored in an aluminum alloy cylinder (Scott Marrin,USA) and their concentration values could be traced using the international primary standards of the Central Calibration Laboratory, the World Meteorological Organization (Chenet al., 2016). N2O flux was calculated based on the slope of the linear increase in N2O concentration over the sampling period (Liuet al.,2012b).
Statistical analysis. Significant differences in soil environmental parameters within each period of FTCs were determined using paired-samplet-tests. To determine factors that influenced soil N2O, multiple-regression analysis examining the relationships between N2O and other soil environmental parameters for diurnal FTCs (DFTCs) and seasonal FTCs (SFTCs) was conducted using stepwise linear regression. A path analysis was undertaken to examine the mechanisms affecting soil N2O concentration and flux in the top 20 cm of the soil during DFTCs and SFTCs. All statistical analyses were performed using SAS statistical software (version 9.2).
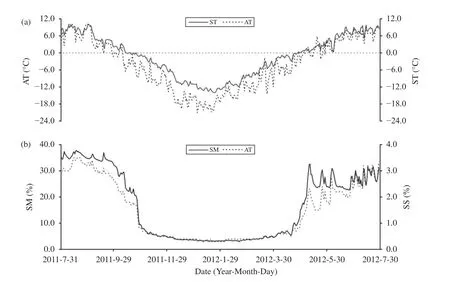
Figure 2 Daily variations in air temperature (AT), soil temperature (ST), soil moisture (SM),and soil salinity (SS) at a depth of 0-20 cm
3 Results
3.1 The characteristics of freeze-thaw cycles and environment factors
During the annual cycle (July 31, 2011, to July 30,2012), the average AT was -3.7 °C and the average 0-20 cm ST was -1.2 °C. The hottest month AT (August 2011) was 7.2 °C and the coldest month AT was(January 2012) -18.1 °C. Analyzing from DFTCs,both 0-10 cm and 10-20 cm of soil has more frozen days (177 days and 200 days, respectively) than thawed days (145 days and 151 days, respectively)(Table 1 and Supporting Table S1). Variations in the average diurnal ST in the top 20 cm of the soil were consistent with the average diurnal AT, but there was a time lag. The variations of the average diurnal SM and SS in the top 20 cm of soil also showed a similar trend in AT and ST (Figure 2).
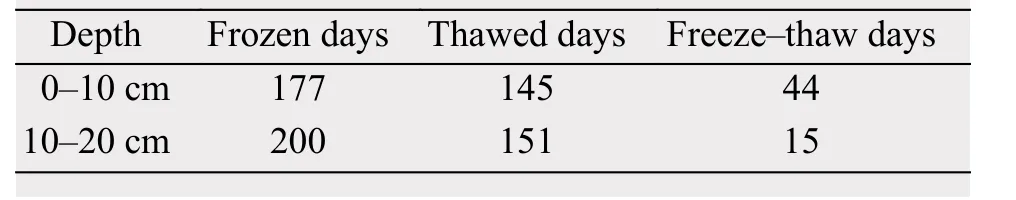
Table 1 Frozen days, thawed days, and freeze-thaw days in the soil layers at 0-10 cm and 10-20 cm
Based on the division method of Liuet al.(2012a), FTCs for the soil depth of 0-20 cm in the study could be divided into four periods: (1) complete thawing, from July 31 to October 12, 2011, and from May 17 to July 30, 2012; (2) complete freezing,from October 19, 2011, to April 21, 2012; (3) progressive freezing, from October 13 to 18, 2011; and(4) progressive thawing from April 22 to May 16,2012 (Figure 3). However, there were differences in FTC's stages for different soil layers. For example, the diurnal freezing-thawing phase for the 0-10 cm layer was from September 30 to October 6, 2011, whereas during the same period the 10-20 cm soil layer was in a completely thawed phase. Moreover, from April 26 to 30, 2012, the 0-10 cm soil layer was in the freezing-thawing phase, while the 10-20 cm soil layer was in the completely frozen period (Figure 3, Supporting Table S1). One DFTC occurred during the former phase, four during the latter phase (Figure 4).Moreover, the variations of ST, SM, and SS in the 0-10 cm soil layer were consistent with AT; but they have smaller fluctuations and some time lag (Figure 4).
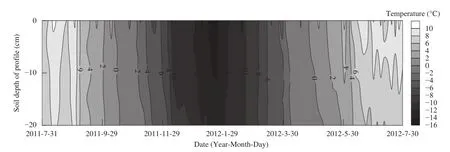
Figure 3 ST variation at 0-20 cm depths

Figure 4 Readings every 10 minutes for AT and for ST, SM, and SS at 0-10 cm depths
Variations in ST, SM, and SS were significantly different during the freeze-thaw periods (Tables 2 and 3). After one DFTC during the progressive freezing period (DFTC1), ST, SM, and SS at 0-10 cm significantly decreased; and SSu increased. ST, SPO, and SAP for 0-10 cm significantly decreased, but SM significantly increased after four DFTCs during the progressive thawing period (DFTC2). ST, SM, and SS at both depths significantly decreased, while SU and SC in the upper layer and SSu in the lower layer clearly increased during the phases of the seasonal freeze-thaw cycle (SFTC) from the completely thawed period to the completely frozen period(SFTC3). ST, SM, and SS in both layers and SAP in the upper layer significantly increased, while soil redox potential (Eh) in the upper layer significantly decreased during the SFTC phases from the completely frozen period to the completely thawed period(SFTC4). Meanwhile, ST, SS, SOC, TN, SPO, and SC in the lower layer, as well as SAP in the upper layer, clearly increased, while SM in both layers significantly decreased during the SFTC phases of the annual cycle from the completely thawed period, to the completely frozen period, and back to the completely thawed period (SFTC5).
SCB and SCA in the 0-10 cm layer significantly increased after DFTC1 and DFTC2, respectively; but SMBN in the same layer decreased after DFTC2.Furthermore, SMBC in the upper layer significantly decreased, while SMBN in the upper layer and SCA in the lower layer clearly increased after SFTC5(Table 3).
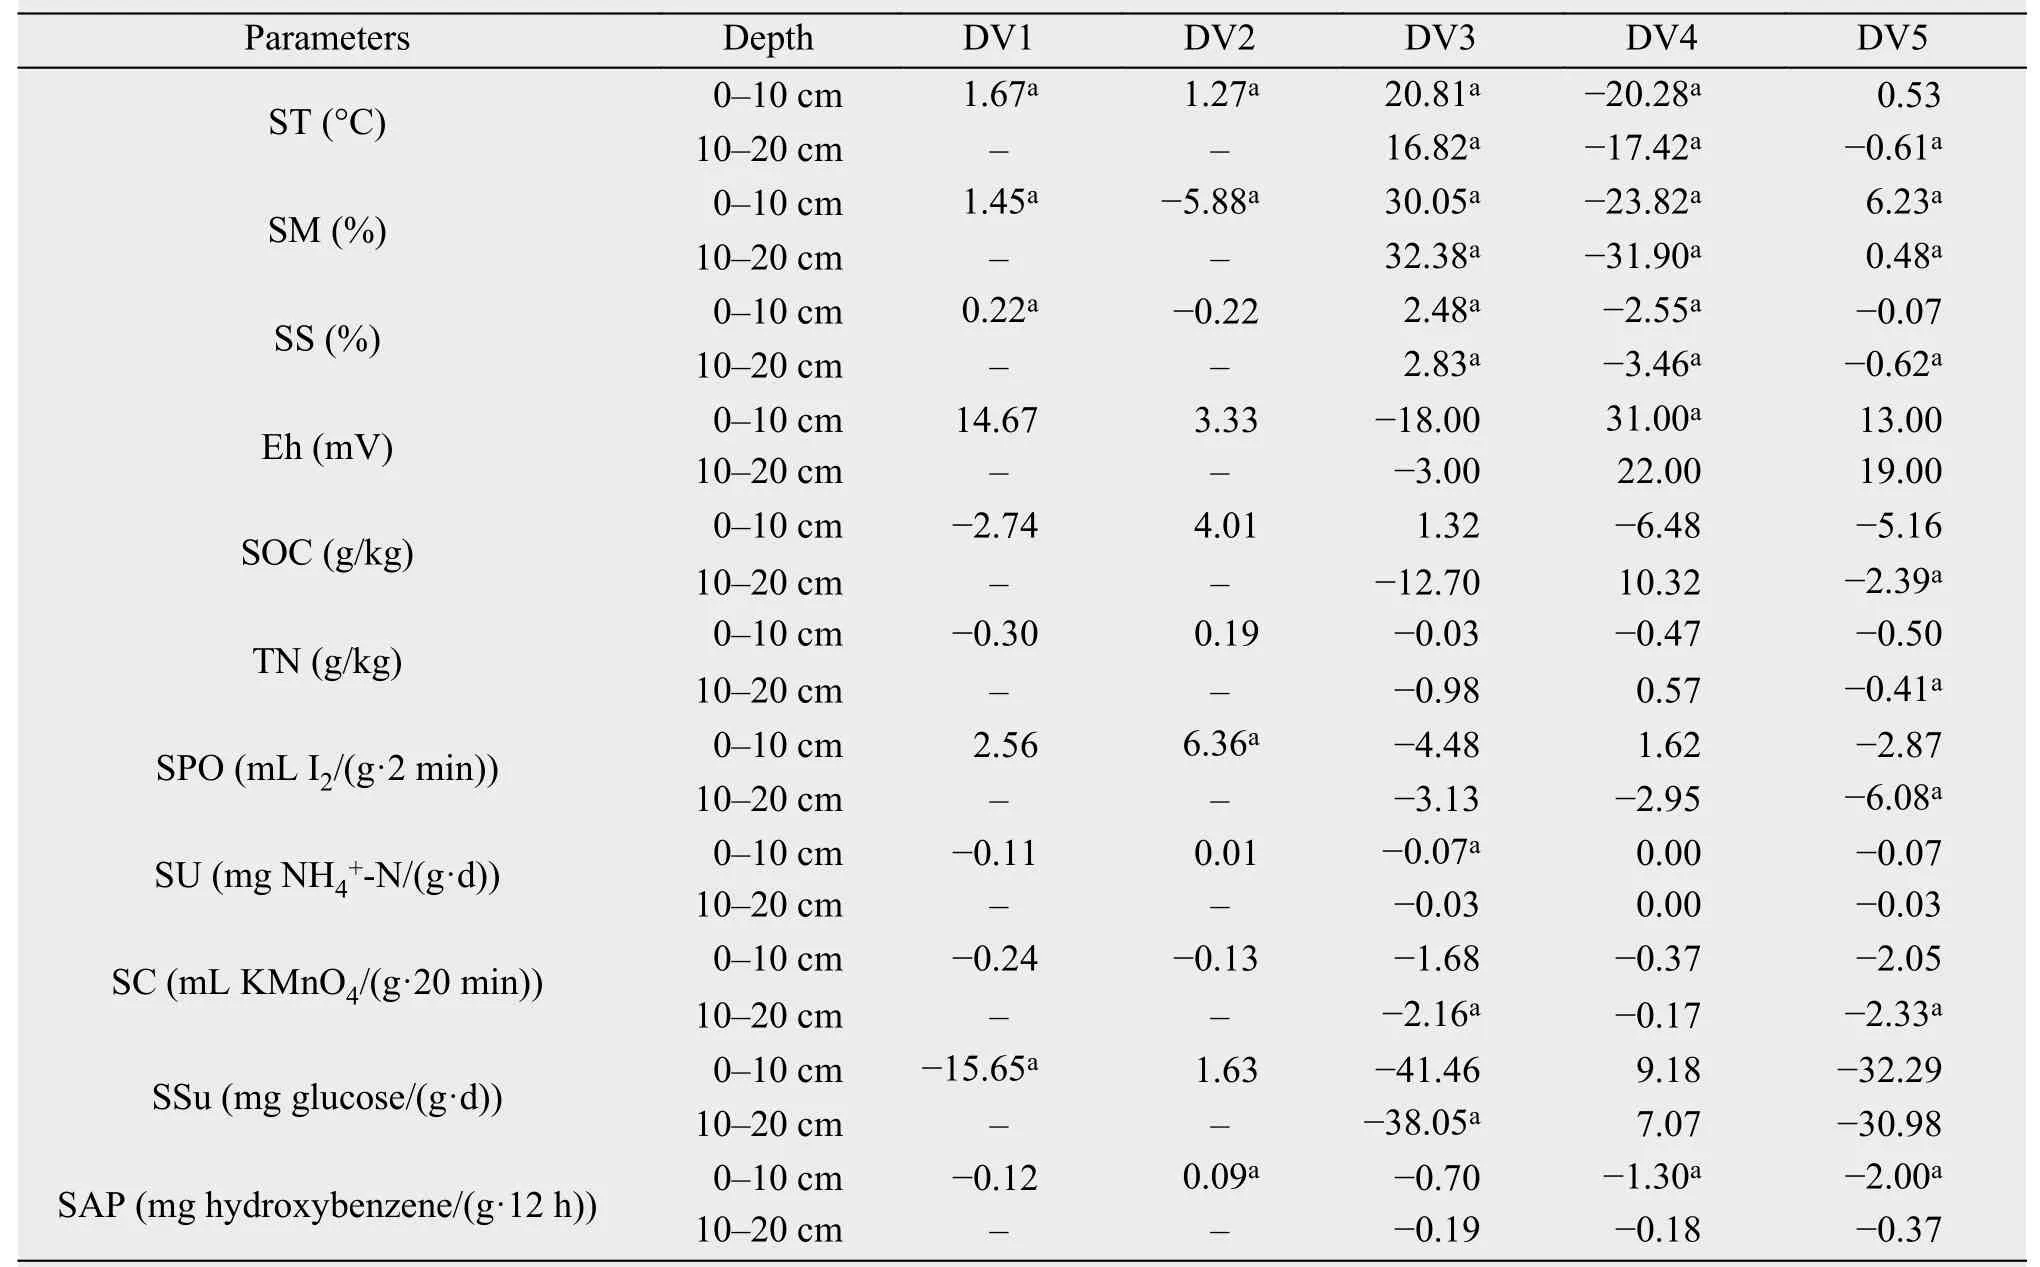
Table 2 Soil water-heat conditions and chemical-property variations during different freeze-thaw periods
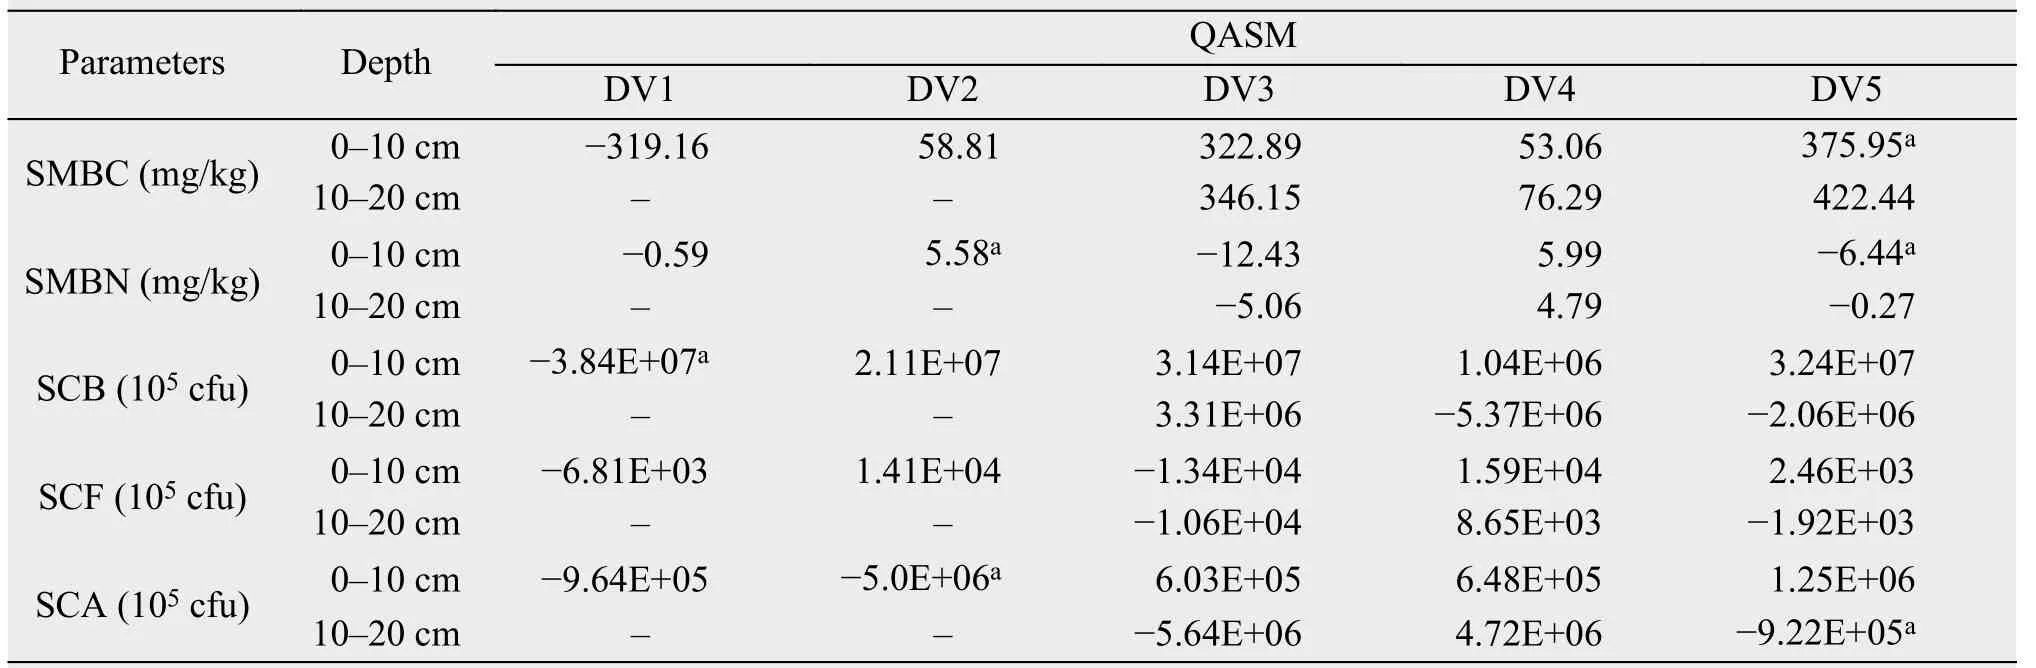
Table 3 Variations in quantities and activities of soil microorganisms (QASM) during different freeze-thaw periods
3.2 Variations of soil N2O concentration and flux due to freeze-thaw cycles
The changes in soil N2O concentration of 0-10 cm was not significant after DFTC1 and DFTC2, while in both layers N2O concentration was obviously increased during the SFTC4 and SFTC5 phases (Table 4).The results of multiple-regression analysis showed that soil N2O concentration at 0-20 cm was significantly affected by ST, SM, SS, SPO, SAP, and SCA(P<0.01), explaining 97% of the variation in N2O concentration. ST and SS had significant direct effects on soil N2O flux, with direct-path coefficients of 1.01 and -0.97, respectively. Moreover, soil N2O flux was obviously affected by soil N2O concentration(P<0.05), which explained 18% of the variation in soil N2O flux (Table 5).
3.3 Relationships between soil N2O concentration and flux and the physiochemical and biological properties of soil
The results of path analysis (Figure 5) revealed that ST, SM, SS, SPO, SAP, and SCA had significantly direct effects on soil N2O concentration(P<0.05), while SS, SPO, SAP, and SCA had indirect effects by affecting the ST and SM. The order of magnitude of the direct effects was SM>SS>ST>SPO>SAP>SCA, and that of indirect effects via ST was SM>SS>SCA>SAP>SPO, and via SM was SS>ST>SCA>SAP>SPO.
There were significantly positive correlations between soil N2O concentration and SPO (r= 0.54,P<0.01) (Table 6). Except for SS, the absolute values of direct-path coefficients for all these factors were larger than the sum of their indirect-path coefficients;and both direct and the sum of indirect-path coefficients of ST, SM, and SS were larger than those of SPO, SAP, and SCA.
4 Discussion
4.1 Responses of soil properties to freeze-thaw cycles
The QTP is the world's youngest and highest region, and is referred to as the "third pole" (Qiu, 2008).The active layer of the soil experiences a freeze-thaw regime because of the bidirectional freezing process in the permafrost regions (Zhaoet al., 2000). Our study revealed that frozen days significantly increased and freeze-thaw days decreased, with increasing soil depth in the 0-20 cm layer during the annual cycle. The variation dynamics were consistent with the results of Yanget al. (2007) and Liuet al.(2012c).
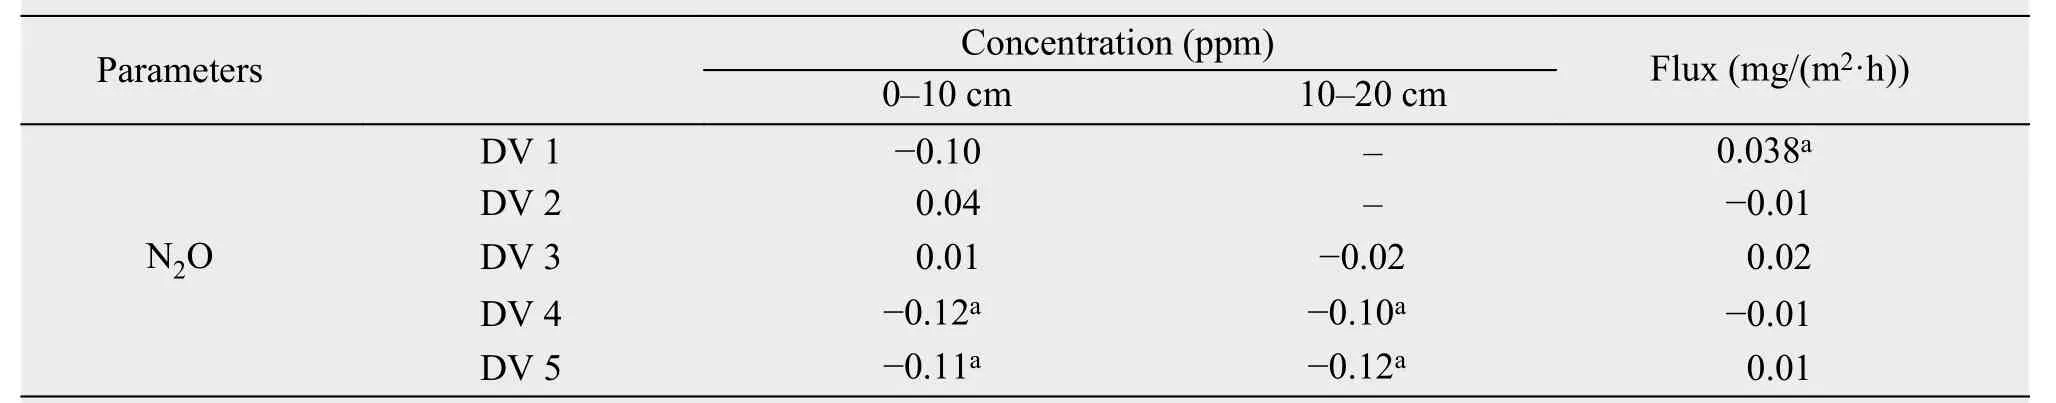
Table 4 Variations in soil N2O concentration and flux during the different freeze-thaw phases
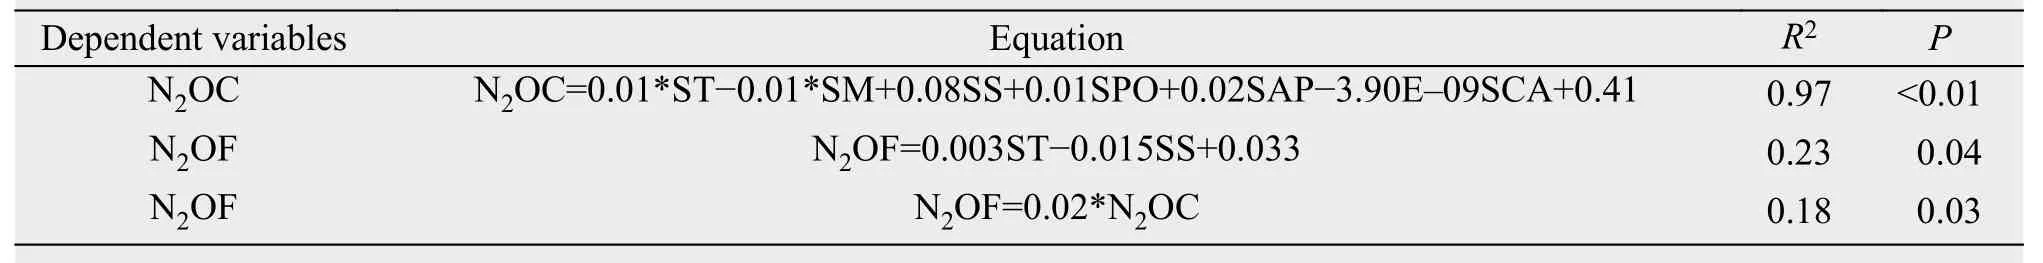
Table 5 Linear regression equations for the relationships between soil N2O and other environmental parameters of soil at the depth of 0-20 cm
It is well-known that FTCs have a dramatic influence on the soil ecosystem. In recent years, the effect of FTCs on the soil environment has become a hot topic internationally; and its importance in high-cold regions, especially at high latitudes and high altitudes,is increasingly recognized. Fluctuations in ST associated with freezing and thawing lead to changes in soil thermal conductivity and exchanges of energy/water between the land surface and the atmosphere, associated with the movement and phase transition of soil moisture (Yanget al., 2007, 2010). The results of our study showed that variations in ST and SM were sig-nificantly changed after freeze-thaw periods (Table 2).Therefore, FTCs led to significant changes in water-heat conditions in the active layer of the soil.
Previous studies have reported that FTCs cause strong aggregation of the SS near the surface and increase soluble substances in the soil solution, leading to soil salinization and loss of organic materials(Lipsonet al., 1999; Callesenet al., 2007; Wanget al., 2009). In addition, due to FTCs, soil-enzyme activity is enhanced (Wei, 2004); and quantities of soil microorganisms and SMBC decrease, while SMBN significantly increases (Lipson and Schmidt,2004; Wei, 2004). Our results revealed strong soil salinization after SFTCs during progressive freezing and the annual freeze-thaw cycle. Furthermore, soilenzyme activities and SMBN increased; but SMBC decreased after the FTCs during an annual cycle,which is consistent with previous studies (Groganet al., 2004; Callesenet al., 2007; Baumannet al.,2009). However, soil organic material (SOC and TN)and quantities of soil microorganisms (SCB, SCF, and SCA) exhibited an increasing trend (Table 3).
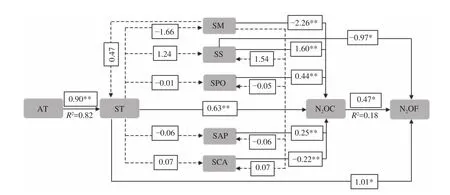
Figure 5 Representation of the path analysis for soil N2O concentration (N2OC) and flux (N2OF). Standardized coefficients are shown on each path. The direct-path coefficients are indicated on each solid path, and the indirect-path coefficients are indicated on each dashed path, *: correlation significant at the 0.05 level (2-tailed), **; correlation significant at the 0.01 level (2-tailed)

Table 6 Direct- and indirect-path coefficients from the path analysis
4.2 Effects of freeze-thaw cycles on soil N2O concentration and flux
Previous studies have shown that FTCs have significant effects on soil N2O flux (Teepeet al., 2001)and N2O concentration (Burton and Beauchamp,1994). In our study, soil N2O flux decreased after DFTC1 and soil N2O concentration in both layers increased during the SFTC4 and SFTC5 phases(Table 4), indicating the strong effects of FTCs on soil N2O concentration and flux. The primary factors that strongly influenced FTCs were soil temperature(ST) and soil moisture (SM) (Yanget al., 2003), thus we can predict that ST and SM had significant direct effects on soil N2O concentration and flux (Figure 3),which is consistent with previous studies (Du, 2006;Baumannet al., 2009). However, we found that SM had a greater direct effect on soil N2O concentration than other factors. This finding might have been attributed to the amount of fluid, which is largely determined by SM flowing through the nitrification and denitrification "pipes", corresponding to the rates of NH4+oxidation by nitrifying bacteria and the rate of NO3-reduction by denitrifying bacteria (Neillet al.,2005). In addition, a negative correlation was found between soil N2O concentration and SM (r= -0.29,P>0.05), in contrast to previous findings (Koponen and Martikainen, 2004; Wanget al., 2005). There are two possible reasons: (1) nitrification is a major source of N2O production (Duet al., 2011), but high SM reduces soil aeration and restricts nitrification, thus reducing soil N2O concentration; and (2) N2O dissolves readily in water, which happens when SM is high(Davidson and Swank, 1990). The difference in soilprofile N2O concentration between 0-10 cm and 10-20 cm has same negative correlation between soil N2O concentration and SM in SFTCs. During the SFTC3 phrase, SM increased more slowly at 0-10 cm than 10-20 cm, and the 0-10 cm layer showed higher soil N2O concentration; during the SFTC4 phrase, SM decreased more slowly at 0-10 cm than 10-20 cm, the 0-10 cm layer showed lower N2O concentration.
FTCs can have substantial effects on quantities and activities of soil microorganisms (QASM)(Larsenet al., 2002), and this consequently affects soil N2O concentration and flux, too. As FTCs were driven by the ST and SM, the effects of QASM (including SPO, SAP, and SCA) on the soil N2O concentration and flux could be associated with the soil water-heat conditions. The indirect-path coefficients of SPO and SAP via SM (0.28 and 0.57), and SCA(-0.21) via ST were close to their direct-path coefficients (0.44, 0.25, and -0.22), indicating QASM's indirect effects on soil N2O concentration via SM and ST. It has been confirmed that SAP represents important soil microbial enzymes and could improve nitrogen-use efficiency to decrease the emissions of soil N2O (Liet al., 2007). In contrast to previous studies(Shi and Huang, 1999), our results showed a positive link between SAP and soil N2O flux, which might be because low ST prevented improved nitrogen-use efficiency under relative high SAP. SCA also played an important role in the formation of soil humic acid (Quet al., 2010), and some representative SCA strains exhibited a high rate of denitrification (Geet al., 2004).In addition, our results showed that soil N2O flux was obviously related to soil N2O concentration (P<0.05),which could explain 18% of the variation in N2O flux,corresponding to previous reports that showed the equilibrium N2O concentration was proportional to the annual N2O flux when the lifetime of N2O was constant (Flückigeret al., 1999).
Significantly positive correlations between soil N2O concentration and SPO suggested that the direct effects of ST, SM, SPO, and SAP, as well as SCA, on soil N2O concentration were greater than their indirect effects but also indicated that the direct and indirect effects of ST, SM, and SS on N2O concentration were more important than those of SPO, SAP, and SCA. Also, the indirect effects of SPO (0.28) via SM,and SAP and SCA (0.15, 0.21) via ST were close to their direct effects (0.44, 0.25, and 0.22) on soil N2O concentration (Table 6).
5 Conclusions
In this study, the influences of freeze-thaw cycles on emission of soil N2O from soil were examined in the permafrost zones of the upper reach of the Shule River, QTP. The results showed that FTCs had profound influences on soil N2O concentration and flux via affecting physical, chemical, and biological properties of the soil. N2O is a major greenhouse gas in soil respiration. The emission of N2O from soils during freezing-thawing periods accounts for most of the total annual of flux. The findings in our study could have important implications for the current global climate change. Global climate change has increasingly altered the terrestrial ecosystems; and the permafrost in the QTP, which is especially sensitive to this change, is critical for the health of the alpine ecosystem. Our study revealed that global warming-induced change in FTCs in the QTP would have substantial effects on the emission of greenhouse gases such as N2O and CO2, by affecting soil characteristics; these findings may indicate the positive greenhouse-gas emission response of alpine meadows in permafrost regions to the climate warming. Thus,there is an urgent need to conduct more research about the effect of FTCs on the greenhouse-gas emission.
This work was supported by the National Science Foundation of China (41690142), the Key Project of Chinese Academy of Sciences (KJZD-EW-G03-04),the National Natural Science Foundation of China(41171054); and the National Science & Technology Pillar Program (2014BAC05B02).
Baumann F, He JS, Schmidt K,et al., 2009. Pedogenesis, permafrost,and soil moisture as controlling factors for soil nitrogen and carbon contents across the Tibetan Plateau. Global Change Biology,15(12): 3001-3017. DOI: 10.1111/j.1365-2486.2009.01953.x.
Burton DL, Beauchamp EG, 1994. Profile nitrous oxide and carbon dioxide concentrations in a soil subject to freezing. Soil Science Society of America Journal, 58(1): 115-122. DOI:10.2136/sssaj1994.03615995005800010016x.
Callesen I, Borken W, Kalbitz K,et al., 2007. Long-term development of nitrogen fluxes in a coniferous ecosystem: Does soil freezing trigger nitrate leaching? Journal of Plant Nutrition and Soil Science, 170(2): 189-196. DOI: 10.1002/jpln.200622034.
Chen SY, Liu WJ, Qin X,et al., 2012. Response characteristics of vegetation and soil environment to permafrost degradation in the upstream regions of the Shule River Basin. Environmental Research Letters, 7(4): 045406. DOI: 10.1088/1748-9326/7/4/045406.
Chen SY, Liu WJ, Zhao Q,et al., 2016. Response of freeze-thaw processes to experimental warming in the permafrost regions of the central Qinghai-Tibet Plateau. The Cryosphere Discussions. DOI:10.5194/tc-2016-80. (in Press)
Christiansen HH, Etzelmüller B, Isaksen K,et al., 2010. The thermal state of permafrost in the nordic area during the international polar year 2007-2009. Permafrost and Periglacial Processes, 21(2):156-181. DOI: 10.1002/ppp.687.
Crutzen PJ, 1981. Atmospheric chemical processes of the oxides of nitrogen, including nitrous oxide. In: Delwiche CC (ed.). Denitrification, Nitrification and Atmospheric Nitrous Oxide. Chichester, UK:John Wiley and Sons, pp. 17-44.
Davidson EA, Swank WT, 1990. Nitrous oxide dissolved in soil solution: an insignificant pathway of nitrogen loss from a southeastern hardwood forest. Water Resources Research, 26(7): 1687-1690.DOI: 10.1029/WR026i007p01687.
Ding LL, Long RJ, Qi B,et al., 2005. Soil microbial carbon and nitrogen contents of different kinds of alpine grassland in the Eastern Qilian mountains. Journal of Gansu Agricultural University, 40(5):639-645. DOI: 10.3969/j.issn.1003-4315.2005.05.014.
Du R, 2006. Effects of soil moisture and temperature on N2O production rate of meadow grassland soil. Chinese Journal of Applied Ecology, 17(11): 2170-2174.
Du YG, Cui YG, Xu XL,et al., 2008. Nitrous oxide emissions from two alpine meadows in the Qinghai-Tibetan Plateau. Plant and Soil,311(1-2): 245-254. DOI: 10.1007/s11104-008-9727-9.
Du YG, Cui XY, Cao GM,et al., 2011. Simulating N2O emission from Kobresia humilis Serg. Alpine meadow on Tibetan Plateau with the DNDC model. Polish Journal of Ecology, 59(3): 443-453.
Flückiger J, D?llenbach A, Blunier T,et al., 1999. Variations in atmospheric N2O concentration during abrupt climatic changes. Science,285(5425): 227-230. DOI: 10.1126/science.285.5425.227.
Ge C, Shi ZN, Yan ZM,et al., 2004. Participant possibility of actinomycetes in soil denitrification. Acta Pedologica Sinica, 41(1):108-112. DOI: 10.3321/j.issn:0564-3929.2004.01.018.
Grogan P, Michelsen A, Ambus P,et al., 2004. Freeze-thaw regime effects on carbon and nitrogen dynamics in sub-arctic heath tundra mesocosms. Soil Biology and Biochemistry, 36(4): 641-654. DOI:10.1016/j.soilbio.2003.12.007.
Guan SY, Zhang D, Zhang Z, 1986. Soil Enzyme and Its Research Methods. Beijing: Agricultural Press, pp. 274-297.
Guglielmin M, Dramis F, 1999. Permafrost as a climatic indicator in northern Victoria Land, Antarctica. Annals of Glaciology, 29:131-135. DOI: 10.3189/172756499781821111.
Holst J, Liu C, Yao Z,et al., 2008. Fluxes of nitrous oxide, methane and carbon dioxide during freezing-thawing cycles in an Inner Mongolian steppe. Plant and Soil, 308(1-2): 105-117. DOI:10.1007/s11104-008-9610-8.
IPCC, 2013. Climate Change 2013: The Physical Science Basis. Working Group I Contribution to the Fifth Assessment Report of the Intergovernmental Panel on Climate Change. Cambridge, United Kingdom and New York: Cambridge University Press, pp. 1535.
Isaksen K, Sollid JL, Holmlund P,et al., 2007. Recent warming of mountain permafrost in Svalbard and Scandinavia. Journal of Geophysical Research: Earth Surface, 112(F2): F02S04. DOI:10.1029/2006JF000522.
ISSCAS (Institute of Soil Science, Chinese Academy of Sciences),1978. Physical and Chemical Analysis Methods of Soils. Shanghai:Shanghai Scientific & Technical Publishers, pp. 7-59.
Koponen HT, Martikainen PJ, 2004. Soil water content and freezing temperature affect freeze-thaw related N2O production in organic soil. Nutrient Cycling in Agroecosystems, 69(3): 213-219. DOI:10.1023/B:FRES.0000035172.37839.24.
Koponen HT, Jaakkola T, Kein?nen-Toivola MM,et al., 2006. Microbial communities, biomass, and activities in soils as affected by freeze thaw cycles. Soil Biology and Biochemistry, 38(7):1861-1871. DOI: 10.1016/j.soilbio.2005.12.010.
Kurganova IN, Lopes De Gerenyu VO, 2010. Effect of the temperature and moisture on the N2O emission from some arable soils.Eurasian Soil Science, 43(8): 919-928. DOI: 10.1134/S 1064229310080090.
Larsen KS, Jonasson S, Michelsen A, 2002. Repeated freeze-thaw cycles and their effects on biological processes in two arctic ecosystem types. Applied Soil Ecology, 21(3): 187-195. DOI:10.1016/S0929-1393(02)00093-8.
Li CS, Frolking S, Frolking TA, 1992. A model of nitrous oxide evolution from soil driven by rainfall events: 1. Model structure and sensitivity. Journal of Geophysical Research: Atmospheres,97(D9): 9759-9776. DOI: 10.1029/92JD00509.
Li CS, Mosier A, Wassmann R,et al., 2004. Modeling greenhouse gas emissions from rice-based production systems: sensitivity and upscaling. Global Biogeochemical Cycles, 18(1): GB1043. DOI:10.1029/2003GB002045.
Li XX, Bai HY, Ding Q,et al., 2007. Soil physical and chemical properties, phosphatase activity, and N2O emission in winter wheat field on Loess Plateau. Chinese Journal of Ecology, 26(8):1187-1192. DOI: 10.13292/j.1000-4890.2007.0225.
Lipson DA, Schmidt SK, Monson RK, 1999. Links between microbial population dynamics and nitrogen availability in an alpine ecosystem. Ecology, 80(5): 1623-1631. DOI: 10.1890/0012-9658(1999)080[1623:LBMPDA]2.0.CO;2.
Lipson DA, Schmidt SK, 2004. Seasonal changes in an alpine soil bacterial community in the Colorado Rocky Mountains. Applied and Environmental Microbiology, 70(5): 2867-2879. DOI:10.1128/AEM.70.5.2867-2879.2004.
Liu GS, Wang GX, Bai W,et al., 2012c. Response of heat condition within active layer in swamp meadow on the Tibetan Plateau to Warming. Journal of Glaciology and Geocryology, 34(3): 555-562.
Liu WJ, Chen SY, Qin X,et al., 2012a. Storage, patterns, and control of soil organic carbon and nitrogen in the northeastern margin of the Qinghai-Tibetan Plateau. Environmental Research Letters, 7(3):035401. DOI: 10.1088/1748-9326/7/3/035401.
Liu WJ, Chen SY, Zhao Q,et al., 2012b. Main greenhouse gases emissions during plant growing season in permafrost region of the upper reaches of Shule River, Qilianshan. Journal of Glaciology and Geocryology, 34(5): 1149-1156.
Nan ZT, Li SX, Cheng GD, 2005. Prediction of permafrost distribution on the Qinghai-Tibet Plateau in the next 50 and 100 years. Science in China Series D: Earth Sciences, 48(6): 797-804. DOI:10.1360/03yd0258.
Nelson DW, Sommers LE, 1982. Total carbon, organic carbon, and organic matter. In: Page AL, Miller RH, Keeney DR (eds.). Methods of Soil Analysis. Part 2. Chemical and Microbiological Properties.Agronomy Monograph 9. 2nd ed. Madison, WI, USA: Agronomy Society of America and Soil Science Society of America, pp.539-579.
Neill M, 2005. A method to determine which nutrient is limiting for plant growth in estuarine waters—at any salinity. Marine Pollution Bulletin, 50(9): 945-955. DOI: 10.1016/j.marpolbul.2005.04.002.
Osterkamp TE, 2005. The recent warming of permafrost in Alaska.Global and Planetary Change, 49(3-4): 187-202. DOI:10.1016/j.gloplacha.2005.09.001.
Overduin PP, Kane DL, 2006. Frost boils and soil ice content: field observations. Permafrost and Periglacial Processes, 17(4): 291-307.DOI: 10.1002/ppp.567.
Qiu J, 2008. China: the third pole. Nature, 454(7203): 393-396. DOI:10.1038/454393a.
Qu R, Li JS, Xiao NW,et al., 2010. Study on the influence of soil microbial on soil respiration at various vegetations. Acta Agriculturae Boreali-Sinica, 25(3): 196-199. DOI: 10.7668/hbnxb.2010.03.041.
Romanovsky VE, Drozdov DS, Oberman NG,et al., 2010. Thermal state of permafrost in Russia. Permafrost and Periglacial Processes,21(2): 136-155. DOI: 10.1002/ppp.683.
Schimel JP, Clein JS, 1996. Microbial response to freeze-thaw cycles in tundra and taiga soils. Soil Biology and Biochemistry, 28(8):1061-1066. DOI: 10.1016/0038-0717(96)00083-1.
Shi Y, Huang GH, 1999. Relationship between soil denitrifying enzyme activities and N2O emission. Chinese Journal of Applied Ecology, 10(3): 329-331. DOI: 10.13287/j.1001-9332.1999.0084.
Sjursen H, Michelsen A, Holmstrup M, 2005. Effects of freeze-thaw cycles on microarthropods and nutrient availability in a sub-Arctic soil. Applied Soil Ecology, 28(1): 79-93. DOI: 10.1016/j.apsoil.2004.06.003.
Smith SL, Burgess MM, Riseborough D,et al., 2005. Recent trends from Canadian permafrost thermal monitoring network sites. Permafrost and Periglacial Processes, 16(1): 19-30. DOI:10.1002/ppp.511.
Teepe R, Brumme R, Beese F, 2001. Nitrous oxide emissions from soil during freezing and thawing periods. Soil Biology and Biochemistry, 33(9): 1269-1275. DOI: 10.1016/S0038-0717(01)00084-0.
Wang WZ, Wu YR, Jin R,et al., 2009. Analysis of the variation characteristics of soil moisture and soil salinity—Take Arou Pasture in the Upper Reaches of Heihe River for an example. Journal of Glaciology and Geocryology, 31(2): 268-274.
Wang YF, Ma XZ, Ji BM,et al., 2003. Diurnal and seasonal variation in methane and nitrous oxide fluxes in meadow steppe of Inner Mongolia. Acta Phytoecologica Sinica, 27(6): 792-796. DOI:10.17521/cjpe.2003.0113.
Wang YS, Xue M, Zheng XH,et al., 2005. Effects of environmental factors on N2O emission from and CH4uptake by the typical grasslands in the Inner Mongolia. Chemosphere, 58(2): 205-215. DOI:10.1016/j.chemosphere.2004.04.043.
Wei LH, 2004. The effect of alternative freezing and thawing on soil organic matter and nitrogen potassium nutrition of black soil.Changchun: Jilin Agricultural University.
Wrage N, Lauf J, Del Prado A,et al., 2004. Distinguishing sources of N2O in European grasslands by stable isotope analysis. Rapid Communications in Mass Spectrometry, 18(11): 1201-1207. DOI:10.1002/rcm.1461.
Wu QB, Zhang TJ, Liu Y, 2012. Thermal state of the active layer and permafrost along the Qinghai-Xizang (Tibet) Railway from 2006 to 2010. The Cryosphere, 6(3): 607-612. DOI: 10.5194/tc-6-607-2012.
Wu QB, Zhang TJ, 2010. Changes in active layer thickness over the Qinghai-Tibetan Plateau from 1995 to 2007. Journal of Geophysical Research: Atmospheres, 115(D9): D09107. DOI:10.1029/2009JD012974.
Wu X, Shen ZY, 2010. Effects of freezing-thawing cycle on greenhouse gases production and emission from soil: a review. Chinese Journal of Ecology, 29(7): 1432-1439. DOI: 10.13292/j.1000-4890.2010.0213.
Ri X, Prentice IC, 2008. Terrestrial nitrogen cycle simulation with a dynamic global vegetation model. Global Change Biology, 14(8):1745-1764. DOI: 10.1111/j.1365-2486.2008.01625.x.
Yang HL, Qin JH, Sun H, 2010. A review: response of soil CO2and N2O emissions to freeze-thaw pattern change. Soil, 42(4):519-525. DOI: 10.13758/j.cnki.tr.2010.04.006.
Yang MX, Yao TD, Gou XH,et al., 2003. The soil moisture distribution, thawing-freezing processes and their effects on the seasonal transition on the Qinghai-Xizang (Tibetan) plateau. Journal of Asian Earth Sciences, 21(5): 457-465. DOI: 10.1016/S1367-9120(02)00069-X.
Yang MX, Yao TD, Gou XH,et al., 2007. Diurnal freeze/thaw cycles of the ground surface on the Tibetan Plateau. Chinese Science Bulletin, 52(1): 136-139. DOI: 10.1007/s11434-007-0004-8.
Zhao L, Cheng GD, Li SX,et al., 2000. Thawing and freezing processes of active layer in Wudaoliang region of Tibetan Plateau.Chinese Science Bulletin, 45(23): 2181-2187. DOI:10.1007/BF02886326.
Zhou YW, Guo DX, Qiu GQ,et al., 2000. Geocryology in China.Beijing: Science Press.
 Sciences in Cold and Arid Regions2018年1期
- Sciences in Cold and Arid Regions的其它文章
- An improvement of soil temperature simulations on the Tibetan Plateau
- Comparative study of probable maximum precipitation and isohyetal maps for mountainous regions, Pakistan
- Applicability of an ultra-long-range terrestrial laser scanner to monitor the mass balance of Muz Taw Glacier,Sawir Mountains, China
- High-resolution mass spectrometric characterization of dissolved organic matter from warm and cold periods in the NEEM ice core
- Precipitation isotopes in the Tianshan Mountains as a key to water cycle in arid central Asia
- From highly polluted inland city of China to "Lanzhou Blue":The air-pollution characteristics